POLITECNICO DI MILANO
Scuola di Ingegneria dell’Informazione
POLO TERRITORIALE DI COMO
Master of Science in Computer Engineering
BRIDGeViz: A Data Visualization Web Application
for Monitoring Elderly Behaviour in AAL Systems
Supervisor: Prof. Sara Comai
Assistant Supervisor: Eng. Fabio Veronese
Master Graduation Thesis by: Chandnee Gopaul
Student ID: 817642
Abstract
The average age of the population is growing enormously and ensuring the elderly well-being becomes challenging due to several aspects: fragile people prefer staying in their residences even if their health is not at its best, they remain in a constant state of anxiety, but they still choose to execute their Activities of Daily Living (ADLs) on their own. In order to provide security, aid and wellness to older people, it is necessary to build a system able to monitor their behaviour; such a structure, denominated AAL system, can reassure family members, as it is capable of recognizing a state of illness in real time.
The BRIDGe project arises as a powerful AAL system including different sensors that continuously monitor the inhabitant’s behaviour and produce broad quantity of textual data. In such a context, this thesis work provides a solution to convey perceptible and simplified information in a visual form: the BRIDGeViz web application, aiming the monitoring of elderly activities in AAL systems. Data Visualization is the discipline that manages the representation of data in a visual form.
The web application enriches BRIDGe by visualizing data through appropriate representations able to stimulate the human visual perception, in order to gain knowledge from the represented data. In particular, the implemented plots carry information related to the energy consumption, at different granularities, supervision of the domestic appliances consumptions, time spent in each room of the smart home, both in short and long-term periods, and monitoring of the sensors states.
Sommario
L’età media della popolazione sta crescendo enormemente e diventa difficile assicurare il benessere degli anziani a causa di diversi aspetti: le persone fragili preferiscono restare nelle loro abitazioni nonostante la loro salute non sia ottimale, rimangono in uno stato di ansia costante, ma scelgono di eseguire le attività quotidiane per conto proprio. Al fine di fornire sicurezza, assistenza e benessere alle persone anziane, è necessario costruire un sistema in grado di monitorare il loro comportamento; tale struttura, denominata sistema AAL, può rassicurare i membri della famiglia, in quanto è in grado di riconoscere uno stato di malattia in tempo reale.
Il progetto BRIDGe si presenta come un potente sistema AAL che include diversi sensori atti a monitorare l’andamento dell’abitante, producendo una grande quantità di dati testuali. In un tale contesto, questo elaborato fornisce una soluzione per trasmettere informazioni percettibili e semplificate in forma visiva: l’applicazione web BRIDGeViz, che mira al controllo delle attività degli anziani all’interno di sistemi AAL. La visualizzazione di dati è la disciplina che gestisce la rappresentazione dei dati in forma visiva.
L’applicazione web arricchisce BRIDGe visualizzando i dati attraverso rappresentazioni appropriate in grado di stimolare la percezione visiva umana, al fine di acquisire conoscenza dai dati rappresentati. In particolare, i grafici implementati riportano informazioni relative al consumo di energia, in diverse granularità, alla supervisione dei consumi degli elettrodomestici, al tempo trascorso in ogni stanza della smart home, sia nei periodi a breve che a lungo termine, e al monitoraggio degli stati dei sensori.
Acknowledgements
In the first place, I would like to thank the Supreme Lords Sri Sri Radha Krishna for their mercy, and my spiritual master for his blessings and care.
I am most grateful to my father, Venu Gopal, and mother, Kanak Manjari, for having always believed in me, given me the best I could ask for, loved me unconditionally and supported me in my choices; without them I would not be the person I am today. I am very thankful to my husband, Ram Krishna, whose love and care allowed me to grow as a person. A special consideration to my sister, Parvati, who has been my mentor and inspiration throughout my life, and to my uncle, Sri Hari, for his constant love and encouragement since ever. Thanks to the rest of my wonderful family, for having always supported me. Big thanks to my friends and well-wishers, who shared important and unforgettable moments of my life. An exclusive appreciation to the friends who shared my journey in Politecnico, both in Milano and Como; thanks for the thousand laughs and a remarkable experience that I will preserve for life.
I express my sincere gratitude to my supervisor, Professor Sara Comai, for her precious advices, contribute and interest in reading and revising this thesis work, and to my assistant supervisor, Fabio Veronese, who has been there to listen, assist and encourage me during the development of this work. I am very much obliged to all the teachers that contributed to my education and training career, from primary school to university.
With love, Chandnee
Contents
Abstract ... iii
Sommario ... v
Acknowledgements ... vii
List of Figures ... xiii
List of Tables ... xv
1 Introduction ... 1
1.1 The BRIDGe Project ... 4
1.2 Problem Statement ... 5 1.3 Data Visualization ... 7 1.4 Thesis contribution ... 8 1.5 Thesis structure ... 9 2 State of Art ... 11 2.1 Smart Home ... 12
2.2 The BRIDGe Architecture ... 13
2.2.1 Sensors in BRIDGe ... 15
2.3 AAL systems Smart Home case studies ... 15
2.4 Graphical representation of data ... 17
2.4.1 Data ... 18
2.4.2 Graphs ... 18
2.4.3 Dashboard ... 21
2.4.4 Data Visualization Techniques ... 23
x
3 Methodology ... 37
3.1 Human Perception and Cognition ... 38
3.2 Visualization Process ... 41
3.3 Applied Procedure ... 45
3.3.1 Guidelines ... 47
4 Design and Implementation... 55
4.1 Analysis ... 56
4.1.1 Objectives ... 56
4.1.2 Target users and constraints... 56
4.1.3 Case study ... 58
4.1.4 Requirement Analysis ... 61
4.1.5 UX Design ... 64
4.2 Identification of graphs ... 65
4.2.1. Radial Progress ... 67
4.2.2. Double Bar Chart ... 67
4.2.3. Donut Chart ... 68 4.2.4. Scatter Plot ... 69 4.2.5. Fill Gauge ... 70 4.2.6. Line chart ... 71 4.3 Other features ... 72 4.3.1. Live ... 72 4.3.2. Top menu ... 73 4.4 Implementation details ... 74 4.4.1. Technologies ... 74 4.4.2. Main challenges ... 75
5 Conclusion and Future work ... 79
5.1. Conclusion ... 80
xi Appendix A ... 83 References ... 87
List of Figures
Figure 1.1 – Numbers tell a story: data storytelling is a structured approach for communicating data insights, involving a combination of three key elements –
data, visuals and narrative. ... 1
Figure 1.2 – Maslow’s hierarchy of needs ... 2
Figure 2.13– Smart Home ... 12
Figure 2.24– The BRIDGe Architecture ... 13
Figure 2.35– William Playfair’s Bar Chart: Exports and imports of Scotland ... 19
Figure 2.46– Variety of Data Visualization techniques ... 23
Figure 2.57– Information visualization reference model and sources of dynamics at each stage ... 26
Figure 2.68– CASAS: Activity trends for a smart-home resident ... 27
Figure 2.79- PyViz: CASAS activity visualizer (on the left); PyViz: graphical numeric data (on the right)... 28
Figure 2.810– CASASviz: Main Visualizer (a) and Mobility Heat Map (b) ... 29
Figure 2.911– CASASviz: Activity Graph... 30
Figure 2.1012– CASASviz: Power Usage Visualizer ... 30
Figure 2.1113– Ubicare visualization of activity monitoring: toilet flush activation occurrences per day. ... 31
Figure 2.1214 – Home Center 2: Fibaro system web dashboard ... 33
Figure 2.1315– PiDome: mobile application dashboard ... 34
Figure 2.1416– PiDome: a platform for Home Automation (devices list) ... 35
xiv
Figure 3.218– Representation of the visual processing system ... 40
Figure 3.319– Typical visualization process ... 42
Figure 3.420– Information-assisted visualization process ... 42
Figure 3.521– Knowledge-assisted visualization with acquired knowledge ... 43
Figure 3.622– Knowledge-assisted visualization with simulated cognitive processing 44 Figure 3.723– Several different palettes and their relationship to the hue wheel ... 52
Figure 4.124– Pilot1SA house map showing sensors ... 59
Figure 4.225– Use case diagram ... 63
Figure 4.326– Radial Progress: current temperature ... 67
Figure 4.427– Double Bar Chart: energy consumption in the last six weeks ... 68
Figure 4.528– Donut Chart: appliances consumption ... 69
Figure 4.629– Scatter Plot: location in the last week ... 70
Figure 4.730– Fill Gauge: energy consumption in this week ... 70
Figure 4.831– Multi-series interactive line chart: energy consumptions ... 71
Figure 4.932– Live page: current situation in the house ... 72
Figure 4.1033– Currently active (left) and broken lamps (right) ... 73
Figure 4.1134– Top bar: home, notifications, batteries and user profile ... 73
List of Tables
Table 1.1 – Ackoff’s definition of data, information and knowledge ... 8 Table 3.12– Examples of information used in visualization ... 43
Chapter 1
I
ntroduction
“Numbers have an important story to tell. They rely on you to give them a clear and convincing voice.”
Stephen Few
Figure 1.1 – Numbers tell a story: data storytelling is a structured
approach for communicating data insights, involving a combination of three key elements – data, visuals and narrative.
2 Chapter 1. Introduction Presently, we can experience a considerable expansion of the population in Italy. The Istat has gathered, inside its statistical yearbook, the most recent statistics about the country. As a result, it emerges that Italy has a continuously growing number of elderly; it is esteemed that within 2030, the number of older people could reach the 26.5% of the population. In the last 20 years, the rate of people over 80 has increased by 150%, and it will rise progressively [1].
The old age defines a new phase of a person’s life, as he starts facing physical, psychological and social changes. Most elderly remain in a constant state of anxiety, because they fear separation from their beloved ones, they fear not being able to perform activities as they did before, and they fear death. These transformations affect the emotional self and bring the person to a state of fragility, in which he finds himself unable to fulfill his basic needs.
Figure 1.2 – Maslow’s hierarchy of needs
In 1970, the American psychologist Abraham Maslow designed a classification of humans’ needs and life desires [2], shown in Fig. 1.2. In this motivational theory in psychology, he explains a five-tier model of human needs, often depicted as hierarchical levels within a pyramid. Maslow stated
1.1 The BRIDGe Project 3 that people are motivated to achieve certain needs and that some needs take precedence over others. Our most basic need is for physical survival, and this will be the first thing that motivates our behaviour. Once that level is fulfilled, the next level up is what motivates us, and so on. Every person is capable and has the desire to move up the hierarchy toward a level of self-actualization. Unfortunately, this progress often breaks up by a failure to meet lower level needs. Maslow noted that only one in a hundred people becomes fully self-actualized because our society rewards motivation primarily based on esteem, love and other social needs.
Fragile older people often find difficulties in performing Activities of Daily Living (ADLs) in a proper way. ADLs are the basic need actions that a person executes every day, such as bathing, dressing, grooming, working, doing housework and leisure. For example, an elderly might forget the procedures, feel insecure about his abilities to perform the ADLs or fail to complete important tasks.
A person’s health can influence his behaviour, relationships with others and quality of life. Older adults and people with disabilities prefer remaining in their dwellings even when their health situation worsens and the house cannot sustain their safety. However, although the risk of disease rises during the ageing process, it is possible to avoid health problems by ensuring the fragile people to live as healthy as possible for as long as possible. In order to achieve this objective, it is necessary to keep an up-to-date system that provides significant aid by collecting information detected through monitoring of elderly health conditions and other aspects of their life. The system provides the inhabitant’s security, independence and communication with caregivers, who can supervise and intervene in case of emergency.
Technological progress have allowed studies to move in the direction of
Smart Home and Ambient Assisted Living (AAL) [3] systems with the aim of improving the life experience in the person’s dwelling, guaranteeing a sustained
4 Chapter 1. Introduction social independence. Such structures allow tracking the state of health of the people living alone, so that it is possible to recognize the case of illness in real time, allow domestic support and reassure family members. AAL main goals include:
To extend the time people can live in their preferred environment by increasing their autonomy, self-confidence and mobility;
To support the preservation of health and functional capabilities of the older individuals, and to promote a better and healthier lifestyle for individuals at risk;
To enhance security, to prevent social isolation and to support the preservation of the multifunctional network around the person;
To support caregivers, families and care organizations;
To increase the efficiency and productivity of used resources in the ageing societies.
The BRIDGe project (Behaviour dRift compensation for autonomous and InDependent livinG) [4] is a powerful structure that implements an AAL system, in collaboration with the Assistive Technology Group (ATG) [5] of Politecnico di Milano, for the technological part, and with CRAiS (Resource Center for Autonomy and Social Inclusion) [6] regarding the social part.
1.1 The BRIDGe Project
Behaviour dRift compensation for autonomous and InDependent living
(BRIDGe) is an ambitious project being implemented by ATG. It is about developing an AAL system that connects, through a monitoring structure based on wireless sensors, a person living alone (IL – Independent Living) to the social environment (family, caregivers or organizations). The target users are elderly, people with physical or cognitive disabilities and those with pathologies that may compromise their autonomy or lifestyle; these people need supervision but
1.2 Problem Statement 5 still prefer to maintain their independence. BRIDGe proposes the installation of a system, inside the user’s dwelling, based on non-invasive and economic wireless sensors that allow continuous remote monitoring to verify daily behaviour of the person’s activities and evaluate health conditions. In this way, it becomes possible to intervene when abnormal behaviours or routine deviations occur.
The Assistive Technology Group (ATG) is a multi-disciplinary working group whose mission is to identify, forecast, implement and apply innovative methods and technologies for the development of sustainable solutions for disabled people, elderly, and people facing difficulties. The group aims at guaranteeing the recovery of functionality, social integration, equal opportunities, health, self-determination and quality of life, by also considering any significant aspect of digital inclusion.
The CRAiS – Resource Center for Autonomy and Social Inclusion – is a project that helps developing pathways of autonomy and participation for people in the condition of fragility and social vulnerability, and provides a support to their families and caregivers. For this purpose, CRAiS offers customized services and tools, managed by a multidisciplinary team with social, educational and technological skills.
1.2 Problem Statement
BRIDGe includes a system of different sensors, placed in an intelligent environment, that continuously monitor the inhabitant’s activities and behaviour; the amount of detected data is huge, and it becomes difficult to handle it. Moreover, it is very challenging for any user to comprehend such big amount of data presented in textual form. In the intent of optimizing the usability of BRIDGe, it is necessary to find suitable methodologies that would provide simplified clear information in visual form, in order to understand and
6 Chapter 1. Introduction analyse the person’s behaviour in a lighter way. Data Visualization is the discipline that allows the representation of data in a visual form.
Previous thesis works related to the BRIDGe project have provided the extraction of necessary and usable information from data detected by the sensors [58]. However, as mentioned before, raw data1 is not suitable for being
analysed by humans.
The necessities are, thus, the following:
To select meaningful visualization techniques, for providing perceptible knowledge to the user;
To build graphs based on the processed data;
To arrange those charts into a dashboard, for showing the final user a general situation of the fragile person, in terms of activities and important facts about his health conditions;
To provide a fully usable web application to let the user navigate, understand and measure the details of his behaviour during the arc of a day.
In our context, the range of end-users and their needs may vary from domain-specific experts (e.g., therapists) to caregivers (e.g., family) or the patient himself; accordingly, the visualizations should be adapted to the different users, so they need to be reliable and flexible. The choice of the correct visualization and its quality provides the key to a better comprehension of data, taking advantage of a more accurate analysis that influences the user’s decisions and performances.
Summing up, the aim of my thesis work is to take the processed data and make it available and comprehensible to the final users. For this purpose, it is
1 It is important to define the meaning of raw data in our context. Generally, raw data is a relative term,
because once raw has been ‘cleaned’ and processed by one team of researchers, another team may consider this processed data to be “raw data” for another stage of research. In this way, the relevant information detected and processed during previous works are raw data for my work.
1.3 Data Visualization 7 essential to understand if the final user, in charge of analysing and taking decision based on the results, would really be able to figure out the representations of data in a fast and efficient manner.
1.3 Data Visualization
The fusion of research areas such as Computer Science, Information Design
and Human Perception gives life to what is known today as Data Visualization.
Data Visualization is a modern equivalent of visual communication, i.e., the delivery of information through a graphical representation [7]. Its main goal is to use statistical graphs, plots and information graphics for communicating information, in the form of a quantitative message, in a clear and efficient way, so the data is more understandable, usable and accessible to common people. For this purpose, numerical data is represented using dots, lines or bars. There are two primary types of information displays: tables, generally used when users search for a specific measurement, and charts, or graphs, of various types that are used to show patterns or relationships in the data for one or more variables.
Data visualization has three key goals: providing a recording of information, communicating the information across an audience, and allowing information processing [31]. However, the extraction of information from data depends on the quality of information that is conveyed to the users, and on the way the human brain can extract this information and understand it. When referring to data visualization, three terms are commonly used: data,
information and knowledge. Table 1.1 shows the definition of each word, according to Ackoff’s point of view regarding perceptual and cognitive space [44].
8 Chapter 1. Introduction
Category Definition Data Symbols
Information data that are processed to be useful, providing answers to ‘who’, ‘what’, ‘where’ and ‘when’ questions
Knowledge application of data and information,
providing answers to ‘how’ questions
Table 1.1 – Ackoff’s definition of data, information and knowledge
The use of charts for visualizing large amounts of complex data is easier than the use of spreadsheets or reports, due to the way the human brain processes information. Data visualization is a fast and easy way to communicate concepts that can be grasped universally, and to experiment different scenarios by making minor adjustments.
Older adults may not be familiar with the detailed information generated by the technology and infrastructure that collect data and, often, this information requires clinical knowledge to be interpreted. Thus, appropriately designed data visualizations can bridge the gap between data and information. A well-designed visualization translates data from monitoring technologies to a comprehensible medium for elderly; in this way, it is possible to empower them within their personal care.
1.4 Thesis contribution
The main contributions of this thesis work can be summarized into three major points.
Firstly, I attentively reviewed the state of art for data and graphs, smart homes and AAL systems visualizations, along with data visualization techniques. Secondly, I analysed the human visual perception mechanism, and the way in which data visualization can take advantage from it; I also identified useful guidelines that helped me providing better visualizations.
1.5 Thesis structure 9 Finally, I designed and developed BRIDGeViz, a web application that helps monitoring elderly activities and behaviour in AAL systems; the application enriches the BRIDGe project by visualizing data, acquired through different sensors, using intuitive yet modern charts. BRIDGeViz is not a new name: a previous work on BRIDGe project describes the first version of the application [57]. The author presented a visualization framework composed of two visualizations: Layered Aggregated Radial Tree (LART), aiming pattern discovery and comparison, and Rich State Transition Graph (RSTG), describing transitions from one room to another; both illustrate data gathered from an AAL system, promoting data exploration and information seeking. In the current work, BRIDGeViz has been revised and extended to cover all the occurrences in BRIDGe.
1.5 Thesis structure
After having pictured the problem context, the next chapters will focus on the issues addressed during the realization of my thesis work. Chapter 2 focuses on presenting the status of BRIDGe project, along with related works in the fields of AAL systems, data visualization techniques and akin examples. Chapter 3 illustrates the most common visualization and information-seeking theories, together with the methodology applied in this work; relevant guidelines for designing visualizations are listed. Chapter 4 delineates the design choices and implementation techniques of BRIDGeViz application, while the conclusions and possible improvements of the system are pointed up in Chapter 5.
Chapter 2
S
tate of Art
“Graphical excellence is that which gives to the viewer the greatest number of ideas in the shortest time with the least ink in the smallest space.”
Edward R. Tufte
This chapter provides the background information needed to better understand the topics discussed in this work. The research of the papers and content aims at learning if this kind of problems has already been addressed, and, eventually, how they have been solved. In the beginning, we dwell on the architecture of BRIDGe, discussing the usage of sensors and similar smart home case studies. Later on, we depict a general image of the concepts of graph and dashboard. Finally, we report few relevant Data Visualization techniques, together with examples of real AAL systems smart home projects.
12 Chapter 2. State of Art
2.1 Smart Home
A Smart Home is, by definition, an intelligent environment that uses a home-automated system to enhance the comfort, convenience and safety of the people living inside it. The term ‘home-automated’ refers to the use of automation systems to monitor and remotely control devices installed in the house. The American Association of Housebuilders firstly used the appellation Smart House, also called Smart Home, in 1984, to define the ‘wiring’ homes, built by hobbyists in the early 1960s, provided with extended functionalities [9]. According to Harper, what makes a home ‘smart’ is the interactive technology that it contains; this technology provides an environment that is sensitive and responsive to the user’s presence. Regardless of the technology, Smart Homes present compelling chances to develop the way people live and work, and, at the same time, to reduce the energy and water wastage.
Figure 2.13– Smart Home
Inside an automated smart home, we can find common practices of monitoring lights, temperature, security cameras, opening and closing of doors and windows, and many other smart features, as depicted in Fig. 2.1. This thesis will refer to a system monitoring an elderly living alone, providing him a
2.2 The BRIDGe Architecture 13 certain level of autonomy, and ensuring his well-being. Many of the common uses explained above are implemented inside BRIDGe; however, the system does not provide any camera functionality, so to preserve the user’s privacy, as it will be explained in the next paragraphs.
In order to monitor a smart home in the best way, the user must be able to access the system through dedicated interfaces, such as remote controls, wall-mounted touch screens or advanced keyboards, as well as other tools for remote management, such as smartphones, tablets and computers. In fact, the aim of this work is providing a web-application interface for the remote monitoring of the smart home.
2.2 The BRIDGe Architecture
The infrastructure of BRIDGe is divided into two subsystems (see Fig. 2.2): a local one and a remote one. The former consists of home automation devices, sensors and a local server; it connects the autonomous components of the smart home, to make them exchange information and to provide tools for the monitoring of the whole house.
14 Chapter 2. State of Art The remote subsystem, instead, ensures long-term storage of data detected in the local subsystem, for later analyses over a long period. In addition, it ensures remote home monitoring for different kinds of users, and it provides relevant information to relatives and caregivers of the person living in the house. This subsystem is composed of three main layers: the User Authorization and Profiling, the User Interface and the Remote Service Provider. The latter contains a long-term data storage, containing data that is used for the visualization of aggregated information and for behavioural analysis. In order to identify potential behavioural drifts, the real-time data is compared against the historical recorded data.
BRIDGe provides four services:
Home Control: installed sensors produce information about the house, e.g., temperature, humidity, opening/closing doors, etc.; installed actuators change the status of devices in the house, e.g., switching on lights, rolling shutters, etc.;
Social Media Notification: BRIDGe uses Twitter as a messaging system to submit notifications or warnings according to the necessity,
Vocal Interaction: BRIDGe uses VCI (Vocal Command Interface) for allowing vocal commands from the user, e.g., ‘open the door’ or ‘switch off the light in the living room’;
Indoor Localization: provides the current position of a specific person inside the house, through LAURA [10], a Radio-Frequency (RF) based IHL (Indoor Human Localization) system, able to identify if the person is standing, walking, laying or falling. The position data produced is a set of coordinates on the map and a confidence range.
2.3 AAL systems Smart Home case studies 15
2.2.1 Sensors in BRIDGe
The developers of BRIDGe have followed some common constraints, for the selection of suitable sensors, shared among other researches in literature. As per the rules, we should consider the total cost of the applied sensors, along with the non-invasiveness type of the same. Therefore, cameras and microphones, as well as wearable devices, are excluded from the project, due to their intrusive nature.
Below there is a list of the sensors implemented in BRIDGe:
Consumption sensors (electricity, water and gas) keep track of the quantity consumed for each measure. Electrical power sensors can be inserted between the plug and the power outlet to detect when appliances are turned on, or to monitor the overall energy consumption. PIR (Passive Infrared Sensors) measure infrared (IR) light radiating from objects in their field of view. Their typical uses include detection of people in motion, without the use of any camera.
Ambient sensors are used to observe temperature, humidity, luminosity or smoke. These kinds of sensors tend to have a certain level of error in their readings, indeed it is difficult to accurately measure the temperature or humidity.
Distance sensors keep track of the person’s presence when he approaches the object.
Contact sensors measure the opening and closing movements of doors or furniture doors. When the two components get in touch, the sensor returns a signal.
2.3 AAL systems Smart Home case studies
Literature provides some projects, proposed during the last years, that are similar to BRIDGe.
16 Chapter 2. State of Art
ARAS
Activity Recognition with Ambient Sensing is a project for the automatic human ADLs (Activities of Daily Living) recognition, as described by Alemdar et al. [11]. The experiment consisted in two houses implementing 20 interaction-based binary sensors, communicating wirelessly using the ZigBee protocol, able to capture inhabitant’s actions and movements. As a result, dwellers recorded 27 different activities, generating as many labels referring to the ADLs.
CASAS
The Center for Advanced Studies in Adaptive Systems is a project developed at the Washington State University aiming Activity Recognition studies [12]. Two main goals of this project are the maximization of the user’s comfort (recognizing, discovering, tracking ADLs) and the minimization of the costs (maintenance and energy saving). A software machine learning algorithm identifies when a person performs an activity; activity recognition maps a sequence of sensor data to a corresponding activity label, in real time.
Soprano
Service-Oriented PRogrammable smArt eNvironments for Older europeans is a EU-funded project meant to develop an AAL platform to enhance fragile people’s life [13]. It uses pervasive technologies (e.g., sensors, actuators, smart interfaces) and artificial intelligence to create supportive home environments. It also provides additional safety and security, supporting independent living and social participation, improving the quality of life.
Casattenta
Aware and smart environments: The Casattenta project is a system composed of fixed and wearable sensor nodes, aiming a more interactive and safer environment, providing elderly living alone with adequate and non-intrusive monitoring [14]. The system is able to recognize emergencies and dangerous events by monitoring the house, through fixed smart sensors, and
2.4 Graphical representation of data 17 the person’s health status, through wearable ones. In addition, Casattenta favours the elderly’s communication with the family and caregivers.
GerHome
Multi-sensors Analysis for everyday Elderly Activity Monitoring is a project that aims at improving elderly life conditions and reducing the costs for long hospitalizations through a multi-sensors analysis that monitors elderly activities [15]. Three issues are considered: detecting dangerous events or situations (e.g., fall); assessing the person’s degree of fragility; identifying behaviour and usual activities of the person, taking care of any possible deviation. More precisely, it presents a video monitoring platform, composed of a network cameras and contact sensors.
Many of the mentioned projects are limited, not interoperable and tend to focus just on few technologies. Furthermore, some of them are not customizable, since they do not consider specific needs of the end user. On the other side, the architecture of BRIDGe is interchangeable and it can exploit different services conveniently combined together.
2.4 Graphical representation of data
A graphical representation is a visual display of data and statistical results. It is usually more compelling than presenting data in a tabular form, as it helps to quantify, sort and show information in a way that is understandable to a large variety of audience. When designed properly, graphical visualizations represent important resources that support data analysis and diffusion of information.
This section provides an overview of the basic concepts underlying the meaning of data visualization: the concepts of data and graph, describing some related principles from the literature.
18 Chapter 2. State of Art
2.4.1 Data
The concept of data represents a set of values of qualitative or quantitative variables, a simple illustration of an event or activity. Therefore, it represents something that a person can record, analyse and then rearrange. Examples of data include a sequence of bits, a table of numbers, the characters on a page, and so on.
It is possible to transform the elementary activity into data, which means converting it into a quantitative form for further processing and analysis. The latter steps allow obtaining important information, which becomes the representation of reality through technology. There are three main types of data that can be transformed into information: words, location and interactions. In order to generate knowledge, it is necessary to own the adequate instruments to process, analyse and transform data into information, otherwise the available data becomes useless without a deep analysis and understanding.
2.4.2 Graphs
A graph is the representation of data through graphical symbols, such as lines, bars, pie slices, dots, etc. It represents visual abstractions of underlying data that can strengthen cognition, detect trends and promote insight. It is useful when representing a numerical data, as it can convey important information extracted from the same. A graphical design is an abstract description of an image, which aims at communicating the graphical details used to encode information; examples of such graphical techniques are colour variation or position of an element in the space.
William Playfair was the first to design and publish several types of graphs, such as the time-series line graph, the bar chart, the pie chart and the circle chart [16]. Fig. 2.3 shows an example of Playfair’s charts. Modern charts are almost identical to those published by Playfair. According to him, statistical
2.4 Graphical representation of data 19 graphs are able to aid human information processing by decreasing the load of the viewer’s attention, his working memory and long-time memory.
Figure 2.35– William Playfair’s Bar Chart: Exports and imports of Scotland
As explained by Edward R. Tufte, an American expert statistician, in one of his works [17], it is important to communicate a complex idea with clarity, precision and efficiency; this method is called graphical excellence. A graph should:
Show data and persuade the viewer to consider its content rather than the design, without altering what the data tries to express;
Display many numbers in a restricted space; Ensure coherency of wide datasets;
Inspire the viewer to compare different items; Provide different levels of data details.
Tufte describes five main goals of Data Visualization:
Focus on the content rather than the visualization technique; Compare instead of describing;
20 Chapter 2. State of Art High resolution;
Utilization of classic designs and concepts.
To guarantee the integrity of the graphs, it is necessary for them to be truthful and not distorted. A graph does not produce distortions if the data representation is consistent with the numerical representation. In order to avoid the presence of distortions, it is useful to follow five principles of graphical integrity, as described by Tufte:
The representation of numbers should be directly proportional to the numerical quantities measured.
To avoid graphical distortion and ambiguity, it is important to use clear, detailed and accurate labelling.
Show data variation, not design variation.
The number of variables representing dimensions should not exceed the number of data dimensions.
Graphs must not report data out of context.
Other theories explained by Tufte refer to the use of ink: “Graphical excellence is that in which gives to the viewer the greatest number of ideas in the shortest time with the least ink in the smallest space”. Nowadays, the pixel replaces the concept of ink, but the rules and directions suggested by Tufte are still a valid approach. We can distinguish two types of pixels: data-pixel
(analogous of data-ink defined by Tufte) and non-data-pixel. The former is the non-erasable and non-redundant pixel, representing the heart of a graph and corresponding to the variation of the numbers they represent; deleting data pixels means loosing information. The latter corresponds to the pixel that is not strictly related to the quantitative data (e.g., grids), and the one that is redundant (e.g., labels or shadows). Non-data pixels can be limited or removed when possible, if they do not give useful information about data.
2.4 Graphical representation of data 21 Often, it is stated that a picture is more than thousand words; indeed, a visual representation is easier to analyse with respect to a textual report. Relevant design guidelines, explained by Tufte, are reported as following:
Choose a proper format and design;
Use words, numbers and drawings together; Reflect balance, proportion and relevant scale; Display an accessible complexity of details;
Keep a narrative quality (a story to tell about data);
Draw graphs in a professional manner, taking care of technical details; Avoid content-free decoration.
Another important aspect is the colour selection. Its usage allows showing variation in the data, highlighting relevant information and distinguishing between dimensions. Significant guidelines will be presented in Chapter 3.
2.4.3 Dashboard
“Dashboards are not an appropriate venue for artistic impression.”
Stephen Few
Stephen Few is the author of many articles related to Data Visualization, as hehas been working as an IT innovator since 30 years. In his book [18], he has explained a simple yet clear definition of dashboard:
“A dashboard is a visual display of the most important information needed to achieve one or more objectives, consolidated and arranged on a single screen so the information can be monitored at a glance.”
He further explains that ‘dashboard’ is simply a new name for the Executive Information Systems (EISs) first developed in the 1980s, whose purpose was to display key financial measures through a simple interface that ‘even an
22 Chapter 2. State of Art executive could understand’. The purpose of a dashboard is to provide real-time (or periodically updated) results by aggregating and extracting values from data present in the database. A dashboard is a useful tool that takes advantage of visual perception for communicating bulky data in a clear and concise way.
Recently, in business intelligence (BI), the term “dashboard” has taken different applications, completely apart from what Few intended to convey. For example, new definitions explain a dashboard to be the latest fashionable term for the “customized views” of “analytics business intelligence software”; others define it as a synonym of “portal”. Distressed by these deviations, Few wrote an additional article [19] in which he explains about the correct and inappropriate meaning of the term. He believes that the real meaning of a dashboard is not based on any particular type of information (e.g., KPIs – key performance indices), but in the way it displays information to serve a particular purpose. Just as the dashboard of a car provides critical information needed to operate the vehicle at a glance, a BI dashboard serves a similar purpose. The mean is a single-screen display and the purpose is to efficiently monitor the information needed to achieve one’s objective.
Additional characteristics of a dashboard are specified by Few:
High-level summaries. The information quickly tells what is happening, but not why is it happening. Diagnosis requires further investigation and detail.
Concise, clear and intuitive display mechanisms. The message is clearly stated without taking up much space, so everything can fit a single screen.
Customized. The information on the dashboard are related to the requirements of a given person, group or function; otherwise it will not serve its purpose to help achieving specific objectives.
According to Few, a dashboard is not a technology but a presentation style that allows using dashboards to work faster and smarter, rather than focusing
2.4 Graphical representation of data 23 on what does not matter. He wrote an article about common pitfalls when designing a data visualization dashboard [20], in which he stated 13 frequent mistakes that provide a good start to dashboard design. He believes that the biggest challenge of dashboard design is to make all the information fit a single screen without creating a clustered mess. The common pitfalls, mentioned by Few, that I found considerable for my work are the following:
(1) Displaying excessive detail or precision; (2) Expressing measures indirectly;
(3) Encoding quantitative data inaccurately; (4) Ineffectively highlighting what is important; (5) Cluttering the screen with useless decoration; (6) Misusing or overusing colour;
(7) Designing an unappealing visual display.
2.4.4 Data Visualization Techniques
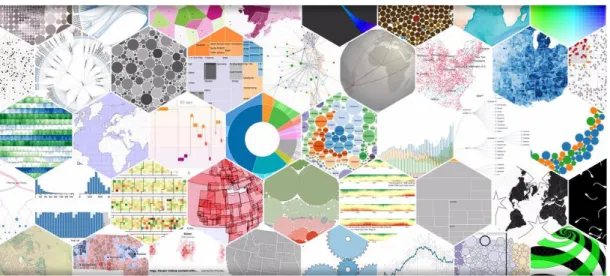
Figure 2.46– Variety of Data Visualization techniques
Data Visualization integrates design choices about data access, data transformation, visual representation and interaction. Many representation techniques are currently under research and development phase (see Fig. 2.4); therefore, the selection of the suitable visualization becomes a challenging task.
24 Chapter 2. State of Art In this situation, it is fundamental to have a medium able to help identifying the correct methodologies for showing information. Visualization taxonomies support this matter, as they can serve two major purposes [21]:
Guide users to find visualization ideas.
Guide researchers to find people doing similar work.
The scientific literature provides different taxonomies and methodologies for identifying the most suitable visualizations for representing information. The next paragraphs describe the relevant data visualization techniques that I considered suitable for my work.
Most visualization taxonomies are based on the type of data involved; according to Shneiderman [22] there are seven data types:
1-dimensional data: linear data types; 2-dimensional data: planar or map data; 3-dimensional data: real-world objects; Temporal data: time lines;
Multi-dimensional data: relational and statistical databases; Tree data: hierarchies or tree structures;
Network data: relationships among items.
The BRIDGe project relies on data varying from 1D and 2D, temporal and hierarchical types.
Many of the works found in literature, such as [23], [24], [25], [7], [26], [27], follow a common procedure for visualizing data, that can be summarized into the following six steps. I have followed this basic methodology throughout this work, and I will better explain it in Chapter 3.
(1) Acquire data and examine its nature;
(2) Mapping: categorize data according to its meaning and decide a specific visual representation;
2.4 Graphical representation of data 25 (3) Filter: select data which is relevant and remove unnecessary data; (4) Represent: render the mapping and manage information according to
the available space on the screen;
(5) Refine: improve the basic representation; (6) Interact: allow data manipulation.
Mazza [27] focuses on the definition of the dimensions required to represent data, of the data structures and the type of interactions, while Ward [7] and Khan [25] give importance to usability, accessibility, expressiveness (e.g., the measure of information concentration) and effectiveness (e.g., the measure of information perception cost) of the visualization.
Slightly different is the methodology presented by Shneiderman: the Visual Information-Seeking Mantra [22], one of the most appreciated methodology for identifying an appropriate visualization, which consists of four main tasks (e.g., overview, zoom and filter, details on demand). The peculiarities of his approach are remarkable: there is the possibility to present detailed data upon the user’s request, or hide it otherwise; I made use of this solution to show possible malfunctions among the sensors. Additionally, Shneiderman suggests keeping a history of actions, so the user is able to replay what happened in the past and compare current statistics with older analytics. BRIDGe already adopts this concept by providing a time machine to replay the inhabitant’s activities during a selected period.
Mackinlay [28] and Lange [29] aimed developing interesting application-independent presentation tools that would automatically design optimal graphical representations of data and recommend a visualization based on data characteristics, but this matter remains out of scope for the current work.
It is possible to add dynamics to a visualization, meaning that the visualization changes over time, in terms of streaming data, animated or interactive elements. In his paper [30] Cottam presents a taxonomy for dynamic
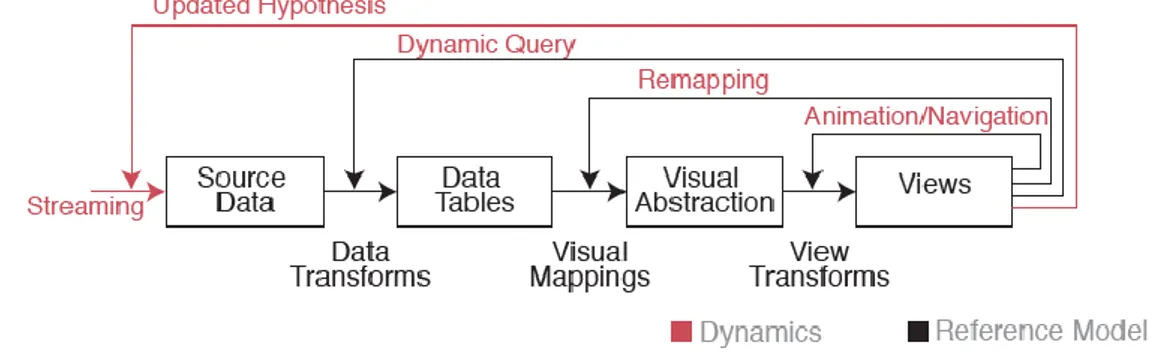
26 Chapter 2. State of Art data visualization, where he explains the impact of dynamic data: how data changes influence the interpretability of visual representations. As shown in Fig. 2.5, dynamics can arise at any stage of the visualization process; as we will see in Chapter 4, many of the implemented visualizations apply dynamicity (i.e., sensors updates, visualization based on selected dates, and so on).
Figure 2.57– Information visualization reference model and sources of dynamics at each stage
Cottam follows the model explained by Bertin [31]: the visual space is splitted into spatial variables, describing the position of an element as (x,y) coordinates in the space, and retinal variables, describing the size, value, orientation, texture, hue and shape of an element. In this way, visualizations can be organized according to the dynamics present in spatial and retinal dimensions. Cottam describes that spatial dimensions can be dynamic when existing values change or when the number of visual elements increase/decrease; therefore, it is possible to categorize them into (1) fixed, (2) mutable, (3) create and (4) create & delete. In a different manner, retinal dimensions do not affect the number of elements, but the way elements are perceived; they can be categorized into (1) immutable, (2) mutable on a defined and regular scale, (3) mutable on a defined but distinguished scale, and (4) mutable scale.
2.4 Graphical representation of data 27
2.4.5 Data Visualization in AAL systems
Data visualization research remains quite limited in literature when we focus on a specific older adult consumer. Since it is not possible to give a complete overview of all smart homes and AAL systems, I focus on studies related to my work and give an overview of enabling technology and visualization of domestic sensor data research.
The AAL systems that are going to be mentioned are based on ZigBee wireless communication technology, which is similar to Z-Wave technologies used in BRIDGe. According to Knight [31], Z-Wave and ZigBee are similar wireless standards, both designed for low power and providing low throughput; however, Z-Wave is considerably less robust than ZigBee.
CASAS
The CASAS project [12], mentioned in Section 2.3, distribute the monitored data as described further. It represents activity trends for a smart-home resident, divided into six graphs (see Fig. 2.6).
28 Chapter 2. State of Art The upper segment includes a plot of activity density, describing the number of sensor events over the time period (top left); daily levels of activity, sleep quality and time spent out of the house (top middle); comparison of socialization and sleep quality parameters for a time period (top right). The lower section focuses on occurrences of tracked activities (bottom left); time spent into different areas of the house (bottom middle); health trend over a time period, computed over the other parameters (bottom right).
Two application systems, PyViz and CASASviz, support the CASAS smart
environment by representing and exploring residents’ behaviour patterns.
PyViz is a desktop application [33], developed using Python programming language and SVG2 format to provide a feature-rich method for visualizing
real-time activities and historical trends. BRIDGe allows having a similar interface visualizing real-time environment and statistics as well as historical reviews of data. The CASAS activity visualizer (see Fig. 2.7) supports energy-efficient behaviour in the house and renders sensor events regarding the usage of resources, such as electricity.
Figure 2.79- PyViz: CASAS activity visualizer (on the left); PyViz: graphical numeric data (on the right)
2 The Scalable Vector Graphics is an application of XML-format that describes 2-dimensional vector
2.4 Graphical representation of data 29 It is worth noting that Python language provides rapid prototyping and ease of design; however, it presents some limitation when dealing with large volumes of historical data.
CASASviz is a web-oriented visualization system [34] that supports CASAS environment, implementing smartphones versions as well. It is an extension of
PyViz that integrates monitoring, analysis and automated recognition of residents’ behaviour patterns in the smart environment. In particular, the system monitors the mobility of the residents in real-time, reviews the history of mobility and discovers long-term abnormal patterns during a defined time period. The collection of data in CASASviz is divided into four fields: date and time, sensorID, message and label (activity). In Chapter 4 we will see how BRIDGe data collection differs from this one.
CASASviz implements seven different visualization applications: a Main Visualizer (see Fig. 2.8a) that has a playback mode to show capture sensor readings for reviewing the mobility history, similarly to BRIDGe. A Mobility Heat Map (see Fig. 28.b) describes the frequency of the triggered events for different types of sensors (mobility, door and item sensors).
a) b)
Figure 2.810– CASASviz: Main Visualizer (a) and Mobility Heat Map (b)
An Activity Graph (see Fig. 2.9) is an annotated chart that represents the monitored activities. It is useful for identifying changes in behaviour patterns and searching for anomalies.
30 Chapter 2. State of Art
Figure 2.911– CASASviz: Activity Graph
A Power Usage Visualizer (see Fig. 2.10) expresses the energy fluctuations that occurred during the time the user defined. It is useful to identify trends and abnormalities of power consumption.
Figure 2.1012– CASASviz: Power Usage Visualizer
The remaining two visualizations are Long-term Pattern Visualizer, that discovers long-term and abnormal behaviour patterns of the resident, and Activity Feature Extraction, that uses machine learning techniques to extract relevant features. The latter can be used to predict activity recognition and energy consumption.
2.4 Graphical representation of data 31
UBICARE
Dasios et al. [35] established an AAL-based prototype system for elderly home care monitoring, named Ubicare. Partially similar to BRIDGe, Ubicare
presents a monitoring based on the recording of environmental parameters, such as temperature, ADLs, usage of electrical appliances and plumbing components, and light intensity. The system issues alarms to authorized caregivers for improving security and immediate remedy; moreover, it makes no use of cameras or microphones so to avoid violating inhabitant’s privacy. However, the person needs to carry minimal equipment for activity detection. The structure supports remote monitoring through a web interface that exports statistics and creates dynamic graphs. Thus, it is possible to view current and historical data about the parameters mentioned above. Fig. 2.11 illustrates an example of activity monitoring visualization in Ubicare.
Figure 2.1113– Ubicare visualization of activity monitoring: toilet flush
activation occurrences per day.
Other examples
In his research [36] Mulvenna provides commercial and academic examples of visualizations for AAL systems, where the collected information about
32 Chapter 2. State of Art inhabitant’s movements is used to alert emergency incidents (e.g., fall) and unexpected behaviour, remind and assist ADLs. ADLife is a service with a user interface that represents data in the form of a table, showing the total activations of all the sensory equipment over a day, week and month. Each total number is represented in the form of bar charts, highlighting under and over usage. Mulvenna also describes QuietCare, a system organized around activities rather than specific sensors. The user can, through a specific button, access specific details for each activity in the last period and visualize related textual description.
Mynatt et al. [37] explain that it is important to maintain awareness of long-term health and well-being of elderly. For this purpose, they developed a
Digital Family Portrait [38], a visualization of sensor activity collected from a smart home environment that aims at representing ADLs. The authors found differences in how older adults and family members use the visualization and concern about privacy and security.
The examples provided in literature can give us an overview of the current applications of Data Visualization in AAL systems. It is possible to extend the functionalities provided in BRIDGe to match and extend literature. For example, we can consider having different UIs for inhabitant and family members, differentiate between current and historical visualizations, provide data at different granularities (day, week, and month), remotely control the appliances through the web interface, or highlight under/over usage of appliances. Most of the mentioned projects use a limited and standard visualization; therefore, we focus on the need of representing data using a modern technology such as D3.js.
FIBARO
Literature proves us that it is possible to customize and adapt sophisticated and reliable Smart Home systems, commercially available to the wider
2.4 Graphical representation of data 33 community, for aged/disable people. A good example of such a system is Fibaro
Home Automation system; as described by Lewis in [39], this system was successfully installed in the house of a person with disability and customized to his needs and preferences, with the aim of testing the practicality, efficacy and cost of such a system. Fibaro system can be controlled from anywhere in the world via browser-based graphic interface or native mobile application. It communicates with electronic sensors and devices located throughout the house using wireless and wired communications. It makes use of Z-Wave sensors and actuators, similarly as BRIDGe. Fig. 2.12 shows the web dashboard of the system.
Key points of the system are: efficient hardware architecture, low energy consumption, remote access through web page or mobile phone, simple and user friendly interface, SMS notifications, advanced recovery system, system backup attached to a pen drive, history of events.
34 Chapter 2. State of Art
PIDOME
Apart from systems related to AAL, literature provides a big range of smart home applications; most of those I found during my research are mobile applications rather than web interfaces or portals. A worth considering one is
PiDome [40], a platform for home automation based on the Raspberry Pi server, similarly to the BRIDGe project. The intention is to create a platform where users can plug existing or self-designed components, attach these to the server and monitor them via a web interface or a custom client. Key points of the system are: personalized dashboards for mobile clients and automated creation of graphs. Fig 2.13 and 2.14 show two screens of the PiDome web application.
2.4 Graphical representation of data 35
Chapter 3
M
ethodology
“The best software for data analysis is the software you forget you’re using. It’s such a natural extension of your thinking process that you can use it without thinking about the mechanics.”
Stephen Few
In this chapter, I describe the common visualization theories and the adopted methodology. The first part reports the concept of human visual perception, cognition and an explanation of how they work in the human brain. Then, I illustrate how data visualization can take advantage from these mechanisms. After describing the typical visualization processes, I give details about the procedure applied during this work, followed by some guidelines and best practices for designing better visualizations.
38 Chapter 3. Methodology
3.1 Human Perception and Cognition
In order to receive information from the environment, we are equipped with sense organs (e.g., eyes, ears, nose, etc.), each of which is part of a sensory system that receives sensory inputs and transmits sensory information to the brain. Then, sensory inputs are converted into perceptions (i.e., sight, sound, smell, taste and touch experiences) that are different according to the physical characteristics of the stimulus. The brain is, thus, able to extract knowledge thanks to the fact that the perceptions are interpreted in function to the previous experiences associated to the stimulus. In [41] Alexandre explains that visualization explores the human sense that is acquired fastest by the human brain: vision. The human vision system has parallelism capacity, which means that it can reach a wide surrounding whereas the eyes focus on one point.
In his book [42] Ware explains how visual perception works and how it applies to data representation. He claims that the human visual system is a pattern-seeker of immense capability and subtlety; the human eye can easily see patterns, which may remain invisible if presented in a different way. Following perception-based rules, it is possible to present data in a way to highlight the important and informative patterns; a deviation to the rules may lead to incomprehensible or inaccurate data.
Almost all data visualizations are created for human consumption; therefore, the knowledge of human perception and cognition becomes essential for designing intuitive visualizations. Cognition refers to actions such as perception, attention, learning, thought, concept formation, reading and problem solving. Human visual processing is efficient in detecting changes and making comparisons between quantities, sizes, shapes and variations in brightness. It is estimated that 2/3 of the brain’s neurons can be involved in visual processing. Proper visualization provides a different approach to show potential connections, relationships, which is not as obvious in non-visualized quantitative data.
3.1 Human Perception and Cognition 39 Human visual processes work essentially on two levels: automatic and
controlled [43]. Automatic processes, which work on visual properties (i.e., position and colours), are strongly parallelizable but have limited power. Controlled processes, instead, work with texts, allowing powerful operations, but have limited capabilities. Stephen Few [44] adds that data visualization is effective when it shifts the balance between perception and cognition; visual perception (seeing) is extremely fast and efficient, while cognition (thinking) is much slower and less efficient (see Fig. 3.1).
Figure 3.117– Perception and cognition balance
To better understand the principles of visual perception, it is useful considering the Gestalt laws established by the Gestalt School of Psychology in the 1920s [42]. “Gestalt” is a psychology term meaning “unified whole”, and it refers to the theories of visual perception: perception of pure motion without any object motion. These theories attempt to describe how people tend to organize visual elements into groups or unified wholes when certain principles are applied. The most important principles are described below.
Closure. A design technique that uses the ability of the human eye to see closed shapes even if an object is incomplete or if its interior space is not fully closed.
Continuation. A principle that draws users’ eyes along a path, line or curve, to create the illusion of a single continuous figure rather than separate lines.
40 Chapter 3. Methodology Figure/Ground. Using the idea of light and shade, this principle relies on the eyes’ tendency to view and separate objects from their surrounding background.
Proximity. The close arrangement of elements helps creating a group association between them. Different visual elements help achieving this principle.
Similarity. It allows users to believe that individual similar elements are part of a pattern or group, creating a single illustration from a series of elements.
Symmetry. The principle advocates the need to provide a sense of order and balance to save viewers’ time and ensure that they locate all elements and fix problems.
Spence [16] provides a schematic representation of how the visual system processes the huge amount of information that is available at any instant (see Fig. 3.2). Most of the low-level computation is done within the eye itself, whereas the higher-level processing takes place in several specialized areas of the visual cortex. It is important to realize that visual processing is not a one-way street; events at the lower level are continuously modified.
3.2 Visualization Process 41 We can define two types of memory: working memory and long-term memory. The former one holds the objects of immediate impact, what we are seeing (e.g., position, shape, colour, texture information), while the latter one contains information we collect from everyday experience. The problem with working memory is that only few simple objects can be retained; however, the majority of visualizations will not be committed to long-term memory. The conclusions or understanding may be transferred to long-term memory, but the design itself will not. Therefore, most of the interactions between the user and a visualization will occur within the working memory; for this reason, I have chosen to show charts that represent chunks of information, instead of single values. In this way, the visual representation can be easily processed by the working memory, and it can offer more detailed insights.
3.2 Visualization Process
The visualization process is a function that maps the dataset to a visual representation; in this way, it provides a more efficient and effective cognitive process for acquiring information and knowledge.
Chen et al. describe that a visualization process is alike a search process [8]. Given a dataset Cdata, the user first makes some decisions about the visualization
tools to be used for exploring the dataset. Then he experiments different control parameters Cctrl (e.g., styles, layout, viewing position, colour maps, etc.), until
he obtains a satisfactory collection of visualization results, Cimage.
In visualization, the tools for the search tasks are usually application-specific (e.g., network, flow, volume visualization). Moreover, the decision space is normally huge since, for example, exploring many viewing positions can produce different results. Finally, when handling very large datasets, the user interaction can be very slow. This can be depicted in Fig. 3.3, which shows an example of typical visualization process where a large interaction box connects the user to the control parameters.
42 Chapter 3. Methodology
Figure 3.319– Typical visualization process
Chen et al. distinguish between information-assisted and knowledge-assisted visualization processes. The first one expands the visualization process by adding information abstracted from the data; the user is provided with a second visualization pipeline (see Fig. 3.4), which displays the information about input dataset, attributes of the process, properties of the results or characteristics of user’s behaviour. The users exploits such information to reduce the search space for optimal control parameters, hence making the interaction much more cost-effective. In fact, the degree of interactivity required is lower with respect to a typical visualization process (the interaction box in Fig. 3.4 is visibly shorter than the one in Fig. 3.3).
Figure 3.420– Information-assisted visualization process
Few examples of the information categories used in data visualization are specified in Table 3.2.