ALMA MATER STUDIORUM – UNIVERSITÀ DI BOLOGNA
SCUOLA DI SCIENZE A.A. 2020/2021
Corso di Laurea Magistrale in Analisi e Gestione dell’Ambiente
TESI DI LAUREA in
Biocarburanti e Bioraffinerie
New path for thermochemical-biological conversion
with a power-to-material approach
CANDIDATO Andrea Facchin
RELATORE CONTRORELATRICE
Table of Contents
Abstract
1
1 Introduction
3
1.1 Biorefinery concept 3
1.2 Pyrolysis of biomass 4
1.3 Mixed Microbial Communities (MMC) for anaerobic digestion 6 1.4 Effect of additional hydrogen supply on MMC 9 1.5 Chemical Oxygen Demand (COD) as a measure of chemical energy:
definitions and rationale. 9
1.6 Aim of the Thesis 11
2 Methods
14
2.1 Analytical methods 14 2.1.1 Elemental analysis 14 2.1.2 Gas analysis 14 2.1.3 pH 14 2.1.4 Total COD 152.1.5 Volatile Fatty Acids (VFA) analysis 15
2.1.6 Aldehydes 16
2.1.7 Silylation 17
2.1.8 HPLC-SEC 17
2.1.9 Ash content 18
2.1.10 Moisture 18
2.2 Determination of the Potential Fermentable COD in Pyrolysis
Products 19
3 Results
35
3.1 Review of the pyrolysis products yield 353.1.1 Slow pyrolysis yield 36
3.1.2 Fast pyrolysis yield 40
3.1.3 Pyrolysis Review Conclusions 43
3.2 Results of the pyrolysis products characterization 44 3.2.1 Ultimate analysis of feedstock and pyrolysis products 44 3.2.2 COD balance of the different pyrolysis 45 3.2.3 Analysis of Water-Soluble fraction from pyrolysis: HPLC-SEC 47 3.2.4 Analysis of Water-Soluble fraction from pyrolysis: Volatile Fatty
Acids (VFA) 50
3.2.5 Analysis of Water-Soluble fraction from pyrolysis: Aldehydes 51 3.2.6 Analysis of Water-Soluble fraction from pyrolysis:
Silylation-GC-MS 51
3.2.7 Analysis of Water-Soluble fraction from pyrolysis:
Silylation-GC-MS 53
3.2.8 Analysis of Water-Insoluble fraction from pyrolysis 54 3.3 Results of the pyrolysis products fermentation 57
3.3.1 Set 1 57
3.3.2 Set 2 63
3.3.3 Set 3 72
4 Conclusions
82
5 Annex
84
5.1 Water-Insolubles biodegradation tests 84
5.1.1 Water-Insolubles biodegradation test Methods 84 5.1.2 Water-Insolubles biodegradation test Results 85
5.2 Multiple gasometers script 89
5.3 Automatic feeding system script 93
5.4 Pulsing recirculation script 102
1
Abstract
Thermochemical-biological systems are based on the ability of thermochemical process to break down macromolecule to yield smaller ones, while bacteria can convert also complex substrates into valuable chemicals. In this thesis the possibility of a direct couple between pyrolysis and anaerobic digestion has been investigated for the purpose to produce Volatile Fatty Acids (VFA), considering also the possibility to provide extra hydrogen to enrich the value of the products. Firstly, a large characterization of the COD yield and chemical composition of pyrolysis products was made, revealing the conversion of more than 50% of biomass’s COD into bioavailable chemicals. Secondly, three biotrickling bed reactors were developed with different filling materials, included biochar, and tested with and without hydrogen. Results suggest that biochar acted as a promoter for the biotransformation of pyrolysis products COD into VFAs, yielding 35% of conversion, meanwhile hydrogen had demonstrated the ability to stabilize higher yield of longer chain VFAs.
3
1 Introduction
1.1 Biorefinery concept
In the last decades, energy and chemical demand and supply increased worldwide, and consequentially, the use of petroleum products increased. Together with the energy and material supply problem, the consumption of fossil resources can be unsustainable in the long term and worsen the environmental issues related to emission greenhouse gas and consequential global warming. A potential candidate that can contribute to solving these problems is biomass, namely a short cycle organic material, suitable to be produced in large renewable amounts to substitute petrochemical derivatives. In this context, a biorefinery is a facility that produces fuels, energy, and chemicals by the conversion of biomass sources [1]. According to Fernando et Al. [1] “biomass consists of carbohydrates, lignin, proteins, fats, and to a lesser extent, various other chemicals, such as vitamins, dyes, and flavors” and can, at the end of the biorefinery transformation, give two types of products:
1. Low-Value High Volume (LVHV): products useful to produce energy and meet the energy supply-demand
2. High-Value Low Volume (HVLV): mainly chemicals, produced in small quantity but with a high market value
Accordingly to Van Dyen et Al. [2], biorefineries can be categorized into three types:
• Phase I: biorefinery that uses one feedstock and produces a single product (e.g. bioethanol from grain)
4
• Phase II: biorefinery that uses one feedstock but can produce several products (e.g. wet mill biorefinery)
• Phase III: biorefinery that uses several feedstock types and can produce different products
The capability to convert different feedstock (flexibility) and obtain a large array of products is intimately related to the use of different processes and technology. Also, in the biorefinery concept, the value of each stream must be maximized in order to reduce the production of waste and maximize the recovery of energy [3]. Although the phase III biorefinery is the more complex, it could be more efficient in terms of ability to cover the supply of energy, fuels, and chemicals.
1.2 Pyrolysis of biomass
Many different technologies have been developed in the lasts decades to allows the biorefineries to process a wider number of ores and to maximize the outputs yield, for this they can have biotic processes (as oxic and anoxic processes), abiotic processes, or, more often, both. Thermal treatments are very diffuse and enable the possibility to use a different source of complex biomass to get gas, liquid, and solid products. Pyrolysis is one of the straightest ways to breakdown the complex biomass into the smallest molecules and can be defined as thermal decomposition occurring in absence of oxygen. It can be applied to many different materials, in particular, the pyrolysis of biomass has been widely researched to obtain fuels and chemicals. The products of pyrolysis are:
- Biochar: carbon-rich solid which retains most of the feedstock ashes.
- Pyrolysis liquid, bio-oil, or pyro-oil: water, water-soluble, and water-insoluble condensable compounds
5
- Non-condensable gases: CH4, CO2, CO, H2, and other light hydrocarbons (C 2-C4)
The type and yield of products depend on different parameters such as type of biomass, the temperature in which the pyrolysis occurs, heating rate and heat transfer to the biomass, residence time of the gaseous phase in the reactor, or cooling time of the exiting gas [4]. Pyrolysis types can be divided mainly into two categories:
1. Fast pyrolysis (high temperatures, low residence time, high heating rate) 2. Slow pyrolysis (lower temperatures, higher residence time, low heating rate)
Slow pyrolysis enhances the production of biochar while fast pyrolysis allows a higher bio-oil and gas yield and, for this reason, it can be preferred as a method to breakdown the complex polymers of the biomass to produce smaller molecules that can be sent to other processes [5]. Biomass is mainly composed of cellulose/hemicellulose (carbohydrates) and lignin (aromatic polymer) with variable percentages depending on the biomass type. During the pyrolysis process, these macro-molecules are break up into smaller particles that can be further recombined or decomposed. Biochar is formed by rearrangements of the macromolecules into condensed polycyclic aromatics rings, mainly from lignin [6]. Non-condensable gases are formed during primary pyrolysis, charring, and secondary decomposition of larger compounds. The main gaseous components are carbon monoxide, carbon dioxide, methane, and hydrogen, with the minor presence of C2-C4 molecules. Pyrolysis liquid is composed of a large number of molecules, namely 14-30 %wt water and 70-86 %wt organic compounds [7]. Pyrolysis liquid includes hundreds of molecules: acids (e.g. Acetic Acid), sugars, anhydro sugars (e.g. levoglucosan), and aldehydes (e.g. hydroxy acetaldehyde) are formed from carbohydrate part; phenols, catechols, guaiacols, and other aromatic ones derive from lignin [8]–[14]. Although pyrolysis was often proposed as a direct method to obtain fuels from biomass, the process produces a liquid that is not suitable for use in actual engines without upgrading. This huge variety of chemical
6
functionalities in the final pyrolysis liquid represents a challenging issue in terms of analytical characterization and hampers the design of strategies for catalytic upgrading.
The key issue is that most chemical catalysts allow the transformation of reactants with comparable chemical properties into one or more products, whereas the upgrading of pyrolysis products requires the production of one or few defined compounds from reactants characterized by totally different chemical properties. This task is challenging for chemical catalysis, but it worth noticing that, from a chemical perspective, is exactly what microorganism consortia routinely do in anaerobic environments (e.g. anaerobic digestion of organic matter). This simple deduction suggests a completely new bio-funneling approach for addressing the molecular diversity of pyrolysis products.[15].
1.3 Mixed Microbial Communities (MMC) for anaerobic digestion
The biological processes, in biorefineries, are often carried out by unicellular organisms (bacteria or yeasts) that can be single strains or mixed microbial communities (MMC). The MMC cultures offer some advantages: higher metabolic potential (potential use of mixed substrates), no sterilization required, and higher adaptability through ecological selection[16]. They are usually preferred when the substrate is more complex or slightly toxic, in fact they are commonly used for the commercial-scale fermentation of the biodegradable waste streams to produce valuable energy carriers such as methane [17]. The possibility to convert a complex substrate have, although, some limitation connected to the thermodynamics of fermentation and the biological limits. In a spontaneous reaction, the main driver is the Gibbs free energy (ΔGr) and the difference between the reagents and the products
must be negative. Moreover, even with largely negative ΔGr , it does not mean that
the biological reaction is feasible: the enzymatic pathway can be absent or inhibited, the reaction rate can be too slow or others reactions can compete with the biological catalyzed path [18]. For organic carbon anaerobic systems, the equilibrium is reached when the molecules with the lowest ΔG change per electron are produced, that is
7
when CH4 and CO2 are produced [19]. The elimination of the oxygen allows the production of final molecules that keep part of the initial energy since the oxidation is not completed. However, due to the actual low economic value of methane, in the last years, the attention was focused on the obtainment of other possible final products, especially chemicals [19]. Among the possible pathways in which anaerobic digestion occurs, there is the possibility to control the trend of the fermentation to obtain only a few valuable chemicals. In Figure 1 (from Kleerebezem et Al.) the ΔG (KJ*mole-1) of the main molecules involved in anaerobic fermentation is presented.
Since the variation of free energy must be negative, the molecules with the lowest Gibbs Free energy per electron (at given conditions) are the most favorable products. Alcohols, Volatile Fatty Acids (VFA) are typical spontaneous products of anaerobic fermentation which can have high commercial value. Conversion of wastes into such chemicals allows to increase the profitability of the conversion and to cover a large array of drop-in applications (e.g. advanced biofuels, polymers, chemicals).
8
Figure 1. From Kleerebezem et Al. 2015 [19]
Pyrolysis produces a large number of completely different molecules, with the consequential high cost for the purification. Therefore a new alternative strategy for thermal-microbial conversion of biomass wastes was proposed [20]. Different research lines have focused on the toxicity of the bio-oil and some have tried to biologically treat the pyrolysis product or similar mixtures [21]–[25]. Two different approaches seem to outcrop: direct coupling of pyrolysis and MMC capable to address pyrolysis products (e.g. able to address toxicity and degrade pyrogenic compounds), or increasing selectivity of pyrolysis in order to enhance the fermentable fraction and avoid the high levels of toxic compounds. Given the complexity of pre-treatment and conditions required to increase the selectivity of pyrolysis (e.g. de-mineralization for an increase of anhydro sugars yield), the first pyrolysis “as-it-is” approach using a partially inhibited “pyrotrophic consortium” able to funnel pyrolysis product into
9
specific chemicals or intermediates, could be a relatively straight path for flexible biomass conversion system, as well as an extremely interesting new field of research
1.4 Effect of additional hydrogen supply on MMC
Recently hydrogen has attracted many interests as a possible source of clean energy, not only for fuels. Renewable electricity can be used to reduce hydrogen from water, obtaining molecular hydrogen which can be considered as a stock of the initial clean energy. Hydrogen, then, can be used in anaerobic digestion, as an easy way to provide clean energy and produce valuable chemicals and materials. For the carboxylic anaerobic digestion, hydrogen seems to favor the reversed β-oxidation [26], [27], with an increased yield of longer VFAs. Also, it’s possible to couple pyrolysis product digestion with an addition of hydrogen as an extra electron source, with the aim of a more easily degradation of the pyrolysis products more difficult to digest.
1.5 Chemical Oxygen Demand (COD) as a measure of chemical energy: definitions and rationale.
Understanding of hybrid thermochemical-biological processes requires a steep change in the view of pyrolysis processes. Since most pyrolyses studies aim to directly obtain a fuel, they are usually characterized in terms of average fuel proprieties (e.g. elemental analysis, HHV), neglecting details on molecular structures or bioavailability features.
The ambitious scope of this thesis is to obtain information necessary to provide some direct measurements required for design thermochemical-biological processes. To facilitate the connection of relatively distant research areas (as biology and chemistry), it is helpful to use a common unit of measure of chemical energy that should be easily applicable in both aqueous biological systems and thermochemical processes. The most widely used unit of measure of chemical energy is the tons of oil equivalent (toe) which corresponds to 41.85 GJ, which is used to compare oil, biomass fuels, and power sources in energy systems. Although helpful, such measure is
10
intrinsically “built around oil” and requires analysis (namely higher heating value or elemental analysis) that are difficult to perform in aqueous solutions, and this hampers its use for the abovementioned purposes. Borrowing approaches from the other fields, Chemical oxygen demand (COD) or theoretical oxygen demand, which is commonly used in wastewater treatment and monitoring of biological systems, is a direct and useful measurement of chemical energy in biomass or solutions (as COD concentration). 1 kg of COD (otherwise named 1 kgO) corresponds to a certain amount of organic matter that needs 1 kg of oxygen to be completely oxidized. From the theory, COD is proportional to the number of electrons that are transferred from water to organic molecules during biomass photosynthetic production. Due to the stoichiometry of redox reactions, 1 kg of COD corresponds, by definition, to 0.125 kmol of electrons packed into the energy-rich bonds of organic compounds by photosynthesis.[19] Both COD (due to stoichiometry) and higher heating value are linearly correlated to elemental compositions.[28] It follows that 1 kg of natural occurring COD typically contains about 15 MJ of chemical energy and can be transformed into heat, work (with a certain efficiency), or into a maximum of 1 kg of COD of chemicals or materials. The COD of common biomass feedstock ranges between 1 and 4 kgO/kgfeedstock (COD of H2 is 8 kgO/kgH2) which are easily memorized. If a chemical or biological process produces a 100% COD yield, this means that the process is perfectly efficient. More in general, according to thermodynamic principles, biocatalysts allow to exploit paths that are within the limits of two fundamental rules, which can be summarized as follows:
1) The COD of reactants should be equal to the COD of products. Given that oxidant has negative COD (e.g. COD of oxygen = -1 gO/g, by definition) this assumption is valid in both anaerobic and aerobic systems.
2) In a thermodynamically closed system, namely in absence of energy input (e.g. light, electrical current), MMC catalyzes reactions towards thermodynamic equilibrium. The state of thermodynamic equilibrium for organic compound conversions is achieved when the compound with the lowest Gibbs energy is
11
produced. Since electrons are proportional to COD by definition, the most favorable “COD pathways” are those that foresee the largest Gibbs energy decrease per g of COD converted.[16] It is interesting to notice that almost all Pyrolysis products (apart elemental carbon and methane, which is the most thermodynamically stable product of fermentation) have enough negative DGCODox to allow the production of interesting chemicals like ethanol, butanol, or short-chain fatty acids. More specifically, the mixture of bioavailable condensable constituents (gas and water-soluble products) has a weighted average ΔG𝐶𝑂𝐷𝑜𝑥 in the range between -14.3 kJ/gCOD and -15 kJ/gCOD. This value is more negative than those of most target fermentation products, like combined acetogenesis products (e.g. H2 and acetic acid), butanoic or longer fatty acids, ethanol (-13.7 kJ/gCOD), and butanol (-13.4 kJ/gCOD). PyP can be transformed into products when Gibbs energy per gCOD decreases by more than 0.5 kJ/gCOD. This is valid with most of known PyP, which means that, on average, PyP have more energy-rich bonds than biological intermediates or most of MMC targeted chemicals
1.6 Aim of the Thesis
This research has the purpose to implement an experimental system suitable to investigate new thermochemical-biological pathways for conversion of biomass, waste, and renewable hydrogen to valuable intermediates.
Thermochemical-biological systems, in which biomass is pretreated through pyrolysis and thereafter digested in anaerobic conditions with hydrogen from hydrolysis of water, were investigated with the aim to obtain Volatile Fatty Acids, which represents a versatile biological building block, that can be used (biologically or chemically) to obtain valuable chemicals or materials (Figure 2).
12 Figure 2
In this wide aim, three specific targets of this thesis were:
• To establish, with a newly developed analytical procedure, the exact partition of chemical energy into different pyrolysis products, namely gas, water-soluble substances, water-insoluble substances, and char. Shortly, the first aim of this thesis is to answer the question: “how much of feedstock chemical energy is converted fo bioavailable constituents?”
• Design, validate and test an experimental system for the study of anaerobic biodegradation of pyrolysis products in presence of hydrogen produced by electrolysis. This means a controlled system that can be feed with pyrolysis products (gas and liquid) and hydrogen and with acceptable COD closure (no leaks or losses)
• Use the validated experimental system to evaluate (in preliminary experiments) the bioavailability of different biodegradable fractions produced from pyrolysis and the effect of hydrogen supply on anaerobic conversion.
14
2 Methods
2.1 Analytical methods
In this chapter, all the methods used for this thesis are presented. The names of each analysis here reported are thereafter used as a reference to indicate the method further described.
2.1.1 Elemental analysis
Approximately 1 mg of solid sample was weighted inside a silver vial and analyzed in a Thermo Fisher Elemental Analyzer (Flash 2000), configured for solid samples with a copper/copper oxide column (flash combustion method). The instrument analyzes carbon, hydrogen, nitrogen, and sulfur percentage. Oxygen was determined by difference.
2.1.2 Gas analysis
10 mL of gas sample were collected with a syringe and injected in a GC-TCD 7820A using three packed columns placed in series (HAYASEP 80e100 mesh HAYASEP 0 80e100 mesh, and MOL SIEVE 5A 60e100mesh, from Agilent Technologies) with the following thermal program: 9 min at 50 °C, then 8 °C*min-1 to 80. Quantitation was performed using calibration with pure gases.
2.1.3 pH
15
2.1.4 Total COD
COD was measured by thermal oxidation at 1200 °C with detection of the oxygen consumption using a COD analyzer QuickCODLab (LAR Process Analyzer AG) following the ASTM D6238-98 method. After proper dilution, the sample was injected directly into the reactor where it was completely oxidized at 1200 °C under air/nitrogen flow and continuously analyzed with an O2 detector. The COD was calculated as g O2 L−1 by comparison of signal areas (O2 consumption) with those of known standard solution of glucose. All analysis was performed in duplicate, with a percentual error threshold of 5%. Total COD analysis was performed by direct analysis of 100 μL. For soluble COD determination, 1 mL sample was centrifuged at 5000 RPM for 5 minutes. The soluble part was separated and 100 μL of it was injected in a LAR’s COD analyzer QuickCOD calibrated with glucose standard solutions.
2.1.5 Volatile Fatty Acids (VFA) analysis
Volatile fatty acids (VFA) analysis was performed following method from Ghidotti et Al. [29] with slight modification. In a GC vial (volume 2mL): 100 μL of sample, 100 μL saturated solution of KHSO4, 100 μL saturated solution of NaCl, 100 μL of 2-ethyl butyric acid at 1000 ppm in deionized water as Internal Standard, 1 mL of dimethyl carbonate (DMC) were added. The solution was hand-shaken and 1 μL of the supernatant was injected at 250 °C in splitless mode in a GC-7820A Agilent Technology coupled with MSD 5977E detector. Column type: DB-FFAP from Agilent Technology. The method starts from 50 °C for 10 minutes then 10°C*min-1 up to 250 °C without holding time. Detection was performed by MSD 5977E detector under electron ionization at 70 eV with full scan mode acquisition at 1 scan *s-1 in the 29-450m/z range. The response factors (RF) of the VFA were obtained from a standard solution prepared in
16
laboratory from pure VFA. RF and the concentration of the different analytes were obtained with Equation 1 and Equation 2:
𝑔𝐶𝑂𝐷𝑥 𝐿 ⁄ =𝐴𝑟𝑒𝑎𝑥 𝐼𝑆𝑎𝑟𝑒𝑎 ∗ 𝑚𝐼𝑆 𝑅𝐹𝑥 ∗ 𝐶𝑂𝐷𝑥 𝑆𝑎𝑚𝑝𝑙𝑒 𝑉𝑜𝑙𝑢𝑚𝑒 Equation 1 𝑅𝐹𝑥 = 𝐴𝑥 𝐴𝐼𝑆 ∗ 𝑚𝐼𝑆 𝑚𝑥 Equation 2
When the RF of a substance was not known, a similar compound RF was applied.
2.1.6 Aldehydes
Aldehydes analysis was performed as Busetto et Al. [30] adapted to the purpose through liquid-liquid DMC extraction. Briefly, in a GC vial (volume 2mL): 100 μL of sample, 100 μL saturated solution of KHSO4, 100 μL saturated solution of NaCl, 100 μL of 2-ethyl butyric acid at 1000 ppm in deionized water as Internal Standard, 1 mL of dimethyl carbonate (DMC) were added. The solution was mixed, and 0.500 mL of the supernatant was taken and mixed with 0.500 mL of methanol and some Amberlyst® (previously washed under methanol). The mixture was sonicated for 10 minutes and 1 μL was injected at 250 °C in spitless mode in a GC-7820A Agilent Technology with a DB-FFAP column from Agilent Technology. The method starts from 50 °C for 5 minutes then 10°C*min-1 up to 250 °C and holds for 10 minutes. Detection was performed by MSD 5977E detector under electron ionization at 70 eV with full scan mode acquisition at 1 scan *s-1 in the 29-450m/z range. The RF was determined from a solution of 1 g*L-1 of glycolaldehyde dimer from
Sigma-17
Aldrich. The chromatograms were integrated using TIC integration. RF was obtained with Equation 1 and Equation 2.
2.1.7 Silylation
Aldehydes analysis was performed as Busetto et Al. [30]. In a GC vial (volume 2mL): 100 μL of sample were dried under nitrogen. In the vial were then added: 100 μL of N,O-Bis(trimethylsilyl)trifluoro-acetamide with trimethyl- chlorosilane (BSTFA), 100 μL acetonitrile, 50 μL of 3-chlorobenzoic acid as IS at 1000 ppm in acetonitrile, and 10 μL of pyridine. The solution was heated at 75 °C for 1.5 hours. After 0.5 mL of ethyl acetate was added in the vial and 1 μL was injected at 280°C in splitless mode in a GC-6850 Agilent with an HP-5MS column from Agilent Technology. The initial temperature was set at 50 °C for 5 minutes, then 10 °C*min-1 up to 325 °C held for 10 minutes. Mass spectra were recorded under electron ionization (70 eV) at a frequency of 1 scan*s-1 within the m/z 50–450 range. A standard solution for the main categories was prepared from Sigma-Aldrich pure compounds. RF and the concentration of the different analytes were obtained with Equation 1 and Equation 2
2.1.8 HPLC-SEC
The sample was filtrated with a nylon 6-6 filter at 0.20 μm and 20 μL were injected with an Agilent 1200 series G1328B manual injector into an HPLC composed by an Agilent 1200 series TCC G1316A with PL aquagel-OH-20 column, an Agilent 1200 series DAD G1315D detector, and an Agilent 1260 Infinity II G7162A 1260 RID detector. Different standards of Poly-ethylene Glycol were prepared in water and analyzed to obtain a calibration (200, 400, 1450, and 3500 Da). The data were collected both in RID and DAD detectors.
18
2.1.9 Ash content
Approximately 1 g of sample was weighted in a calibrated ceramic vessel, previously dried at 550°C for 10 minutes. The sample was left at 550°C for 30 minutes and the residual material was weighted.
2.1.10 Moisture
Approximately 1 g of sample was weighted inside a calibrated ceramic crucible, previously dried at 105°C for 30 minutes, and was left to dry at 105°C for one hour. The sample was then weighted to determine the difference in weight.
19
2.2 Determination of the Potential Fermentable COD in Pyrolysis Products
Fir sawdust was selected as a model woody feedstock. Elemental analysis, moisture, and Ash content (Paragraphs 4.1, 4.10, and 4.11) were used to characterize the initial biomass. COD was then determined by elemental analysis using Equation 3:
𝑔𝐶𝑂𝐷 𝑔 = 𝐶 12∗ 32 + 𝐻 2 ∗ 16 − 𝑂 Equation 3 Where: - C: is the %wt of carbon - H: is the %wt of hydrogen - O: is the %wt of oxygen
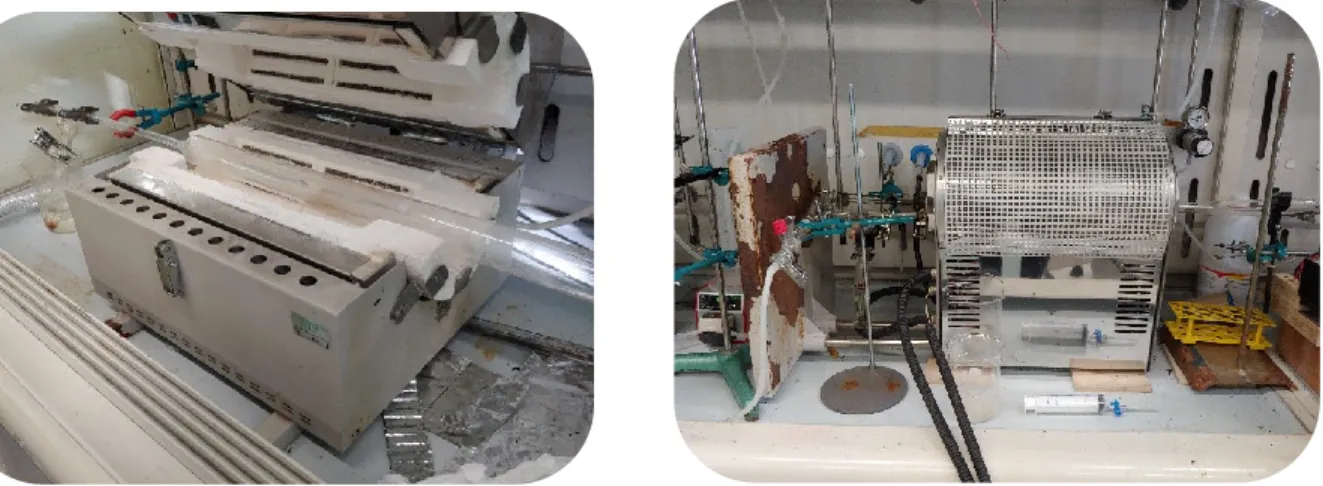
Different carriers (N2 and CO2) and pyrolysis chambers, namely 20 mm diameter (D20) and 50 mm (D50) were investigated. The functional scheme of the experimental apparatus and a short description of the components are shown in Figure 3 and Table 1 :
20
Table 1. Description of the pyrolysis experimental components
Component Details
External source of carrier N2 99% or pure CO2 source Furnace T controller Carbolite HST 12/300
Py reactor Tubular quartz pyrolizer
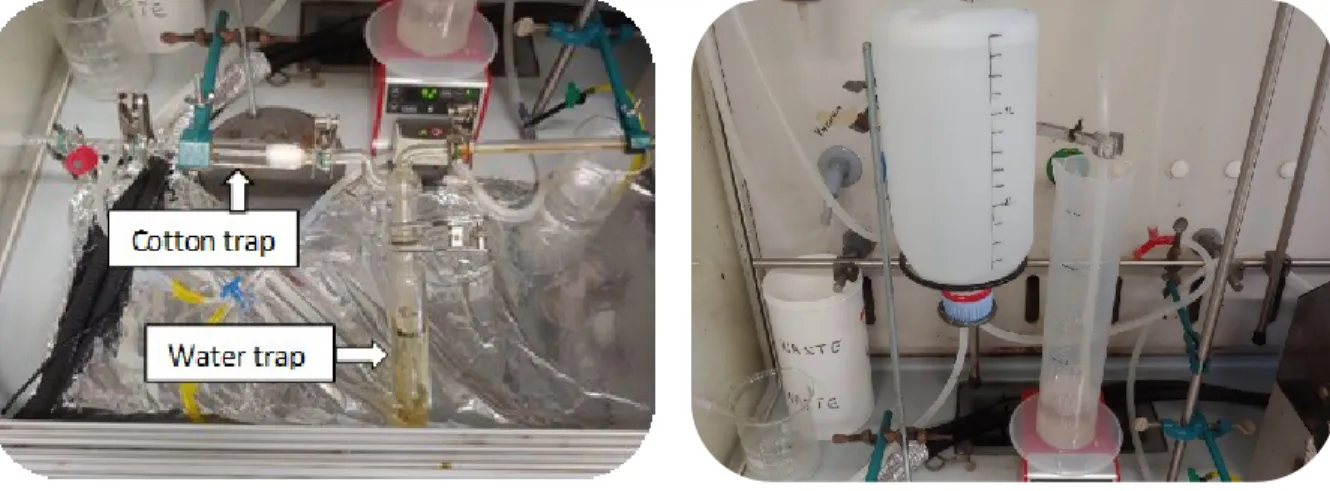
WS trap Quartz bubbler with 50 mL of distilled water at environmental temperature WI trap Quartz pipe with pressed cotton in one
end
Gas sampling Pierceable septum
Peristaltic pump Watson Marlow, 100 series cased pump
21
Gasometer Upside-down bottle used to collect the extra gas from the pyrolysis
Volume control Graduated cylinder
Water Tap water used to fill the gasometer bottle
The two pyrolizers used were:
- fixed bed quartz tubular reactor (TR) able to carry up to 5 g of biomass in an internal quartz vessel (D50)
- Fixed bed quartz tubular reactor with an internal quartz cylinder able to carry around 2.5/3.0 g of biomass (D20)
Both pyrolizers were externally heated by an electrical furnace (Figure 4). The pyrolysis procedure is here described:
1. Weighted biomass was placed in the sample holder (in the pyrolizer), then the system was closed.
2. Traps for Water-soluble and Water-Insoluble were prepared and connected 3. All the sealed system was preliminarily filled with 2 L (1 L/min for 2 min) of
carrier gas, using an external source, leaving opened the gas sampling cap. 4. The system was switch to recirculation mode (no dilution) and a peristaltic
pump was used for the gas recirculation, with a flow of 0.1 L*min-1.
5. The sample was inserted in the hot zone and there left for the length of the experiment.
6. After the experiment, the sample was withdrawn from the hot zone and cooled. A gas sample was immediately taken for the GC-TCD analysis.
7. Once cooled down, biochar was weighted.
8. The solution in the WS trap (typically a turbid orange/yellowish solution) was drawn and used to wash the WI trap, this allows to filter the particles in solution from WS trap. The tubular reactor was washed with distilled water
22
and collected together with the WS solution, after filtration. The filtered solution obtained was defined as WS pyrolysis products
9. Acetone was used to wash the heavies WI in the glass walls (WS trap, pyrolizer, and pipes) and WI trap (cotton filter), thus allowed to obtain a dark brown solution which was evaporated overnight under N2, yielding WI.
With the same procedure, different conditions were investigated:
1. Two steps, one hour each: starting at 350 °C for one hour then 13°C*min-1 up to 550 °C until the second hour (only with the larger pyrolizer)
2. One hour at 550°C (with both D20 and D50 different carrier gases)
Figure 4. On the right: larger fixed-bed quartz tubular reactor (D50); on the left: smaller fixed bad quarts tubular reactor (D20)
The gas produced was collected by means of a water displacement gasometer as those shown in Figure 5, Figure 6, and Figure 7.
23
A U-shape pipe was used to retain water inside the gasometer maintained at atmospheric pressure. The gas produced was collected at the top of the gasometer, with the consequent spill of an equal amount of water in a graduated cylinder. Immediately after the pyrolysis, the gas analysis was performed to determine H2, CH4, CO2, and CO. The COD of the mixture was calculated using Equation 4 and
Equation 5.
Figure 6. Hydraulic gasometer Figure 5. Water-soluble and water-insoluble
traps
24 𝐶𝑂𝐷𝑝𝑦 𝑔𝑎𝑠𝑒𝑠 = ∑ 𝑔𝐶𝑂𝐷𝑔𝑎𝑠 𝑖 𝑛 𝑖 =1 Equation 4 𝐶𝑂𝐷𝑔𝑎𝑠 𝑖 = %𝑉 𝑔𝑎 𝑠𝑖 𝑥 𝑉(𝑟𝑒𝑎𝑐𝑡𝑜𝑟𝑠+𝑔𝑎𝑠𝑏𝑎𝑔) 𝑥 𝑔𝐶𝑂𝐷 𝑖 𝐿 ⁄ Equation 5
Biochar was collected and weighted. The COD was determined with Equation 6 using the average COD obtained from elemental analysis:
% 𝐶𝑂𝐷 𝑌𝑖𝑒𝑙𝑑𝐵𝑖𝑜𝑐ℎ𝑎𝑟 = 𝑚𝐵𝑖𝑜𝑐ℎ𝑎𝑟 ∗ 𝐶𝑂𝐷𝐵𝑖𝑜𝑐ℎ𝑎𝑟 𝑚𝐵𝑖𝑜𝑚𝑎𝑠𝑠 ∗ 𝐶𝑂𝐷𝐵𝑖𝑜𝑚𝑎𝑠𝑠
Equation 6 WS yield of COD was determined with Equation 7.
% 𝐶𝑂𝐷 𝑌𝑖𝑒𝑙𝑑𝑊𝑎𝑡𝑒𝑟 −𝑆𝑜𝑙𝑢𝑏𝑙𝑒 =𝑉𝑜𝑙𝐹𝑖𝑛𝑎𝑙 𝑠𝑜𝑙𝑢𝑡𝑖𝑜𝑛 ∗
𝑔𝐶𝑂𝐷 𝑊𝑎𝑡𝑒𝑟−𝑆𝑜𝑙𝑢𝑏𝑙𝑒 𝐿
𝑚𝐵𝑖𝑜𝑚𝑎𝑠𝑠 ∗ 𝐶𝑂𝐷𝐵𝑖𝑜𝑚𝑎𝑠𝑠
Equation 7
WI yield was determined with Equation 8:
% 𝐶𝑂𝐷 𝑌𝑖𝑒𝑙𝑑𝑊𝑎𝑡𝑒𝑟−𝐼𝑛𝑠𝑜𝑙𝑢𝑏𝑙𝑒 = 𝑚𝑊𝑎𝑡𝑒𝑟−𝐼𝑛𝑠𝑜𝑙𝑢𝑏𝑙𝑒 ∗ 𝐶𝑂𝐷𝑊𝑎𝑡𝑒𝑟−𝐼𝑛𝑠𝑜𝑙𝑢𝑏𝑙𝑒 𝑚𝐵𝑖𝑜𝑚𝑎𝑠𝑠 ∗ 𝐶𝑂𝐷𝐵𝑖𝑜𝑚𝑎𝑠𝑠
Equation 8
25
%𝐶𝑂𝐷𝑓𝑒𝑟𝑚𝑒𝑛𝑡𝑎𝑏𝑙𝑒𝑠 = %𝐶𝑂𝐷𝑊𝑆+ %𝐶𝑂𝐷𝑊𝐼+ %𝐶𝑂𝐷𝐻
2+ %𝐶𝑂𝐷𝐶𝑂 Equation 9
The analyses made are summarized in Figure 8. All the analysis methods can be found in Chapter 2.1.
26
2.3 Anaerobic digestion of pyrolysis products and Hydrogen
From preliminary tests (Annex 5.1), Water-Insoluble component was not considered for the degradation tests. Biotrickling bed reactor was selected for the gas and liquid fermentation. Three reactors were built from a 0.5L Pyrex bottle, each with a cap built with four smaller tight pipe holder’s caps (Figure 9). Two exits were used for the liquid recirculation and liquid sampling, one for the gas inputs and one for the gas sampling. Different filling materials were used for the reactors.
Figure 9. Four tight pipes holder cap
Liquid recirculation was made with a 220 L h-1 electrical centrifugal pump. The liquid was drawn from the bottom through a reinforced multi-layer pipe and pumped, through another multi-layer pipe, at the top of the reactor, where branched tees were used to sprinkle the liquid onto all fixed bed top surface. To minimize gas leaks, all multi-layer pipes were made with silicone pipe coaxially placed around the aluminum foil and polyamide pipe, as shown by Figure 10. Such pipe, as well as all fast-joint pneumatic valves used, were leak tested prior to the utilization. Leak tests were performed using hydrogen as test gas. The pipes were filled with the gas and the initial amount of hydrogen was detected by GC-TCD analysis. After one day the gas concentration inside the pipes was again analyzed to evaluate the leaks.
27
Figure 10. Section of the polyamide pipe upgraded to guarantee the tightness
Table 2 shows the effect of a multi-layer structure on the leaks of manufactured pipe, highlighting the large improvement obtained with the definitive configuration.
Table 2. Results of the leak test with different types of polyamide pipes
Info Delta time Volume H2 variation Air variation H2 leaks Air input h mL % % mL/h mL/h Simple pipe 16 6,2 -37,2% 29,6% -0,1441 0,1147 Pipe upgraded 23,5 6,2 0,8% -1,9% 0,0020 -0,0050
The temperature was controlled through a digital thermostat temperature controller (XD-W2308, DC 12V, accuracy: ±0.1°C), coupled with two electrical pads attached to the reactor glass wall. For the gas amount control and record, three digital gasometers were developed with Arduino Mega and an Ultrasonic Sensor HC-SR04, designed with AutoCAD 3D®, then printed in ABS with a WASP 3D printer (Figure
28
Figure 11. Digital gasometer developed with WASP 3D printer
Digital gasometers were calibrated up to 600 mL (Figure 12).
Figure 12. Calibrations of the digital gasometers
The final design of the reactor and the final disposition are shown in Figure 13 and Figure 14. Due to the four caps configuration, the reactors were named “Tetrapods”.
29
Figure 13. Final design of the “Tetrapod” reactor (From Yusuf Küçükağa)
30
To leak test the reactors, they were filled with hydrogen (70% from initial analysis) and were left operating overnight, to evaluate the leaks. After one day the gas was analyzed, reviling the absence of leaks. The possibility to operate three reactors allowed to organize different experiments in different condition. The experiments carried are summarized in Table 3:
Table 3. Experimental design of the "Tetrapods". Glu=Glucose; Py=Water-Soluble and Syngas from pyrolysis; H2 = Hydrogen addition; WS=Water-Soluble from pyrolysis.
Set Reactor 1 Reactor 2 Reactor 3 Conditions
1 Py, 20 gCOD*L -1+ H2 Py, 20 gCOD*L -1 Glu, 20 gCOD*L-1 pH and methanogens not daily controlled Automatic Feeding system
2 Py, 20 gCOD*L-1 + Biochar Glu, 20 gCOD*L -1+ H2 +Biochar Glu, 20 gCOD*L-1+ H2 pH and methanogens daily controlled 3 WS, 10 gCOD*L -1+ Biochar Glu, 20 gCOD*L -1+ Biochar Glu, 20 gCOD*L-1 pH and methanogens daily controlled
For Set 1, the selected parameters for all the reactor are presented in Table 4:
Table 4. Set 1 Experimental Set-Up Parameters
Reactor Total Volume 621 mL
Glassball Bed Volume 288.4 mL
Total Number of Glassballs 1097 # Total Surface Area of Glassballs Bed 2176.5 cm2
Total Liquid Vol. in the System 200 mL Total Headspace in the reactor 130 mL
31
Digestion of pyrolysis products (Water-soluble and pyrolysis gas) was evaluated without daily control of methanogenesis and pH. Initially, the inoculum was thermically pretreated at 85°C for 60 minutes. The third reactor was fed with glucose, as a control. The target COD was 20 gCOD*L-1 for all three bioreactors, with a total liquid amount of 200 mL for each reactor, weekly checked. Initially, all three reactors were fed with glucose to enrich the biomass inside. In R1 and R2 glucose was used as only feed for 6 days, then in five days a progressive quantity of pyrolysis products was provided (day 7: 7.5%, day 8: 25%, then 50% until the end of the enrichment phase). Semicontinuous mode between pyrolysis and bioreactor was selected. The pyrolyses were made with the same scheme described in Chapter 2.2, WS solution and gases were stored and analyzed as showed in Figure 15. Hydraulic retention time (HRT) selected was 10 days, with an organic loading rate (OLR) of 0.4 gCOD*Day-1, including the feed solution, medium, extra liquids, and syngas. At the start-up, all the reactors were enriched in biomass, for one week, providing glucose. The pyrolysis products fractions of the OLD were composed of 90% WS and 10% syngas. For the reactors that also included hydrogen, extra COD was provided, starting with an extra 10% COD then gradually increased, to avoid total uptake. For all three sets, hydrogen was produced with a Hoffman’s voltameter, filled with 4%wt of Na2SO4 solution, stored in a laminated gasbag. Daily, gas samples and 20 mL of liquid samples were taken and analyzed as described in Figure 15 (analysis methods can be found in Chapter 2.1).
32
For the weekends, on Friday were removed and added three times the volumes. The inoculum selected was a mixed consortium from an anaerobic digestor of agricultural wastes. Between the first and second Set, to avoid the stop of the experiment due to the Christmas pause, an automatic system was developed, with the control of the feeding, and the gas discharge with Arduino. The liquid level inside the reactors was maintained with a U-shape pipe. The scheme of the automatic feeding system is
presented in
Figure 16, the Arduino script for the control of this system can be found in Chapter 5.2.
33
Figure 16. Scheme of the automatic feeding system developed
Set 2 was characterized by the control of pH and methanogens activity, providing 2-bromoethanesulphonate (BES). The first and second reactors were refilled, using an inoculated biochar to evaluate the possible detoxification effect. Biochar from orchard pruning pyrolysis (from Romagna Carbone) was added inside a mixed consortium inoculum sludge for 30 minutes, then filtrated and 100 g were added in the reactors. To prevent the recirculation of the biochar through the liquid pump, two layers of glassballs were added below the char, the first with 4 mm diameter glassballs (325 g) and the second with 7.8 mm diameter glassballs (200 g). The third reactor was left as Set 1 experiment. The liquid recirculation was shifted from continuous mode into a pulsing mode, using Arduino Mega and Elegoo IT-EL-SM-005 8 relay module, with 5 seconds of pumping and 15 of pause, for all the bioreactors (script in Chapter 5.4). All the other parameters for the conduction of the experiment were left equal, included the initial procedure of biomass enrichment with glucose. The first reactor, in the last ten days of the experiment was left in a “batch mode”, in which no feed was provided, and 1 mL of liquid sample was daily withdrawn for the analysis. Set 3 experiments
34
lasted nine days. Reactor 2 and 3 were directly shifted into Set3 experiment, without any stop or reinoculation. Also, R1 was directly shifted and fed with only WS solution, providing micro reinoculations (1 mL*Day-1) after 10 days. For the methanogens control, lovastatin effect was investigated instead of BES. Target COD was changed to 10 gCOD*L-1 only for R1, as well as OLR fixed at 0.2 gCOD*Day-1.
For each reactor of each set, a balance of input and output for one RT was done, together with the VFA yield in the output liquid. Daily variation of gases was tracked, considering the input and output of the system. Inside COD for each day was obtained knowing the total input, output, and COD of the previous day. The difference between the expected COD and measured COD of the liquid was daily calculated. pH trend was daily tracked. For Set 3, the analysis available for R1 was investigated to have a more comprehensive understanding of the degradation that occurred.
35
3 Results
3.1 Review of the pyrolysis products yield
As abovementioned, one of the aims of this thesis is to evaluate pyrolysis as a pretreatment to increase the bioavailability of organic material. Given that chemical oxygen demand (COD) is a direct measure of chemical energy of feedstock, this parameter was specifically targeted for the first time.
In order to define the characteristic of analytical procedure and to have a preliminary broad range for COD yields (gCODproduct/gCODfeedstock), existing literature about pyrolysis (slow and fast) was used to obtain the characteristic COD partition among bioavailable (water-soluble and gas) and not-bioavailable (water-insoluble and char) pyrolysis products. Large literature available was firstly shortlisted, selecting papers in which both the accurate yield of pyrolysis products and adequate characterization of thereof (e.g. energy content of pyrolysis products) were performed. The selected studies focus on the lignocellulosic biomass, mainly wood sawdust and corn stalk. Both slow and fast pyrolysis were investigated evaluating the effect of temperature, reactor type, biomass, and heating rate. Not all the studies contain a complete mass balance, full energy repartition, nor the COD determination. Where that information where missing, data were back-calculated using:
- The theoretical amount of chemical oxygen demand (gCOD/g) from the other papers and stoichiometric calculation (from elemental analysis).
- Higher Heating Value (HHV, MJ/kg) of feedstock or products, then converted to COD through Equation 10.
𝑔𝐶𝑂𝐷 𝑔
=
𝐻𝐻𝑉(𝐾𝐽𝑔 ) 13,94( 𝐾𝐽 𝑔𝐶𝑂𝐷)Equation 10
36
3.1.1 Slow pyrolysis yield
Slow pyrolysis is typically associated with a higher mass yield of charcoal, due to the usually lower heating rate and high pyrolysis vapor residence time [4]. Several types of pyrolysis conditions (reactor, temperature, etc.) on similar biomass were considered, to reach wider data and to get a more comprehensive average in the results. The papers considered and the main information on the type of experiment are reported in the following Table 5:
Table 5. Main information of the selected paper for Slow Pyrolysis
Py Type Biomass Reactor T
(°C) car
rier Ref
SLOW Betula pendula Batch reactor 450
[31]
SLOW Betula pendula Batch reactor 450
SLOW Betula pendula Batch reactor 450
SLOW Corn stover Horizontal
screw-conveyer 450
[32] SLOW Corn stover Horizontal
screw-conveyer 450 SLOW Corn stover Horizontal
screw-conveyer 450 SLOW Corn stover Horizontal
screw-conveyer 550 SLOW Corn stover Horizontal
screw-conveyer 550 SLOW Corn stover Horizontal
screw-conveyer 550 SLOW Corn stover Horizontal
screw-conveyer 650 SLOW Corn stover Horizontal
37
SLOW Corn stover Horizontal
screw-conveyer 650
SLOW Beechwood Updraft reactor 550 N2
[12]
SLOW Beechwood Updraft reactor 550 N2
SLOW Beechwood Updraft reactor 650 N2
SLOW Cedrus deodara sawdust Laboratory scale
reactor 350 N2
[33] SLOW Cedrus deodara sawdust Laboratory scale
reactor 400 N2 SLOW Cedrus deodara sawdust Laboratory scale
reactor 450 N2 SLOW Cedrus deodara sawdust Laboratory scale
reactor 500 N2 SLOW Cedrus deodara sawdust Laboratory scale
reactor 550 N2 SLOW Cedrus deodara sawdust Laboratory scale
reactor 600 N2 SLOW Cedrus deodara sawdust Laboratory scale
reactor 650 N2 SLOW Panicum virgatum L Laboratory fixed-bed
reactor 300 N2
[34] SLOW Panicum virgatum L Laboratory fixed-bed
reactor 300 CO
2 SLOW Panicum virgatum L Laboratory fixed-bed
reactor 400 N2 SLOW Panicum virgatum L Laboratory fixed-bed
reactor 400 CO
2 SLOW Panicum virgatum L Laboratory fixed-bed
reactor 500 N2 SLOW Panicum virgatum L Laboratory fixed-bed
reactor 500 CO
2
38
SLOW Oak sawdust Tubular reactor 500 N2
SLOW Oak sawdust Tubular reactor 600 N2
SLOW Oak sawdust Tubular reactor 700 N2
SLOW Calophyllum inophyllum
wood bark Fixed bed batch reactor 550 [13] SLOW Oak and beech sawdust
pellets
Rotary kiln pyrolysis
reactor 700
[35] SLOW Oak and beech sawdust
pellets
Rotary kiln pyrolysis
reactor 800 SLOW Oak and beech sawdust
pellets
Rotary kiln pyrolysis
reactor 900
SLOW Corn Stalk Auger reactor 350
[36]
SLOW Corn Stalk Auger reactor 400
SLOW Corn Stalk Auger reactor 450
SLOW Corn Stalk Auger reactor 500
SLOW Corn Stalk Auger reactor 550
SLOW Corn Stalk Auger reactor 600
Most of the studies considered provided an adequate characterization for biochar, gases, Water-Insoluble fraction (e.g. somewhat mentioned as tar), and Water-Soluble fraction. The average COD distribution for the slow pyrolysis is shown in Table 6:
Table 6. % COD Yield of Slow Pyrolysis Slow Pyrolysis Results
Unit Average SD COD Yield
Biomass gCOD/g 1,29 0,07 -
Char wt% 33,1% 9,1% 49,8%
gCOD/g 1,94 0,10
Liquid wt% 39,9% 11,0% 32,8% gCOD/g 1,06 0,71
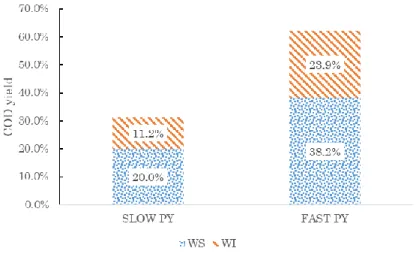
39 WS wt% 18,2% 3,6% 20,0% gCOD/g 1.42 0.10 WI wt% 9,1% 1,6% 11,2% gCOD/g 1,60 0,17 Gas wt% 27,4% 9,9% 5,0% gCOD/g 0,23 0,14 Other-Loss 12,38%
Looking to COD balance, 50% of the chemical energy is partitioned into biochar, 33% ends up in the condensable liquid (20% into WS and 11% into WI liquid) and just 5% end up in pyrolysis gas (mostly carbon monoxide, hydrogen, and methane). For most of the slow pyrolysis studies a significant part of COD is missing (12%) suggesting that, especially with simple equipment used for slow pyrolysis, there is a significant entrance of oxygen in the system and/or product loss.
This COD partition reveals some interesting features that are not clear when yields are evaluated on a dry mass basis. First, even if analyzed papers reveal a 33% mass yield for biochar (which is in line with general pyrolysis literature [4]), the solids retain roughly half of the chemical energy processed by slow pyrolysis. The remaining part of chemical energy is partitioned into condensable products and, in minimal part, into gas. According to this data, even if slow pyrolysis is the simpler process, bioavailable compounds should be considered a “co-product” of char, which is clearly the main target of slow pyrolysis. Without considering losses, if we look to the relative abundance of bioavailable (WS and gas) and non-bioavailable volatile pyrolysis products (excluding char), the partition generally follows the holocellulose/lignin partition of feedstock. In conclusion, slow pyrolysis favors biochar formation without a significant effect on WS/WI ratio.
40
3.1.2 Fast pyrolysis yield
Fast pyrolysis is characterized by a higher mass yield of liquid products and a less mass yield of char and gas. For this reason, is widely studied to produce biofuels. According to Bridgewater [4], char and gas products should have an energy yield respectively of 25 and 5 % with an energy loss, due to the process heat requirement, around 15%. The papers considered and the main information on the type of experiment are reported in Table 7:
Table 7. Main information of the selected paper for Fast Pyrolysis PY
TYPE BIOMASS REACTOR T (°C) carrier Ref
FAST Southern pine sawdust
Auger-fed fast pyrolysis
reactor 538 N2 or He
[37] FAST Southern pine
sawdust
Auger-fed fast pyrolysis
reactor 593 N2 or He FAST Southern pine
sawdust
Auger-fed fast pyrolysis
reactor 649 N2 or He FAST Southern pine
sawdust
Auger-fed fast pyrolysis
reactor 704 N2 or He FAST Southern pine
sawdust
Auger-fed fast pyrolysis
reactor 760 N2 or He FAST Southern pine
sawdust
Auger-fed fast pyrolysis
reactor 816 N2 or He
FAST Quercus alba Entrained flow reactor 500 N2 [8] FAST Pinus strobus
sawdust
Bubbling fluidized-bed
reactor 400 N2
[38] FAST Pinus strobus
sawdust
Bubbling fluidized-bed
reactor 500 N2
FAST Pinus strobus sawdust
Bubbling fluidized-bed
reactor 600 N2
41
FAST Arbour pellet Rotating drum reactor 450 FAST Pinewood Rotating cone reactor 510 FAST Arbour pellet Rotating drum reactor 450 FAST Oakwood Continuous auger
reactor 450
[39] FAST Pinewood Continuous auger
reactor 450 FAST Oak bark Continuous auger
reactor 450 FAST Pine bark Continuous auger
reactor 450
FAST Oak/maple Ensyn process Canada [40]
FAST Oakwood NREL vortex reactor 625 [41]
FAST Maple oak Ensyn from RTP facility 525 [42]
FAST Softwood bark Vacuum pyrolysis 500 [43]
FAST Softwood bark Fluidized bed [44]
FAST Firwood Rotating cone reactor
[45] FAST Beachwood Rotating cone reactor
FAST General wood Ensyn transported bed FAST Pine sawdust Batch induction
pyrolysis system e 500 N2
[46] FAST Pine sawdust Batch induction
pyrolysis system e 550 N2 FAST Pine sawdust Batch induction
pyrolysis system e 600 N2 FAST Pine sawdust Batch induction
pyrolysis system e 650 N2 FAST Pine sawdust Batch induction
pyrolysis system e 700 N2
FAST Beechwood Fluid bed reactor 500 N2 [47]
FAST Poplar 2 years Fluid bed reactor 500 N2
[48] FAST Poplar 12 years Fluid bed reactor 500 N2
42
FAST Douglas Fir Wood Auger reactor 500 [49]
FAST Beechwood Fluidized bed 500 N2
[10]
FAST Spruce wood Fluidized bed 500 N2
FAST Wheat straw Fluidized bed 500 N2
The results are presented in Table 8:
Table 8. % COD Yield of Fast Pyrolysis Fast Pyrolysis Results
Unit Average SD COD Yield Biomass gCOD/g 1,30 0,06 - Char wt yield 16,6% 4,9% 28,9% gCOD/g 2,27 0,15 Liquid wt yield 45,0% 15,3% 49,1% gCOD/g 1,42 0,29 WS wt yield 40,7% 11,5% 38,2% gCOD/g 1,21 0,38 WI wt yield 16,4% 2,6% 23,9% gCOD/g 1,88 0,22 Gas wt yield 32,1% 17,9% 5,7% gCOD/g 0,23 0,14 Other-Loss 16,18%
Looking to COD balance, 29% of the chemical energy is partitioned into biochar, 49% ends up in the condensable liquid (38% into WS and 23% into WI liquid) and 6% ends up in pyrolysis gas (mostly carbon monoxide, hydrogen, and methane). As observed for slow pyrolysis, for most of the fast pyrolysis studies a significant part of COD is missing (12%).
For fast pyrolysis, most of COD ends up in the liquid. Merging liquid and gas (whose mass yields are almost identical to that obtained with slow pyrolysis) the overall COD
43
yield is equal to 60%. Interestingly the WS fraction has an average COD similar to that of anhydro sugars or cellulose (e.g. 1.2 kgO/kg), while the WI part shows an average COD closely similar to that of lignin (more than 2 kgO/kg). This suggests that WS derives mainly from carbohydrates and dehydrated carbohydrates, whereas WI came from lignin. The ratio of bioavailable and non-bioavailable volatile (excluding char) pyrolysis products is close to that observed with slow pyrolysis and, again close to holocellulose/lignin ratio.
3.1.3 Pyrolysis Review Conclusions
As shown by the data collected (Figure 17 and Figure 18), fast pyrolysis is more effective in producing bioavailable substances, since the COD yield of bioavailable products is higher. Fast pyrolysis is selective toward condensable organics. Increasing heat transfer rate has the net effect to decrease char COD yield and increases liquid products, both soluble organics (WS) and insoluble lignin-derived constituents (WI). It is interesting to notice that a variable quantity between 10 and 16 % of the COD yield is missing, probably due to experimental loss and the difficult detection and trapping of all the pyrolysis products. Interestingly, when gases were quantified reveals that COD yield of this fraction is relatively low (usually less than 6%). This suggests that the common practice of evaluating the gas yield by difference is not adequate and tends to provide higher gas yields, which are an artifact of the method used. Given this, a larger effort should be targeted in closing exactly the mass or, at least, the energy balance (or, even better, COD balance) of the pyrolysis.
44
Figure 17. % yield of COD in slow and fast pyrolysis products
Figure 18. % Yield of COD in the liquid fraction of slow and fast pyrolysis
3.2 Results of the pyrolysis products characterization
3.2.1 Ultimate analysis of feedstock and pyrolysis products
In total two biomass samples, five biochar samples, and twelve WI samples were characterized using elemental analysis, ash content, and moisture methods (Chapter 2.1). The results are shown in Table 9:
45
Table 9. Biochar and Water-Insoluble Elementary Analysis
Biomass Char WI
Average ± Average ± Average ±
gCOD*g-1 1.16 0.06 2.28 0.08 1.85 0.20 C 44.8% 1.7% 82.7% 2.5% 61.9% 4.8% H 5.8% 0.0% 2.6% 0.4% 6.5% 0.3% O 49.4% 1.7% 12.1% 2.3% 31.4% 5.0% N 0.0% 0.0% 0.1% 0.1% 0.2% 0.1% S 0.0% 0.0% 0.0% 0.0% 0.0% 0.0% Ash 0.30% 0.02% 1.2% 0.2% Moisture 8.5% 0.4%
From elemental composition, biomass had a theoretical oxygen demand (thereafter called COD) content of 1.16 ± 0.04 gCOD*g-1 with a typical content of carbon and oxygen close to that of carbohydrates. Biochar shows a higher COD and content of carbon, respectively 2.28 ± 0.02 gCOD*g-1 and 82.7% gC/g, with a negligible quantity of nitrogen and sulfur. WI is characterized by a COD of 1.85 ± 0.1 gCOD*g-1, in line with the results of the literature reviewed in Chapter 3.1.
3.2.2 COD balance of the different pyrolysis
One of the aims of this thesis was to establish the partition of chemical energy (measured by COD yield) that occurs upon pyrolysis. To provide a description of pyrolysis as pre-treatment a set of pyrolysis experiments were performed, and COD balance, namely COD yield of each pyrolysis product, was established. In total ten pyrolyses experiments were performed: three stepwise pyrolyses (350°C+550°C steps) and N2 as carrier (A), three pyrolyses with one step and N2 as carrier in the D50 pyrolizer (B), two pyrolyses with one step in the D20 pyrolyzer (C), and two pyrolyses with one step in D50 pyrolyzer with CO2 as carrier (D). Molecular composition (for gas), elemental analysis (for char and WI), and direct COD analysis (WS) provided a direct measure of chemical energy partition into different pyrolysis products. COD
46
yields of various non-bioavailable (Char and CH4), sparingly fermentable (WI), and fermentable (WS, H2, and CO) pyrolysis products are shown in Table 10.
Table 10. % COD yield from different pyrolysis of sawdust, respect biomass COD:
A B C D
Average ± Average ± Average ± Average ± Char 46.5% 0.5% 37.0% 2.4% 42.9% 2.1% 36.6% 0.9% WS 31.7% 5.1% 35.8% 5.0% 37.1% 0.1% 35.6% 1.4% WI 9.7% 2.0% 15.0% 2.5% 12.9% 2.9% 14.6% 3.4% H2 0.2% 0.1% 0.1% 0.0% 0.1% 0.1% 0.5% 0.0% CH4 5.0% 1.0% 4.8% 0.3% 2.8% 0.1% 4.1% 1.3% CO 8.6% 2.7% 8.2% 0.6% 6.8% 0.2% 9.9% 0.1% Total 101.7% 7.4% 100.9% 0.4% 102.5% 5.2% 101.1% 2.2% Fermentable 50.2% 9.8% 59.1% 8.2% 56.9% 3.3% 60.5% 4.9%
A first observation is that, once the method was optimized, all the COD balances (Σ gCODproducts/gCODfeestock) obtained were close to 100%. Two steps pyrolysis showed a significant decrease of fermentable COD yield (more than 5%) in comparison with the other experiments, mainly due to the higher COD yield of char and lower COD yield of WS and WI. One-step pyrolysis, with D50 pyrolizer, didn’t highlight any significant difference between the carriers, with a fermentable COD yield of 60% in both cases. The D20 pyrolizer provided a higher COD yield of char than the D50, however, the fermentable COD yield did not change significantly. On the other hand, D20 reactor produces a slightly higher WS yield. This suggests that the main differences between D20 and D50 were related to WI recovery, due to different reactor shapes and pyrolysis chamber size. Even if CO2 suggests that the composition of pyrolysis gas can be relevant for COD yield, since the use of nitrogen is characterized by procedural advantages, the one-step pyrolysis with nitrogen was chosen as the most suitable model system for the subsequent laboratory experiments. Given the minor differences between DN20 and DN50, the DN20 reactor one was used due to the simplified procedure of pyrolysis products recovery and reactor cleaning.
47
3.2.3 Analysis of Water-Soluble fraction from pyrolysis: HPLC-SEC
To establish the relative amount of low molecular weight WS (analyzable with GC-MS and more prone di biodegradation) and high molecular weight WS (non GC detectable and with unknown structure), HPLC-SEC was performed on WS fraction. Specifically, a detailed analysis was performed on WS obtained from D50 pyrolizer, one step pyrolysis with N2 as carrier, and WS faction obtained from D20, and one step pyrolysis with N2 as carrier. The results, presented %Area of eluted compounds, are shown in Table 11.
48
Table 11. %Area distribution of the WS components
D50 pyrolizer D20 pyrolizer MW Area% ± Area% ± <200 Da 60.2% 0.2% 53.4% 0.5% 200-400 Da 6.9% 0.5% 5.9% 0.1% 400-1450 Da 9.9% 1.0% 7.0% 0.3% 1450-3350 Da 3.3% 0.4% 6.4% 0.0% >3350 Da 19.8% 1.1% 27.2% 0.1%
The results showed that low molecular weight compounds (<200 Da ) constitute roughly half of WS, which is in line with the literature concerning detailed WS analysis [50]. Noticeably, D50 pyrolyzer produced a higher amount of low molecular weight compounds than D20. This is probably due to the higher heat transfer achieved or to the improved recovery of high molecular weight compounds with DN20. The remaining part of the WS was formed by compounds with molecular weights between 200-3350 Da, and especially oligomers and high molecular weight (>3350 Da) compounds, which represent more than 20% of WS, with unknown structure. Further investigation, through the use of UV-VIS detector (DAD), was performed in order to provide some clues on the chemical nature of complex higher-weight molecules detected. The results from DAD analysis are presented in Figure 19.
49
Figure 19. HPLC-SEC RID and DAD (UV-VIS) results for WS sample obtained from one-step pyrolysis with N2, in the D50 pyrolizer
50
Looking to DAD detector, the fraction with a molecular weight higher than 3350 Da, shows a characteristic peak at 266 nm. This is a typical absorbance of furans, suggesting the presence of dehydrated furanosides or humins-like structures in these high molecular weight constituents [51]. Other peaks were detected at 292 and 348 nm, assigned to carbohydrates-like structure, suggests that this fraction of WS is formed by a complex hybrid polymeric matter which includes polysaccharides and “charred” polysaccharides with some degree of dehydration leading to furanic structure.
3.2.4 Analysis of Water-Soluble fraction from pyrolysis: Volatile Fatty Acids (VFA) With the VFA method, acetic acid, propionic acid, butyric acid, hexanoic acid, and hydroxy acetone (acetol) were detected and quantified. The response factor (RFs) used were all determined by standard solutions of pure compounds. The theoretical COD (from the molecular structure) of each compound was finally used for the determination of the COD yield. Results are presented as COD yield respect the WS COD content (COD/CODWS), in Table 12:
Table 12. % COD yield, respect WS COD, of compounds detected with VFA method
D50 pyrolizer D20 pyrolizer Compound Average ± Average ±
Acetic Acid 1.5% 0.3% 1.6% 0.1% Propionic Acid 0.3% 0.0% 0.3% 0.1% Butyric Acid 0.1% 0.0% 0.1% 0.0% Hexanoic Acid 0.1% 0.2% 0.0% 0.0% Acetol 3.0% 1.7% 1.8% 0.0% Total 5.0% 2.2% 3.9% 0.1%
Although variable, on COD basis, Acetol resulted the major detected compound, corresponding to 1.3 - 4.7% of the COD of WS in D50 pyrolyzer. Acetic acid was the major VFA in WS, and constituted 1.5% and 1.6% (gCOD/gCODWS) of WS respectively with, D50 and D20 pyrolizer. In total, the 5% yield (COD/CODWS) and 3.9%,
51
respectively for D50 and D20 reactor, were detected using this method. The results, although expressed on COD basis, are in line with those that can be back-calculated from the literature [9], [12], [14].
3.2.5 Analysis of Water-Soluble fraction from pyrolysis: Aldehydes
This method was developed to analyses reactive aldehydes like hydroxy acetaldehyde, which are usually poorly analyzable with direct GC-MS, due to reactivity with other sample constituents. Methoxylation was used to convert hydroxy acetaldehyde into corresponding dimethyl acetal. The response factor (RF) of the compound was obtained from hydroxy acetaldehyde dimer by Sigma-Aldrich. Results, presented as %COD yield from the WS fraction, are summarized in Table 13.
Table 13. %COD yield of hydroxy acetaldehyde in WS solution
D50 pyrolizer D20 pyrolizer Average ± Average ±
16.2% 0.1% 13.8% 0.1%
The analysis shows that hydroxy acetaldehyde was a major pyrolysis product of wood pyrolysis, with 16.2% and 13.8% COD yield (COD/CODWS) respectively for DN20 and DN50 reactor. Results are in line with other studies performed with similar methodologies [9]. Then, with an overall COD/CODfeedstock of more than 5%, hydroxy acetaldehyde is one of the major compounds obtained from the pyrolysis of fir sawdust.
3.2.6 Analysis of Water-Soluble fraction from pyrolysis: Silylation-GC-MS
Silylation allows the extension of GC-MS analysis to a large amount of highly polar compounds which are present in WS. All the peaks detected were quantified (to have