Alma Mater Studiorum - Università di Bologna
SCUOLA DI SCIENZE
Dipartimento di Chimica Industriale “Toso Montanari”
Corso di Laurea Magistrale in
Chimica Industriale
Classe LM-71 - Scienze e Tecnologie della Chimica Industriale
Crystallization behaviour of poly(lactide) in
immiscible blend with poly(ε-caprolactone),
comparison with solution and melt-mixed blends
Tesi di laurea sperimentale
CANDIDATO
Greta Giacobazzi
RELATORE
Prof. Daniele Caretti
CORRELATORE
Prof. Alejandro J. Müller
Dott. Matteo Rizzuto
___________________________________________________________________________________________________________ Anno Accademico 2016-2017
ABSTRACT
Poly(ε-caprolactone)-poly(carbonate) based copolymers, both block and random, were synthetized and characterized by 1H-NMR spectroscopy. The copolymers have been tested as compatibilizers in 80/20 (w/w%) PLA/PCL blends prepared both by melt and solution mixing. The concentration of PCL-PC based copolymer added to the blends was 2 wt%. Compression moulded sheets and solvent cast films were evaluated by GPC (Gel Permeation Chromatography), TGA (Thermogravimetric Analysis), SEM (Scanning Electron Microscopy), PLOM (Polarized Light Optical Microscopy), DSC (Differential Scanning Calorimetry). The addition of the copolymers does not cause an increased miscibility in PLA-PCL phases since a reduction of PLA-PCL particles size is not detected in SEM micrographs. At the same time, upon copolymers addition PLA’s Tg value does
not decrease in both melt and solution mixed blends.
Copolymers addition causes a reduction of molecular weight in melt mixed blends. In particular, the random copolymer (PCL-ran-PC) causes the highest reduction molecular weight in melt mixed blend, since it is characterized by the lower thermal stability as shown in TGA analysis. As result, PLA phase within melt mixed blends containing PCL-PC based copolymers shows a higher tendency to crystallize during both isothermal and non-isothermal DSC experiments. The increased crystallization of PLA phase is attributed to an increase in spherulitic growth kinetics determined by PLOM analysis. Upon molecular weight reduction in melt mixed blends containing copolymers, PLA chains have a higher mobility resulting in an improved motion towards the growing crystal front.
SUMMARY
1. INTRODUCTION ... 1 1.1. Crystallization of polymers ... 1 1.1.1. Background ... 1 1.1.2. Crystallization kinetic ... 2 1.1.3. Avrami theory ... 4 1.2. PLA ... 6 1.2.1. Bioplastics ... 6 1.2.2. PLA synthesis ... 6 1.2.3. PLA properties ... 91.2.4. Thermal and hydrolytic degradation of PLA ... 10
1.2.5. PLA crystallization ... 11
1.3. Crystallization of PLA phase within miscible and immiscible blends ... 12
1.4. Poly(lactide) (PLA)/Poly(ε-caprolactone) blends ... 14
1.5. Compatibilizers ... 15
2. OBJECTIVE OF THE THESIS ... 16
3. EXPERIMENTALS ... 18
3.1. Materials and methods ... 18
3.2. Synthesis of PCL-PC based copolymers ... 19
3.3. Blends preparation ... 20
3.4. Spectroscopic analysis ... 21
3.5. Molecular weight analysis ... 21
3.6. Morphological analysis ... 21
3.7. Thermal analysis ... 22
4. RESULTS AND DISCUSSION ... 24
4.1.1. Introduction ... 24
4.1.2. Reaction screening ... 26
4.1.3. Synthesis... 27
4.2. Characterization of PCL-PC based copolymers... 28
4.2.1. Spectroscopic characterization ... 28
4.2.2. Thermal characterization ... 33
4.3. Characterization of PLA/PCL based blends ... 35
4.3.1. Preparation of the blends ... 35
4.3.2. Molecular weight analysis ... 36
4.3.3. Thermogravimetric analysis ... 38
4.3.4. Morphological analysis ... 40
4.3.5. Non-isothermal DSC analysis - Cooling from the melt state... 44
4.3.6. Non-isothermal DSC analysis - Second Heating ... 47
4.3.7. Spherulitic growth kinetics of PLA phase ... 50
4.3.8. Isothermal overall crystallization of PLA phase ... 53
5. CONCLUSIONS ... 61
1
1. INTRODUCTION
1.1. Crystallization of polymers
1.1.1. Background
The crystallization of polymers is a dynamic process associated with partial alignment of theirs molecular chains into ordered crystals. During crystallization, molecular chains that are in a highly disordered random state fold together and form ordered regions called lamellae.
In the melt state, polymers are long molecular chains which form irregular coils. In amorphous polymers such structure is retained upon cooling, whereas in crystalline polymers the chains rearrange upon freezing and form partly ordered regions.
However, also in crystalline polymers not all the chains can align forming a perfect crystal, but amorphous regions are included within crystalline domains (Figure 1.1).
Figure 1.1: Schematic representation of ordered regions surrounded by the amorphous phase.
The tendency of a polymer to crystallize depends on its molecular structure: a constitutional, configurational and conformational regularity is required. At the same time, the type of crystal (size, number and structure) depends on several parameters, such as the molecular characteristics, composition, molecular weight and the processing conditions (like the crystallization temperature and cooling time).
2
For instance, in a crystalline polymer, the ordered area has a higher refractive index than the amorphous one, so crystalline polymers are usually opaque because of light scattering on the boundaries between one area to the other. At the same time, also thermal stability, strength and rigidity of a polymer are influenced by its crystallinity, since in a crystalline structure the molecular chains are closely packed and thus are more organized to support thermal and mechanical stress.1
The degree of crystallinity is an important factor affecting the biodegradability of a polymer. Amorphous phase is more easily liable to enzymatic degradation since the molecules are loosely packed; on the other hand crystalline phase is much more resistant to enzymatic attack.2
1.1.2. Crystallization kinetic
The crystallization process consists of two consecutive phenomena: nucleation and crystal growth.
Nucleation of a crystal starts with the formation of small-sized areas where a group of molecular chains or their segments occur aligned. These seeds can either dissociate, if thermal motion destroys the molecular order, or grow further forming the crystal.
Since the alignment of chains occurs at low molecular mobility, the greater is the degree of supercooling from the melt state, the most favourable will be the formation of nuclei.3
Taking into account the site where the formation of nuclei starts in the amorphous phase, homogeneous and heterogeneous nucleation can be distinguished.
Homogeneous nucleation is a spontaneous process in which molecular chains occur parallel because of slow motion due to the supercooling. On the other hand, heterogeneous nucleation occurs at the surface of impurities, plasticizers, fillers and other additives present in the polymer matrix and, thus, a lower supercooling is required.1
Taking into account how the nuclei are formed, is it possible to distinguish two types of nucleation depending on the crystallization temperature: instantaneous and sporadic nucleation.
3
At low crystallization temperature (Tc) and thus high supercooling nucleation is
instantaneous and many nuclei are formed at the same time. In this condition, a lot of crystals of small size are formed.
On the other hand, at high crystallization temperature (low supercooling), nucleation is sporadic and the formation of nuclei occurs at different time. In this case, few crystals of large size are formed, since the growth rate becomes higher than the nucleation one.4
Consecutive to nucleation is the crystal growth that is achieved by further addition of folded polymer chain segments. It only occurs at temperatures below the melting temperature (Tm) and above the glass-transition temperature (Tg). In
proximity of Tm the molecular mobility is too high preventing the alignment of the
chains whereas close to the Tg the melt-viscosity limits chains diffusion to the
growth front.1
Figure 1.2 shows a comparison between nucleation rate (I) and crystal growth rate (G).3 It can be appreciated that both the nucleation and the crystal growth exhibit a bell-shape trend with a maximum depending on crystallization temperature.
Figure 1.2: Schematic representation for the primary nucleation rate (I) and crystal growth rate
(G) as a function of the isothermal crystallization temperature. Adapted from Lorenzo and Müller.3
As shown, nucleation is enhanced at higher supercooling since the alignment of chains occurs at low molecular mobility, whereas crystal growth is favoured at higher temperature being governed by the chains mobility to the growth front. If the overall crystallization rate is determined by differential scanning calorimetry (DSC) the contribution of both nucleation rate and crystal growth rate are considered resulting in a bell-shaped trend as shown in Figure 1.3.
4
Figure 1.3: Overall crystallization rate as a function of temperature.
Values obtained from isothermal overall crystallization data are reported as the inverse of half-crystallization time (1/t50%) and consider both the nucleation rate
and the crystal growth rate.
1.1.3. Avrami theory
Avrami theory allows describing the crystallization kinetics of polymeric materials.5 Data obtained from isothermal crystallization experiments can be fitted by the Avrami equation which can be expresses by the following6:
c e p (t t )n Eq.1.1
Where t is the experimental time, t0 is the induction time, Vc is the relative
crystallinity volumetric fraction, k is the overall crystallization rate constant and n is the Avrami index value that is related to both nucleation and crystal growth. The Avrami index value gives information about how the nuclei are formed and the morphology of the crystals, being the results of these two contributions. As previously explained nucleation may be instantaneous or sporadic. The contribution to the Avrami index value (n) is 0 when the nucleation is instantaneous whereas it is 1 when the nucleation is sporadic.
On the other hand, crystals formed during crystallization could have one, two or three dimension producing a contribution of 1, 2 or 3 respectively in the n value. By the sum of these two contributions the Avrami index value n is calculated. The relative volume fraction crystallinity Vc is calculated according to Equation
5
c c c c
a( c)
Eq. 1.2
Where Wc is the relative crystallinity mass fraction, c is the density of fully
crystalline material and a is the density of fully amorphous material.
The relative crystallinity mass fraction can be calculated by direct volume measurements or isothermal DSC experiments.
By isothermal DSC experimental, Wc is calculated according to the following
equation:
c
(t)
T T Eq. 1.3
Where Δ (t) is the enthalpy value of crystallization as a function of crystallization
time and T T is the enthalpy value after completion of the crystallization
process.
Applying the logarithmic properties, the Avrami equation (Eq. 1.1) can be rearranged as follows:
log[ ln ( c)] log( ) n log (t t ) Eq. 1.4
Plotting log[- ln ( - c)] as a function of log (t-t ) the values of k and n can be
obtained.
By the Avrami theory is possible to determine the half-crystallization time 1/t50%
that is calculated by the following equation:
t [ ln[ c] ] n ⁄ Eq. 1.5
6
1.2. PLA
1.2.1. Bioplastics
One of the fastest-growing materials sectors of the global plastic industry is the production of commodities from renewable resources, referred to as bioplastics.7,8
The main driver is the interest in reducing use of petroleum as a feedstock, under the pressure of its contribution to climate change, its pricing variability and its occasional role as a political weapon. By the way, the growth interest for bioplastics is connected to clear benefits for customers and environment, such as the consumer demand for more environmentally-sustainable products or the extra end-use benefits upon recent legislative development, as the ‘‘green ta ’’ of Germany or the new environmental regulations in Japan.9
At the moment, mostly due to their high price level and low performance in comparison with conventional petrochemical counterparts, the number of competitive bioplastics is rather limited and only a few of them are both biodegradable and biobased.
Lignin and thermoplastic starch blends (TPS) have been received increasing attention as a source for value-added products but are still relatively underused.10
On the other hand, poly-lactic acid (PLA) and poly-hydroxyalkanoates (PHA) are well established biopolymers, commercially available, with a promise market increase.
1.2.2. PLA synthesis
Poly(lactic acid) (PLA) is a biobased, biodegradable and biocompatible aliphatic polyester widely used in biomedical field (i.e. sutures, clips, plates and screws or in drug delivery devices)11 and in food packaging applications.12,13
The basic monomer of PLA is lactic acid (LA), also named 2-hydroxypropanoic acid. Lactic acid is chiral, consisting of two optical isomers. One is known as L-(+)-lactic acid and the other is D-(-)-lactic acid (Figure 1.4).
7
Figure 1.4: Optical isomers of lactic acid: L(+)-lactic acid and D-(-)-lactic acid.
The optical purity of lactic acid is a crucial parameter in PLA crystallization. As the optical purity of LA is lowered, the PLA capacity of crystallization decreases failing the configurational regularity.
Lactic acid is mainly produced with two methods: chemical synthesis from petrochemical feedstock and bacterial fermentation of carbohydrates.
The majority of the produced LA is obtained by bacterial fermentation of natural feedstocks.14
Starting from the lactic acid monomer, the synthesis of poly(lactic acid) can proceeds by two different routes of polymerization: direct polycondensation of the monomer and ring-opening polymerization through a cyclic intermediate named lactide.
From these two routes, derives a common misunderstanding in PLA nomenclature. Poly(lactic acid) refers to PLA obtained by polycondensation, poly(lactide) refers to PLA obtained by lactide intermediate.
Direct polycondensation of lactic acid involves the removal of water by condensation and allows obtaining only low molecular weight polymer, mainly because of the presence of water and impurities. One possible solution to increase its molecular weight is the use of chain extending or coupling reagents. Although this process is the most economic route to obtain PLA, the presence of unreacted chain extending produces a drastic alteration of biodegradability. Another possible solution to increase the molecular weight of PLA is the direct condensation of LA in solution in which water is continuously removed by the azeotropic distillation. Although high molecular weight can be achieved, this polymerization requires high concentration of catalyst that could cause degradation of the final product and toxicity.15
The most established method to obtain high molecular weight PLA is the ring-opening polymerization (ROP) through the lactide intermediate.16 In this process, lactic acid is firstly polymerized to oligomers by removing water from the reaction
8
medium. In a second step, oligomers are catalytically depolymerized to form a cyclic intermediate dimer which is then purified. Finally, through ring opening polymerization, poly(lactide) is obtained.17 (Figure 1.5)
Figure 1.5: Schematic representation of PLA synthesis through direct polycondensation or ring
opening polymerization.
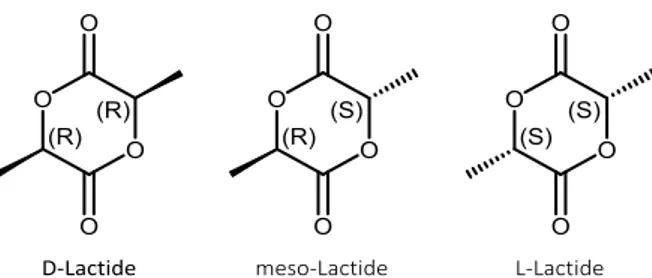
Lactide exists in three different forms: D-lactide, L-lactide and meso-lactide (Figure 1.6). Only D-lactide and L-lactide are optically stereoisomers able to produce stereoregular PLA.
Figure 1.6: Different forms of lactide: D-lactide, meso-lactide and L-lactide.
The crystalline polymers coming from pure L- or pure D-lactide feed are referred to PLLA and PDLA respectively, the meso-PLA is obtained from DL-lactide while amorphous PDLLA is obtained from the random distribution of the D and L isomers in the macromolecular chains.18
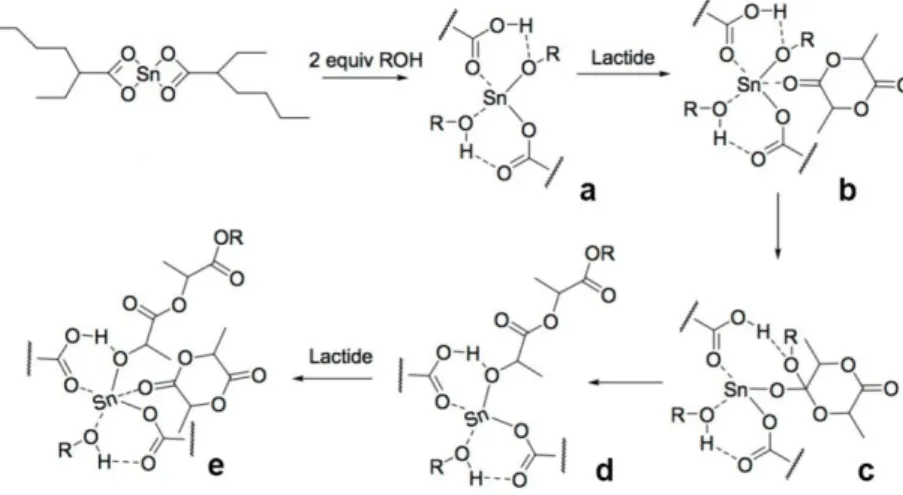
Tin (II) octanoate (Sn(Oct)2) is the most common catalyst used for lactide
9
catalytic activity and ability to favour the formation of high molecular weight polymers ( above than 100.000) with low level of racemization (<1%).
Ring opening polymerization proceeds through a coordination-insertion mechanism shown in Figure 1.7. Molecular modelling suggests that two molecules of an alcohol (ROH) exchange with the octanoate to form tin (II) alkoxides (a). Subsequently, the insertion occurs in two steps which are a nucleophilic attack of the alkoxide on the monomer (b,c) followed by ring opening (d) and propagation (e).19
Figure 1.7: Coordination-insertion mechanism of Sn(Oct)2 in catalyzed polymerization of
L-lactide.
1.2.3. PLA properties
The physical properties of PLA, including melting temperature, degree of crystallization and mechanical properties but also degradation behaviour strongly depend on its molecular weight as on its stereochemical composition.15
PLLA homopolymer obtained from pure L-LA has an equilibrium crystalline melting point (Tm0) of 207 °C and a glass-transition temperature (Tg) about 60 °C.
However, commercially available PLA usually shows a melting point of 170-180 °C due to the slight racemization, impurities and imperfect crystallites. Stereochemical defects reduce PLLA melting point and its extent of crystallization until a roughly 15% of defects incorporation which results in an amorphous polymer.20
Despite of PLA good mechanical properties, transparency and biodegradability, its very low impact strength value and its brittleness limit its applications.
10
One key factor in extending PLA usage derives from the control of its crystallization rate. Since in its amorphous form the range of application of PLA is severely limited by its low glass transition temperature, an increase of its crystallization speed is desired. At temperatures greater than PLA’s Tg only the
crystalline PLA phase can confer useful mechanical properties. Thus, the crystalline form is required to increase the temperature resistance of the material as well as to improve mechanical properties. However, PLA has a slow crystallization rate resulting in longer processing time if crystalline sample is desired.21
1.2.4. Thermal and hydrolytic degradation of PLA
Poly(lactic acid) is a degradable polyester susceptible to hydrolytic and thermal degradation.22 At the same time, PLA is biodegradable, a characteristic that makes it particularly interesting for no durable applications, as biomedical use or food packaging.23
The chains scission at room temperature proceeds by hydrolysis of the ester linkages, promoted by moisture, heat or presence of residues (metal catalyst or unreacted monomers).24
At high temperature, PLA undergoes through thermal degradation. This process can be attributed to hydrolysis by trace amounts of water but also to (a) zipper-like depolymerisation, (b) oxidative random main-chain scission, (c) intermolecular transesterification to monomeric and oligomeric esters, and (d) intramolecular transesterification to monomer and oligomer lactides of low Mw.25
Therefore a careful control of the processing conditions must be taken in order to conserve the final properties of the material (i.e., crystallization behaviour, mechanical and rheological properties).26
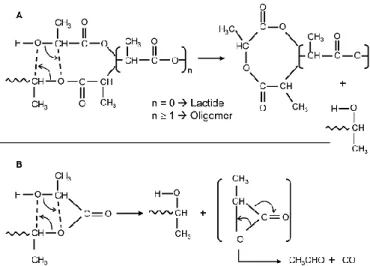
McNeill and Leiper proposed that above 200 °C PLA can degrade through a “bac biting” ester interchange reaction involving the -OH chain ends. Depending on the point in the backbone at which the reaction occurs, the product can be a lactide molecule, an oligomeric ring, or acetaldehyde and carbon monoxide.27 The formation of acetaldehyde is expected to increase with increasing processing temperature due to the increased rate of the degradation reactions.
11
The acetaldehyde generated during melt processing of PLA must be minimized if PLA has to be used for food packaging.28
At the same time, the formation of lactide due to depolymerization is undesirable since it causes the reduction of PLA melt viscosity and elasticity.
Figure 1.8: Thermal degradation of PLA. Adapted from McNeill and Leiper.27
1.2.5. PLA crystallization
A considerable amount of poly(lactic acid) properties depend on its degree of crystallinity. Therefore, the study of the PLA crystallization has tremendous relevance from both academic and industrial point of view.
Control of PLA crystallization kinetics is not a trivial issue, since it depends on the relative amount of the two stereoisomeric forms in which lactide exists (i.e., L- or D- lactide) and on its molecular weight. Only if one of the two forms is present in a high enough amount (at least more than 96–97%), PLA is able to develop significant crystallinity. At the same time, only if PLA has an adequate molecular weight can crystallize.
PLA is polymorphic, therefore, depending on crystallization conditions (i.e. crystallization temperature), different crystalline structures can be obtained. Indeed crystallization at temperature above 120 °C, from melt or solution, results in the most common and stable crystal type: the α-form. This structure consists in two antiparallel 103 helical chain segments packed in an orthorhombic unit cell
with 3.3 monomers per turn and a length of the repeating unit of 27.8 nm.
At temperature below 120 °C, α-form can be replaced by pseudohe agonal α’-form. In this case the molecule segments have the same 103 helical chains
12
conformation adopted in α-form but with higher conformational disorder and lower packing density.
ore recent studies demonstrate that the α’-form crystal is preferentially formed only at crystallization temperatures below 100 °C, while in the temperature range of 100-120 °C both α and α’-form can arise.29
The existence of the two different crystal forms is responsible of the particular thermal behaviour. In PLA crystallized at temperatures corresponding to α’-form crystal formation, a small exotherm appears just before the single melting peak, due to the transformation of disordered α’-form to the ordered α-form crystals. On the other hand, when PLA is crystallized at temperature of the two crystals forms coexistence, a double melting peak appears.30
Additional crystals form can be obtained under special processing condition. Hot-drawing melt-spun or solution-spun PLA fibres lead to β-form crystals. β-form crystals whose melting temperature is 10 °C lower than the melting temperature of the corresponding α-form, have an orthorhombic unit cell with six chains in the helical conformation.
At the same time, γ-form crystals are obtained by epitaxial crystallization of PLA in hexamethylbenzene. This crystal structure is characterized by two antiparallel helices in an orthorhombic unit cell.31
1.3. Crystallization of PLA phase within miscible and
immiscible blends
The crystallization of a polymer takes place in a defined temperature range, between the values of the glass transition temperature, Tg, and the equilibrium
melting temperature of the crystallizable polymer, Tm0. Below Tg the chain
mobility is inhibited, while at temperatures near Tm0 the crystal nucleation does
not occur. In a polymer blend the relative position of Tm and Tg depends on the
miscibility between the components. Depending on the favourable specific interaction between the polymeric counterparts, a miscible or an immiscible blend may be obtained.
In a miscible blend, a single-phase system, which combines the properties of the components, is formed. Therefore, the tendency to crystallize of one component
13
can either increase or decrease, depending on the changes of the glass transition and equilibrium melting temperature produced by blending.
In the case that a crystallizable component is blended with a lower Tg miscible
counterparts, its chain mobility during crystallization is higher than before blending, which facilitates the chain motion in the melt towards the growing crystal fronts and the further arrangement of the otherwise stiff chains into the crystals, providing a positive contribution to the spherulitic growth rate.
Typical miscible blends of PLA mixed with low Tg components are:
PLA/poly(ethylene oxide) (PLA/PEO) and PLA/poly(ethylene glycol) (PLA/PEG) blends. In this case the single Tg of the blends is lower than that of neat PLA,
and the spherulitic growth rate increases with increasing composition of the lower Tg polymer counterpart.32
However, because of the small mixing entropy contribution, the polymer pairs are generally not miscible in each other and thus almost all of the commercial blends are immiscible. In this case, the crystallization becomes much more complicated to the effects of phase separation and interface.
Although, the crystallization of each component takes place in domains separated from the other and at temperatures that are almost near the characteristic crystallization temperatures of the neat polymers, large changes can be observed, depending on the degree of dispersion of the minor phase into the matrix, with appearance of fractionated or retarded crystallization phenomena.
The fractionation of crystallization may be observed when the crystallizable component constitutes the dispersed phase, depending on its dispersion degree. At the same time, changes in the primary nucleation density and nucleating activity may also be found due to the occurrence of migration of heterogeneities between the phases in the melt when the interfacial free energy of the impurities within their melt phase is higher than the interfacial energy of those impurities within the other melt phase of the blend. Moreover, changes in the heterogeneous nucleation of a crystallizable component in an immiscible blend may occur due to the effect of surface nucleation at the interface between the phases.33
For instance, Tsuji et al.34 reported that biodegradable poly(glycolic acid) accelerated the overall crystallization of PLLA during both the heating and
14
cooling processes as a polymeric nucleating agent. Zhou et al.35 reported that poly(L-lactide)-b-poly(butyleneterephthalate)-b-poly(L-lactide) (PLA-b-PBT-b-PLA) tri-block copolymer was a potential polymeric nucleating agent for the crystallization of PLLA, as the nucleation density of PLLA spherulites was obviously increased in the presence of 5 wt% of PLA-b-PBT-b-PLA. Pan et al.36 reported that the melt and cold crystallization behaviours of PLLA were accelerated by its blending with poly(vinylidene fluoride) in their immiscible polymer blends, and the enhanced crystallization of PLLA was attributed to the heterogeneously epitaxial and interface-assisted nucleation mechanism. Guo et al.37 found that polyoxymethylene may act as a polymeric nucleating agent for the crystallization of PLLA.
1.4. Poly(lactide) (PLA)/Poly(ε-caprolactone) blends
One of the most extensively used way to improve PLA properties is the physical blending with other polymers. The properties of the resulting polymer blend are tuneable through the choice of blending components and their relative percentage amount.38
Poly(L-lactide)/poly(ε-caprolactone) blend has been extensively investigated due to the biodegradability and mechanical properties of the obtained system.
Poly(ε-caprolactone) is a biodegradable and semicrystalline polyester with a low melting point of around 60 °C and a low glass transition temperature of about -60 °C.39 At room temperature PCL shows low tensile modulus and high elongation at break while PLA presents high Young modulus and low elongation at break. As result, PCL flexibility can compensate PLA brittleness improving its mechanical properties and applications. Although the solubility parameters of PLA and PCL are quite close (i.e., 10.1 (cal/cm3)1/2 for PLA and 9.2 (cal/cm3)1/2 for PCL) there are not specific interaction between the polymer chains that can induce phases miscibility.40 Therefore, the two polyesters are immiscible over a wide range of composition, temperature and molecular weight both when they are melt mixed and solution mixed.
Several methods have been employed to enhance the miscibility between PLA and PCL phases. These include the addition of copolymers, the addition of
15
reactive polymers with functional groups and the addition of low molecular weight chemicals.
1.5. Compatibilizers
In PLA/PCL blends several strategies of compatibilization have been followed in order to improve the miscibility between the two phases.41
Compatibilization allows to a size reduction of the dispersed phase through the reduction of interfacial tension and prevents the coalescence of the dispersed phase stabilizing the formed phase morphology.
The addition of block copolymers is an efficient way to compatibilize polymer blends due to their efficiency to form entanglements with the corresponding phases and their relative low cost in comparison with the other methods of compatibilization.42
Many efforts have been focused on the compatibilization of PLA/PCL blends through the addition of block copolymers of PLA and PCL. Exploiting this kind of copolymers, it is improved the interfacial adhesion between the phases causing a reduction of the dispersed phase size. For instance, Wu et al.43 reported a reduction from 10-15 µm to about 3-4 µm of PCL particle domains within a 70/30 PLA/PCL blend, using a PLA-PCL-PLA triblock copolymer as compatibilizer. Effective results have been obtained also by using copolymers in which one of the two blocks is miscible, but not identical, to one of the blend component. Na et al.44 have extended this approach to block copolymers in which one is PCL while the other one in miscible with PLA. They employed PEG-b-PCL block copolymer to compatibilize PLA/PCL blends and achieve improved mechanical properties upon copolymer addition.
Exploiting the same strategy, Rizzuto et al.45 reported a threefold reduction of PCL particle size in 80/20 PLA/PCL blend by using a diblock copolymer of PLA and PC (miscible with PCL phase).
Also random copolymers are effective as compatibilizer, since the sequential comonomer units can be regarded as short block, miscible with the corresponding blend components. For instance, Choi et al.46 reported a reduction from 10 µm to 3 µm of PCL domains within a 70/30 PLA/PCL upon the addition of the random copolymer PLA-co-PCL at 5%.
16
2. OBJECTIVE OF THE THESIS
Poly(lactide) is one of the most promising substitutes for petroleum based polymers, since it is at the same time bio-based, biocompatible and biodegradable. However, its drawbacks (i.e., slow crystallization rate, low Tg
value, low toughness) are limiting its applications and commercial expansion. One possible solution to improve PLA properties is its blending with another polymer counterpart. In this context, poly(ε-caprolactone) (PCL) is one of the best candidate, being flexible, biodegradable and biocompatible and thus allowing to achieve toughening of PLA without interfering with original applications.
At the same time, upon blending with PCL, PLA crystallization rate could be increased. However, the matter is not a trivial issue since it is dependent on more factors, as the preparation method of the blend and the miscibility between the phases.
In a miscible blend, a single phase system which combines the properties of the neat components is obtained. Therefore, the tendency to crystallize of one component can either increase or decrease, depending on the changes of the glass transition and equilibrium melting temperature expected upon blending. In an immiscible blend, a multiphase system is obtained, whose crystallization rate of each component is strictly related to phase morphology and thus processing conditions, molecular characteristics, and interfacial properties of the blend.
The solubility parameters of PLA and PCL are quite close (i.e., 10.1 (cal/cm3)1/2 for PLA vs. 9.2 (cal/cm3)1/2 for PCL)47, however there are not favourable interactions accounting for their miscibility. As a result, the two polymers are immiscible over a wide range of temperature, composition and molecular weight, as confirmed by many previous studies where the polymers were mixed in solution48–50 or in the melt.51–54
A large effort has been devoted to improve PLA-PCL miscibility. Different kinds of compatibilizers have been proposed, including random copolymers and block copolymers, as well as reactive compatibilization/mixing.
In this work, a detailed investigation into the crystallization behaviour of PLA phase, within 80/20 PLA/PCL immiscible blends, has been carried out under
17
both non-isothermal and isothermal conditions. The compatibilizer effect of PCL-PC based copolymers, both block (PCL-PCL-b-PCL-PC) and random (PCL-PCL-ran-PCL-PC), has been tested. Particular emphasis has been focused on the morphology, crystallization and thermal properties of the blends upon copolymers additions. At the same time, the influence of the processing condition on the morphology of the blend, and thus its crystallization behaviour, has been investigated by preparing the samples by both solution and melt blending.
In the following text, synthesis and characterization of PCL-PC based copolymers will be firstly presented. Secondarily, the effect of the copolymers on PLA/PCL blends, prepared by both solution and melt blending, will be analysed by taking a particular emphasis on the crystallization behaviour of PLA phase.
18
3. EXPERIMENTALS
3.1. Materials and methods
Poly(L-lactide) (PLA, Ingeo index: 4032D, 1.2-1.6 % D-LA isomer, = 180 kDa) was purchased from NatureWorksTM. Before processing it was dried overnight under vacuum at 60 °C to avoid degradation reactions induced by moisture. Poly(ε-caprolactone) (PCL, CapaTM
6800, = 87 KDa) was purchased from Perstorp and was used as received. Poly(carbonate) (PC, TARFLON® IV1900R) was purchased from Idemitsu Chemicals Europe and was used as received. ε-caprolactone (Sigma-Aldrich-CAS Number: 502-44-3) and tin octanoate (Sigma Aldrich-CAS Number: 301-10-0) were used as received. Two different copolymers of poly(ε-caprolactone)-poly(carbonate) with a mass composition of 50/50 (w/w%) were used. These copolymers differ in their structure: PCL-b-PC is a multiblock copolymer and PCL-ran-PC is a random copolymer. Both copolymers were synthetized by ring opening polymerization using tin (II) octanoate as catalyst and toluene as solvent. The detailed synthesis is described in section 3.2.
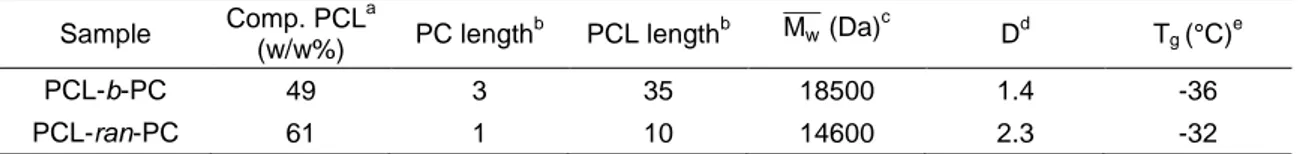
Table 3.1: Molecular characteristics of copolymers. Composition (PCL content w/w%), PC and
PCL units length, average molecular weight ( ̅̅̅̅), polydispersity (D) and glass transition temperature (Tg). Sample Comp. PCL a (w/w%) PC length b PCL lengthb ̅̅̅̅ (Da)c Dd Tg (°C) e PCL-b-PC 49 3 35 18500 1.4 -36 PCL-ran-PC 61 1 10 14600 2.3 -32 a
Composition weight ratio between PCL and PC components determined by 1H-NMR. b Length of PC and PCL units determined by 1H-NMR. c Determined by GPC. d Determined as ̅̅̅̅ ̅̅̅̅. n e
19
3.2. Synthesis of PCL-PC based copolymers
- Poly(ε-caprolactone)-b-Poly(carbonate) (PCL-b-PC)
PCL-b-PC copolymer was synthetized in a 50/50 w/w% composition by a bulk ring opening polymerization using commercial ε-caprolactone and poly(carbonate). A schematic representation of the reaction is shown in Figure 3.1.
In order to e ploit the miscibility of poly(carbonate) in ε-caprolactone a feeding ratio of poly(carbonate)/ε-caprolactone 33/67% was used.
In a three-neck flask 10 g of poly(carbonate) were weighted and, under nitrogen atmosphere, 2 mL of ε-caprolactone were added. The mixture was stirred under nitrogen flux until complete dissolution of poly(carbonate). Maintaining inert atmosphere, 3 mL of Sn(Oct)2 (5 mol catalyst/mol monomer%) and 35 mL of
toluene were added. The reaction mixture was immersed in an oil bath at 120 °C for 2 hours under stirring to allow the polymerization.
The raw products were dissolved in 50 mL of dichloromethane and then poured into 400 mL of methanol. The precipitate collected by filtration was purified by a reprecipitation with dichloromethane and methanol and finally dried through a vacuum pump.
- Poly(ε-caprolactone)-ran-Poly(carbonate) (PCL-ran-PC)
PCL-ran-PC copolymer was synthetized reproducing the same steps as in the synthesis of PCL-b-PC. The two syntheses differ only in the time of reaction and the modality of adding the monomer.
For the synthesis of PCL-ran-PC copolymer, 10 g of poly(carbonate) were weighted in a three-neck flask and, under nitrogen atmosphere, mL of ε-caprolactone, were added. Maintaining inert atmosphere, 3 mL of Sn(Oct)2 (5
mol catalyst/mol monomer%) and 35 mL of toluene were added. The reaction mixture was immersed in an oil bath at 120 °C. After 2 and 4 hours, 5 and 5 mL of ε-caprolactone were added for a total of 20 mL of the monomer. To allow the polymerization the reaction mixture is reacted for 12 hours.
20
3.3. Blends preparation
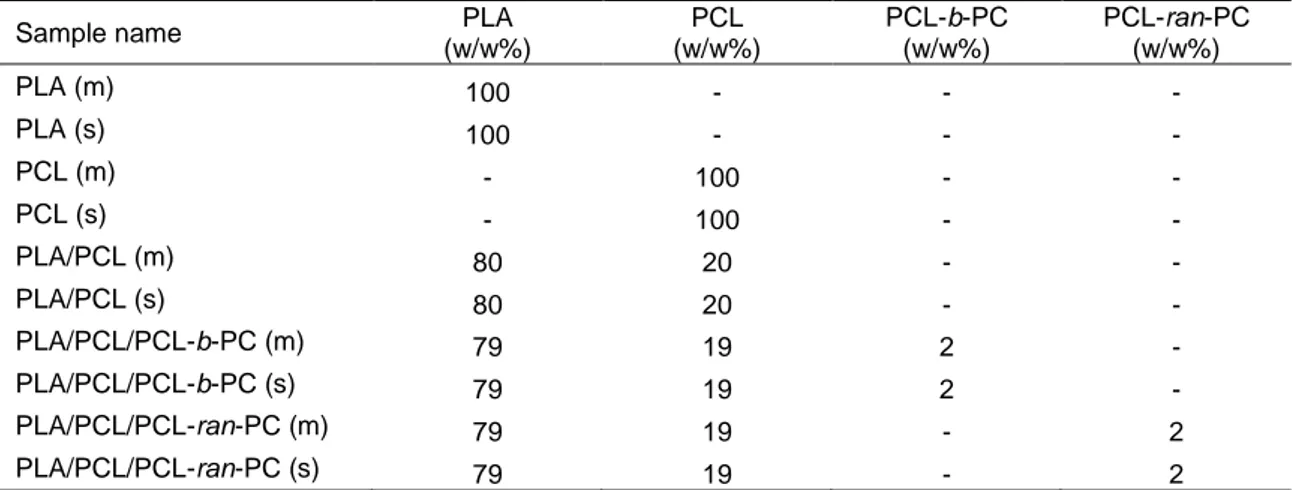
A constant PLA/PCL weight ratio of 80/20 was employed. Block and random copolymers were used as compatibilizer by adding 10% with respect to PCL phase. The composition of the final blends is approximately 80/20/2 PLA/PCL/PCL-co-PC. Table 3.2 reports the composition of the prepared blends.
Table 3.2: Composition of the prepared blends.
Sample name PLA (w/w%) PCL (w/w%) PCL-b-PC (w/w%) PCL-ran-PC (w/w%) PLA (m) 100 - - - PLA (s) 100 - - - PCL (m) - 100 - - PCL (s) - 100 - - PLA/PCL (m) 80 20 - - PLA/PCL (s) 80 20 - - PLA/PCL/PCL-b-PC (m) 79 19 2 - PLA/PCL/PCL-b-PC (s) 79 19 2 - PLA/PCL/PCL-ran-PC (m) 79 19 - 2 PLA/PCL/PCL-ran-PC (s) 79 19 - 2
The blends were prepared by both solution and melt mixing. The ones prepared by solution mixing have been designated with: (s) while the corresponding ones prepared by melt blending have been designated with: (m).
In the first case, PLA, PCL and PCL-PC based copolymers were dissolved in dichloromethane at the concentration of 1 g/dL and stirred at room temperature for 3 hours. The solutions were casted in Petri dishes (diameter = 5 cm) obtaining films that were dried for 24 hours at room temperature and for another 24 hours at 60 °C under vacuum in order to remove any solvent residue.
In the second case, neat homopolymers and the PCL-PC based copolymers were melted and blended in a Collin twin-screw extruder (Teachline, L/D ratio 18, screw diameter 25 mm). Melt blending was performed at a screw speed of 200 rpm, a temperature of 200 °C with a residence time of approximately 1 minute. The extruded filaments were quenched in a water bath and pelletized. The pellets were dried overnight at 60 °C under vacuum and were compression moulded in a Collin P-200-E compression moulding machine at 200 °C (3 minutes without pressure followed by 3 minutes at 100 bar). Tensile testing
21
specimens (ASTM D 638 type IV, average thickness 1.84 mm) of the blends were obtained.
3.4. Spectroscopic analysis
Commercial poly(carbonate) and the synthetized copolymers were analysed by
1
H-NMR experiments. 1H-NMR spectra have been recorded with a spectrometer arian “ ercury 4 ” operating at 4 z on samples prepared in CDCl3 at the
. t . Chemical shifts (δ) for 1
H are given in ppm relative to the know signal of the internal reference (TMS).
3.5. Molecular weight analysis
Block and random copolymers and all the prepared blends were analysed by Gel Permeation Chromatography (GPC).
The samples were analysed by a Waters column with 717 Autosampler equipped with a double detector: aters 2487 Dual λ Absorbance Detector and aters 2410 Refractive Index Detector. The column works at 35 °C using THF as eluent. The samples were prepared at a concentration of about 0.07-0.10 (%w/V) weighting 3.5-5 mg that have been dissolved in 5 mL of THF.
3.6. Morphological analysis
The morphology of the blends was investigated by Scanning Electron Microscopy (SEM).
The tensile test specimens and the films were cryogenically fractured after 3 hours of immersion in liquid nitrogen. Fracture surfaces were observed after gold coating under vacuum, using a Zeiss EP EVO 50 electron microscope equipped with a EDS detector classifiable as Oxford Instrument INCA ENERGY 350 [z>4 (Be), resolution 133eV (MnKa @ 2500cps)].
Micrographs of the most representative inner regions of the specimens were obtained. PCL droplet diameters were measured on at least 100 particles. Number (dn) and volume (dv) average diameters and particles size polydispersity
22 dn ∑ nidi n i ∑ nni i Eq. 3.1 dv ∑ nni idi4 ∑ nni idi Eq. 3.2 Dp dv dn Eq.3.3
where ni is the number of droplets ‘i’ of diameter di.
Polarized Light Optical Microscopy (PLOM) was employed to observe the morphology and growth kinetics of PLA spherulites. Micrographs were recorded by a LEICA DC 420 camera on film samples with a thickness of approximately 10 µm, cut from solvent casted films and tensile test specimens. By using a METTLER FP35Hz hot stage, the samples were firstly heated at 200 °C and held at this temperature for 3 minutes to erase previous thermal histories, and then they were cooled to the crystallization temperature and the isothermal spherulitic growth was followed by PLOM.
3.7. Thermal analysis
The copolymers and all the blends were analysed by Thermogravimetric analysis (TGA) and Differential Scanning Calorimetry (DSC).
The thermal stability of the blends was studied by TGA using a thermobalance TA Instruments, model TGAQ500. All measurements were performed under nitrogen atmosphere and using sample masses of approximately 7 mg. All the samples were heated from 40 to 600 °C at a rate of 10 °C/min.
The thermal behaviour of the blends was studied by DSC using a Perkin Elmer DSC Pyris 1 calorimeter equipped with a refrigerated cooling system Intracooler 2P calibrated with indium. All measurements were performed under nitrogen atmosphere and using sample masses of approximately 5 mg. The analyses were conducted with different methods as a function of the experiments.
23
In non-isothermal analyses, the copolymers were heated from 25 °C to 200 °C at the rate of 10 °C/min and held at 200 °C for 3 minutes to erase the thermal history. Then they were cooled at 10 °C/min until -80 °C (in order to see the glass transition temperature) and finally heated at 10 °C/min to 200 °C.
On the other hand, the blends were heated from 25 °C to 200 °C at the rate of 10 °C/min and held at 200 °C for 3 minutes to erase the thermal history. Then they were cooled at 10 °C/min until -20 °C and finally heated at 10 °C/min to 200 °C. In isothermal analyses, the samples were heated from 25 °C to 200 °C at 20 °C/min and held at this temperature for 3 minutes to erase the thermal history. Then they were cooled at 60 °C/min (in order to avoid PLA crystallization during cooling) to the chosen isothermal crystallization temperature (Tc) and held at this
temperature for 30 minutes while recording the evolved crystallization enthalpy. The isothermal crystallization temperature range was determined by preliminary tests to ensure that no crystallization occurred during the cooling step.
24
4. RESULTS AND DISCUSSION
4.1. Synthesis of PCL-PC based copolymers
4.1.1. Introduction
PCL-PC based copolymers have been synthesized under a precise structure design, upon careful screening of the reaction parameters. A PCL-PC symmetric composition (50/50 w/w%) is desired, in order to maximize the entanglements of each block with both the PLA and PCL phases. At the same time, the copolymers must have an adequate molecular weight to reduce the preferential migration into only one of the blend phases.
The synthesis has been carried out by bulk ring-opening polymerization (ROP), using ɛ-caprolactone and pre-synthetized poly(carbonate) as building blocks and exploiting the solubility of poly(carbonate) in ɛ-caprolactone.
This method is more suitable than the others present in literature (condensation between two suitably functionalized polymer chains, reactive blending of two homopolymers through exchange reactions and chemical modification with postpolymerization)55 in the case that particular emphasis is focused on the final structure of the designed copolymer. In other words, only by ring-opening polymerization is possible to tune the reaction conditions in order to obtain both random and blocks copolymers and, at the same time, achieve a good control on the composition and molecular weight of the resulting polymer.
The reaction proceeds through Sn(Oct)2-catalyzed polymerization of
ɛ-caprolactone onto pre-synthetized poly(carbonate) blocks, instead of the in situ polymerization of both monomers. This is because the formation of poly(ɛ-caprolactone) and poly(carbonate) proceeds at different conditions and therefore is not achievable by a one pot reaction.
The mechanism for a ROP is a three step coordination-insertion mechanism.56 It proceeds through the coordination of a protic reagents such as alcohols with Sn(Oct)2 to form tin (II) alkoxides. Subsequently, the insertion occurs in two steps
which are a nucleophilic attack of the alkoxide on the monomer followed by ring opening (Figure 4.1).
25
In the synthesis of the PCL-PC based copolymers, the protic reagent that reacts with Sn(Oct)2 is the final hydroxyl group of the poly(carbonate) chain. After the
coordination step with formation of tin (II) alkoxide, ɛ-caprolactone insertion occurs, allowing the polymerization of ɛ-caprolactone from poly(carbonate) as shown in Figure 4.2.
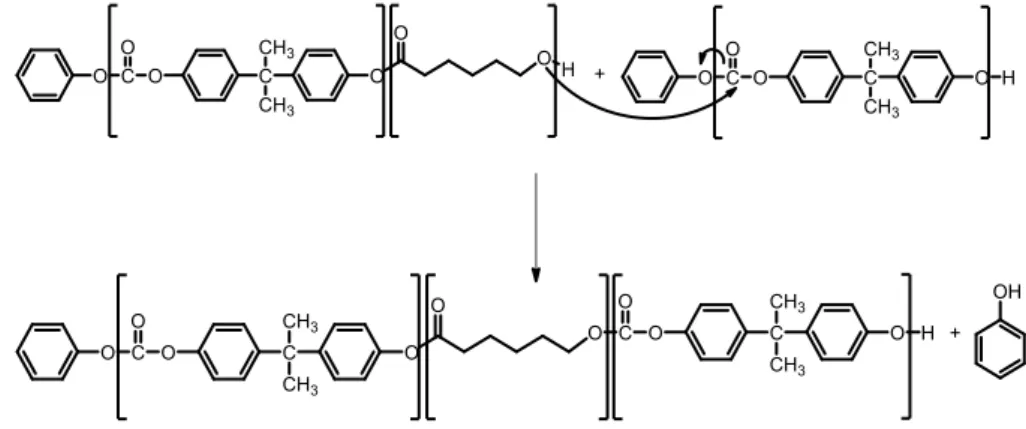
During the polymerization of ɛ-caprolactone, transesterification between the growing chain of poly(ɛ-caprolactone) and carbonate can take place.
Figure 4.3: The transesterification reaction between the growing chain of poly(ɛ-caprolactone)
and the poly(carbonate) chains.
Figure 4.1: Mechanism for the Sn(Oct)2 –Catalyzed ROP of ɛ-caprolactone.
26
This secondary reaction leads to a break in the poly(carbonate) chain with subsequent insertion of a poly(ɛ-caprolactone) block as shown in Figure 4.3. The relative kinetics of both polymerization-transesterification reaction rates must be controlled as a function of the type of desired copolymer design (i.e., random or block).
On one hand, if block copolymer is wanted, transesterification reaction must be avoided, since it induce a shortening of the subsequent blocks of poly(ɛ-caprolactone) and poly(carbonate). Therefore, the polymerization reaction rate must be enhanced over the transesterification reaction rate.
On the other hand, if random copolymer is wanted, only transesterification can lead to the formation of short sequential comonomer units. Therefore, the transesterification reaction rate must be enhanced over polymerization reaction rate.
4.1.2. Reaction screening
The reaction conditions were optimized by a temperature, catalyst amount and time screening. In all the reactions a fixed poly(carbonate)/ε-caprolactone 33/67 w/w% ratio in the feeding was used, in this way it is possible to exploit the miscibility of poly(carbonate) in ε-caprolactone and, therefore, it is possible to carry out the reaction in bulk, with a general advantage of the polymerization rate and process condition.
Table 4.1: Reactions screening of catalyst amount, temperature, time for PCL-co-PC copolymer.
Conversion of ε-caprolactone, composition of poly(ε-caprolactone) in the copolymers and length of poly(carbonate) and poly(ε-caprolactone) units were obtained by ¹H-NMR.
Sample Cat. (mol/mol%) Temp. (°C) Time (h) Solv. (mL) Conv. CL (%) Comp. (PCL w/w%) PC length PCL length 1 5 100 4 10 42 14 14 47 2 5 120 4 10 71 52 4 34 3 1 120 16 5 89 64 2 16 4 5 120 16 5 91 55 2 27 5 5 120 1 5 37 31 6 32 6 5 120 2 5 67 47 4 31 7 5 120 3 5 79 54 4 35 8 5 120 4 5 79 53 3 26 9 5 120 16 5 91 55 2 27
27 Temperature screening
Samples 1 and 2 differ only for the temperature used (i.e.; 100 and 120 °C). To an increase of temperature corresponds an increase in ε-caprolactone conversion. As result, at °C a 4/86 poly(ε-caprolactone)/poly(carbonate) composition is obtained, whereas at 120 °C the composition of 52/48 is reached. Therefore 120 °C has been chosen as the right temperature for the following tests.
Catalyst quantity screening
Samples 3 and 4 were both obtained at 120 °C and differ only for the amount of catalyst used (i.e.; and respect to ε-caprolactone feed). The amount of catalyst doesn’t affect the copolymer composition but its structure. Upon 1% of catalyst the poly(carbonate) transesterification rate is higher than the polymerization rate of ε-caprolactone. As result poly(carbonate) and poly(ε-caprolactone) blocks are shorter. On the other hand, upon 5% of catalyst the polymerization rate is enhanced and therefore longer blocks are obtained.
Time screening
Samples from 5 to 9 were conducted at an increasing polymerization time from 1 to 16 hours. At 1 hour blocks composed of 6 and 32 units of PC and PCL respectively were obtained, however, without reaching the desired composition of 50/50 PCL/PC. This is reached after 2 hours of reaction and the poly(carbonate) block consists of 4 units because transesterification takes place as shown by the sample 6. After 4 hours of reactions (sample 8) the composition doesn’t significantly change but the length of both blocks decreases until 2/27 PC/PCL after 16 hours of reaction (sample 9). The length of the PCL block seems to be smaller because it’s calculated as the average of the bloc s forming the chain.
4.1.3. Synthesis
After screening, reaction conditions were selected in order to obtain a random and a block copolymer with a mass composition equal to 50:50 of PC:PCL. For the block copolymer, the temperature of 120 °C, the 5% of catalyst and the time of 2 hours were selected as shown in Table 4.2, in order to reproduce the
28
sample 6. As reported in Table 4.2, a composition close to 50:50 was achieved and the lengths of the constituent blocks are 3/35 PC/PCL.
On the other hand, the random copolymer was obtained setting 120 °C, a 5% catalyst and 12 hours of reaction. The main difference compared to other reactions is that the monomer has been introduced into the reaction medium by subsequent additions. This system was chosen in order to improve transesterification reaction rather than polymerization avoiding a longer poly(ε-caprolactone) block. In the same way, the transesterification reaction is improved by long reactions time as demonstrated by the previous sample 9. In fact, setting 12 hours as reaction time the block of poly(carbonate) is reduced to 1 unit as shown in Table 4.2.
Table 4.2: Reaction conditions to obtain PCL-b-PC and PCL-ran-PC copolymers. Conversion of
ε-caprolactone, composition of poly(ε-caprolactone) in the copolymers and length of poly(carbonate) and poly(ε-caprolactone) units determined by ¹H-NMR.
Sample Cat. (mol/mol%) Temp. (°C) Time (h) Solv. (mL) Conv. CL (%) Comp. (PCL w/w%) PC length PCL length PCL-b-PC 5 120 2 35 98 49 3 35 PCL-ran-PC 5 120 12 35 75 61 1 10
4.2. Characterization of PCL-PC based copolymers
4.2.1. Spectroscopic characterization
Poly(ɛ-caprolactone)-poly(carbonate) based copolymers were characterized by ¹H-NMR, using the work of Cayuela et al. as reference.57 A preliminary ¹H-NMR spectrum of poly(carbonate) was registered (Figure 4.4). The signals observed at 7.25, 7.17 and 1.68 ppm are assigned respectively to protons A, B and C present in the main chain of poly(carbonate), whereas the signals at 6.70 and 7.40 ppm correspond respectively to proton A₂ (phenolic end group) and B₁ (phenylic end group).
The average number of repeating units of PC chain (n̅), has been calculated considering the ratio between signals of proton in the chain/end groups.
29
Figure 4.4: ¹H-NMR spectrum of poly(carbonate).
The following formula has been used:
n̅ 2 I(C)/6
(I( ) I(A2))/2 Eq. 4.1
where I(C) corresponds to the integral value of protons C representing the total number of PC units while I(B₁) and I(A₂) are the integral values of protons B₁ and
A₂ representing the end groups. The value of repeating units allows to calculate n
̅̅̅̅ 8 g/mol-1
.
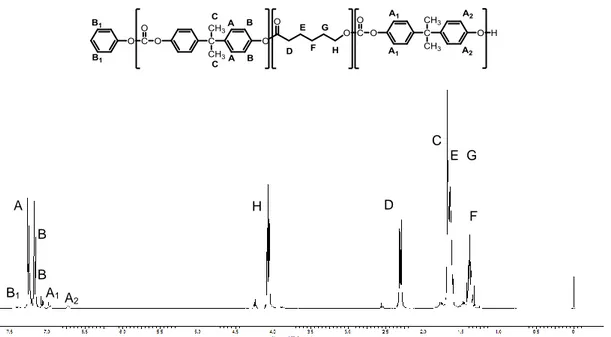
After polymerization of the ɛ-caprolactone, the characteristic peaks of the derived repetitive units are also observable (Figure 4.5). The signals at 1.38, 2.31 and 4.06 ppm are referred respectively to the protons: F, D and H of poly(ɛ-caprolactone) chain. Signals corresponding to the protons E and G of the same segment are overlapped in the spectrum at 1.65 ppm with the poly(carbonate) protons C. The signal at 2.56 ppm is assigned to protons D of the chain end confirming the formation of PC-PCL units, otherwise the signal would have been shifted at 2.31 ppm as previously reported.
C A B A2 B1 11 11 11 1
30
Figure 4.5: ¹H-NMR spectrum of the copolymer of poly(ε-caprolactone) and poly(carbonate)
(PCL-co-PC).
As mentioned above, the signals at 7.25, 7.17 and 1.68 ppm are referred respectively to protons A, B and C present in the chain of poly(carbonate). The doublet at 7.07 ppm is assignable to the B protons of the chain end according to the chemical shift of the equivalent proton in a phenyl ester end-group of a PCL chain.
The signal at 4.24 ppm is assigned to protons H of the chain end of poly(ɛ-caprolactone). The doublet at 6.97 ppm is referred to protons A₁ proving that transesterification reaction occurs. The signal at 6.70 ppm is assigned to protons
A₂ while the peak at 7.40 ppm is assigned to protons B₁ of the poly(carbonate)
phenylic end groups.
It is worth noting that the integral value of the peak at 7.07 ppm is equivalent to the sum of the integrals at 7.40, 6.97 and 6.70 ppm (Figure 4.5) suggesting that in each chain the protons B of the end-chain of poly(carbonate) are present. On the other hand, the poly(carbonate) chain can ends with protons A₁, A₂ or B₁ which are the protons of a phenyl carbonate end group of a PCL chain, of a phenolic end group and of a phenyl carbonate end group respectively.
A B B A2 A1 B1 F C H D E G
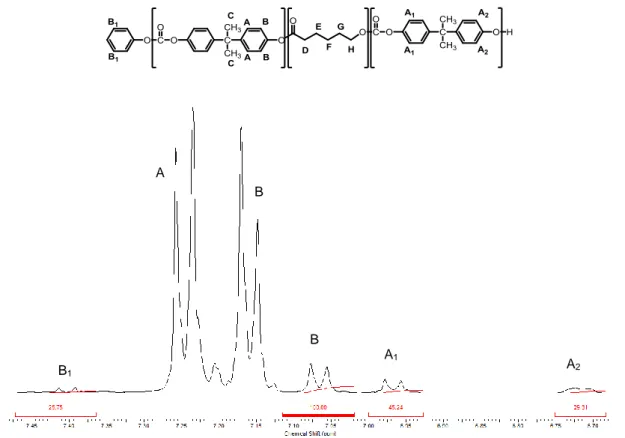
31
Figure 4.6: ¹H-NMR spectrum of the copolymer of poly(ε-caprolactone) and poly(carbonate)
(PCL-co-PC).
From integration of ¹H-NMR signals, molar composition and relative quantities of different sequences are calculated.
The molar composition is calculated by integration of poly(carbonate) aromatic protons from 7.40 to 6.70 ppm and aliphatic protons of poly(ɛ-caprolactone) from 2.31 to 2.56 ppm. The following formula has been used:
mol comp I(D)/2
(I(D)/2) (( I(A) I( ) I(A₁) I(A₂) I( ₁))/8) Eq. 4.2 where I(D) is the integral value of protons D representing the aliphatic protons of poly(ε-caprolactone) while the other integral values shown in the equation represent the aromatic protons of poly(carbonate).
The length of poly(carbonate) block is calculated by the ratio of integrals at 7.16 ppm and at 7.07 ppm as shown in Equation 3. The first one is referred to protons
B of the main chain while the second one to the same protons of end-groups.
B1 B A A1 B A2
32 PC unit I( main chain)/4
I( end chain)/2 Eq. 4.3
On the other hand, the length of poly(ɛ-caprolactone) block is calculated by the ratio of integrals at 2.31 ppm and at 2.56 ppm referred to protons D of the main chain and of the end-group respectively.
PCL unit I(Dmain chain)
I(Dend chain) Eq. 4.4
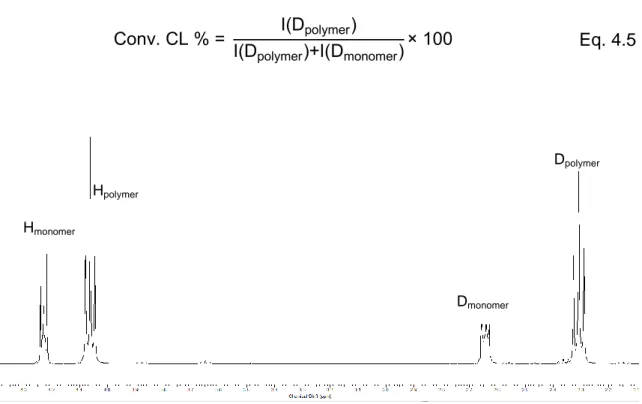
The conversion of the ɛ-caprolactone is calculated by integration of the signals at 2.64 and 2.31 referred to the protons D of the monomer and the polymer respectively in the reaction crude (Figure 4.7). The following formula has been used:
Conv. CL I(Dpolymer)
I(Dpolymer) I(Dmonomer) Eq. 4.5
Figure 4.7: ¹H-NMR spectrum of reaction crude.
By this method, the relative length of each PC and PCL sequences and the composition of the copolymers was calculated (Table 4.3). In the table it is also reported the molecular weight of each copolymer, obtained by GPC analysis.
Dmonomer
Dpolymer
Hpolymer
33
Table 4.3: Molecular characteristics of copolymers. Composition (PCL w/w%), PC-PCL units
length, average molecular weights ( ̅̅̅̅), and polydispersity (D).
Sample Comp. PCL (w/w%) PC length PCL length ̅̅̅̅ (Da) D PCL-b-PC 49 3 35 18500 1.4 PCL-ran-PC 61 1 10 14600 2.3
4.2.2. Thermal characterization
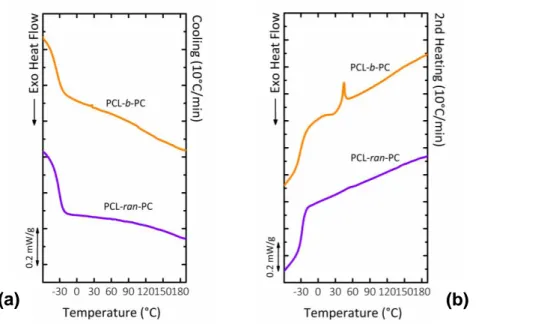
The thermal behaviour of the synthetized copolymers has been investigated by non-isothermal DSC and TGA experiments.
The structure of the copolymers microdomains in the melt state depends on their segregation strength given by 𝜒N (where 𝜒 is the Flory–Huggins interaction parameter between different blocks and N the overall degree of polymerization of the entire block copolymer).47 When 𝜒N is lower than 10, a single-phase melt is usually formed. On the other hand, when 𝜒N is higher than 10, copolymers segregate in two phases in the melt state.
As Table 4.4 shows, for each copolymer a value lower than 10 is obtained. It is therefore assumable that the copolymers form a single phase system in the melt state.
However, considering that in the second heating curves (Figure 4.8b) PCL-b-PC presents at 44 °C a melting peak relative to PCL crystals formed during the previous cooling, it is possible to assume that, in this case, a segregation of the phases happens during the cooling from the melt state.
Table 4.4: Molecular characteristic of the copolymers. The Flory-Huggins enthalpic segmental
interaction parameter 𝜒; the overall degree of polymerization of the copolymer calculated by
n
̅̅̅̅ ̅̅̅̅where ̅̅̅̅ is the number average molecular weight of the entire copolymer and n ̅̅̅̅is the molecular weight of the repeating unit (taking into account the molar composition of the copolymer); glass transition temperature (Tg), temperature of crystallization (TC) and melting (Tm)
and relative enthalpy values.
Sample 𝜒 N 𝜒 N Tg (°C) Tc (°C) Δ c (J/g) Tm (°C) Δ m (J/g)
PCL-b-PC 0.075 99.7 7.5 -36 22 0.8 44 1 PCL-ran-PC 0.075 124.4 8.8 -32 - - - -
34
On the other hand, PCL-ran-PC does not show any evidence of crystallization of the PCL phase but it must be considered that in this case the relative PCL sequences are too short to be rearranged during crystallization (Table 4.3).58
Figure 4.8: Non-isothermal DSC experiments on block and random copolymers. (a) cooling
curves at 10 °C/min from the melt state; (b) subsequent heating curves at 10 °C/min. The curves have been normalized by the weight of the samples.
Figure 4.9 shows TGA results of PCL-b-PC and PCL-ran-PC copolymers and the respective derivative curves dw/dT as function of temperature, while in Table 4.5 are reported the respective values obtained from the curves.
Both copolymers present a single degradation step, as result of a single phase system formation in the melt state (𝜒N is lower than 10 for both copolymers). However, the temperature at which PCL-ran-PC loses 10% of the total mass is 291 °C, whereas for PCL-b-PC it is 315 °C (Table 4.5).
Considering that the two copolymers have a similar composition, the different degradation behaviour is related to two factors. First of all, PCL-b-PC has a higher molecular weight than PCL-ran-PC, and thus the polymer chains need higher temperature to start degradation. At the same time, in PCL-ran-PC the number of linkages between different sequences (i.e., PC and PCL blocks) is higher than in PCL-b-PC. Being PCL-PC linkage more susceptible to degradation than PC-PC or PCL-PCL linkages, PCL-ran-PC starts its degradation before PCL-b-PC.
35
Figure 4.9: TGA curves of PCL-b-PC and PCL-ran-PC copolymers.
Table 4.5: Data obtained from TGA analysis for PCL-b-PC and PCL-ran-PC copolymers.
Sample T 10% loss (°C) T derivate peak (°C) PCL-b-PC 315 339 PCL-ran-PC 291 329
4.3. Characterization of PLA/PCL based blends
4.3.1. Preparation of the blends
A constant PLA/PCL weight ratio of 80/20 was employed in order to obtain a well-balanced combination of stiffness and toughness. PCL-PC based copolymers were tested as compatibilizers by adding them at 10% by weight with respect to the minor phase. Thus, the final blends have an approximate composition of 80/20/2, weight ratio, PLA/PCL/PCL-co-PC. The blends were prepared by both solution and melt mixing.
In the first case, neat homopolymers and the PCL-PC based copolymers were dissolved in dichloromethane and stirred at room temperature. The film forming solutions were casted until constant weight was reached.
In the second case, neat homopolymers and the PCL-PC based copolymers were melted and blended in a twin-screw extruder (screw speed: 200 rpm, temperature: 200°C, residence time: 1 minute). The extruded filaments were rapidly quenched in a water bath and pelletized.
The blends prepared by solution mixing have been designated with: (s) while the corresponding ones prepared by melt blending have been designated with: (m).
36
It is worth noting that upon the two different blending techniques, different morphologies and thermal behaviours of the resulting blends are obtained.
In melt mixing, samples are heated at a temperature higher than Tm and
subjected to shear within the extruder. This process can cause a direct degradation of the polymer, which results in a shortening of the chains. On the other hand, in solution mixed samples, the blend components remain at room temperature in a hydrophobic solvent, which should prevent the chains degradation. Because molecular weight has a key role in determining most of the properties of the blend, each of the following results must be correlated to a possible change in the molecular weight.
It is also important to consider that the migration of heterogeneities from one phase to the other, which could change crystallization kinetics, in melt mixed blends happens directly from one phase to the other whereas in solution mixed blends it could happen from one phase to the solvent.
At the same time, upon solution or melt blending a different morphology of the blend can be obtained. On one hand, in solution mixed blends the size of the minor phase domains is mainly dependent on the respective interfacial tension between the phases during segregation upon solvent evaporation. On the other hand, in melt mixed sample, the size of the minor phase domains is also correlated with the balance between coalescence and breakup of the droplets and therefore to the processing parameters. Furthermore, as a general result, in solution mixed sample the size of the minor phase domains is typically higher than in melt mixed blend upon the mechanical dispersion of one phase in the other.
In the following paragraphs, results for both solution and melt mixed blends at the same respective compositions will be presented.
4.3.2. Molecular weight analysis
Table 4.6 reports average and numerical molecular weight of neat PLA and PLA phase within the blends, while in Figure 4.10 a schematic chart representative of the molecular weight variation upon blending is illustrated.
In all solution blended samples, the molecular weight does not change upon blending and it is assumable that PLA phase molecular weight is maintained
37
unchanged with respect to the nominal value reported by the producer (i.e., ̅̅̅̅ = 180 KDa).
On the contrary in melt blended samples, the molecular weight is always lower than expected and it is even further influenced by copolymers addition. If on one hand, the molecular weight of neat PLA and PLA/PCL is only slightly decreased, on the other hand, copolymers addition causes a dramatic degradation of the polymers chains. In particular, in PLA/PCL/PCL-b-PC, the ̅̅̅̅ value is decreased to 113 KDa while in PLA/PCL/PCL-ran-PC ̅̅̅̅ is even decreased to 64 KDa. Considering that all melt blended samples have been processed in the same way, such reduction of the molecular weight must be induced by copolymer addition.
It is assumable that PCL-PC based copolymers, characterized by low molecular weights (Table 4.3), are more susceptible than PLA phase to degradation at melt blending conditions. Once degraded to polymers with lower molecular weight, they can undergo transesterification with PLA chains causing such molecular weight reductions.
As confirmation, it is worth noting that the copolymer characterized by the lowest molecular weight and thus the most susceptible to degradation (i.e., PCL-ran-PC, see molecular weight in Table 4.3 and thermograms in Figure 4.9) is the one that cause the highest molecular weight reduction.
In order to further confirm such hypothesis a thermogravimetric analysis was performed.
Table 4.6: Average molecular weight of melt blended and solvent mixed samples.
Sample ̅̅̅̅ (KDa) n ̅̅̅̅ (KDa) D PLA(m) 123 153 1.2 PLA/PCL(m) 111 160 1.4 PLA/PCL/PCL-b-PC(m) 81 113 1.4 PLA/PCL/PCL-ran-PC(m) 38 64 1.7 PLA(s) 117 179 1.5 PLA/PCL(s) 116 178 1.5 PLA/PCL/PCL-b-PC(s) 132 179 1.4 PLA/PCL/PCL-ran-PC(s) 127 184 1.4