ALMA MATER STUDIORUM – UNIVERSITÀ DI BOLOGNA
SCUOLA DI INGEGNERIA E ARCHITETTURACORSO DI LAUREA MAGISTRALE IN CIVIL ENGINEERING DIPARTIMENTO DI INGEGNERIA CIVILE,AMBIENTALE E DEI MATERIALI
TESI DI LAUREA
in
Advanced Hydrosystems Engineering
TOXICITY ASSESSMENT OF INDUSTRIAL- AND
SUNSCREEN-DERIVED ZnO NANOPARTICLES
CANDIDATO RELATORE:
Spisni Eleonora Chiar.mo Prof. Andrea Bolognesi
CORRELATORE:
Prof. Sung Hee Joo
Anno Accademico 2015/2016 Sessione I
Keywords
Nanoparticles
Sunscreen
Toxicity
Diatom
3TABLE OF CONTENTS
Abstract ... 7
Chapter 1 - Introduction ... 8
Chapter 2 - Literature review ... 12
Chapter 3 - Industrial nano-ZnO ... 26
3.1 Technical equipment ... 26
3.1.1 Beckman Coulter DU 720 Spectrophotometer ... 26
3.1.2 Zetasizer Nano ZS90... 26
3.1.3 Verilux VT 10 - 5000 lux ... 28
3.1.4 OrionTM pH meter and glass electrode ... 28
3.2 Manufacture of artificial seawater and f/2 medium ... 29
3.2.1 Manufacture of f/2 Trace Metal Solution ... 30
3.2.2 Manufacture of f/2 Vitamin Solution ... 30
3.3 Nanoparticles ... 31
3.4 Diatom culture ... 31
3.5 Experimental setup ... 31
3.5.1 Detection of Thalassiosira pseudonana absorbance wavelength ... 31
3.5.2 Calibration of nano-ZnO absorbance ... 34
3.5.3 Inhibition (%) as a function of exposure time ... 35
3.5.4 Effect of ZnO concentrations at fixed exposure time ... 36
3.6 Results ... 36
3.6.1 Zinc Oxide dissolution ... 36
3.6.2 Particle size and zeta potential ... 38
3.6.3 Inhibition (%) as a function of exposure time ... 38
3.6.4 Effect of ZnO concentrations at fixed exposure time ... 42
Chapter 4 - Sunscreen nano-ZnO ... 46
4.1 Technical equipment ... 46
4.1.1 Beckman Coulter DU 720 Spectrophotometer ... 46
4.1.2 Zetasizer Nano ZS90... 46
4.1.3 Verilux VT 10 - 5000 lux ... 46
4.1.4 OrionTM pH meter and glass electrode ... 46
4.2 Manufacture of artificial seawater and f/2 medium ... 47
4.3 Nanoparticles ... 47
4.4 Diatom culture ... 48 5
4.5 Experimental setup ... 48
4.5.1 Detection of Thalassiosira pseudonana absorbance wavelength ... 48
4.5.2 Inhibition (%) as a function of exposure time ... 48
4.5.3 Effect of ZnO concentrations at fixed exposure time ... 49
4.6 Results ... 49
4.6.1 Zinc Oxide dissolution ... 49
4.6.2 Particle size ... 49
4.6.3 Inhibition (%) as a function of exposure time ... 49
4.6.4 Effect of ZnO concentrations at fixed exposure time ... 53
Chapter 5 - Comparison of results and discussion ... 57
Chapter 6 - Literature survey ... 63
6.1 Concentration effect ... 63
6.2 Particle size and particle shape effect ... 64
6.3 Ionic dissolution effect ... 66
6.4 Aggregation, isoelectric point, and zeta potential effect ... 69
6.5 Surface area effect ... 76
6.6 Reactive Oxygen Species effect ... 78
Chapter 7 - Conclusions and future outlooks ... 84
Works Cited ... 87
ACKNOWLEDGMENT ... 95
Abstract
Lo scopo della presente tesi è l’analisi della tossicità di nanoparticelle di ossido di zinco (nano-ZnO) verso gli organismi acquatici. In particolare, il presente studio valuta per la prima volta l'inibizione della crescita della diatomea Thalassiosira pseudonana indotta sia da nanoparticelle di dervazione industriale, che da nanoparticelle auto-estratte in laboratorio da un filtro solare. Gli esperimenti, condotti presso il Laboratorio di Ingegneria dell'Università di Miami, hanno mostrato che la tossicità indotta dalle nanoparticelle di ossido di zinco è influenzata dal tipo di nanoparticelle, nonché dalla loro concentrazione nella soluzione acquosa e dal tempo di esposizione. In particolare le nanoparticelle di derivazione industriale, più piccole rispetto alle nanoparticelle estratte dal filtro solare, hanno indotto un’inibizione della crescita superiore, specialmente a concentrazioni inferiori. Questo andamento suggerisce che ad alte concentrazioni la tossicità di nano-ZnO potrebbe essere influenzata dall’aggregazione di nanoparticelle (indipendentemente dalle dimensioni di partenza delle nanoparticelle), mentre a concentrazioni inferiori la tossicità potrebbe essere influenzata dalle dimensioni di partenza delle nanoparticelle, così come dal tipo di nanoparticelle e dal tempo di esposizione.
Chapter 1 - Introduction
Nanotechnology is the manipulation of matter with at least one dimension, sized from 1 to 100 nanometers1. At the nanoscale, the properties of particles may change
in unpredictable ways and, thanks to this peculiar property, the field of nanotechnology is nowadays very broad, as it includes molecular biology and organic chemistry 2,3, materials science and engineering 4–7 and cosmetics 8–10. As
can be guessed, nanoparticles can contribute to stronger, lighter and “smarter” surfaces and systems.
At the macroscale, zinc oxide 11,12 is an inorganic compound, a white powder
insoluble in water but soluble in acid or alkaline solutions (Fig.1.1a). In nature it can be found in its mineral form called zincite (Fig.1.1b), but the majority of zinc oxide is produced synthetically; crystalline zinc oxide shows piezoelectricity properties and is thermochromc: It changes color from white to yellow when heated and back. It has good transparency and refractive index, therefore it is often used as white pigment in many commercially available products.
Figure 1.1. a) Powder of zinc oxide ZnO 13, b) Zincite14.
The study “Industrial production quantities and uses of ten engineered nanomaterials in Europe and the world” by Piccinno et al. (2013)15, assesses, by
means of a survey among experts, worldwide and European production and use of nano-ZnO. In Figure 1.2 it is possible to see the results of the survey. In particular, nano zinc oxide (nano-ZnO) is estimated to have a worldwide production of 550
tons per year (with a 25th and 75th percentile of 55 tons per year) and a European production of 55 tons per year (with a 25th and 75th percentile of 5.5 and 28000 tons per year, respectively). The product distribution is estimated to be 70% in cosmetics (including sunscreens) and 30% in paints.
Figure 1.2. a) Estimated production of nano-ZnO and b) its distribution among consumer products15.
Nano-ZnO has the potential to improve these products, however, it must also be considered that nanotechnologies raise concerns about their toxicity and environmental impact. According to Bystrzejewska-Piotrowska et al. (2009)16 and
Gebel et al. (2014)17, three different causes (non-mutually exclusive) of toxicity
from nanomaterials can be identified as follows:
• First, the toxicity can be due to the chemical element or compound itself (e.g., heavy metals);
• Second, the toxicity can be due to the small size of the particles, that both guarantees a large surface area per unit volume and fosters the nanoparticle sticking to other cells; and
• Third, the toxicity can be due to the shape of the particles (e.g., carbon nanotubes CNT can pierce membranes).
1 10 100 1000 10000 100000 Ton s/ye ar Worldwide Europe a) 0.7 0.3 Cosmetics Paints b) 9
Regarding health, nanoparticles may enter the human body primarily through inhalation or dermal contact, and secondarily by injection or ingestion, if they are present in food or medicine.
On the other hand, nanoparticles may also concern the environment; since these particles have such a small dimension, they can be easily carried by air (i.e., airborne particles) or by water. For example, nano-ZnO and nano titanium dioxide (nano-TiO2) contained in sunscreens may be released into the marine water when taking a
bath.
Another study “The structure, composition, and dimensions of TiO2 and ZnO
nanomaterials in commercial sunscreens” by Lewicka et al. (2011)18 investigated the
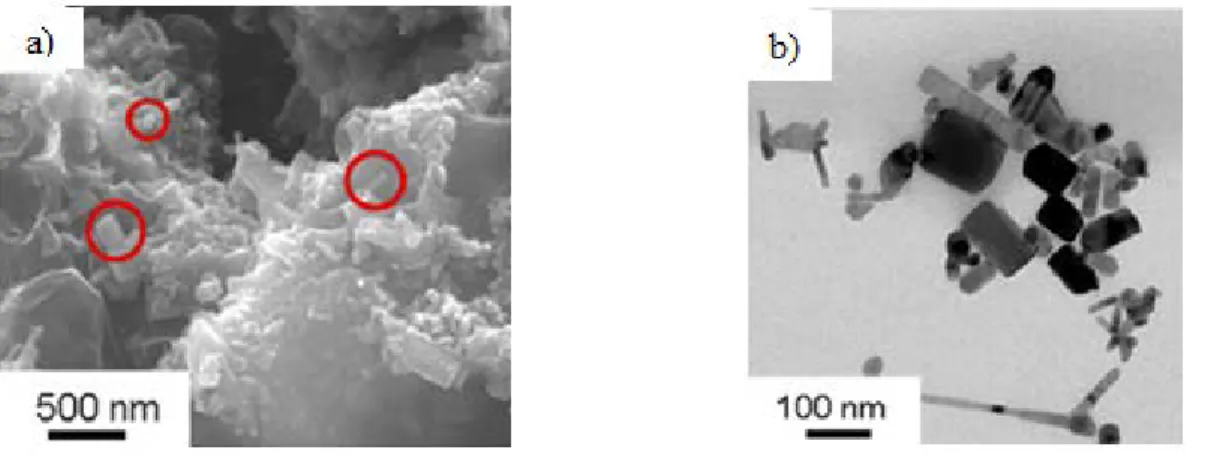
structure of nano-ZnO pigments derived from actual sunscreen products. Sunscreens have ultraviolet blocking agents to attenuate damaging radiation before it can interact with skin. One of these blocking agents, thanks to its ability of scattering, reflecting, and absorbing UVA and UVB rays, is nano-ZnO. Spreading sunscreens with regular and abundant applications in order to avoid sunburns represent a great exposure to ZnO nanoparticles, and it is quite likely that during use or disposal they will also find their way into the environment and there they will interact with organisms. In Figure 1.3a and Figure 1.3b it is possible to see Scanning Electron Microscopy (SEM) and Transmission Electron Microscopy (TEM) images on nano-ZnO from sunscreen. These rod-shaped particles have an average dimensions of 80 nm in length and 37 nm in width.
Figure 1.3. a) SEM image and b) TEM image of ZnO nanoparticles in sunscreens18.
In a further study “Photochemical behavior of nanoscale TiO2 and ZnO
sunscreen ingredients” by Lewicka et al. (2013)19, the ability to produce reactive
oxygen species (ROS) upon UV illumination of ZnO was investigated. ROS are radical, chemically-reactive molecules containing oxygen that can cause significant cell damage, including direct modification of nucleic acid bases and cell death. These particles may also affect ecosystems, inhibiting photosynthesis of phytoplankton. As a result, nano-ZnO generated a greater amount of ROS than TiO2.
As such, due to the potential hazard posed by this nanoparticle and by its large presence in consumer products, it is essential to further inquire and estimate the release and toxicity of both industrial and commercially-available good’s derived nano-ZnO toward the diatom Thalassiosira pseudonana. In particular, the present case study will focus on the differences between industrial-derived and sunscreen-derived zinc oxide nanoparticles, as well as the growth inhibition of Thalassiosira pseudonana induced by both types nanoparticles, as a function of their concentration and exposure time.
Chapter 2 - Literature review
Due to its properties, zinc oxide (as well as titanium dioxide) nanoparticles are often used as inorganic UV filter, as mentioned by Serpone et al. (2007)20: These
metal oxide nanoparticles are known for their ability to absorb Ultraviolet A (wavelength ranging from 320 to 400 nm) and Ultraviolet B (wavelength ranging from 290 to 320 nm) radiation. Nano-ZnO is a physical filter: The radiation is blocked by means of reflecting and scattering sunlight.
Increasing awareness toward skin cancer (e.g., melanoma), attributed to the long exposure to intense sunlight21, led to the implementation of sun safety practices,
including the routine use of sunscreens. Indeed, sunscreens offer the best protection against UVA/UVB radiation skin damages22. The increase in the use of inorganic
UV filters in sunscreen products is one of the latest trends, due to their effectiveness20.
Coastal tourism recently became one of the fastest growing economic industries. As assessed in two studies by Sánchez-Quiles & Tovar-Sánchez (2014 and 2015), 763 million of tourists chose to travel to a coastal destination in 200421 , while 202
million of tourists chose to visit the Mediterranean Sea in 201323. According to those
studies, the number of tourists is estimated to continue to grow in the next years, and it is reasonable to assume that tourists will use sunscreens in order to prevent sunburns.
The study “The Safety of Nanosized Particles in Titanium Dioxide– and Zinc Oxide– based Sunscreens” by Newman et al. (2009)24 reports that no significant skin
penetration is expected from zinc oxide nanoparticles contained in sunscreen products; on the other hand it should be noted that:
• In vivo skin penetration tests are highly subjective to the tested species (e.g., rabbits, rats, pigs and humans) and to the compounds;
• In vitro studies were performed on intact skin, and therefore no information regarding traumatized or diseased skin (e.g., sunburned skin, eczema); and
• The studies were performed without UV exposure control.
The massive use of sunscreens represents a high risk of accumulation of metal oxide nanoparticles onto the skin and in the environment. In particular, these particles are likely to follow multiple pathways in the environment throughout their entire life cycle (i.e., nanoparticles synthesis, consumer product fabrication, consumer product usage, and consumer product disposal), as mentioned by Giokas et al. (2007)25 and Sánchez-Quiles & Tovar-Sánchez (2015)21. Among those
pathways it is important to mention:
• Industrial wastewater discharges from the production process; • Landfill leachate from the residue in sunscreen packages; • Sludge from wastewater treatment; and
• Wash off in water bodies during bathing activities.
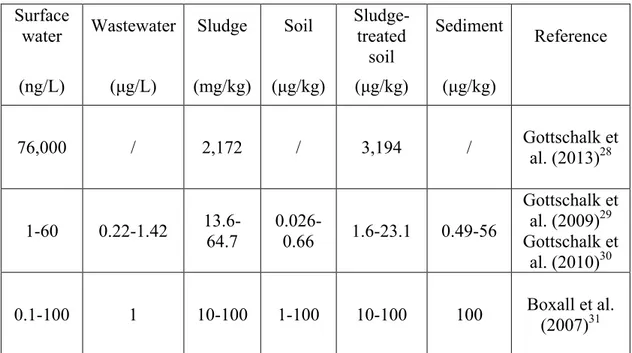
The study “Ecotoxixity of Zinc Oxide Nanoparticles in the Marine Environment” by Yung et al. (2014)26 reports the following modeled environmental concentrations of nano-ZnO, visible in Table 2.1. As a remark, the variability in the modeled concentrations indicates the use of different models and high uncertainties linked to those models.
The study “Sunscreen Products as Emerging Pollutants to Coastal Waters” by Tovar-Sánchez et al. (2013)27, assessed that the majority of chemicals released from
sunscreen products is concentrated in the surface microlayer of the water body, due to the greasy nature of sunscreens. Moreover, it was evaluated that the zinc oxide concentration in the surface microlayer of seawater varies from 1.0 to 3.3 μg/L throughout the day (peaking at midday), whereas the concentration in subsurface seawater is lower and more constant.
Surface
water Wastewater Sludge Soil Sludge-treated soil Sediment Reference (ng/L) (μg/L) (mg/kg) (μg/kg) (μg/kg) (μg/kg) 76,000 / 2,172 / 3,194 / Gottschalk et al. (2013)28 1-60 0.22-1.42 13.6-64.7 0.026-0.66 1.6-23.1 0.49-56 Gottschalk et al. (2009)29 Gottschalk et al. (2010)30 0.1-100 1 10-100 1-100 10-100 100 Boxall et al. (2007)31
Table 2.1. Modeled concentrations of nano-ZnO in the environment.26
In light of that, despite the modeled and actual measured concentrations of zinc oxide nanoparticles in the environment, testing the growth inhibition induced by higher nanoparticle concentration is very important: Indeed, testing higher nano-ZnO concentrations will allow assessing the effects on the marine environment when the metal oxide is found in concentrated forms (i.e., sludge accumulation, presence of sediments), as well as bioaccumulation effects. Moreover, since the tourism industry is expected to be growing in the next decades, testing higher zinc oxide nanoparticle concentrations could be useful for future scenarios.
As soon as that the particles are released into water bodies, they are likely to interact with the aquatic environment. Several studies investigated the effects of zinc oxide nanoparticles toward the marine life; those studies are reported in the following paragraphs, starting with simple organisms (i.e., marine algae) and ending with more complex ones (i.e., zebrafishes, amphipods).
Regarding the possible effects of nano-ZnO on the marine environment, the study “Evaluation of zinc oxide nanoparticles toxicity on marine algae Chlorella vulgaris through flow cytometric, cytotoxicity and oxidative stress analysis” by Suman et al. (2015)32 analyzed the toxicity of nano-ZnO and its effects on the
marine algae Chlorella Vulgaris. Zinc oxide nanoparticles were synthesized in the laboratory, while the algae were purchased and cultured; for the experiments, an
initial amount of 4×10⁵ cells were treated with 50 mg/L, 100 mg/L, 200 mg/L, and
300 mg/L each, for 24 and 72 hours. The results showed that the cell viability was correlated to both concentration of nano-ZnO and exposure time (Fig.2.1).
Figure 2.1. Cell viability (%) vs. nano-ZnO concentration32.
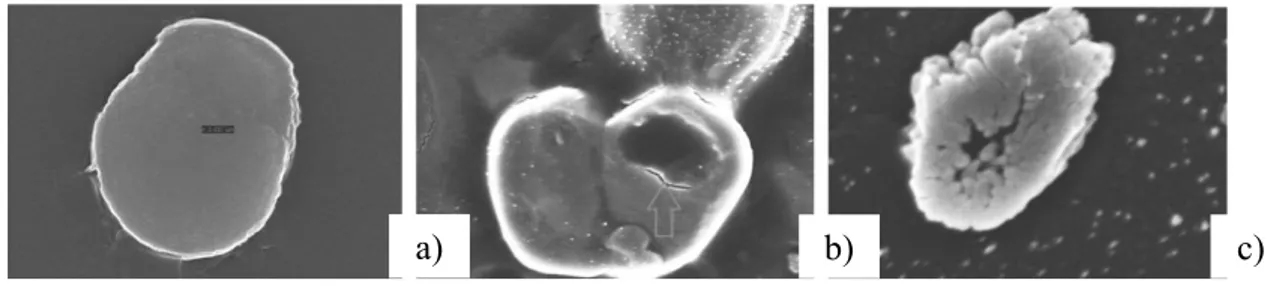
Also, the cell integrity was altered. As can be seen, Figure 2.2a shows a control cell, without damages, while Figure 2.2b shows that after a 50 mg/L 72 h exposure, significant damages appear on the cell membrane. Finally, Figure 2.2c shows that after a 300 mg/L 72 hrs exposure, significant distortions appear to be present in the cell. Moreover, the integrity of the cell membrane was tested with propidium iodide (PI) stain: If the cell is not stained by PI, it means that the membrane is intact; otherwise, its integrity is compromised. As can be seen in Figure 2.3a, the control cells show no PI dye, whereas after a 300 mg/L 72 h exposure, the image shows PI dye entered the cell, due to membrane damages (Fig. 2.3b).
Figure 2.2. SEM image: a) control cell b) cell after 50 mg/L 72 h test c) cell after 300 mg/L 72 h test32. 0 10 20 30 40 50 60 70 80 90 100 0 100 200 300 400 C ell v ia bilit y [%]
ZnO nanoparticle concentration [mg/L]
24 h 72 h
a) b) c)
Figure 2.3. a) control cell, unstained b) cell after 300 mg/L 72 h test, stained32.
Another study, “Toxic effects of ZnO nanoparticles toward marine algae Dunaliella tertiolecta” by Manzo et al. (2013)33, analyzed the toxic effects of
nano-ZnO on the marine algae Dunaliella tertiolecta. The experiments were conducted by preparing plates of 10 mL, with an algae concentration of 103 cells/mL, and loading
them with a concentration of nano-ZnO of 100 mg/L (Fig.2.4), obtained from the dilution of 10 mg of dry powder of nano-ZnO into 100 mL of artificial seawater, and grown for four days. The final concentration in the samples was 10, 7.5, 5, 3, 1, 0.75, 0.5, and 0.1 mg Zn/L. The results showed that the growth rate was affected by the nanoparticle, at a 95% confidence interval (as bracketed in Table 2.2); NOEC stands for “No Observed Effect Concentration,” LOEC stands for “Lowest Observed Effect Concentration,” and EC50 and EC10 are, respectively, the Effective Concentration at 50 and 10 percent inhibition.
Figure 2.4. Phase contrast microscopy shows nano-ZnO and algal cells33.
a) b)
NOEC [mg/L] LOEC [mg/L] EC50 [mg/L] EC10 [mg/L]
Nano-ZnO 0.1 0.5 2.42 [0.97-2.87] 0.08 [0.06-0.14]
Table 2.2. NOEC, LOEC, EC50 and EC10 of nano-ZnO33.
Table 2.3 shows the growth data and Figure 2.5 plots this data graphically, suggesting a correlation between the concentration and the survival rate of the cells of Dunaliella tertiolecta. As can be seen, increasing the concentration of the nanoparticle also increased the inhibition; that is to say, the growth rate decreased.
Concentration of ZnO [mg/L] Growth rate
0 0.68 ± 0.02 0.1 0.65 ± 0.01 0.5 0.58 ± 0.02 0.75 0.57 ± 0.05 1 0.51 ± 0.06 3 0.44 ± 0.06 5 0.46 ± 0.05 7.5 0.2 ± 0.04 10 0.13 ± 0.05
Table 2.3. Growth rate vs. nano-ZnO concentration33.
Figure 2.5. Growth rate vs. nano-ZnO concentration33.
The study “Toxicity and Bioaccumulation of Nanomaterial in Aquatic Species” by Luo (2007)34 evaluated the toxicity of nano-ZnO to the freshwater algae
Chlamydomonas reinhardtii and to the freshwater water flea Daphnia magna. Since Daphnia magna naturally feeds on Chlamydomonas reinhardtii, three tests were
0 0.1 0.2 0.3 0.4 0.5 0.6 0.7 0.8 0 2 4 6 8 10 12 Growth rate Concentration of ZnO [mg/L] 17
possible: Two direct toxicity tests, performed one on the algae and one on the water flea, and one bioaccumulation test performed on Daphnia magna which was fed on the nano-ZnO-long exposed Chlamydomonas reinhardtii. For the testing procedure, the algae strains were bought and then cultivated in the laboratory under controlled conditions. A fresh culture of water fleas was used for each experiment, and for every toxicity test 10 adults were used. Finally, nanoparticles were purchased and, for each test, added in concentrations of 1, 5, and 10 parts per million (ppm), respectively.
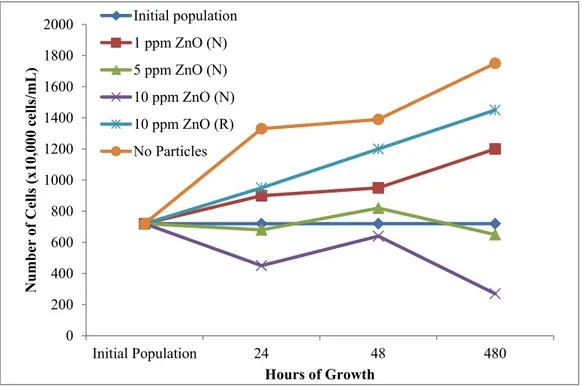
For what concerns the toxicity to Chlamydomonas reinhardtii, as can be seen in Figure 2.6, the toxicity of nano-ZnO is evident. When compared to both the absence of particles and the regular non-nano version of ZnO at 10 ppm, it is also possible to see that the number of cells is decreasing with the increment of nano-ZnO concentration. Moreover, it can be observed that acute toxicity (up to 48 hours of exposure) is lower than the long-term toxicity, measured after 20 days of growth. Further, the long-term test effects appear to be more evident and sharper, since the remaining population, in the case of 10 ppm, is approximately one third of the initial one.
Figure 2.6. Toxicity test of Chlamydomonas reinhardtii at different nano-ZnO concentration34.
0 200 400 600 800 1000 1200 1400 1600 1800 2000 Initial Population 24 48 480 N umb er of C el ls ( x1 0, 00 0 cel ls/ mL ) Hours of Growth Initial population 1 ppm ZnO (N) 5 ppm ZnO (N) 10 ppm ZnO (N) 10 ppm ZnO (R) No Particles 18
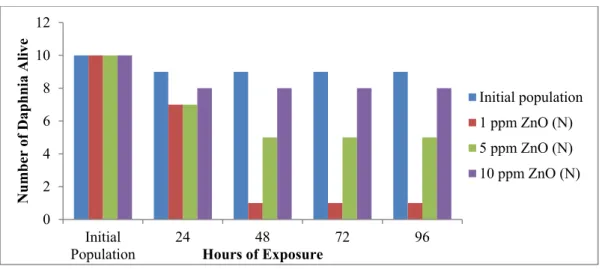
Figure 2.7. Direct toxicity test of Daphnia magna, at different nano-ZnO concentrations34.
The direct toxicity test of Daphnia magna, whose results are presented in Figure 2.7, showed that, even for the water fleas, the nano-version of zinc oxide is more toxic, compared to the macro version. At 10 ppm, nano-ZnO appears to be very harmful to this water flea, while at lower concentrations it appears less toxic. On the other hand, it is important to notice that macro ZnO particles are more toxic to Daphnia magna than to Chlamydomonas reinhardtii. This may be due to the fact that the water flea has greater dimensions compared to those of the algae; therefore it is more likely that larger particles interact with larger organisms. Finally, concerning the bioaccumulation test, the indirect exposure of Daphnia magna to nano-ZnO produced a generic decrement in the water flea heartbeat, but the tendency is not always clear and this could be explained by some considerations:
• First, since this was an acute test ran for a short period of time, it does not take into account the possible further effects on subsequent generations;
• Second, the fleas were exposed to a very low amount of nano-ZnO; and • Third, since Daphnia magna lives on stagnant water, it is likely that the
nanoparticles settled and were no longer suspended.
In a study looking at more complex organisms, “Aquatic acute species sensitivity distributions of ZnO and CuO nanoparticles” by Adam et al. (2015)35, the
aquatic Species Sensitivity Distribution (SSD) (Fig.2.8) at the 5% Hazard 0 2 4 6 8 10 12 Initial Population 24 48 72 96 N um be r o f D aphni a A liv e Hours of Exposure Initial population 1 ppm ZnO (N) 5 ppm ZnO (N) 10 ppm ZnO (N) 19
Concentrations (HC5) of bacteria, protozoa, yeast, rotifera, algae, nematoda,
crustacea, hexapoda, fish and amphibia species was evaluated. As a result, HC5 was
assessed to be 0.06 mgZn/L. To estimate it, both EC50 and LC50 (lethal concentration leading to death in 50% of the group) (Fig.2.9) were included, and those data were taken from past studies, in which the majority of nano-ZnO were purchased in powder form.
Figure 2.8. Aquatic SSD of nano-ZnO35.
Figure 2.9. L(E)C50 values for different aquatic species35.
As can be seen in Figure 2.9, algae appear to be the most susceptible aquatic organism to nano-ZnO, followed by crustacea. Moreover, an estimation of the 20
relationship between the aggregate size of the nano-ZnO and its toxicity to different aquatic species (Fig.2.10) was attempted; however this was possible only for fish and nematoda, but this could be due to the lack of data.
Figure 2.10. L(E)C50 vs. aggregate size for the different aquatic species35.
In order to assess the risks associated to more complex but still not too specialized organisms, the study “Toxicity of zinc oxide nanoparticles to zebrafish embryo: a physicochemical study of toxicity mechanism” by Bai et al. (2010)36
assessed the potential consequences on Danio rerio embryo exposed to polluting nano-ZnO, considering that this stage is the most delicate one during the life cycle of a fish. For the experiments, eggs were collected after spawning and nano-ZnO powder (particle size 30 nm) was purchased; the nanopowder was then added to the same medium used as hatchery water for the embryo in concentrations equal to 0, 1, 5, 10, 25, 50, and 100 mg/L (Fig.2.11a, Fig. 2.11b, and Fig. 2.11c). Among the initial 24 embryos, 20 were exposed to nano-ZnO and 4 were kept as a control sample. The embryos were then checked at 8, 24, 32, and from 48 to 96 Hours Post Fertilization (HPF).
As can be seen in Figure 2.12a, by increasing the concentration of polluting nano-ZnO, the hatching rate at 96 HPF consequently decreases, reaching the condition of unhatched eggs with concentrations equal to 25, 50, and 100 mg/L. Looking at figure 2.12b, it is possible to see the cumulative hatching vs. time of the embryos subjected to different concentrations: For instance, a concentration as low as 1 mg/L produces a slight effect, compared to the control samples, whereas
increasing the concentration it can be noticed that the zebrafish embryo hatching was delayed parallel to the increment in concentration of ZnO.
Figure 2.11. Zebrafish embryos: a) control; b) 10 mg/L exposition; c) 100 mg/L exposition36.
The median hatching time (HT50) was then calculated, as can be seen in Table 2.4. For concentrations greater than 10 mg/L the time was not measured due to low hatching rate or no hatching.
Control 1 mg/L 5 mg/L ≥ 10 mg/L
HT50 [h] 52.4 ± 1.2 52.7 ± 0.7 71.1 ± 14.8 /
Table 2.4. Median hatching time (HT50) at different concentrations36.
Figure 2.12. a) Hatching rate after 96 HPF; )Cumulative hatching from 48 to 96 HPF36.
The mortalities among the embryos at 96 HPF was estimated to be 28.3 ± 14.5 % for 50 mg/L exposure and 65.0 ± 8.9 % for 100 mg/L. Moreover, it was possible to
measure variations in the length of the embryos by observing an overall shortening and a significant tail deformation as seen in Figure 2.13a and Figure 2.13b.
Figure 2.13. Comparison between a) control embryo and b) tail-malformed embryo.36
Therefore, the effects of nano-ZnO of zebrafish embryo include death, delayed hatching, reduced body length, and significant tail malformations.
Finally, to investigate the toxicity of nano-ZnO among more complex organisms, the study “Accumulation and toxicity of metal oxide nanoparticles in a soft-sediment estuarine amphipod” by Hanna et al. (2013)37 tried to evaluate the effects that
settlings of engineered nanoparticles, such as nano-ZnO, in estuary and marine sediments could have on Leptocheirus plumulosus, an amphipod that filters and feeds deposits. It is logical that, due to aggregation, nanoparticles will settle in sediments, reaching a locally high concentration of pollutants. First, the solubility of nano-ZnO was tested and the results showed that this nanoparticle dissolved rapidly in water; then, the proper toxicity tests were performed for 10 days, with adult amphipods and mixing sediments in concentrations of 0, 500, 1000, 1500, and 2000 μg/g of dry weight. As a result, the accumulation of nano-ZnO in live amphipods was less than 600 μg Zn/g, but, due to low survival, this was measured only for concentrations ranging from 0 to 1000 μg/g. Moreover, the estimated median lethal concentration LC50 after 10 days of exposure to nano-ZnO was assessed to be equal to 763 ± 64 μg g-1 and the mortality rate increased parallel to the increment of
concentration of pollutant. The overall result of the study is that nano-ZnO is toxic to Leptocheirus plumulosus, and this toxicity can be due to its exposure to ions.
As such, algae play a very important role in aquatic systems as producers in the food chain and as oxygen providers in an ecosystem. For the present case study, the 23
diatom Thalassiosira pseudonana was chosen to perform growth inhibition tests. The diatom is a marine algae that can grow in both seawater and freshwater38 and
presents a worldwide marine distribution39; its DNA was sequenced40 and has
already been used in many toxicology experiments41,42. Thalassiosira pseudonana
was selected among other aquatic organisms, for its role and presence in the marine ecosystem and for the relevant outcomes of previous case studies: The diatom can be used as an indicator of marine pollution.
As reported by Armbrust et al. (2004), in the study “The genome of the diatom Thalassiosira pseudonana: ecology, evolution, and metabolism”40, the diatom
presents a hydrated silicon dioxide (i.e., silica) frustule43. The frustule is a
exoskeleton consisting of highly organized nanoparticles43; in Figure 2.14 it is
possible to see a Scanning Electron Microscopy image of the silica-based frustule of Thalassiosira Pseudonana.
Figure 2.14. Frusutle of Thalassiosira Pseudonana.43
Concerning toxicity, several studies investigated the relationship between silica-based frustules and the presence of zinc oxide in the aqueous media. In particular, Ellwood and Hunter44 assessed that the higher the concentration of zinc ion Zn2+ in
the aqueous media, the higher the cellular uptake; on the other hand, just a small quantity of zinc uptake by the diatom is found in the frustules. Other studies41,45
reported that the toxicity of ZnO toward Thalassiosira Pseudonana might be linked to zinc ions Zn2+ attaching to the diatom’s surface. Finally, Fisher et al. (1981)46
reports that zinc ion Zn2+ might interfere with frustule formation.
Thus, understanding the potential issue represented by nano-ZnO, extracted from commercially available products like sunscreen to the survival rate of Thalassiosira pseudonana will provide invaluable information regarding the toxicity of the aforementioned nanoparticles.
The fundamental hypothesizes of the present case study can be then summarized: • Do zinc oxide nanoparticles derived from commercially available
products (i.e., sunscreens) behave similarly to industrial-derived ones? • What is the growth inhibition developed from the intoxication of a simple
food chain producer, like Thalassiosira pseudonana?
Moreover, the uniqueness of this research is represented by sunscreen-derived nanoparticles. At the present date, very few nanotoxicologial studies concerning self-extracted nanoparticles were conducted. The present case study introduces sunscreen-derived zinc oxide nanoparticles and compares the growth inhibition promoted by sunscreen-derived and industrial-derived, as a function of their concentration and exposure time.
The present study aims to unveil the possible issues posed by zinc oxide nanoparticles, present in sunscreen products, to the simple, food chain producer, aquatic organism.
Chapter 3 - Industrial nano-ZnO
The aim of the following experiments is testing the toxicity of industrial-derived zinc oxide nanoparticles to the diatom Thalassiosira pseudonana. The toxicity to the algal cells was expressed in terms of growth inhibition, which was estimated by the difference in the absorbance of the specimens with respect to the control sample. The experiments were performed in the Environmental Engineering Laboratory of the University of Miami.
3.1 Technical equipment
3.1.1 Beckman Coulter DU 720 Spectrophotometer
A DU 720 UV/Vis Spectrophotometer47 (Beckman Coulter, DU® 720, Pasadena,
CA), visible in Figure 3.1 is used in order to measure the absorbance (i.e., the amount of light absorbed by the sample). Its wavelength range is 190-1100 nm, while the absorbance can be measured with a precision of 0.001 Abs. Prior to running the experiment and measuring the absorbance of a sample, is it necessary to select an appropriate wavelength range and scan a blank sample.
Figure 3.1. DU 720 UV/Vis Spectrophotometer47 (Beckman Coulter, DU® 720, Pasadena, CA). 3.1.2 Zetasizer Nano ZS90
A Zetasizer Nano ZS9048 (Malvern Instruments, UK), visible in Figure 3.2, is
used to measure both the size of particles in an aqueous media and the zeta potential of the colloid. Particle size can be measured for particles having a diameter in the 26
range of 0.3nm to 5.0 microns, while zeta potential can be measured for particles having a diameter in the range of 3.8 nm to 100 microns, with an accuracy of 0.12 µm cm/Vs. Measurements can be taken by placing the aqueous media in the appropriate cuvette; the specific cuvette for the zeta potential test can be seen in Figure 3.3.
Figure 3.2. Zetasizer Nano ZS9048 (Malvern Instruments, UK).
Figure 3.314. Cuvette for zeta potential test48.
3.1.3 Verilux VT 10 - 5000 lux
The Verilux VT 10 - 5000 lux49 (Verilux, VT) (Figure 3.4) is used in
combination with an incubator in order to provide an optimal environment for the growth of Thalassiosira pseudonana. The lamp has a timer which allows dark:light cycles (12h:12h). Dark:light cycles are essential to the diatom due to its photosynthetic nature.
Figure 3.4. Verilux VT 10 - 5000 lux49 (Verilux, VY). 3.1.4 OrionTM pH meter and glass electrode
The pH meter OrionTM 720Aplus 50(Thermo Fisher Scientific, MA) visible in
Figure 3.5, together with the glass electrode Orion™ 8156BNUWP50 (Thermo
Fisher Scientific, MA), visible in Figure 3.6, was used on order to assess the solution’s pH.
Figure 3.5. OrionTM 720Aplus50.
Figure 3.6. OrionTM 8156BNUWP50. 3.2 Manufacture of artificial seawater and f/2 medium
The diatom needs artificial seawater and f/2 medium in order to survive in the laboratory. Artificial seawater and f/2 medium were prepared in the laboratory according to Guillard et al. (1962)51 and Keller et al. (1988)52, using the following
protocol.
Autoclaved artificial seawater is prepared dissolving the following amounts (Zhang et al, 2013.) in 1 liter of ultrapure water (18.2 MΩ) produced with a three-stage Millipore Milli-Q plus 185 purification system (Millipore, Billerica, MA).
• 27.72 g NaCl (>99.0% purity, Fisher Scientific, Fair Lawn, NJ); • 0.67 g KCl (99.7% purity, Sigma-Aldrich, St. Louis, MO); • 1.03 g CaCl2 (>99.0% purity, Sigma-Aldrich, St. Louis, MO);
• 4.66 g MgCl2 (>99.0% purity, BDH Chemicals, Radnor, PA);
• 3.07 g MgSO4 (>99.5% purity, Sigma-Aldrich, St. Louis, MO); and • 0.18 g NaHCO3 (99.9% purity, Mallinckrodt, Paris, KY).
Artificial seawater was then adjusted to a pH of 8.0 by means of adding 1 M NaOH or HCl; the pH was monitored with a pH meter (OrionTM, 720Aplus) with a
glass electrode (Orion™, 8156BNUWP).
The f/2 medium is designed for growing diatoms. The concentration of the original formulation, termed “f Medium” by Guillard et al. (1962)51, has been
reduced by half. The following components, presented in Table 3.1, are added to 950 mL of artificial seawater, then the final volume is brought to 1 liter with autoclaved artificial seawater.
Component Stock solution Quantity Concentration
NaNo3 75 g/L 1 mL 8.82 x 10⁻⁴ M
NaH2PO4H2O 5 g/L 1 mL 3.62 x 10⁻⁵ M
Trace metal solution - 1 mL -
Vitamin solution - 0.5 mL -
Table 3.1. f/2 medium composition. 3.2.1 Manufacture of f/2 Trace Metal Solution
The following components, presented in Table 3.2, are added to 950 mL of H2O,
then the final volume is brought to 1 liter with autoclaved artificial seawater. Component Stock solution Quantity Concentration
FeCl3 6H2O - 3.15 g 1.17 x 10⁻⁵ M Na2 EDTA 2H2O - 4.36 g 1.17 x 10⁻⁵ M CuSO4 5H2O 9.8 g/L H2O 1 mL 3.93 x 10⁻⁸ M Na2MoO4 2H2O 6.3 g/L H2O 1 mL 2.60 x 10 -8 M ZnSO4 7H2O 22.0 g/L H2O 1 mL 7.65 x 10⁻⁸ M CoCl2 6H2O 10.0 g/L H2O 1 mL 4.20 x 10⁻⁸ M MnCl2 4H2O 180.0 g/L H2O 1 mL 9.10 x 10⁻⁷ M
Table 3.2. f/2 Trace Metal Solution composition. 3.2.2 Manufacture of f/2 Vitamin Solution
The following components, presented in Table 3.3, are added to 950 mL of H2O,
then the final volume is brought to 1 liter with autoclaved artificial seawater. Component Stock solution Quantity Concentration Thiamine HCl (vit. B1) - 200 mg 2.96 x 10⁻⁷ M
Biotin (vit. H) 1.0 g/L H2O 1 mL 2.05 x 10⁻⁹ M
Cyanocobalamin (vit B12) 1.0 g/L H2O 1 mL 3.69 x 10⁻¹⁰ M
Table 3.3. f/2 Vitamin Solution composition.
3.3 Nanoparticles
Commercial ZnO nanopowder (>97% purity, <50 nm ± 5 nm nominal size, >10.8 m2/g surface area, data from vendor) was purchased from Sigma-Aldrich53
(St. Louis, MO). The toxic effects of nano-ZnO were investigated by suspending 1, 10, and 50 mg of ZnO nanoparticles in 1 L of artificial seawater f/2 medium.
3.4 Diatom culture
Thalassiosira pseudonana cells were purchased from Bigelow Laboratory for Ocean Sciences (CCMP 133554). The culture of Thalassiosira pseudonana was
obtained by adding artificial seawater f/2 medium to the originally purchased culture. Then the culture was incubated at a constant temperature of 26°C, with 12h:12h (dark:light) cycles maintained with Verilux VT 10 (5000 lux, white light).
3.5 Experimental setup
3.5.1 Detection of Thalassiosira pseudonana absorbance wavelength
In order to estimate the growth inhibition induced by industrial nano-ZnO toward the marine diatom Thalassiosira pseudonana, several absorbance tests were performed. The aim of the experiment is to find a relationship between the absorbance, measured with the spectrophotometer, and the algae concentration in the samples. This indirect measurement of the growth inhibition was chosen due to the difficulties associated with direct measurements.
The issue associated with this type of indirect measurement was finding the wavelength corresponding to the algae’s peak in the red band. Tests were performed after a literature review, in order to narrow the broad spectrum of all possible wavelengths. Three studies involving spectrophotometer tests were considered.
The first study is “UV effects on photosynthesis, growth and acclimation of an estuarine diatom and cryptomonad” by Litchman & Neale (2005)55. The sensitivity
of photosynthesis and acclimation to UV of Thalassiosira pseudonana were tested and UV spectrum analysis, comparing the three different expositions to light, were performed. The results of the UV spectrum analysis are shown in Figure 3.7.
Figure 3.7. Absorbance vs. wavelength55.
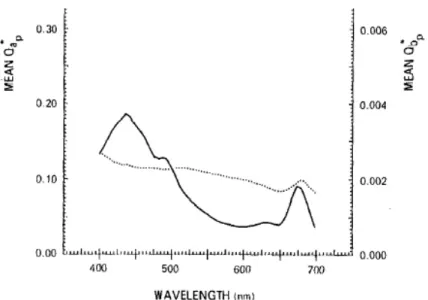
Another study, “The effect of nitrogen limitation on the absorption and scattering properties of the marine diatom Thalassiosira pseudonana” by Reynolds et al. (1997)56, investigates the optical properties of Thalassiosira pseudonana in
nitrate-limited semicontinuous cultures at different growth rates, and indicates λ = 673 nm as the algae’s absorption red peak, as can be seen in Figure 3.8.
Figure 3.8. Absorbance vs. wavelength56.
The third study, “Reflectance spectroscopy of marine phytoplankton. Part 1. Optical properties as related to age and growth rate” by Kiefer et al. (1979)57,
investigates the optical properties of two different algae; one of the algae included in
the study is Thalassiosira pseudonana. The research indicates that the red peak associated to this diatom is λ=673 nm, as can be observed in Figure 3.9.
Figure 3.9. Absorbance vs. wavelength57.
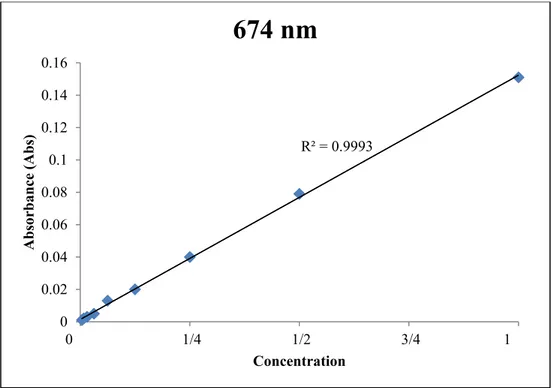
After having narrowed the list of all possible wavelengths, tests were performed in order to assess the right wavelength of Thalassiosira pseudonana. First, the absorbance of a sample of Thalassiosira pseudonana in artificial seawater (1:1) was analyzed, and other measurements were taken after performing serial dilutions, halving the diatom concentration at each step. The sample corresponding to the dilution 1:256 represents the detection limit of the spectrophotometer, since the absorbance measured was 0.001. As can be seen in Table 3.4, a wide range of wavelengths were tested, and measurements assessed that the peak of absorption of Thalassiosira pseudonana occurred at a wavelength corresponding to 674 nm. The relationship between the absorbance of Thalassiosira pseudonana and its concentration in artificial seawater, for a wavelength of 674 nm can be seen in Figure 3.10. This value was used to analyze the changes in the absorbance of poisoned diatom cells in next experiments.
Wavelength [nm] 672 673 674 675 676 Concentration of T. pseudonana 1:1 0.150 0.150 0.151 0.150 0.150 1:2 0.079 0.079 0.079 0.079 0.079 1:4 0.039 0.039 0.040 0.039 0.039 1:8 0.020 0.020 0.020 0.020 0.020 1:16 0.013 0.013 0.013 0.013 0.013 1:32 0.005 0.005 0.005 0.005 0.005 1:64 0.003 0.003 0.003 0.003 0.003 1:128 0.002 0.002 0.002 0.002 0.002 1:256 0.001 0.001 0.001 0.001 0.001
Table 3.4. Absorbance of Thalassiosira pseudonana in Artificial Seawater as a function of concentration, for different wavelenghts.
Figure 3.10. Absorbance vs. Concentration at peak wavelength of Thalassiosira pseudonana. 3.5.2 Calibration of nano-ZnO absorbance
Several absorbance tests were performed, in order to understand whether the zinc oxide nanoparticle’s wavelength peak interferes with the absorbance measurements of Thalassiosira pseudonana. The wavelength peak of nano-ZnO was found equal to 395 nm and was confirmed by measuring six concentrations of nano-ZnO (Table 3.5) with a wavelength range of 350-400 nm.
R² = 0.9993 0 0.02 0.04 0.06 0.08 0.1 0.12 0.14 0.16 0 1/4 1/2 3/4 1 A bs or ba nc e ( A bs ) Concentration
674 nm
34Concentration ZnO (mg/L) Absorbance (abs) 100 0.392 50 0.186 25 0.074 12.5 0.035 6.25 0.014 3.125 0.004
Table 3.5. Inhibition (%) as a function of exposure time, industrial ZnO, 10 mg/L.
Figure 3.11. Absorbance vs. Concentration of nano-ZnO.
The relationship between the absorbance of nano-ZnO and its concentration can be seen in Figure 3.11.
3.5.3 Inhibition (%) as a function of exposure time
For the triplicate experiment, 15 mL of nanoparticle suspension were inoculated in 15 mL of diatom culture and placed in a 50 mL Petri dish, gently mixing it afterwards. For industrial nano-ZnO, two concentrations were tested: 10 and 50 mg/L. Control samples consisted in 15 mL of artificial seawater f/2 medium diluted into 15 mL of algae mass culture. Absorbance measurements were repeated at fixed time steps (5, 12, 24, 48, 72, and 96 hours after inoculation).
y = 0.004x - 0.0151 R² = 0.9981 -0.05 0 0.05 0.1 0.15 0.2 0.25 0.3 0.35 0.4 0.45 0 20 40 60 80 100 120 Abs or ba nc e (a bs ) Concentration of ZnO (mg/L) 35
3.5.4 Effect of ZnO concentrations at fixed exposure time
For the two triplicate experiments, 15 mL of nanoparticle suspension were inoculated in 15 mL of diatom culture and placed in a 50 mL Petri dish, gently mixing it afterwards. For industrial nano-ZnO, three concentrations were tested: 1, 10, and 50 mg/L. Control samples consisted in 15 mL of artificial seawater f/2 medium into 15 mL of algae mass culture. The absorbance was measured (the latter with Beckman Coulter DU 720 spectrophotometer) and samples were incubated. Then, absorbance measurements were repeated after 48 hours.
3.6 Results
3.6.1 Zinc Oxide dissolution
Prior to performing the growth inhibition experiments, the dissolution (%) of two concentrations of ZnO nanoparticles (10 mg/L and 50 mg/L) as a function of the pH of the aqueous media was assessed by means of Visual MINTEQ, as can be seen in Figure 3.12, while Figure 3.13 plots the amount of dissolved zinc ion Zn2+
(expressed in mg/L) as a function of the pH.
The information regarding dissolution (%) and pH was used in order to estimate the amount of dissolved zinc ion in the aqueous media as a function of the exposure time. The pH of Thalassiosira pseudonana exposed to industrial-derived nano-ZnO (50 mg/L), measured at 0 and 48 hours after inoculation, had a constant value of 8.5 (Spisni and Seo et al., 2016 submitted58).
Figure 3.12. Dissolution (%) of zinc oxide vs. pH. . Figure 3.13. Zn2+ dissolved (mg/L) vs. pH. 0 10 20 30 40 50 60 70 80 90 100 1 2 3 4 5 6 7 8 9 10 11 12 13 14 D iss ol ut io n ( % ) pH
Dissolution (%) vs. pH
50 mg/L 10 mg/L 0.00 10.00 20.00 30.00 40.00 50.00 60.00 1 2 3 4 5 6 7 8 9 10 11 12 13 14 Zn 2+ d iss ol ve d (m g/ L) pHAmount of dissolved Zn
2+vs. pH
373.6.2 Particle size and zeta potential
The particle size of industrial-derived zinc oxide nanoparticles, as mentioned in Spisni and Seo et al. (2016, submitted)58 was assessed by means of X-Ray
Diffraction (XRD) analysis. The measurement indicates that industrial-derived zinc oxide nanoparticles have a diameter equal to 24 nm.
A Zetasizer Nano ZS90 (Malvern Instrument, UK) was used in order to measure the particle size and the zeta potential of Thalassiosira pseudonana exposed to industrial-derived nano-ZnO (50 mg/L). The measurements, taken at 0 and 48 hours after inoculation, showed that the particle size slightly increased from 1549 nm to 1574 nm, while the zeta potential decreased from -9.0 mV to -8.5 mV (Spisni and Seo et al., 2016 submitted58).
3.6.3 Inhibition (%) as a function of exposure time
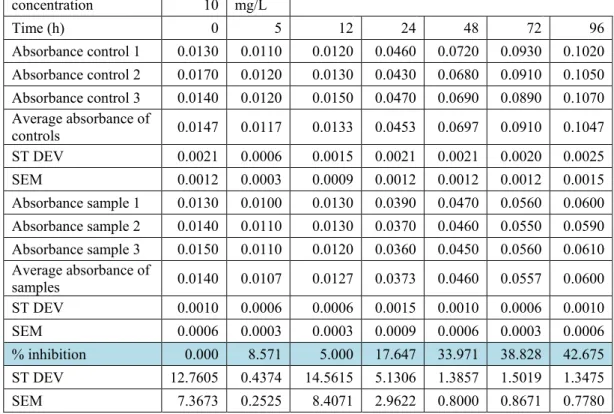
The results of the experiments are presented in the following tables. In rows 3 to 5 it is possible to see the absorbance values of the three control samples, while in row 6 it is possible to see their average. Then, in rows 9 to 11 it is possible to see the absorbance values of the three ZnO samples (10 mg/L in Table 3.6 and 50 mg/L in Table 3.7), while in row 12 it is possible to see their average.
The inhibition (%) of Thalassiosira pseudonana, reported in row 15, was computed using the following formula, according to the study “Growth Inhibition and Induction of Apoptosis in SHG-44 Glioma Cells by Chinese Medicine Formula ‘Pingliu Keli’” by Cao et al. (2011)59:
% inhibition (t) = 100 − 100 ∗average absorbance control (t)average absorbance ZnO (t) Several statistical analysis were conducted:
• The standard deviation, σ, measuring the dispersion of a set of data, visible in rows 7, 13, and 16, is computed according to the following, where n = 3 and 𝑥𝑥̅ is the average of the three samples:
σ=�∑(x-x�)(n-1) 2
• The Standard Error of the Mean, (i.e., SEM), measuring the precision of the mean, visible in rows 8, 14, and 17, is computed according to the following:
SEM= σ √n
• The Student’s t-test (Two samples assuming equal variance), with the purpose of determining whether two data sets are significantly different from each other (control samples vs. nano-ZnO samples): Statistical significance (p < 0.05) was found for each set of data with t > 24 hours. The results of the experiments can be seen in Figure 3.14, and Figure 3.15. concentration 10 mg/L Time (h) 0 5 12 24 48 72 96 Absorbance control 1 0.0130 0.0110 0.0120 0.0460 0.0720 0.0930 0.1020 Absorbance control 2 0.0170 0.0120 0.0130 0.0430 0.0680 0.0910 0.1050 Absorbance control 3 0.0140 0.0120 0.0150 0.0470 0.0690 0.0890 0.1070 Average absorbance of controls 0.0147 0.0117 0.0133 0.0453 0.0697 0.0910 0.1047 ST DEV 0.0021 0.0006 0.0015 0.0021 0.0021 0.0020 0.0025 SEM 0.0012 0.0003 0.0009 0.0012 0.0012 0.0012 0.0015 Absorbance sample 1 0.0130 0.0100 0.0130 0.0390 0.0470 0.0560 0.0600 Absorbance sample 2 0.0140 0.0110 0.0130 0.0370 0.0460 0.0550 0.0590 Absorbance sample 3 0.0150 0.0110 0.0120 0.0360 0.0450 0.0560 0.0610 Average absorbance of samples 0.0140 0.0107 0.0127 0.0373 0.0460 0.0557 0.0600 ST DEV 0.0010 0.0006 0.0006 0.0015 0.0010 0.0006 0.0010 SEM 0.0006 0.0003 0.0003 0.0009 0.0006 0.0003 0.0006 % inhibition 0.000 8.571 5.000 17.647 33.971 38.828 42.675 ST DEV 12.7605 0.4374 14.5615 5.1306 1.3857 1.5019 1.3475 SEM 7.3673 0.2525 8.4071 2.9622 0.8000 0.8671 0.7780
Table 3.6. Inhibition (%) as a function of exposure time, industrial ZnO, 10 mg/L.
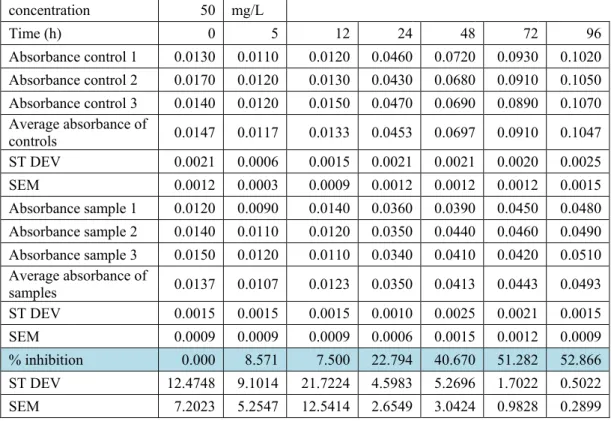
concentration 50 mg/L Time (h) 0 5 12 24 48 72 96 Absorbance control 1 0.0130 0.0110 0.0120 0.0460 0.0720 0.0930 0.1020 Absorbance control 2 0.0170 0.0120 0.0130 0.0430 0.0680 0.0910 0.1050 Absorbance control 3 0.0140 0.0120 0.0150 0.0470 0.0690 0.0890 0.1070 Average absorbance of controls 0.0147 0.0117 0.0133 0.0453 0.0697 0.0910 0.1047 ST DEV 0.0021 0.0006 0.0015 0.0021 0.0021 0.0020 0.0025 SEM 0.0012 0.0003 0.0009 0.0012 0.0012 0.0012 0.0015 Absorbance sample 1 0.0120 0.0090 0.0140 0.0360 0.0390 0.0450 0.0480 Absorbance sample 2 0.0140 0.0110 0.0120 0.0350 0.0440 0.0460 0.0490 Absorbance sample 3 0.0150 0.0120 0.0110 0.0340 0.0410 0.0420 0.0510 Average absorbance of samples 0.0137 0.0107 0.0123 0.0350 0.0413 0.0443 0.0493 ST DEV 0.0015 0.0015 0.0015 0.0010 0.0025 0.0021 0.0015 SEM 0.0009 0.0009 0.0009 0.0006 0.0015 0.0012 0.0009 % inhibition 0.000 8.571 7.500 22.794 40.670 51.282 52.866 ST DEV 12.4748 9.1014 21.7224 4.5983 5.2696 1.7022 0.5022 SEM 7.2023 5.2547 12.5414 2.6549 3.0424 0.9828 0.2899
Table 3.7. Inhibition (%) as a function of exposure time, industrial ZnO, 50 mg/L.
Figure 3.14. Inhibition (%) as a function of exposure time (0, 5, 12, 24, 48, 72, and 96 hrs) for 10 mg/L of industrial ZnO. 0 10 20 30 40 50 60 70 80 90 100 0 20 40 60 80 100 G ro w th Inhi bi tio n (% )
Elapsed time (hours)
Inhibition (%) vs. elapsed time (hours)
Industrial ZnO 10 mg/L
Figure 3.15. Inhibition (%) as a function of exposure time (0, 5, 12, 24, 48, 72, and 96 hrs) for 50 mg/L of industrial ZnO.
The purpose of this experiment was assessing the breakthrough time of nano-ZnO. As can be seen, both nanoparticles induce toxic effects toward the diatom cells. By looking at the experimental data plotted in Figure 3.14 and Figure 3.15, it can be noticed that measurements taken at a time lesser or equal to 24 hours have to be considered unreliable, due to physiological intrinsic variability of biological life: The triplicate experiments showed negligible growth inhibition. Indeed, the inhibition pattern observed from 0 to 24 hours post inoculation can be compared to the lag phase of the bacterial growth cycle portrayed in Figure 3.1660. During this
phase, bacteria adapt to the environment and are unable to multiply. 0 10 20 30 40 50 60 70 80 90 100 0 20 40 60 80 100 G ro w th Inhi bi tio n (% )
Elapsed time (hours)
Inhibition (%) vs. elapsed time (hours)
Industrial ZnO 50 mg/L
Figure 3.16. Typical bacterial growth curve.60
Therefore, data was estimated to be significant only from the subsequent measurement, i.e. 48 hours post inoculation. Moreover, since measurements taken at 48 hours present the first evidence of adverse toxic effect of nano-ZnO toward Thalassiosira pseudonana at both concentrations, this time was chosen as the breakthrough time for the next experiments.
3.6.4 Effect of ZnO concentrations at fixed exposure time
The results of the two experiments are presented in the following tables. In the first three rows of both tables it is possible to see the absorbance values, their average, and standard deviation for the three control samples. Then, it is possible to see the absorbance values, their average and standard deviation obtained for the three nano-ZnO samples (with concentrations of 1, 10, and 50 mg/L).
The inhibition (%) of Thalassiosira pseudonana, reported in column 4, was computed using the following formula, according to the study “Growth Inhibition and Induction of Apoptosis in SHG-44 Glioma Cells by Chinese Medicine Formula ‘Pingliu Keli’” by Cao et al. (2011)59:
% inhibition (t) = 100 − 100 ∗average absorbance control (t)average absorbance ZnO (t) Several statistical analysis were conducted:
• The standard deviation, σ, measuring the dispersion of a set of data, visible in rows 7, 13, and 16, is computed according to the following, where n = 3 and 𝑥𝑥̅ is the average of the three samples:
σ=�∑(x-x�)(n-1) 2
• The standard error of the mean, SEM, measuring the precision of the mean, visible in rows 8, 14, and 17, is computed according to the following:
SEM= σ √n
• The Student’s t-test (Two samples assuming equal variance), with the purpose of determining whether two data sets are significantly different from each other (control samples vs. nano-ZnO samples): Statistical significance (p < 0.05) was found for each data set.
The results of the first experiment are presented in Table 3.8 and Figure 3.17, while the results of the second experiment are presented in Table 3.9 and Figure 3.18.
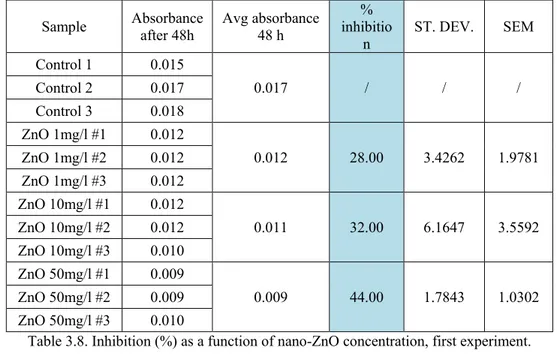
Sample Absorbance after 48h Avg absorbance 48 h inhibitio% n ST. DEV. SEM Control 1 0.015 0.017 / / / Control 2 0.017 Control 3 0.018 ZnO 1mg/l #1 0.012 0.012 28.00 3.4262 1.9781 ZnO 1mg/l #2 0.012 ZnO 1mg/l #3 0.012 ZnO 10mg/l #1 0.012 0.011 32.00 6.1647 3.5592 ZnO 10mg/l #2 0.012 ZnO 10mg/l #3 0.010 ZnO 50mg/l #1 0.009 0.009 44.00 1.7843 1.0302 ZnO 50mg/l #2 0.009 ZnO 50mg/l #3 0.010
Table 3.8. Inhibition (%) as a function of nano-ZnO concentration, first experiment.
Figure 3.17. Inhibition (%) as a function of nano-ZnO concentration, first experiment. 0.00 5.00 10.00 15.00 20.00 25.00 30.00 35.00 40.00 45.00 50.00 Industrial ZnO G ro w th inhi bi tio n (% )
Growth inhibition after 48 hours
1 mg/L 10 mg/L 50 mg/L
Sample Absorbance after 48h Avg absorbance 48 h inhibition ST. DEV. % SEM Control 1 0.030 0.033 / / / Control 2 0.028 Control 3 0.041 ZnO 1mg/l #1 0.033 0.029 13.13 9.6023 5.5439 ZnO 1mg/l #2 0.023 ZnO 1mg/l #3 0.030 ZnO 10mg/l #1 0.017 0.023 31.31 9.8842 5.7067 ZnO 10mg/l #2 0.026 ZnO 10mg/l #3 0.025 ZnO 50mg/l #1 0.016 0.020 40.40 9.0456 5.2225 ZnO 50mg/l #2 0.023 ZnO 50mg/l #3 0.020
Table 3.9. Inhibition (%) as a function of nano-ZnO concentration, second experiment.
Figure 3.18. Inhibition (%) as a function of nano-ZnO concentration, second experiment. 0.00 5.00 10.00 15.00 20.00 25.00 30.00 35.00 40.00 45.00 50.00 Industrial ZnO G ro w th Inhi bi tio n (% )
Growth inhibition after 48 hours
1 mg/L
10 mg/L 50 mg/L
Chapter 4 - Sunscreen nano-ZnO
The aim of the following experiments is testing the toxicity of sunscreen-derived zinc oxide nanoparticles to the diatom Thalassiosira pseudonana. The toxicity to the algal cells was expressed in terms of growth inhibition, which was estimated by the difference in the absorbance of the specimens with respect to the control sample. The experiments were performed at the Environmental Engineering Laboratory of the University of Miami.
4.1 Technical equipment
4.1.1 Beckman Coulter DU 720 Spectrophotometer
A Beckman Coulter DU 720 Spectrophotometer (Figure 3.1) is used in order to measure the absorbance (i.e., the amount of light absorbed by the sample); its specifications are listed in Chapter 3, section 4.1. Prior to running the experiment and measuring the absorbance of a sample, is it necessary to select an appropriate wavelength range and scan a blank sample.
4.1.2 Zetasizer Nano ZS90
A Zetasizer Nano ZS90 (Figure 3.2) is used to measure both the size of particles in an aqueous media and the zeta potential of the colloid; its specifications are listed in Chapter 3, section 4.2. Measurements can be taken by placing the aqueous media in the appropriate cuvette.
4.1.3 Verilux VT 10 - 5000 lux
A Verilux VT 10 - 5000 lux (Figure 3.4) is used in combination with an incubator in order to provide an optimal environment for the growth of Thalassiosira pseudonana. Its timer allows dark:light cycles, essential to the diatom due to its photosynthetic nature.
4.1.4 OrionTM pH meter and glass electrode
The pH meter OrionTM 720Aplus, visible in Figure 3.5, together with the glass
electrode Orion™ 8156BNUWP, visible in Figure 3.6, was used on order to assess the solution’s pH.
4.2 Manufacture of artificial seawater and f/2 medium
The diatom needs artificial seawater and f/2 medium in order to survive in the laboratory. Artificial seawater and f/2 medium were prepared in the laboratory according to Guillard et al. (1962)51 and Keller et al. (1988)52, using the protocol
previously described in Chapter 3.
4.3 Nanoparticles
Sunscreen-derived ZnO nanoparticles were extracted from “Walgreens Clear Zinc” (5% ZnO, 4% Octocrylene) sunscreen61, purchased from a local Walgreens
store (Miami, FL). In order to extract nano-ZnO from sunscreen, the following experimental procedure was adopted, according to Barker & Branch (2008)62
(modified version).
1. Weigh 3 g of sunscreen in a Falcon tube;
2. Add 30 mL of hexane (>99.9% purity, Honeywell Burdick & Jackson, Muskegon, MI) in the Falcon tube;
3. Sonicate for one minute, then centrifuge at 4400 revolutions per minute (rpm) for five minutes;
4. Discard the hexane solution and add 30 mL of ethanol (>95% purity, Pharmco-Aaper Shelbyville, KY)
5. Sonicate for one minute, then centrifuge at 4400 rpm for five minutes; 6. Discard the ethanol solution and add 30 mL of deionized (DI) water; 7. Shake the Falcon tube manually and centrifuge at 3000 rpm for 10
minutes;
8. Discard the solution on top of the Falcon tube and repeat step number 6 and 7 for two times;
9. Discard the solution on top of the Falcon tube and dry samples in oven at 100°C for at least 12 hours;
10. Place the samples in the desiccator.
A sterilized grinder is used to obtain a finer powder. The toxic effects of nano-ZnO were investigated by suspending 1, 10, and 50 mg of nano-ZnO nanoparticles in 1 L of artificial seawater f/2 medium.
4.4 Diatom culture
Thalassiosira pseudonana cells were purchased from Bigelow Laboratory for Ocean Sciences (CCMP 1335)54. The culture of Thalassiosira pseudonana was
obtained by adding artificial seawater f/2 medium to the originally purchased culture. Then the culture was incubated at a constant temperature of 26°C, with 12h:12h (dark:light) cycles maintained with Verilux VT 10 - 5000 lux.
4.5 Experimental setup
4.5.1 Detection of Thalassiosira pseudonana absorbance wavelength
In order to estimate the growth inhibition induced by sunscreen-derived nano-ZnO toward the marine diatom Thalassiosira pseudonana, several absorbance tests were performed. The aim of the experiment is to find a relationship between the absorbance measured with the spectrophotometer and the algae concentration in the samples. This indirect measurement of the growth inhibition was chosen due to the difficulties associated with direct measurements.
As already stated in Chapter 3, the issue associated with this type of indirect measurement was finding the wavelength corresponding to the algae’s peak in the red band. A wide range of wavelengths were tested, and measurements assessed that the peak of absorption of Thalassiosira pseudonana occurred at a wavelength corresponding to 674 nm. The relationship between the absorbance of Thalassiosira pseudonana and its concentration in artificial seawater, for a wavelength of 674 nm can be seen in Figure 3.8. This value was used to analyze the changes in the absorbance of poisoned diatom cells in next experiments.
4.5.2 Inhibition (%) as a function of exposure time
For the triplicate experiment, 15 mL of nanoparticle suspension were inoculated in 15 mL of diatom culture and placed in a 50 mL Petri dish, gently mixing it afterwards. For sunscreen-derived nano-ZnO, two concentrations were tested: 10
and 50 mg/L. Control samples consisted in 15 mL of artificial seawater f/2 medium diluted into 15 mL of algae mass culture. The absorbance measurements were repeated at fixed time steps (0, 5, 12, 24, 48, 72, and 96 hours after inoculation).
4.5.3 Effect of ZnO concentrations at fixed exposure time
For the two triplicate experiments, 15 mL of nanoparticle suspension were inoculated in 15 mL of diatom culture and placed in a 50 mL Petri dish, gently mixing it afterwards. For sunscreen-derived nano-ZnO, three concentrations were tested: 1, 10 and 50 mg/L. Control samples consisted in 15 mL of artificial seawater f/2 medium into 15 mL of algae mass culture. Absorbance measurements were repeated after 48 hours.
4.6 Results
4.6.1 Zinc Oxide dissolution
The pH of Thalassiosira pseudonana exposed to sunscreen-derived nano-ZnO (50 mg/L), measured at 0 and 48 hours after inoculation, slightly increased from 8.5 to 8.6 (Spisni and Seo et al., 2016 submitted 58).
4.6.2 Particle size
The particle size of sunscreen-derived zinc oxide nanoparticles, as mentioned in Spisni and Seo et al. (2016, submitted)58 was assessed by means of X-Ray
Diffraction (XRD) analysis. The measurement indicates that sunscreen-derived zinc oxide nanoparticles have a diameter equal to 31 nm.
A Zetasizer Nano ZS90 (Malvern Instrument, UK) was used in order to measure the particle size and the zeta potential of Thalassiosira pseudonana exposed to sunscreen-derived nano-ZnO (50 mg/L). The measurements, taken at 0 and 48 hours after inoculation, showed that the particle size increased from 1234 nm to 2217 nm, while the zeta potential decreased from -8.5 mV to -4.0 mV (Spisni and Seo et al., 2016 submitted58).
4.6.3 Inhibition (%) as a function of exposure time
The results of the experiments are presented in Table 4.1 and Table 4.2. In rows 3 to 7 it is possible to see the absorbance values, their average, and standard
deviation obtained for the three control samples. Then, in rows 9 to 13 it is possible to see the absorbance values, their average, and standard deviation obtained for the three ZnO samples (10 mg/L in Table 4.1 and 50 mg/L in Table 4.2).
The inhibition (%) of Thalassiosira pseudonana, reported in row 15, was computed using the following formula, according to the study “Growth Inhibition and Induction of Apoptosis in SHG-44 Glioma Cells by Chinese Medicine Formula ‘Pingliu Keli’” by Cao et al. (2011)59:
% inhibition (t) = 100 − 100 ∗average absorbance control (t)average absorbance ZnO (t) Several statistical analysis were conducted:
• The standard deviation, σ, measuring the dispersion of a set of data, visible in rows 7, 13, and 16, is computed according to the following, where n = 3 and 𝑥𝑥̅ is the average of the three samples:
σ=�∑(x-x�)(n-1) 2
• The standard error of the mean, SEM, measuring the precision of the mean, visible in rows 8, 14, and 17, is computed according to the following:
SEM= σ √n
• The Student’s t-test (Two samples assuming equal variance), with the purpose of determining whether two data sets are significantly different from each other (control samples vs. nano-ZnO samples): Statistical significance (p < 0.05) was found for each set of data with t > 24 hours. The results of the experiments, reported in Table 4.1, and Table 4.2, are plotted in Figure 4.1, and Figure 4.2.
concentration 10 mg/L Time (h) 0 5 12 24 48 72 96 Absorbance control 1 0.0130 0.0110 0.0120 0.0460 0.0720 0.0930 0.1020 Absorbance control 2 0.0170 0.0120 0.0130 0.0430 0.0680 0.0910 0.1050 Absorbance control 3 0.0140 0.0120 0.0150 0.0470 0.0690 0.0890 0.1070 Average absorbance of controls 0.0147 0.0117 0.0133 0.0453 0.0697 0.0910 0.1047 ST DEV 0.0021 0.0006 0.0015 0.0021 0.0021 0.0020 0.0025 SEM 0.0012 0.0003 0.0009 0.0012 0.0012 0.0012 0.0015 Absorbance sample 1 0.0130 0.0120 0.0110 0.0410 0.0510 0.0580 0.0680 Absorbance sample 2 0.0160 0.0100 0.0130 0.0390 0.0480 0.0570 0.0690 Absorbance sample 3 0.0170 0.0110 0.0120 0.0380 0.0470 0.0580 0.0650 Average absorbance of samples 0.0153 0.0110 0.0120 0.0393 0.0487 0.0577 0.0673 ST DEV 0.0021 0.0010 0.0010 0.0015 0.0021 0.0006 0.0021 SEM 0.0012 0.0006 0.0006 0.0009 0.0012 0.0003 0.0012 % inhibition 0.000 5.714 10.000 13.235 30.144 36.630 35.669 ST DEV 14.3740 13.1434 10.0462 5.2909 1.5031 1.5458 3.1783 SEM 8.2988 7.5884 5.8002 3.0547 0.8678 0.8925 1.8350
Table 4.1. Inhibition (%) as a function of exposure time, sunscreen-derived ZnO, 10 mg/L.
concentration 50 mg/L Time (h) 0 5 12 24 48 72 96 Absorbance control 1 0.0130 0.0110 0.0120 0.0460 0.0720 0.0930 0.1020 Absorbance control 2 0.0170 0.0120 0.0130 0.0430 0.0680 0.0910 0.1050 Absorbance control 3 0.0140 0.0120 0.0150 0.0470 0.0690 0.0890 0.1070 Average absorbance of controls 0.0147 0.0117 0.0133 0.0453 0.0697 0.0910 0.1047 ST DEV 0.0021 0.0006 0.0015 0.0021 0.0021 0.0020 0.0025 SEM 0.0012 0.0003 0.0009 0.0012 0.0012 0.0012 0.0015 Absorbance sample 1 0.0160 0.0100 0.0130 0.0360 0.0450 0.0500 0.0570 Absorbance sample 2 0.0130 0.0110 0.0130 0.0390 0.0430 0.0470 0.0590 Absorbance sample 3 0.0140 0.0110 0.0120 0.0380 0.0440 0.0460 0.0570 Average absorbance of samples 0.0143 0.0107 0.0127 0.0377 0.0440 0.0477 0.0577 ST DEV 0.0015 0.0006 0.0006 0.0015 0.0010 0.0021 0.0012 SEM 0.0009 0.0003 0.0003 0.0009 0.0006 0.0012 0.0007 % inhibition 0.000 8.571 5.000 16.912 36.842 47.619 44.904 ST DEV 23.3035 0.4374 14.5615 6.5617 0.6367 1.2106 1.6040 SEM 13.4543 0.2525 8.4071 3.7884 0.3676 0.6989 0.9261
Table 4.2. Inhibition (%) as a function of exposure time, sunscreen-derived ZnO, 50 mg/L.
Figure 4.1.Inhibition (%) as a function of exposure time (0, 5, 12, 24, 48, 72, and 96 hrs) for 10 mg/L of sunscreen-derived ZnO.
Figure 4.2. Inhibition (%) as a function of exposure time (0, 5, 12, 24, 48, 72, and 96 hrs) for 50 mg/L of sunscreen-derived ZnO.
The purpose of this experiment was assessing the breakthrough time of nano-ZnO. As can be seen, both nanoparticles induce toxic effects toward the diatom
0 10 20 30 40 50 60 70 80 90 100 0 20 40 60 80 100 G ro w th Inhi bi tio n (% )
Elapsed time (hours)
Inhibition (%) vs. elapsed time (hours)
Sunscreen ZnO 10 mg/L 0 10 20 30 40 50 60 70 80 90 100 0 20 40 60 80 100 G ro w th Inhi bi tio n (% )
Elapsed time (hours)
Inhibition (%) vs. elapsed time (hours)
Sunscreen ZnO 50 mg/L