ALMA MATER STUDIORUM – UNIVERSITÀ DI BOLOGNA
SCUOLA DI INGEGNERIA E ARCHITETTURA
Dipartimento di ingegneria civile, chimica, ambientale e dei materiali (DICAM)
CORSO DI LAUREA MAGISTRALE IN INGEGNERIA CHIMICA E DI PROCESSO
TESI DI LAUREA in
Thermodynamics of Energy and Materials
High-pressure adsorption differential
volumetric apparatus (HP-ADVA) for
accurate equilibrium measurements
CANDIDATE: SUPERVISOR: Ilaria Ceteroni Prof. Marco Giacinti Baschetti CO-SUPERVISORS: Prof. Enzo Mangano Ing. Riccardo Rea
A.A. 2019/2020 Session III
3
Abstract
The volumetric system is a commonly used experimental method for gas adsorption measurements. Starting from the conventional volumetric system (single-branched), the development of differential (double-branched) apparatus has been proposed to overcome some criticalities connected to the original design. The following study is focused on the assessment of the high-pressure differential volumetric apparatus (HP-ADVA) built at the University of Edinburgh in order to discover and characterise system peculiarities at different experimental conditions, in terms of temperature and pressure. To do this, an integrated approach is proposed: an initial experimental campaign has been performed to take confidentiality with the apparatus, then, the experimental results were the starting point for the development of a sensitivity and error analysis aimed at describing the effect of each operating parameter into the final result. In this regard, a different analytical approach, compared to the ones commonly proposed in literature, has been proposed to closely reproduce the real system. Beyond having obtained promising results, some criticalities, matching what originally hypothesized from the experimental campaign, have been noted: valve volume effect and temperature control and measurements have been discovered being crucial aspects, and, supposedly, source of errors leading to explain the unexpected results obtained by the experimental campaign. Moreover, the importance of symmetry maintenance among the branches has been repeatedly confirmed in the analysis. Some recommendations aimed at improving the system set-up have been moved regarding the installation of a temperature control system and more accurate temperature measurement devices. Additionally, an accurate assessment and characterisation of pneumatically-actuated valves, as well as of the differential pressure transducer used for pressure measurement, before the installation, could be useful to reduce inaccuracies.
Keywords: Adsorption - Isotherm - Volumetric method - Differential pressure gas adsorption - High pressure adsorption - Sensitivity and error analysis
4
Table of contents
ABSTRACT ... 3
INTRODUCTION ... 7
AIMS AND OBJECTIVES ... 14
CHAPTER 1 - THEORETICAL FOCUS ... 16
1.1 OVERVIEW OF GRAVIMETRIC APPARATUS ... 16
1.2 OVERVIEW OF CHROMATOGRAPHIC/FLOW APPARATUS ... 18
1.3 VOLUMETRIC APPARATUS ... 19
1.3.1 Volumetric apparatus: sensitivity analysis ... 21
CHAPTER 2 - EXPERIMENTAL METHODS AND MATERIALS ... 24
2.1 SYSTEM SET-UP: REAL LABORATORY APPARATUS ... 24
2.2 EXPERIMENTAL PROCEDURE AT AMBIENT TEMPERATURE ... 29
2.2.1 Procedure for equilibrium measurements: isotherm construction ... 29
2.2.2 Procedure for apparatus calibration ... 30
2.3 EXPERIMENTAL PROCEDURE AT CRYOGENIC CONDITIONS ... 33
CHAPTER 3 - ANALYTICAL METHODS ... 37
3.1 SINGLE-BRANCH SYSTEM MASS BALANCE ... 37
3.2 DIFFERENTIAL SYSTEM MASS BALANCE ... 39
3.3 SYSTEM CALIBRATION ... 41
CHAPTER 4 - RESULTS AND DISCUSSION OF EXPERIMENTAL CAMPAIGN ... 43
4.1 EQUILIBRIUM MEASUREMENT: BLANK RESPONSE ... 43
4.1.1 Blank response at ambient temperature ... 43
4.1.2 Blank response at cryogenic conditions ... 45
4.2 DIFFERENTIAL PRESSURE TRANSDUCER: OFFSET POINT ... 48
4.3 CALIBRATION PROCEDURE ... 49
4.3.1 Volume ratios ... 49
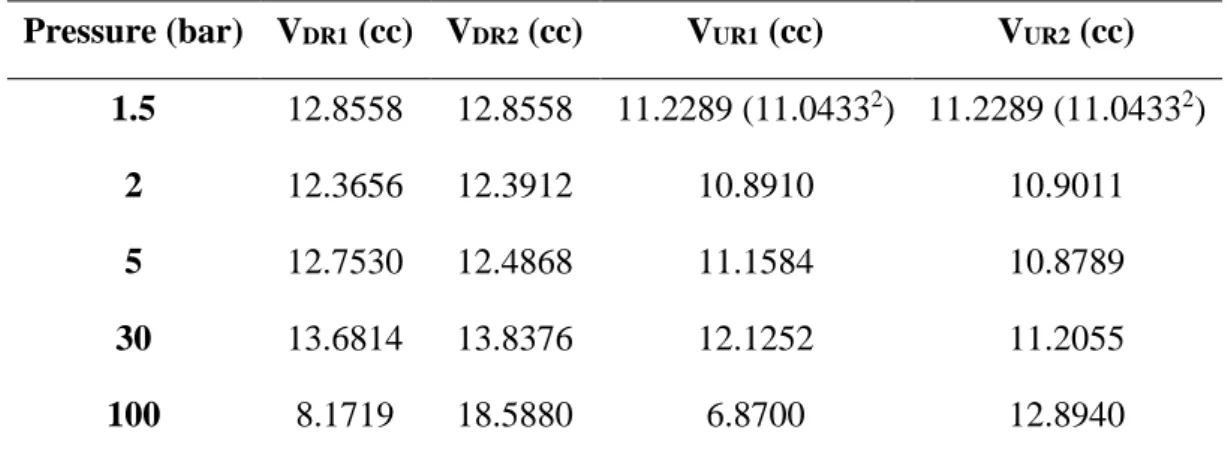
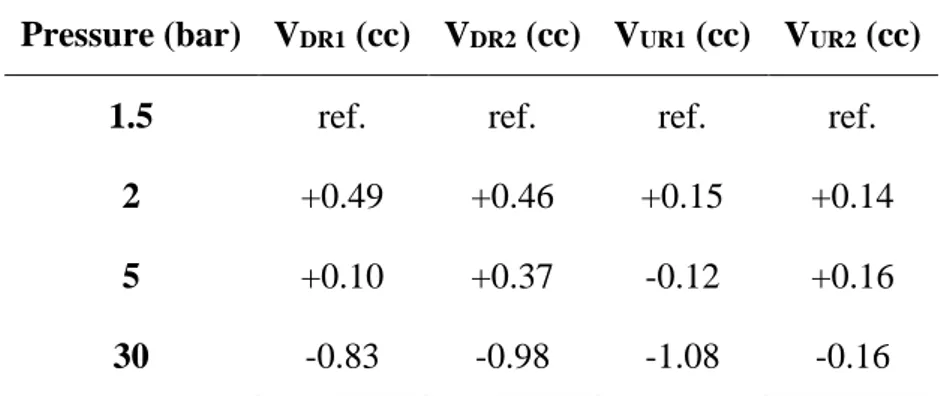
4.3.2 Volume absolute values ... 53
4.3.3 Valve characterisation ... 58
CHAPTER 5 - SENSITIVITY ANALYSIS: METHODS AND MATERIALS ... 60
5
5.2 HYPOTHETICAL ISOTHERM ... 63
5.3 SYSTEM PARAMETERS AND INDIVIDUAL UNCERTAINTIES ... 64
5.2.1 Single-branch system ... 65
5.2.2 Differential system ... 67
CHAPTER 6 - RESULTS AND DISCUSSION OF SENSITIVITY ANALYSIS ... 69
6.1 CALIBRATED VOLUME ... 69
6.2 VALVE VOLUME ... 76
6.3 LABORATORY BALANCE ACCURACY ... 79
6.4 PRESSURE READINGS ... 82
6.5 TEMPERATURE READINGS ... 86
6.6 SUMMARY AND CUMULATIVE ERROR ... 91
CONCLUSION AND FUTURE WORK... 96
REFERENCES ... 98
APPENDIX ... 104
A1. CORRECTIVE FACTORS FOR BLANK RESPONSE ... 104
A2. EFFECT OF DIFFERENTIAL PRESSURE TRANSDUCER OFFSET ... 104
A3. PNEUMATICALLY-ACTUATED VALVE COMPRESSED AIR ... 105
A4. SUPPLEMENTARY ANALYTICAL METHODS ... 105
7
Introduction
A separation can be defined as a process that transforms a mixture of substances into two or more products that differ from each other in composition. In a process scheme, the separation steps often account for the major operative costs, for this reason the research and development of novel technologies is of interest in many fields. The separation is caused by a mass separating agent which is different depending on the technique considered; for example, in adsorption processes, the separating agent is the solid sorbent while in absorption processes is the liquid solvent (King, 1980; Yang, 2003).
Separation processes can be applied to gas stream: it is a widely used technique in which the objective is the separation of one or more gases from a mixture. It is becoming crucial for several industrial applications such as the treatment of fumes from coal-fired plants aimed at the removal and the storage of CO2 to reduce the greenhouse effect and environmental issues. Growing interest is also given to separation and purification of commercially important gases such as H2, CH4 and O2 from natural gas. In particular, the rapid growth in greenhouse gas emissions has stimulated worldwide attention to look for green and clean energy resources alternatives to traditional fossil fuels. Hydrogen and methane, as clean and low-carbon energy sources, have shown the increased demands in the energy system and transport sector such as electricity generation, heating, and vehicle fuels (Luo et al., 2018). Oxygen, from air purification, is ranked among the most widely used commodity chemicals in the world because it is used for oxy-fuel combustion process and oxygen-blown gasification to convert coal and natural gas into intermediate synthesis gas (Bose, 2009).
The principal techniques used to perform gas separation are: • separation by cryogenic distillation
• separation with membrane
• separation with solvents/sorbents
Cryogenic distillation is based on the fact that, in a gas mixture, all components have different boiling points and the separation can be performed by increasing/decreasing the temperature and pressure of the system. The gas mixture is cooled down to low temperature (typically < -50 °C). Once in the liquid state, the components of the mixture can be directed in
8
a distillation column and through a series of compression, cooling and expansion steps, they can be distributed to different channels, depending on their boiling points (see Fig. 1). It is a widely used technique for streams that already have a high concentration in the desired gas (typically >90%) but it is not very appropriate for diluted gas streams. The main advantage of the cryogenic gas separation is the direct liquefaction, which is useful for transportation. A major disadvantage is connected with the high amount of energy required for refrigeration. Cryogenics would normally only be applied to high concentration and high pressure gases, such as in pre-combustion capture processes or oxygen-fired combustion.
Figure 1 - Separation by cryogenic distillation (basic scheme).
Membrane technologies are among the most developing fields for gas separation: one of the greatest advantages regards the variety of membrane materials leading to high diversification in the potential applications. Operatively, the gas mixture is directed into a vessel and put in contact with the membrane material which is at the interface with another vessel. The mixture is allowed to diffuse into the second vessel under a pressure gradient which promotes the mass transport through the membrane separating the retentate (slower gas) from the permeate (faster gas) (see Fig. 2). The use of membranes for gas separation offers several benefits, probably the most valuable is the high cost-efficiency (both for the mechanical simplicity of the system and for low-energy requirements) in fact, they do not require thermal regeneration, phase change or active moving parts for the operation. On the other hand, the greatest limitation of membranes for gas separation derives from their trade-off relationship between permeability and selectivity: highly permeable membranes generally show low selectivity, requiring several run for a good separation, while, highly selective membranes have low permeability, meaning long operational times. Among the major industrial applications are comprised the H2 recovery from NH3 -synthetic loop, enhanced oil recovery, N2/O2 separation for modified atmospheres production and CH4 upgrading with CO2 removal.
9
Figure 2 - Separation with membrane (basic scheme).
The use of solvents for gas separation is based on the affinity of the target gas toward a solvent. For instance, amine scrubbing technology was established over 60 years ago in the oil and chemical industries, for removal of H2S and CO2 from gas streams and, commercially, it is the most well-established of the techniques available (see example in Fig. 3). Mono-ethanolamine (MEA) is a widely used type of amine for carbon capture. CO2 recovery rates of 98% and product purity in excess of 99% can be achieved. There are, however, questions about its rate of degradation in oxidising environment and about the amount of energy required for regeneration. Improved solvents could reduce energy requirements, by as much as 40% compared to conventional MEA solvents. For example, there is considerable interest in the use of sterically-hindered amines which are claimed to have good absorption and desorption characteristics.
Figure 3 – Example of separation with solvent/absorption (basic scheme) (Aforkoghene Aromada & Øi,
10
Finally, gas separation can be performed by using sorbents: the gas mixture is put in contact with a solid support (adsorbent) which acts as separating agent. The invention and development of new sorbents and adsorption process cycles have made adsorption a key separation tool in the chemical, petrochemical and pharmaceutical industries. Some examples of adsorption applications are the energy storage: materials such as metal hybrids and carbon nanotubes are employed to improve the effectiveness of hydrogen storage for fuel cell powered automobiles (Zielinski et al., 2007). Technologies for meeting high standards on air and water purification: trace impurity removal (less than 1% concentration) is of major interest due to the difficulties in applying other separation processes. In this concern, the field of carbon dioxide sequestration captured high attention in last years coupled with dehydration and sweetening of natural gas, desulfurization of hydrocarbon streams and removal of organic pollutants from water which are processes yet implemented in large scale. Some industrial bulk separations are based on adsorption technique too and account of processes like hydrogen production, air separation O2/N2, linear/branched by cyclic paraffins, olefin/paraffin and aromatic isomers separation.
The heart of an adsorptive process is the porous solid medium: it should provide a very high surface area or high micropore volume with which high adsorptive capacity can be achieved. The classification of sorbents can be done considering the mean pore size as recommended by IUPAC (Sing et al., 1985) into microporous (d<2 nm), mesoporous (2 nm<d< 50 nm) and macroporous materials (d>50 nm). At commercial level, six types of sorbents can be distinguished: activated carbon, silica gel, activated alumina, zeolites, clays, polymers and resins (Yang, 2003). The success of the process depends on how the solid performs in both equilibria and kinetics: a combination of the two classifies the material as a good adsorbent (Do, 1998). The adsorptive separation is indeed based on one of three existing mechanisms: steric, kinetic or equilibrium.
The steric effect derives from the sieving properties of the sorbent: due to the dimension of the pores of the solid, small molecules can enter the material while large molecules are excluded from entering. Two major applications are drying with 3A zeolite and the normal from iso-paraffins or cyclic hydrocarbons separation using 5A zeolite.
Kinetic separations are nowadays a field of intense research and development for their potentiality when equilibrium separations are not feasible. The mechanism is based on the different rates of diffusion of the species into the pore: controlling the time of exposure, the faster diffusing species is removed by the solid. Air separation by PSA (i.e.
pressure-swing-11
adsorption) using zeolite to produce O2 from air is a good example of kinetic separation; separation of methane from CO2 and upgrading of natural gas by nitrogen removal are large potential applications too.
Last mechanism of adsorption is the equilibrium one and it is based on the type of interactions between the solid and the species. The starting point is the examination of the properties of the targeted molecule such as polarizability, magnetic susceptibility, permanent dipole moment and quadrupole moment. In this case the stronger adsorbing species is preferentially removed by the solid (Do, 1998; Yang, 2003).
A basic schematization is provided in the Fig. 4:
Figure 4 - Separation with sorbent/adsorption (basic scheme).
Adsorption equilibria information is the most important piece of information in understanding an adsorption process: it is essential for understanding how much of a component can be accommodated by a solid adsorbent. This information can be used in the study of adsorption kinetics of a single component, adsorption equilibria of multicomponent systems, and then adsorption kinetics of multicomponent systems (Do, 1998).
Commonly, the adsorption isotherms are measured or predicted using molecular simulations. Among them, Monte Carlo simulation is used for adsorption analyses helping visualizing how the adsorption takes place. Experimentally, the majority of adsorption measurements are carried out with three techniques: volumetric, chromatographic/flow and gravimetric. A more detailed discussion of the experimental methods is provided in the Chapter 1, because it will be the focus of the thesis.
12
Attention needs to be paid to the origin of the data collected experimentally: when measuring adsorption of a gas onto a solid sorbent, it is not possible to measure directly the absolute adsorbed amount; the absolute adsorbed amount is defined as the ratio among the number of gas moles adsorbed and the volume of adsorbent (or mass). However, what is actually measured, is the difference between two quantities which are the excess adsorbed amount, typically measured as the difference between the molecule of interest and a reference (99% of the time Helium is used as reference) and the net adsorbed amount, which is the measure relative to the same system without the adsorbent. For microporous solids, the estimation of the absolute adsorbed amount requires the calculation of the solid volume that includes the micropores, in fact, the accumulation inside the pores is higher compared to adsorption on the external surface, which is generally negligible.
Briefly, considering a system having a total volume VS , comprising the porous and
micropore volume; the total number of moles in the system is: (1) nTOT= nA+ nS
where “A” stands for the adsorbate and the “S” for the solid. In the absolute adsorption evaluation, the solid is removed: (2) nabs = n
TOT − nS
In the net adsorbed amount, the moles in a fluid at same temperature and pressure, in equilibrium with the adsorbed phase, that would occupy the system volume is removed:
(3) nnet= nabs − VSc = nA − VSc where c = P
zRT , is the total concentration.
The excess adsorbed amount is finally defined through the definition of the so called non-accessible volume (VNA):
(4) nex= nabs − (V
S − VNA)c = nA − (VS − VNA)c
Some difficulties arise in defining and estimating the non-accessible volume, this is the reason why the excess quantity is generally more difficult to be calculated. Once defined the number of moles, relationships for the adsorbed phase concentration can be obtained:
13 (5) qabs = nabs VS = nA VS (6) qnet = nabs VS − c = qabs − c (7) qex = nabs VS − VS − VNA Vs c = qabs − εmc
where εm is the porosity of the material. An accurate definition of absolute, excess and net
adsorbed amount can be found in (Brandani et al., 2016).
The clear definition of these three magnitudes is a core aspect when dealing with adsorption measurements to be consistent and free from errors. Indeed, the absolute amount is the one used for mass balances and modelling. Equilibrium adsorption models are used for fitting the experimental data: along the discussion, reference to different models is done such as the Langmuir model, the Dual-site Langmuir and the Toth model. However, a detailed analysis of the models is not provided because it is not the focus of the thesis; reference to (Ruthven, 1985) manual is advised for a detailed description of all the approaches used.
14
Aims and objectives
The overall goal of this thesis is to perform an accurate characterisation and final commissioning of the novel high-pressure volumetric differential apparatus (HP-ADVA) for gas adsorption analysis built at the University of Edinburgh (University of Edinburgh - Fleeming Jenkins Building Lab 1.196D).
The approach used for the analysis can be divided in three main sections: first of all a literature review has been developed, followed by a brief experimental campaign, which was stopped due to the closure of laboratories for the Covid-19 pandemic situation. This was the reason to propose a third section in which an error and sensitivity analysis has been developed for the system.
In the section dedicated to the experimental campaign, an example of adsorption experiment without adsorbent (blank experiment) is proposed, from which some issues have been pointed out justifying the following experimental steps: firstly, the calibration of the apparatus, performed in a wide pressure range, has been performed to evaluate the effect of the absolute pressure on calibration procedure. Moreover, valve characterisation assessment has been conducted to account for the presence of no-zero volume valves in the system. The development of a protocol for cryogenic experiments has been explored too, to better understand the behaviour of the apparatus in different and extreme experimental conditions.
A said, the experimental campaign was blocked due to the pandemic and it will result incomplete to the reader. Alternatively, the development of a sensitivity and error analysis, for the high-pressure volumetric differential apparatus (HP-ADVA), is proposed, in line with the overall aim of the project to accurately study all the criticalities of the apparatus.
Indeed, a high volume of literature has been produced providing data for accurate experimental procedures and the acquisition of reliable data at low pressure conditions using different experimental apparatus such as gravimetric, volumetric and chromatographic systems. The same work should be done for high-pressure data acquisition systems. The experimental techniques, used for the determination of high-pressure pure gas adsorption isotherms, are not different in their principle from those used in the low-pressure area (Bereznitski et al., 1997; Nakashima et al., 1995; Rouquerol et al., 1999). However, high-pressure adsorption measurements are more difficult to be achieved than low-pressure ones and the number of experimental studies remains too low to provide comparative tests between experimental results obtained for the same systems on different equipment (Belmabkhout et al., 2004).
15
Consequently, this thesis aims to study and someway assess the reliability of the HP-ADVA apparatus in performing adsorption equilibrium measurements focusing the attention on the analysis of the performances at high pressure conditions. Finding the effective impact of uncertainties introduced in operating/design parameters and, in particular, how and to which extent each uncertainty affects the final isotherm construction is within the objectives of the study. In particular, a comparison among a conventional (single-branched) volumetric apparatus and our differential (double-branched) apparatus is proposed: a consistent lack in the available literature can be noticed also in this case, being the majority of the studies focused on the analysis of the only conventional volumetric system (Belmabkhout et al., 2004; Blach & Gray, 2007; Blackman et al., 2006; Broom & Moretto, 2007; Demirocak et al., 2013; Mohammad et al., 2009; Wang et al., 2020; Webb & Gray, 2014a, 2014b).
An important point to be considered is that the common practices used for the development of sensitivity analysis of volumetric systems appear poorly reproduce the reality; thus, an attempt to propose a new approach to the analysis is provided too.
16
Chapter 1 - Theoretical focus
Chapter 1 is dedicated to a brief introduction of the experimental techniques that are commonly used for adsorption experiments: the gravimetric and chromatographic/flow systems will be simply mentioned in their principles, while a deeper description of the volumetric system is provided being the subject of the research project. Additionally, a short section regarding the sensitivity and error analysis applied to volumetric systems will be furnished as literature base for the analysis proposed forward.
1.1 Overview of gravimetric apparatus
The gravimetric method consists of exposing a clean adsorbent sample to a pure gas at constant temperature. This experimental method is considered a well-established and quite accurate measurement technique (Belmabkhout et al., 2004). There are several possible configurations in which a micro-balance can be inserted into a system to measure adsorption kinetics. Commercially available systems in common use are electronic microbalances, but other examples such as the McBain balance, that rely on the optical measurement of the extension of a spring connected to the sample, are also used. The sensitivity of an electro-balance is strongly dependent on how and where the system is mounted as the stability of the baseline is affected by any vibration. Ideally the balance should be mounted rigidly and anchored to a basement wall. The first important distinction between electronic micro-balances is whether the system is symmetric or asymmetric. In the symmetric case the two branches of the balance are exposed to the same gas and are thermostated to the same temperature. In the asymmetric case only one branch of the balance is at the same conditions of the sample, while the reference branch is at near to room temperature exposed to the same gas or with an inert purge that is used to protect the electronic part of the balance (Wang et al., 2020).
The measurements are based on the estimation of the force acting on the sample in a configuration schematically shown in Fig. 5. The absorbed amounts are determined by a force balance whose main contributions are the weight, buoyancy and drag. So, the measured force is the resultant of the weight of the sample holder (MBu), the weight of the solid (MS) and
adsorbate (MWA) minus the buoyancy acting onto the volume of the solid which includes the
17
Figure 5 - Schematic diagram of a (a) symmetric gravimetric system and (b) asymmetric gravimetric system
(Wang et al., 2020).
In particular:
(8) Ω = (MBu+ MS+ nAMW𝐴)g − (εmVS+ VNA+ VBu)cMW𝐴g
the expression is obtained neglecting the drag force due to the moving system; if 𝜀𝑚𝑉𝑆+ 𝑉𝑁𝐴 = 𝑉𝑆 is known, the experimentally determined force can be converted into absolute absorbed amount. If only the mass and the volume of the sample holder are used to correct the reading, the net adsorbed amount is then calculated:
(9) Ω − (MBu+ MS)g + VBucMWAg = nAMWA MS g − VS MScMWAg = VS MSq net
The non-accessible volume (VNA) can be determined through Helium experiments. Refer to
(Brandani et al., 2016) for specific definitions.
Clearly, the amount adsorbed is related to the force change (Ω1, Ω2) before and after the
exposure of the sample to the gas. The pressure and temperature conditions (P1, P2, T1, T2) are detected using appropriate devices.
The major advantage in using the gravimetric method is the direct measurement of the adsorbed amount adsorption capacity and the little dependence on calculational methods (Lachawiec et al., 2008), on the other hand, the most important source of errors is the determination of the correct system volume (𝜀𝑚𝑉𝑆+ 𝑉𝑁𝐴+ 𝑉𝐵𝑢) (Belmabkhout et al., 2004).
Among design proposals for improvement of the experimental technique, the installation of a gas circulator can be helpful in enhancing adsorption and reducing waiting times for
18
equilibrium, however, the circulator may cause problems for fine grained sorbent materials like powders or activated carbon fibres which may be removed or simply blown away from the sorbent vessel (Keller & Staudt, 2005).
1.2 Overview of chromatographic/flow apparatus
Chromatographic/flow method for adsorption measurements is schematized in Fig. 6. The gas flows into the system and, at time zero, either a pulse of adsorbate is added to the carrier gas (chromatographic experiment) or the system is perturbed by a step change in concentration (breakthrough experiment).
Figure 6 - Schematic diagram of a chromatographic system.
The outlet concentrations and volumetric flowrates are measured (Mason et al., 1997), allowing to determine the difference in the amount of gas that enters and exits the system through the following mass balance (Brandani et al., 2016):
(10) VF d dt( ∫ cdz L ) + VS d dt( ∫ qdz L ) = (Fc)IN− (Fc)OUT
The terms are the accumulation in the fluid and liquid phase and the integrals state for the average gas and solid phase concentration along the length of the column (L).
With this experimental method, none of the three magnitudes among absolute, net and excess amount are estimated directly: the absolute adsorbed amount can be established by using large molecules, size-excluded by the micropores of the adsorbent at high temperature, to determine the solid volume required for the calculation. On the other hand, the excess amount can be evaluated through Helium expansion for the estimation of the non-accessible volume and the net amount using empty column with very low pressure drops. Among the drawbacks of the chromatographic method the high values of pressure drops along the column: the development of apparatus like the zero-length column, besides other reasons, is also aimed to minimize this phenomenon (Eic & Ruthven, 1988).
19
1.3 Volumetric apparatus
The operating principle of a conventional, single-branched, volumetric apparatus is simple: a known amount of gas is added to a calibrated dosing cell, the valve, separating the dosing and uptake section, is then opened letting the gas expand to the uptake cell, which contains the adsorbent, so the gas can adsorb onto the material (Fig. 7). Knowing the dosing and uptake cells volumes (Vd, Vu), the pressures (Pd, Pu) and temperatures (Td, Tu) of both cells are measured,
before and after opening the valve, and a mass balance is applied to determine the amount of gas effectively adsorbed into the sample (Vs).
Figure 7 - Schematic diagram of a conventional volumetric system.
A considerable amount of literature has been written over years about the conventional volumetric method for adsorption measurement, among them (Ahn et al., 1998; Belmabkhout et al., 2004; Blach & Gray, 2007; Blackburn et al., 2008; Checchetto et al., 2004; Cheng et al., 2007; Giacobbe, 1991; Lachawiec et al., 2008; Lee et al., 2008; Malbrunot et al., 1997; Park et al., 2016; Ramaprabhu et al., 1998; Tibbetts et al., 2001).
As said, the volumetric method is based on an indirect measurement of the amount adsorbed: this is the main drawback related to this experimental approach. Mass balances are applied to obtain the final gas uptake starting from measured experimental data, errors can be then introduced during the experimental campaign and progressively propagate through data analysis. This is one of the reasons why high attention needs to be paid during experimentation; moreover, operational recommendation and improvements of the system design have been proposed developing more reliable system configurations for adsorption measurement.
An important step forward has been done with the development of double-branched systems. A double-branch, differential, apparatus is constituted by two branches, each one similar to a single-branch unit, connected together by a differential pressure transducer. The amount of gas adsorbed into the sorbent is calculated from the differential pressure change among a reference
20
cell and a sorption cell, containing the sample (see Fig. 8). The experiments are performed in the same way as for a conventional apparatus: the reference and sample dosing cells (Vdr, Vdr)
are charged with a known amount of gas, then, the valves, separating the dosing and uptake cells (Vur, Vus), are simultaneously opened, to perform the expansion. After waiting the time for
the equilibration, the differential pressure among the two branches is detected and used to determine, through mass balance, the amount of gas effectively adsorbed into the sample (Vs).
Figure 8 - Schematic diagram of a differential volumetric system.
The differential unit has several advantages over the conventional unit. It incorporates a differential pressure transducer (dP in the Fig. 8), which has an increased grade of accuracy in a wider pressure range, if compared to absolute pressure readings. What is expected, is to obtain the same system reliability for adsorption at low and high-pressure conditions.
Furthermore, the differential apparatus has been shown reducing artifacts associated with temperature deviations and gas non-idealities, as both branches experience the same effects equally (Blackman et al., 2006; Browning et al., 2002; Zielinski et al., 2007). This last effect can be negligible at low pressure, however, it is particularly relevant for high pressure measurements, returning back to the original goal of the apparatus design.
Besides the differential pressure transducer, at least one absolute pressure transmitter (PT in the Fig. 8) is present and generally placed in the pre-dosing section (in the Fig. 8, the pre-dosing section is the one comprised among the inlet gas line and the valves connecting to the dosing cells); this is aimed to the reduction of asymmetries in the adsorption region and to limit the number of transducers used to two, relying to a more cost-effective system. An example is the apparatus proposed by (Sircar et al., 2013). In literature, the reference to other types of configurations can be found, in which, for example, two absolute pressure transducers are
21
placed in the dosing volumes (Zielinski et al., 2007). The point is that, with one absolute pressure transducer, all the system pressures are determined by mole balance, because the pre-dosing section pressure is the only one directly measured. In these terms, the possibility of error propagation is in a way exacerbated due to the fact that all quantities are calculated referring to a single experimental reading.
In a differential configuration, the symmetricity among the two branches is an important design feature: some differential volumetric apparatus have been developed being not symmetrical, so the two branches have different internal volumes (Zhang et al., 2004). Other systems are instead designed being symmetric, which means having the branches much similar as possible in terms of internal volumes. (Suzuki, 1982; Suzuki et al., 1987) proposed the use of a symmetrical differential apparatus for sub-atmospheric adsorption measurements of solid having low-adsorption capacity; in the paper, the reference to symmetricity in terms of volume and temperature among the branches is detected being crucial for the reliability of the results. Other examples of differential apparatus with two mirror-image single-branch units are proposed by (Blackman et al., 2006; Browning et al., 2002; Qajar et al., 2012; Sircar et al., 2013; Zielinski et al., 2007). Concerning the internal volumes, another consideration can be done related to the difference in the dosing and uptake cell volumes: some systems are built up having the dosing/uptake cells with almost the same volume (Zielinski et al., 2007), but, the majority of the apparatus proposed, show the dosing cell volumes quite bigger than the uptake cell volumes (generally, the dosing volume is the double of the uptake cell) (Blackman et al., 2006; Qajar et al., 2012; Sircar et al., 2013).
The HP-ADVA apparatus is a symmetric system having the dosing/uptake cell volumes almost equal. The design details and specifications, the experimental procedures and analytical methods for the determination of the gas adsorbed are described in the Chapter 2 and Chapter 3 of the thesis.
1.3.1 Volumetric apparatus: sensitivity analysis
The volumetric method is considered an advantageous way to measure adsorption isotherms as it is easy to develop even for high-pressure measurements, it is relatively cheap, physically robust and reasonably reliable. The accuracy of conventional (Belmabkhout et al., 2004; Blach & Gray, 2007; Broom & Moretto, 2007; Demirocak et al., 2013; Mohammad et al., 2009; Webb & Gray, 2014a, 2014b) and differential (Blackman et al., 2006; Browning et al., 2002; Qajar et
22
al., 2012; Sircar et al., 2013) units have been addressed, and the inter-laboratory tests indicate error is common in this kind of practice. As previously mentioned, the disadvantage of this method are the errors due to the indirect determination of the adsorbed quantities.
Using a higher sample size has been sufficiently proven to increase the accuracy of the volumetric measurement, however this is often not possible with novel adsorbent materials, for which quantities are often limited. Another point is the confirmation that using small cell volumes led to more accurate results. (Demirocak et al., 2013) concludes that, if, for some material, a sample in gram quantities cannot be prepared, selecting the smallest reservoir volumes can alleviate the accuracy problem. One point to remember is that, even if the sensitivity can be optimized by minimizing the cell volumes, in practice some distance is required between the valve and the sample to allow regeneration and preconditioning of the sample. Moreover, most commercial systems are designed for cryogenic measurements (using Liquid Nitrogen), so room for placing the dewars is needed. This means that generally the volume ratio among dosing/uptake cell volume is maintained among 0.5 and 1 (Wang et al., 2020). These two aspects will not be analysed having been largely assessed and confirmed.
A series of other pitfalls need to be accounted such as uncertainties in the volume calibration, tied to the accuracy of the pressure transducer used; uncertainties in correcting for the volume occupied by the sample by errors introduced due to low accuracy of the instrument used for the measurement such as laboratory balance used to weight the sample mass; temperature effects and gradients and treatment of gas compressibility. All these effects accumulate together when calculating the final gas uptake; moreover, many of these features are exacerbated at high pressures, which are the conditions of major focus in our discussion. Overall, the effects of the following parameters have been considered in the mentioned literature:
• deviations in calibrated volumes (dosing/uptake volume) (Belmabkhout et al., 2004; Qajar et al., 2012; Sircar et al., 2013; Webb & Gray, 2014b)
• valve internal volumes calibration (Sircar et al., 2013)
• pressure measurement accuracy (absolute/differential pressure transducer accuracy) (Belmabkhout et al., 2004; Broom & Moretto, 2007; Qajar et al., 2012; Sircar et al., 2013; Webb & Gray, 2014a)
• temperature measurement accuracy and temperature gradient for differential apparatus (Belmabkhout et al., 2004; Broom & Moretto, 2007; Qajar et al., 2012; Sircar et al., 2013)
23
• accuracy in the sample mass weighing (Belmabkhout et al., 2004; Qajar et al., 2012) • amount of sample used for the measurement (Demirocak et al., 2013; Sircar et al.,
2013; Webb & Gray, 2014a)
• free volume after sample loading (Blackman et al., 2006; Broom & Moretto, 2007; Demirocak et al., 2013; Webb & Gray, 2014a)
• cumulative error and system volume ratio (Qajar et al., 2012; Sircar et al., 2013) The precision of a volumetric method can be also significantly improved by proper choice of the operating equation to process the data, as assessed by (Sircar et al., 2013). Indeed, the majority of the approaches in literature propose the use of simplified forms of the mass balances, through which the gas adsorbed is calculated. However, the completeness of the mass balance used in data analysis seems affecting the final results. A deeper reflection about this aspect is provided in Chapter 3, Section 3.2. Moreover, an appropriate equation of state for the treatment of gas non-idealities can lead to the reduction of errors in the gas uptake calculated. In performing the sensitivity analysis, different approaches are then used in terms of analytical approach: standard analytical method has been used in most cases (Demirocak et al., 2013; Mohammad et al., 2009; Qajar et al., 2012; Sircar et al., 2013; Webb & Gray, 2014a, 2014b); however, computational approach (e.g. Monte Carlo simulation) can be used as alternative procedure: (Mohammad et al., 2009) proposes both approaches confirming the obtainment of similar results.
The parameters studied, the specific approach and the analytical method used are presented in detail in the Chapter 5 of this thesis, while the results and discussion of the sensitivity analysis is presented in the Chapter 6.
24
Chapter 2 - Experimental methods and materials
In Chapter 2, the materials and methods used in the experimental campaign are accurately described: starting from the description of the apparatus set-up, all the procedures to perform the experiments are reported. In particular, equilibrium experiments at ambient temperature are carried out as base analysis for finding potential issues. Subsequently, equilibrium experiments at cryogenic conditions are proposed: carrying on experiments in extreme conditions is a good way to discover and underline other criticalities of the system, which may not occur at ambient conditions.
2.1 System set-up: real laboratory apparatus
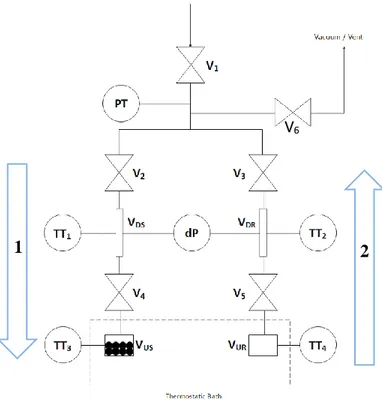
The HP – ADVA apparatus is a high-pressure volumetric differential apparatus used for adsorption analysis (Mangano, Wang , & Brandani, 2019). A detailed system schematization is provided:
25
A simplified schematisation is then used along the discussion for simplicity sake:
Letter Element
DS Sample-dosing section DR Reference-dosing section US Sample-uptake section UR Reference-uptake section
V1 Manual needle valve V2 Pneumatic activated valve V3 Pneumatic activated valve V4 Pneumatic activated valve V5 Pneumatic activated valve V6 Manual needle valve PT Absolute Pressure transmitter dP Differential Pressure transmitter TT Temperature transmitter
Figure 10 - HP-ADVA simplified schematics (left), legend of the schematics (right).
The apparatus is formed by two symmetrical branches: the sample-branch in which the adsorbent material is loaded during experiments and the reference-branch, without the adsorbent material. The amount of gas adsorbed in the material is based on the differential pressure change between the reference cell and the cell containing the sample. Further details will be given later in the discussion (Chapter 2 and 3).
All system components are made of 1⁄4′′ stainless steel tubing. Pneumatic remotely-controlled high-pressure bellow valves (Swagelok High-Pressure, Pneumatically Actuated Bellows-Sealed Valves SS-HBV51-C) are used to reduce the user error during the valve opening/closing. The system is connected to gas lines provided with safety connections: the gas streams available are Helium (BOC- Helium Ultra High Purity Grade Compressed, 99.999% (Grade 5)), Carbon Dioxide, Nitrogen, Methane. The specifications of the other gas lines, different from the Helium, are not reported because not directly used during the experimental campaign.
Leak tests are periodically performed to confirm the system remains leak free; in particular, Helium expansions are performed and absolute/differential pressure transducers signal is
26
recorded over time to see the trend and to detect potential leaks. If a leak is suspected, an electronic gas leak detector is generally used to localize and adjust the leak.
Three sections can be distinguished in the apparatus:
• Pre-dosing section: volume comprised between valves V1,V6,V2,V3, it is the connection among the dosing cells, the inlet gas pipeline and the lines of the vent and the vacuum pump (Pfeiffer HiCube, model TC110). The gas inlet flow rate is regulated via manual valves, in the same way the vacuum and vent lines which are provided by flow restrictors too. In particular, the vent/vacuum line presents a three-way plug valve, and the vent line is equipped with an excess flow activated diaphragm valve. Through Helium expansion at low pressure, this section has been evaluated having a volume VPre ≈ 16 cc.
In the pre-dosing section, the absolute pressure transducer (Rosemount-In-line Pressure Transmitter, model 3051TA4A2A21BI1Q4D4) is used to directly measure the pressure in the system. Placing it in the pre-dosing section avoids the introduction of asymmetries among the dosing and uptake sections, crucial for adsorption evaluation. Once valves V2,V3 are closed, knowing that value, and by means of moles balance, is then possible to characterize all the pressures in the system by reading at the differential measurements, dP. Further details provided in Chapter 3. • Dosing section: divided from the pre-dosing section by pneumatic valves V2 and V3,
and from the uptake section by valves V4 and V5. It is provided with the differential pressure transmitter (Rosemount-Coplanar Pressure Transmitter, model 3051CD2A22A1BI1Q4D4) for accurate pressure measurements. The temperatures, on both branches, are measured through thermocouples (TT1,TT2) (K-type thermocouples).
• Uptake section: last section of the apparatus, in the sample-side the adsorbent is loaded during the adsorption experiments. The uptake cells are generally maintained at constant temperature using a liquid bath with a service fluid (water/ethylene glycol, 50%v/v) and the temperature is measured through the installation of thermocouples (TT3, TT4).
The other components of the apparatus are exposed to room temperature so not provided with a system for temperature maintenance. The absence of external temperature control led to system temperatures variation with room temperature: typically the variations are below 1°C.
27
The four thermocouples TT1, TT2, TT3, TT4 allows a continuous monitoring of the gas temperature in each section of the apparatus.
As mentioned in Chapter 1, a key feature of the apparatus is the symmetry of the two sides: the dosing and uptake sections are created much symmetrical as possible to obtain reliable results in the measurements. The symmetry between the branches is provided by:
• The volumes of the dosing/uptake sections fall between ≈11-12 cc, with a volume ratio ΓV =
VDS
VUS≈
VDR
VUR ≈ 1.16 . These volumes are calibrated using the pressure
expansion method: a more detailed analysis about volume calibration will be provided in the Sections 2.2.2 and 4.3.
The apparatus has been designed with internal volumes much lower than other examples of similar apparatus (Sircar et al., 2013; Zielinski et al., 2007) and maintaining the ratio among dosing/uptake cells close to 1. These choices are aimed to obtain more reliable results.
• The use of a single bath with the recirculation of the service fluid to maintain “temperature symmetry” during the isotherm analysis (Zielinski et al., 2007). Generally, during experiments, the uptake cells need to be maintained at a constant temperature and this is done by using a single dewar, made by insulated steel, connected to a liquid circulator and temperature controller (Julabo CORIO® CD - Bath circulator), through thermally isolated pipelines, which allows to maintain the same liquid level in both sides.
However, for measurements at cryogenic conditions (77 K, Liquid Nitrogen), the bath circulator cannot be employed. Moreover, two separate cryogenic dewars were required introducing potential temperature asymmetries during experiments. As better explained in Section 2.3, this aspect has been challenging to face.
• The use of the same valve type separating the dosing and the uptake sections on both branches: the four valves are connected, through apposite pipes of the same length, to compressed air, which pressure has been set before each experiment for the best operation conditions, as provided by manufacturer; moreover, the valves are remotely controlled in order to open/close them perfectly at the same time. The use of no-zero volume valves is tied to the unavailability in the market of high-pressure models, from here the need of an accurate characterisation of the valve, which is proposed in Section 2.2.2.1.
28
The absolute and differential pressure transmitter readings, as well as the thermocouples measurements are computer-recorded using the National Instruments™ LabView software; moreover, the software allows the collection of the experimental data and the contemporaneous creation of Microsoft ™ Excel sheets, that can be used repeatedly for future experiments and analysis.
Pictures of HP-ADVA system are provided:
(a) (b)
Figure 11 – Laboratory apparatus pictures (University of Edinburgh - Fleeming Jenkins Building Lab 1.196D): (a) front view, (b) top view and (c) thermostatic bath (ethylene glycol/water mixture 50%v/v).
29
2.2 Experimental procedure at ambient temperature
2.2.1 Procedure for equilibrium measurements: isotherm construction
To carry out an adsorption experiment, the sample is prepared and loaded in the uptake-sample cell with a weighed and counted number of stainless-steel beads: this is done to reduce the void volume, to enhance the heat transfer rate achieving near isothermal conditions and to put sample particles away from each other (Wang et al., 2020). In the uptake-reference cell, an equal number of the same stainless-steel beads are loaded to maintain, as much as possible, symmetric conditions between the branches. The entire system is then outgassed by the vacuum pump for a proper amount of time (15-30 minutes).
Depending on the adsorbent, a regeneration procedure is required before each experiment ensuring the solid is free from traces of moisture and gases adsorbed. It can be performed on-line, so without opening the system using an external electric furnace built for the apparatus: it is constituted by an insulated cage inside which the uptake-sample cell is enclosed and the temperature for the regeneration is controlled remotely through an electrical device.
As a first, one needs to exactly evaluate the volume available for the gas inside the uptake cell (sample-branch), once the adsorbent has been filled in the system. This can be easily estimated by carrying out a Helium expansion at low pressure, between 1 and 2 bar, and room temperature, ranging from 20 and 25 °C, from dosing to uptake. Assuming that in these conditions the adsorption of Helium is negligible, it is possible to retrieve the value required. After having connected the desired gas stream to the inlet line, the vacuum is again applied to remove traces of Helium.
The uptake cells are isolated closing the valves V4, V5 and immersed into the liquid bath, for the required temperature conditions. The valves V2, V3 are closed too and, after the time required for the stabilisation of the temperature (remote control by LabView software), the experiment is started. In these vacuum initial conditions, data of the absolute, differential pressure and temperature is logged to establish, for the pressure transducers, the offset point for the measurements.
The pre-dosing section is pressurised until the desired value, opening manually the valve connecting the inlet gas stream pipeline and data is collected. Valves V2, V3 are then opened to perform the first expansion from pre-dosing to dosing volumes: the valves V2, V3 are newly
30
closed and, after waiting a time for pressure stabilisation, the values of pressure and temperature are logged.
The last step is to perform the expansion from the dosing to the uptake cells by opening the valves V4, V5. The time for the equilibration is now a key aspect: since the absolute pressure transducer, at this point, remains isolated from the experiment (V2 and V3 closed) the operator relies only on the differential pressure signal to establish when the equilibrium is reached. For multistep isotherms, the pressurisation procedure is repeated as explained before, without reducing the uptake cells pressure, for the entire pressure range under investigation.
The same procedure is done for “blank measurements”. Blank experiments are performed without the adsorbent loaded in the uptake-sample cell and using Helium. The analysis is aimed to check the correct calibration of the system and the response of the apparatus, particularly at high pressure, so in condition of saturation. Indeed, blank measurements are not directly tied to the effective estimation of the absolute adsorbed amount, but they are required to estimate the net adsorbed amount (see Introduction).
In particular, the blank experiments have been carried out in a pressure range between 0 – 100 bar and at two different temperature conditions: ambient temperature (25 °C) and cryogenic conditions (TLN). For more details see Section 4.1.
2.2.2 Procedure for apparatus calibration
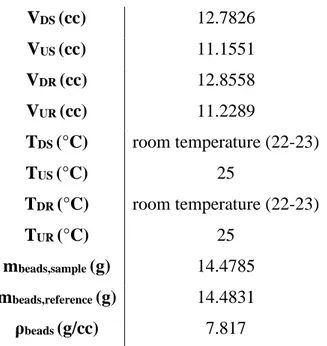
The calibration of the apparatus, consisting in the estimation of the pre-dosing/dosing/uptake cells internal volume is a key aspect to obtain reliable results from experimental data analysis. The gas used for the calibration is Helium and the measurements are performed at fixed temperature: generally, the uptake cells are maintained at 25 °C using the ethylene glycol solution bath, while the dosing cells are exposed to room temperature (around 20-25 °C). Helium is selected as gas to be used because, at this conditions, the adsorption is considered negligible avoiding interferences with the analysis.
Operatively, the calibration is performed through alternate gas expansions in the system: the sample and reference branch are calibrated singularly by isolating one branch from the other, closing alternatively the valves V2, V3. Moreover, the expansions are carried out with the
31
empty system and then loading inside the uptake cells, of both sample and reference branches, a weighted and counted number of stainless-steel beads. The stainless-steel beads are used as non-adsorbent material to add a known volume in the mole balance for the internal volumes’ calculation.
For each branch, two series of expansions are performed: from dosing to uptake section and from uptake to dosing section to collect an appropriate number of experimental data.
As a general rule for operating, after any operation involving the opening of the system, the apparatus is washed with Helium three times to eliminate any trace of air from the line and, before each experiment, the vacuum is created to collect the offset point for the calculations.
The accuracy in performing the apparatus calibration, in this type of apparatus, becomes significantly relevant due to the presence of the absolute pressure transducer outside the dosing cells: as mentioned in the Section 2.1, the transmitter is placed in the pre-dosing section, so no direct measurement of the dosing/uptake internal pressure is possible. All the volumes are then effectively calculated and, to avoid the introduction and the consequent propagation of error in the analysis, very accurate calibration needs to be met in both the experimental and analytical aspects.
In the experimental campaign, the calibration of the apparatus has been completed in a pressure range of 0-100 bar to check unexpected behaviour at high pressure. A detailed analysis is proposed in the Section 4.3.
2.2.2.1 Procedure for apparatus calibration: valve characterisation
The characterization of the pneumatic actuated valves (Swagelok, SS-HBV51-C), separating the pre-dosing to the dosing section and the dosing to the uptake section, consists in the estimation of their effective internal volume. Hypotheses have been moved towards the potential influence of the valves volume in the total internal volume: unexpected results, obtained during the experimental campaign (Section 4.1 and 4.3), can be linked to the valve internal volume which may be negligible at low pressure (below 50 bar), but could be relevant and to be considered at high pressure (between 50 – 100 bar).
The estimation of the internal volumes is aimed to better understand the internal configuration of the valve: an inlet and an outlet section are evident from the manufacturer’s
32
datasheet sketch (Fig. 12) and the effective volumes can be estimated to check the symmetricity/asymmetricity of the valve. Moreover, an estimation of the valve volume can be useful in the perspective of taking account, explicitly, of the valve volumes in the mole balances used for data analysis (Chapter 3).
Figure 12 – Pneumatic actuated valve (Swagelok, SS-HBV51-C) sketch taken from manufacturer’s datasheet.
The “flow direction” arrow shows the direction of the gas expanding from pre-dosing to dosing and from dosing to uptake sections.
Experimentally, the estimation of the volume of the valves has been done performing alternate Helium expansions, separately in the two branches, with the system originally under vacuum and at room temperature (20-25 °C). The hypothesis of asymmetricity of the valves led to perform two consecutive series of expansion:
• for the “inlet” section volume: expansion from dosing section to uptake section (valves V2, V3 closed): the valves V4, V5 are opened for the gas expansion and then closed to detect the pressure variation
• for the “outlet” section volume: expansion from dosing + uptake section (valves V4, V5 opened) to pre-dosing section: the valves V2, V2 are opened for the gas expansion and then closed to detect the pressure variation
The pressure variation is related to gas mole displacement due to the valve internal volume. These kinds of expansions have been selected based on the position of the pressure transmitter in the system: the uptake cells pressure cannot be measured directly but only through mass balance.
33
2.3 Experimental procedure at cryogenic conditions
Adsorption equilibrium analysis at different temperatures with respect to ambient conditions (around 25 °C) is required for applicative, industrial purposes or to have a wider spectrum of the gas-adsorbent behaviour. Operatively, the experiments are carried out in the same way as explained in the Section 2.2.1, so the procedure will not be explained newly. However, some peculiarities need to be assessed in performing cryogenic experiments.
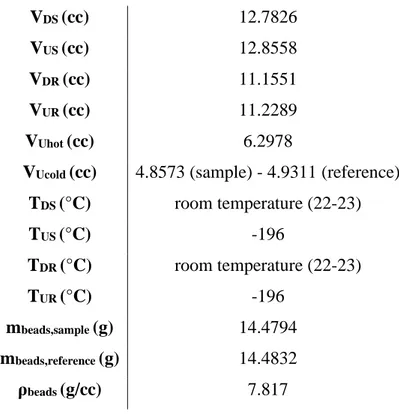
Overall, the HP-AVDA apparatus is not provided with a device for temperature maintenance and control: the uptake cells can be maintained at a constant required temperature through the immersion in the recirculating bath (see Section 2.1). When performing measurements at uptake cells temperature consistently different from room temperature, such as for cryogenic conditions, the estimation of the precise portion of uptake cells effectively immersed in the bath and the portion remaining outside is required. This because inconsistencies may arise if not taking account of the effective volume immersed: this is negligible in the cases of no high differences of temperature, but it is exacerbated when the immersed and not immersed portions are at considerably different temperature conditions.
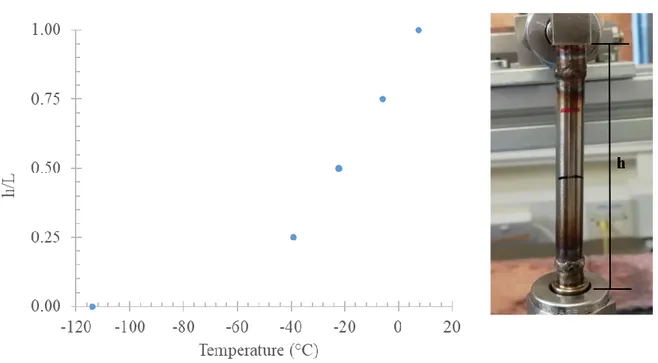
For simplicity sake, the nomenclature “hot volume” will be referred to the immersed portion of uptake cells while the portion remaining outside, will be denominated as “cold volume” (Fig. 13). The choice could appear counter intuitive, anyway this definition is not only specific for cryogenic experiments, but to experiments in which the temperature of the bath will be considerably higher than the room temperature too.
Figure 13 - Uptake cell schematisation: distinction between "hot" and "cold" volume. The dotted line
represents the recirculating bath borders.
Operatively, cryogenic measurements and the estimation of the hot/cold volume require the development of a protocol to obtain reliable results. Experimental issues are mainly related to the handling of Liquid Nitrogen which has a high evaporation rate, if exposed to atmospheric
34
conditions and the use of two separated dewars, one for the sample-branch and one for the reference-branch, instead of a unique one. This is due to the unavailability, among the laboratory facilities, of a device for the recirculation of Liquid Nitrogen.
As mentioned, the experiment, for blank construction, is carried out in the same way as the operation at ambient temperature, (Section 2.2.1); differently, for the estimation of the hot/cold volume portions Helium expansion are carried out with the unbalanced system: 110 stainless-steel beads are loaded in the reference – branch, while the sample – branch uptake cell is maintained empty. This choice is related to exaggerating the asymmetricity among branches detecting higher differential pressure variations, leading to more accurate calibration of the internal volumes.
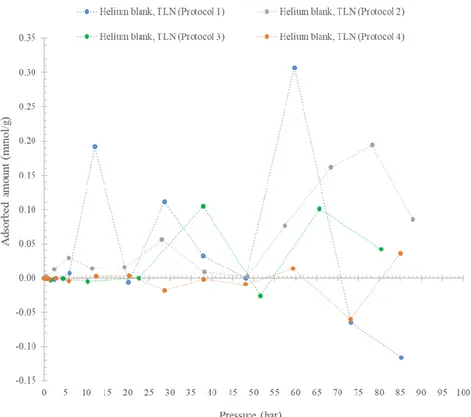
During the experimental campaign, four protocols have been tested to check the operational feasibility and the quality of the results. In general, the dewars, containing the Liquid Nitrogen, are placed above two separated laboratory elevators as medium to control the effective level in both branches: practically, the amount of nitrogen evaporating during experiments is not equal in both branches.
• Protocol 1: the initial level of Liquid Nitrogen in the dewars reaches the end of the nut of the uptake cells (both sample and reference branches) to maintain the symmetry. The nut has been selected as a physical element to have a benchmark between the sides. During experimentation, the symmetry is maintained by moving up and down the two elevators.
• Protocol 2: the initial level of the Liquid Nitrogen reaches the end of the nut of the uptake cells, but, in this case, filling completely the dewars with Liquid Nitrogen. A way to potentially control the level of the nitrogen inside the separated dewars and to maintain, as much as possible, the symmetry among the branches, is to fully fill the dewars, in this way the level of LN, which evaporates during experiment, is controlled by refilling the entire volume of the dewars and no more moving up and down the elevators.
35
Figure 14 - Uptake cells immersed in Liquid Nitrogen bath1 (protocol 2).
• Protocol 3: operation done as in Protocol 2, but adding an equal number of isolating floating balls onto the surface of the LN in order to decrease the surface effectively exposed to the atmosphere, trying to reduce the evaporation rate. This protocol has been demonstrated being difficult to carry out.
• Protocol 4: once selected an equal level for both branches, a plastic transparent cover (specially built for the apparatus) is used on top of the dewars to reduce the Liquid Nitrogen evaporation rate. An issue faced in this last configuration, is the limitation in moving the dewars by means of the laboratory elevators, due to the presence of the covers.
Figure 15 - Uptake cells immersed in Liquid Nitrogen bath (protocol 4).
1 In recent development of the experimental set-up, the tubes have been provided with an isolating cover to
36
From the experience, Protocol 4 appeared the best procedure with the laboratory facilities available, because the signal of the pressure readings appeared more stable: data analysis confirmed the experimental scenario too (see Section 4.1.2).
37
Chapter 3 - Analytical methods
Chapter 3 is a resume and schematisation of the analytical sources: the governing equations used for data analysis and for the sensitivity analysis are presented, considering both single-branch and differential systems. Precisely, very general forms of the equations are listed to justify the approach, but the analytical details are reserved to the research group.
The analyses are performed using PTC Mathcad® 15.0 simulator: spreadsheets have been specifically implemented starting from material already available.
3.1 Single-branch system mass balance
The adsorption analysis, performed using a conventional volumetric system, is based on the measure of the absolute pressure before and after the gas expansion: the difference among the initial and final conditions, knowing the internal volumes of the apparatus, will represent the amount of gas adsorbed into the sample (see Section 1.3).
A scheme of a single-branch apparatus, in line with the differential schematisation described in the Section 2.1, is reported for simplicity sake:
Figure 16 – Single-branch volumetric apparatus simplified schematic.
In the equations presented, the same notation is maintained among single-branch and differential apparatus: “S” refers to sample-side and “R” to reference-side (see Section 2.1).
38
In general, for a single gas, the number of moles in a closed volume V, at a temperature T and pressure P is given by the equation:
(11) N = PV zRT
where 𝑧(𝑇, 𝑃) is the compressibility factor of the gas at T and P, 𝑅 is the ideal gas constant. Along the discussion, the compressibility factor is determined by the GERG-2008 Equation of State (Kunz & Wagner, 2012) for all the cases studied.
In case of single-branch volumetric system, writing the moles balance equation at each data point, leads to the following relationship:
(12) PDSi−1VDSc zDSi−1R TDSi−1+ PUSi−1VUSc zUSi−1RTUSi−1 = PSiVDSc zDSiRTDSi+ PSiVUSc zUSiRTUSi+ Δni
where the notation “i” stands for the ith adsorption data point: “i-1” before the gas expansion, “i” after gas equilibration. Δni are the moles of gas adsorbed in the material at ith adsorption step.
The terms VDSc, VUSc account for the free space of the dosing and uptake cells available for
the gas. The subscript “c” refers to the fact that these terms are not coincident to the entire cell volumes, but they are corrected by considering the effective space available for the gas after the sample and beads loading (see Chapter 2). As said in the Section 2.1.1, once the adsorbent and the beads are loaded inside the cell, an Helium expansion is performed to estimate the effective void volume available inside the cell (negligible adsorption of Helium inside the sample).
The internal valve volume needs to be considered too, because no-zero volume valves are used. In this concern, the presence of pneumatic actuated valves, separating the dosing and uptake sections is accounted through the term α:
(13) α = Vvalve,inlet
Vvalve,inlet+Vvalve,outlet=
Vvalve,inlet
Vvalve
for α = 1 all the valve internal volume is in the inlet section, for α = 0 all the valve internal volume is in the outlet section (see Section 2.2.3). In the general form of the mass balance (Eq. (12)), this factor is accounted in the correction of the volumes (VDSc, VUSc).
The terms PDS, PUS and PS are the pressure of the dosing cell, the uptake cell and the
39
the one connecting the dosing and uptake cells. In addition, TDS and TUS are the temperature of
the dosing and uptake cells before and after the expansion. The compressibility factors are calculated at each Temperature and Pressure condition.
The adsorption isotherm represents the quantity of gas adsorbed by the material over pressure (or fugacity). The construction of experimental isotherm is done by summing up the moles Δni adsorbed at each consecutive step until the last one, corresponding to the final
operating pressure. Operatively, the isotherms are performed as multistep adsorption of the gas into the material without restoring the initial conditions.
3.2 Differential system mass balance
The differential volumetric apparatus for adsorption measurement can be considered as two independent traditional volumetric sorption units, so the mole balance consists in a differential mole balance between the two branches (see Fig. 10).
From an analytical point of view, the key aspect of the procedure is to take account of the differential pressures between the two branches instead of considering the absolute pressure: the differential pressure transducer is consistently more accurate than the absolute one, allowing to obtain more precise results.
The mole balances for the sample and reference branches of the differential apparatus at the ith adsorption step can be written as:
(14) PDSi−1VDSc zDSi−1R TDSi−1+ PUSi−1VUSc zUSi−1RTUSi−1 = PSiVDSc zDSiRTDSi+ PSiVUSc zUSiRTUSi+ ΔnSi (15) PDRi−1VDRc zDRi−1R TDRi−1+ PURi−1VURc zURi−1RTURi−1 = PRiVDRc zDRiRTDRi+ PRiVURc zURiRTURi+ ΔnRi
The subscript “i” stands for the ith adsorption step: “i-1” before the expansion, “i” after the gas equilibration. ΔnSi and ΔnRi are the amount of gas moles adsorbed into the material in the
sample and reference branch, respectively.
The terms VDSc, VUSc, VDRc and VURc account for the free space in the dosing and uptake cells,