SCUOLA DI SCIENZE
Dipartimento di Chimica Industriale “Toso Montanari”
Corso di Laurea Magistrale in
Chimica Industriale
Classe LM-71 - Scienze e Tecnologie della Chimica Industriale
Insight on the factors influencing the selective
oxidation of furfural to furoic acid on
heterogeneous catalysts.
Tesi di laurea sperimentale
CANDIDATO
Alessandra Roselli
RELATORE
Chiar.mo Prof. Fabrizio CavaniCORRELATORI
Dr. Robert Wojcieszak
Prof. Sébastien Paul
___________________________________________________________________________________________________________
Contents
1) Introduction ... 1
1.1) The integrated biorefinery ... 2
1.2) Lignocellulose materials ... 4
1.2.1) Structure of cellulose, hemicellulose and lignin... 5
1.3) Furanic sugar-derived platform molecule: Furfural properties ... 8
1.3.1) Furfural synthesis ... 9
1.3.2) Furfural applications ... 10
1.4) Selective furfural oxidation ... 10
1.4.1) 2-Furoic acid ... 11
1.4.2) Maleic acid ... 11
1.5) Heterogeneous catalysts used in furfural oxidation ... 12
1.6) Gold nanoparticles ... 12
1.6.1) Main applications ... 13
1.6.2) Supports for gold nanoparticles ... 14
1.6.3) Hydrotalcites Mg:Al ... 15
2) Experimental part – methods and calculation ... 17
2.1) Calculations ... 17
2.2) Instruments ... 18
2.2.1) Bench scale reactor ... 18
2.2.2) Reactor settings and conditions ... 19
2.2.3) Screening Pressure Reactor (SPR) ... 19
2.3) Analytical instruments for catalytic tests ... 20
2.3.1) High Performance Liquid Chromatography (HPLC) ... 20
2.3.2) HPLC calibration curves ... 22
2.4) Catalysts synthesis ... 25
2.4.1) Synthesis of hydrotalcites Mg:Al ... 25
2.4.2) Different preparation methods for Au nanoparticles ... 27
2.4.3) “Hydrazine method” ... 27
2.4.4) Turkevich’s method ... 28
2.4.5) Sol-immobilization method with a stabilizer ... 28
2.4.6) Calculations for the synthesis using PVA. ... 29
2.6) Catalysts characterization ... 31
2.6.1) X-Ray Diffraction (XRD) ... 31
2.6.2) X-Ray Fluorescence (XRF) ... 31
2.6.3) ICP-OES ... 32
2.6.4) Transmission Electronic Microscopy ... 32
2.6.5) NH3 and CO2 – TPD ... 33
2.6.6) Nitrogen adsorption – desorption (BET analysis) ... 34
3) Results and discussion ... 34
3.1) Screening of the catalysts ... 34
3.2) Catalytic tests ... 35
3.2.2) Effect of the reaction time ... 37
3.2.3) Effect of the temperature ... 39
3.2.4) Effect of the different Mg:Al molar ratios of the HT supports... 41
3.3) Other interesting Au/catalysts used ... 45
3.4) Screening Pressure Reactors (SPR) tests ... 46
3.5) Furfural oxidation to maleic acid ... 48
3.6) 5-(Hydroxymethyl) furfural oxidation... 50
3.7) Glucose oxidation to gluconic acid ... 51
4) Results catalysts characterizations ... 52
4.1) XRD Hydrotalcite with different Mg:Al molar ratios ... 52
4.2) XRF and ICP analysis of the hydrotalcites with different Mg:Al molar ratios ... 57
4.3) Other prepared catalysts ... 59
4.4) Nitrogen adsorption-desorption measurements: surface area results ... 62
4.5) TEM results ... 64
4.6) Temperature Programmed Desorption (TPD) results ... 66
5) Furfural oxidation reaction mechanism ... 70
6) Conclusion ... 72
1
1)
Introduction
The problems concerning the increase of CO2 emission are especially relevant in the
last decades. The increase of the CO2 emission associated with the still increasing
global production based on fossil resources, have forced the researchers to find renewable alternative feedstock to produce chemicals and fuels1,2. More than 75% of
the energy produced all over the world derives from fossil sources such as carbon coke, oil and natural gas3. In this field the conversion of biomass into fuels and top
valued chemicals has been considered as one the most attractive alternative to the use of fossil sources. Indeed, the use of these renewable materials allows to decrease the CO2 balance considering that carbon dioxide is involved itself in the process of
biomass re-generation. The challenge for the researchers is the development of new economic and environmental friendly processes for the conversion of biomass-derived materials into fuels and high value chemicals. The use of renewable raw materials represents an attractive route to produce chemicals due to the high functionalization degree of the platform molecules deriving from their transformation. For instance, the valorization processes involve a less number of step with the minimization of the by-products4,5. The biomass feedstock could be divided into three different groups
depending on the origin. The first generation that include corn, sugar cane, oily seeds and bagasse shows a high potential in terms of valorization but, at the same time, presents reasonable ethic problems related to the competition with food industry. On the contrary, the second generation, based on the use of wood chips, agricultural and municipal wastes represent a promising alternative considering the non-ethic problems. Finally, in the last years, the use of the third-generation biomass, such as algae, become always more relevant6.
For the development of processes for the valorization and the production of fuels and chemical from renewable sources, a biomass-transformation industry layout has been proposed on the base of the classic refinery. The National Renewable Energy Laboratory (NREL) creates the bio-refinery industry model, a new concept in which the process for the conversion of biomass into fuels, chemicals and energy are integrated.
2
1.1) The integrated biorefinery
The main challenge for the biorefinery consists in the possibility to produce fine chemicals and fuels starting from renewable sources optimizing and integrating with/in these processes the production of energy, to improve the balance between the input of energy and raw materials required for the biomass transformation and the output (chemicals, energy and wastes treatment)7,8.
The Figure 1 below shows the simplified scheme of an integrated biorefinery, in which the conversion of the biomass into fuels, chemicals, energy and added value products are integrated to maximize the raw materials used and the advances deriving from the sale of the products.
Figure 1 – Simplified scheme of an integrated biorefinery.9
One of the main drawbacks connected to the production of biofuels, bioethanol and fine chemicals from renewable sources in the biorefinery plant is that the transformation processes are not still economically sustainable. Indeed, the thermo-catalytic processes for the oil transformation into fuels and starting materials for the chemical industries have been developed from more than a century, with optimized technologies and an economic feasibility related to the possibility to build big plants in terms of annual production. The development of an economically sustainable biorefinery must be made on the integration idea, that means to place side by side the production of fuels and energy. In the first moment to develop processes that bring to spent money, but to produce high value chemicals that allow to reach an overall positive economic balance. In this field, the production process that takes place in an
3
integrated biorefinery for the transformation of biomass could be summarized as follow:
➢ production of syn-gas and bio-oil through gasification and pyrolysis processes; ➢ production of high value chemicals from carbohydrates such as glucose,
fructose and xylose through catalytic or enzymatic processes;
➢ production of chemicals through new synthetic strategies based on single step transformation to minimize the cost of the processes, the formation of by or co-products and the wastes treatment.
In the last years, the twelve most important building blocks deriving from sugars transformation have been identified (Figure 2). These compounds could be transformed into a high number of products with direct applications in the polymer industry or used as fuels. On the other hand, for some of them a direct application as monomer to produce polymers is possible, for example from 2,5-furandicarboxylic acid (FDCA) obtained from HMF oxidation with heterogeneous catalysts, is possible to produce Polyethylene Furanoate (PEF).
4
1.2) Lignocellulose materials
In the prospective for the development of an integrated and economically sustainable biorefinery, lignocellulosic biomass has been considered one of the main alternative to the fossil sources to produce fuels and chemicals thanks to its abundance and to the non-food-based renewable carbon availability10. In the family of the lignocellulose
materials could be considered the agricultural and municipal wastes and the wood chips produced from the wood industry, for example. These kind of second generation biomass has attracted the researcher’s interest thanks to their composition. Indeed, these materials are composed by three main fractions: cellulose, hemicellulose and lignin (Figure 3). These could be treated and transformed into platform molecules and high value chemicals by thermos-catalytic and enzymatic processes.
Figure 3 – Composition of lignocellulosic biomass.11
Considered one of the most attractive renewable resource, lignocellulose is extremely stable against chemical and biochemical processing due to its rigid structure. To date, different strategies have been proposed for the valorization of cellulose and hemicellulose such as the complete gasification, high temperature pyrolysis, as well as stepwise transformation through fractionation and depolymerization of the
5
lignocellulosic polysaccharides,12,13. A potential bio-refinery scheme aiming for a
controlled fractionation and depolymerization of lignocellulose comprehends a sequence of the following steps:
1. fractionation of lignocellulose into biopolymers: cellulose, hemicelluloses and lignin;
2. depolymerization of the biopolymers into the forming monomers; 3. transformation of the monomers into value-added products.
Due to distinct differences in the structure and reactivity of cellulose, hemicelluloses and lignin, the fractionation must to proceed under different reaction conditions14. A
general approach toward fractionation is a selective solubilization of lignin or hemicelluloses leaving the least-reactive cellulose intact15. Examples of potential
fractionation processes include steam explosion for solubilization of hemicelluloses or alkaline treatment for dissolution of lignin and partial defunctionalization of hemicelluloses16,17. In all cases, it is important to note that the structure and
composition of lignocellulosic biomass is highly dependent on the plant type. For instance, hardwoods contain more cellulose and hemicellulose, but softwoods are reported to contain more lignin18.
1.2.1) Structure of cellulose, hemicellulose and lignin
• Cellulose is the most abundant homo-polysaccharide in nature representing about 1.5 × 10¹² tons of the annual biomass production. The cellulose
macromolecule is composed of D-glucose monomer units connected to each other via α-1,4-glycosidic bonds.
• Figure 4). The degree of polymerization of cellulose depends on the cellulose source. Cellulose chains in primary plant cell walls, have a degree of polymerization ranging from 5000 to 7500 glucose units, and in wood and cotton-based materials between 10,000 and 15,00019. Each repeating unit of cellulose contains three hydroxyl
groups, which are involved in networking of the units with hydrogen bonds.
• Figure 4). The intra-chain hydrogen bonding between hydroxyl groups and oxygen of the adjacent ring molecules makes the linkage stable and results in the linear configuration of the cellulose chains20. The cellulose structure consists of
6
crystalline and amorphous domains. The hydroxyl groups in cellulose chains form intra-and intermolecular hydrogen bonds constituting the crystalline structure shown below:
Figure 4 – Schematic structure of cellulose.
The arrangement of cellulose molecules with respect to each other and to the fiber axis determines the physical and chemical properties of cellulose. The fiber structure of cellulose provides its high chemical stability. Crystalline domains of cellulose are less accessible to chemical reactants. On the other hand, amorphous regions are easily penetrated by reactants during chemical reactions. The reactivity of cellulose can be determined by several factors such as hydrogen bonding, the length of chains, the distribution of chain length, the crystallinity and the distribution of functional groups within the repeating units and along the polymer chains.
• Hemicelluloses are the second major polysaccharides in plant cell. Unlike
cellulose, hemicelluloses are hetero-polymers, they are composed of different monomeric units. Hemicelluloses are often branched (Figure 5) with main chains and side groups attached to them. Several monosaccharides and organic acids can be produced by hydrolysis of hemicelluloses, e.g. xylose, arabinose, mannose, galactose, acetic acid, glucuronic acid, etc.
7
Figure 5 – Schematic structure of hemicellulose.
Significantly, the sub-class and polymerization degree of hemi-celluloses depends on not only the plant species, but also the tissue type and development stage21,22.
Hemicelluloses were reported to be chemically associated with lignin, cellulose or proteins. Spectroscopic data suggest that most probably hemi-celluloses are not connected to cellulose via chemical bonding, but rather via hydrogen bonds or van der Waals forces. On the contrary, chemical association of hemicelluloses with phenolic lignin compounds has been known for a long time. As shown below, such chemical association is considered as a reason for existence of slow-reacting xylan. Alike cellulose, backbones of hemicelluloses consist of β-(1,4)-linked monomers, but the branched structure of hemicelluloses prevents extensive formation of hydrogen bonds. Hence, in contrast to cellulose, hemicelluloses are amorphous, and therefore exhibit higher reactivity for hydrolysis.
• Lignin is an amorphous phenolic bio-polymer composed by a high
heterogeneity of phenolic-based molecules (Figure 6), and it plays a vital role in the recalcitrance of biomass by acting as a physical barrier that protects the biomass against attack from microorganisms as well as chemical degradation23,24,25. In short,
the impermeability of lignocellulosic biomass towards mechanical and biological degradation is contributed by the complex structure of cellulose that provides strength
8
over cell walls, hemicellulose that serve as wire mesh that circulate around cellulose, while lignin fills up any remaining space and prevents the polysaccharide environment from water26.
Figure 6 - Schematic structure of lignin.
1.3) Furanic sugar-derived platform molecule: Furfural properties Furfural (C5H4O2) is a hetero-aromatic furan ring with an aldehyde functional group
and these two functionalities are
responsible for the high chemical activity of this molecule. It is a natural precursor to furan-based chemicals and has high potential to become a major renewable
platform molecule to produce
9
product which could be easily obtained by dehydration of xylose, a monosaccharide found in large quantities in the hemicellulose fraction of lignocellulosic biomass. For this reason, the industrial production of furfural is carried out using corncobs, oat hulls and sugar cane bagasse. It is a colourless liquid if distillate, but quickly darkens when exposed to oxygen, air. In the last years furfural has been considered one of the most attractive platform molecule deriving from renewable lignocellulose feedstock due to the possibility to upgrade it to numerous molecules with application as bio-fuels or as monomers for the polymer industry. It was a relatively obscure chemical until 1921, when the Quaker Oats Company27 began mass-producing furfural from oat hulls.
Actually, the main countries producing furfural are China (300.000 tonn/year), Dominican Republic and South Africa. The furfural production is less expensive than 5-hydroxy methyl furfural production that represent, in the same way, very promising bio-based building blocks. Furfural and 5-hydroxymethylfurfural (HMF) are obtained from the depolymerization of the cellulose and hemicellulose fraction of lignocellulosic materials, specially from the de-hydration of the 5 or 6 carbon atoms monosaccharides obtained from them. These compounds have been considered two of the most important platform molecules deriving from renewable sources due to the possibility to produce, from their transformation, several molecules with application as fuels, monomer for the polymer industry and as fine chemicals.
Chemically, furfural dissolves easily in most polar organic solvents, but it is only slightly soluble in water and alkanes. Solubility in H2O is about 8.3 g in 100 mL. For this
reason, this research project was conducted in a dilute water system to overcome the issues with the furfural dissolution in water.
1.3.1) Furfural synthesis
Furfural is typically derived from xylose that is mainly present as xylan in the hemicellulose. The traditional processes to produce furfural are based on homogeneous acid catalysts such as HCOOH, CH3COOH, HCl, H2SO4, HNO3 and
H3PO4 in aqueous solution28,29,30. However, these homogeneous acid catalysts are
very corrosive and possess higher environmental risks31,32. Recently, numerous
modifications based on the use of solid acids, Lewis acids and various solvents have been proposed to design a cleaner and more environmental friendly process. For example, O’Neill et al.33 studied the dehydration of xylose in water using H-ZSM-5
10
catalyst, 46% furfural yield was obtained at 200 °C over 18 min. Dhepe and Sahu34
reported a one-pot conversion of hemicellulose into furfural using K10 and HUSY in aqueous media, gave 12% yields at 170 °C for 3 h, respectively. In recent years, ionic liquids, which own specific properties such as low melting point, negligible vapor pressure, non-flammability, high thermal stability, remarkable solubilizing ability and close to infinite structural variation35,36, have been successfully used to produce
furfural from xylose and xylan.
1.3.2) Furfural applications
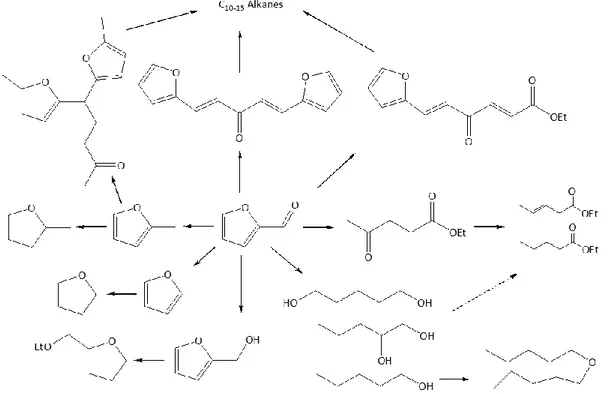
Furfural is one of the most promising platform molecules for its very reactive chemical structure, but also because it can be further transformed into higher added value molecules that find application mainly as fuels or as monomers for the polymers industry, as shown in the following figure (Figure 7).
Figure 7 – Main furfural derivatives with application as fuels or as monomers for polymer industries. 1.4) Selective furfural oxidation
Through the catalytic selective oxidation of the furfural aldehyde group it is possible to produce furoic acid that is the first down-line oxidation derivative of furfural, but other products are also possible to obtain such as maleic acid, 2(5H) furanone and CO2.
11
selectivity. It has many applications in the pharmaceuticals, agrochemicals, flavors and fragrances industries. In many publications it is evidenced that is possible to produce also 2(5H)-furanone, but it was never detected during our research, due to the aqueous medium used. Furthermore, using catalytic systems that can allow the ring opening, it is also possible to obtain maleic acid that is also a very interesting oxidation product of furfural.
1.4.1)
2-Furoic acid
Furoic acid is the first down-line oxidation derivative of furfural. It has market in the pharmaceuticals and agrochemicals industries, where is normally converted to furoyl chloride to be used in the production of drugs and insecticides. At industrial scale, furoic acid is produced with a Cannizzaro reaction using C5H4O2 + NaOH to produce furfuryl
alcohol and sodium 2-furancarboxylate. Alternative processes are not available on industrial scale and furfural oxidation is not acceptable for the low selectivity in furoic acid without the formation of by-products.
1.4.2) Maleic acid
Maleic acid can be produced from furfural oxidation by a catalytic vapor phase reaction with air at 270 °C. The overall reaction can arrive to maleic acid “directly”, but at T room is possible to produce maleic
anhydride and then to hydrolyse it to the corresponding carboxylic acid. Maleic acid forms colourless prismatic crystals having a melting point of 130.5 °C and it is highly soluble in H2O (around 80 gr in 100 mL of
H2O at 25 °C). Maleic acid dissolved in water is very strong organic acid. It is not
present in nature, but it represents a very important industrial intermediate to produce alkyd resins and for the synthesis of dienes. To obtain high yields, it is fundamental to use the right catalytic system, or oxidant, that permits the ring opening.
12
1.5) Heterogeneous catalysts used in furfural oxidation
Furfural selective oxidation needs active, stable and selective heterogeneous catalysts to facilitate the separation of the products and catalyst. On the contrary, using homogeneous catalysts the process needs expensive separation treatments of the final reaction mixture, so they are less applicable on the industrial scale. The oxidation mechanism is different using homogeneous or heterogenous catalysts and normally in the heterogeneous case the reaction advances slowly if compared with the homogeneous ones. The parameters that influencing the catalytic activity of the homogeneous and heterogeneous catalysts will be also different.
1.6) Gold nanoparticles
The study of gold-based catalysts has grown significantly in recent years following the demonstration that their activity increases significantly when used in the form of nanoscale particles. This was especially well demonstrated for oxidation of carbohydrates. Gold catalysts were found to have a clear advantage in activity and selectivity compared to platinum- and palladium-based catalysts used so far for carbohydrate oxidation. Due to the total selectivity of gold catalysts, expensive purification processes as in biotechnological processes are not necessary. A unique property of gold catalyst was found by varying the aldose (e.g., glucose, lactose, maltose, xylose, arabinose): the same gold catalyst can completely convert all different aldoses to their corresponding aldolic acids. Such universality in carbohydrate oxidation was previously unknown for chemical as well as biocatalysts. By applying gold catalysts for other carbohydrates oxidation, many interesting products can be obtained. It was found that unsupported gold particles in aqueous solution (average diameter: 3–5 nm) show a surprisingly high activity in the aerobic oxidation of glucose, not far from that of enzymatic systems37. Moreover, a linear correlation between
activity and number of exposed gold atoms was demonstrated38. In 2002, Biella et al.39
reported in their paper that gold colloids immobilized on carbon are dramatically more active for catalytic glucose oxidation and exhibit a superior 100% selectivity towards sodium gluconate. Even though these systems are very active and selective, the catalysts described by Biella do not have a sufficient long-term stability as the activity decreases about 50% within only four repeated batches40. Similarly, prepared gold
13
colloids supported on carbon and their kinetics in glucose oxidation were studied by Önal et al41. Although Önal reported a lower selectivity, in general, the superior
performance of the gold catalysts in terms of activity has been confirmed. Catalytic activity inversely proportional to the diameter in the size range of 2.5–6nm and a sudden loss of activity above 10nm in size were observed. The stability of the colloid particles was low, coagulation occurred after about 400 s42. To improve the stability,
gold colloids were deposited on carbon support. The initial rates of the reaction were unchanged compared to the rates observed with non-supported particles operated under the same conditions, hence it was concluded that the support is of limited importance in the origin of the catalyst activity in the oxidation of glucose. However, the gold–support interaction was declared to be essential for the formation of a stable catalyst system43,44. On the contrary other authors reported different catalytic activity
using different type of carbon supports with the same Au particle size indicating a specific metal–support interaction. Ishida et al. observed that gold particle size influences the catalytic effect more significantly than the nature of the support comparing carbon and different metal oxide supports such as Al2O3, ZrO2, TiO2,
CeO245,46. The gold, in fact, is not a metal active from a catalytic point of view if used
as a bulk material because of its low tendency to chemisorption due to its electronic configuration of 5d106s1 type. The chemical adsorption on a transition metal is made possible by the interaction of the HOMO and LUMO orbitals. From the catalytic point of view, the force of the chemical adsorption must be sufficiently strong to allow an effective interaction, but not too much, otherwise, an excessive retention of the molecule to the metal surface, would reduce the activity. Because of 5d106s1 electronic
configuration, when a molecule adsorbs on metallic gold bulk surface, a strong effect of back bounding to the antibonding orbital is observed. A very weak interaction with the adsorbate does not allow a correct activation. Gold nanoparticles are used in a large range of applications, including the biomedical monitoring, cosmetics, and lubricants. The most important are listed below.
1.6.1) Main applications
Electronics – Gold nanoparticles are designed for use as conductors from printable inks to electronic chips. As the world of electronics become smaller, nanoparticles are important components in the chip design47. Nanoscale gold nanoparticles are being
14
used to connect resistors, conductors, and other elements of an electronic chip. Photodynamic Therapy – Near-IR absorbing gold nanoparticles (including gold nanoshells and nanorods) produce heat when excited by light at wavelengths from 700 to 800 nm. This enables these nanoparticles to eradicate targeted tumours48.
When light is applied to a tumour containing gold nanoparticles, the particles rapidly heat up, killing tumour cells in a treatment also known as hyperthermia therapy. Therapeutic Agent Delivery – Therapeutic agents can also be coated onto the surface of gold nanoparticles49. The large surface area-to-volume ratio of gold nanoparticles
enables their surface to be coated with hundreds of molecules (including therapeutics, targeting agents, and anti-fouling polymers).
Sensors – Gold nanoparticles are used in a variety of sensors. For example, a colorimetric sensor based on gold nanoparticles can identify if foods are suitable for consumption50. Other methods, such as surface enhanced Raman spectroscopy,
exploit gold nanoparticles as substrates to enable the measurement of vibrational energies of chemical bonds. This strategy could also be used for the detection of proteins, pollutants, and other molecules label-free. Probes – Gold nanoparticles also scatter light and can produce an array of interesting colours under dark-field microscopy. The scattered colours of gold nanoparticles are currently used for biological imaging applications51. Also, gold nanoparticles are relatively dense, making
them useful as probes for transmission electron microscopy. Diagnostics – Gold nanoparticles are also used to detect biomarkers in the diagnosis of heart diseases, cancers, and infectious agents52. They are also common in lateral flow immunoassays,
a common household example being the home pregnancy test.
Catalysis – Gold nanoparticles are used as catalysts in several chemical reactions53.
The surface of a gold nanoparticle can be used for selective oxidation or in certain cases the surface can reduce a reaction (nitrogen oxides). Gold nanoparticles are being developed for fuel cell applications. These technologies would be useful in the automotive and display industry.
1.6.2) Supports for gold nanoparticles
The support plays a crucial role of dispersing the active phase, to stabilize it in the desired state, to preserve its properties during the chemical reaction and the treatments to which the catalyst will be subjected. The main features are: high thermal
15
stability, high surface area, and good mechanical properties. Non-supported gold nanoparticles have a very high surface energy, so they are easy to agglomerate. Therefore, they should be dispersed on a suitable support to maintain their stability and catalytic activity. Gold nanoparticles should have good wetting capability and should interact with the high surface area support. AuNPs can be supported on metal oxides, activated carbon, zeolite and other supports by different methods of preparation including impregnation, precipitation, sol-immobilization or microemulsion. Whether the support itself has a catalytic ability, oxide supports are divided into active supports, such as Fe2O3, TiO2, Co3O4, etc, and inert supports, like MgO, Al2O3 and
SiO2. For Au catalysts supported on active materials, the dominant reaction pathway
involves adsorption of a mobile, molecular oxygen species on the support, dissociation at the interface, which supply with reactive oxygen. While for Au supported on inert materials, where the oxygen supply most likely precedes via direct dissociative adsorption on the Au particles, the size of the latter plays a decisive role. In other way, the impact of support on the catalytic activity also depends on the type of catalysed reaction. Ishida et al.54 reviewed the impact of supported gold catalyst on the catalytic
oxidation of carbohydrates. The study found that compared to the gas phase catalytic oxidation reaction (oxidation of H2, CO), in the glucose oxidation, the influence of
AuNPs’ size is much larger than the kind of support in the catalytic activity. Therefore, when using supported gold catalyst to catalyse the glucose oxidation reaction, after choosing suitable support, more attention should be paid to the influence of preparation method on AuNPs’ size. In industrial projects is preferred to support the active phase on metal oxides. Thus, the choice of the right support and adequate percentage of gold is a very delicate and complex process. In this work we will study several types of support for gold nanoparticles: hydrotalcite with different Mg:Al molar ratios, MgO, AC, VPP, V2O5, ZrO2 and different industrial supports.
1.6.3) Hydrotalcites Mg:Al
Hydrotalcite (HT) is an anionic crystalline structure, also called Layered Double Hydroxide55. The morphology of the material derives from the brucite Mg(OH)
2, in
which Mg2+ cations are octahedrally coordinated by hydroxyl ions, sharing the edges
and forming layers of octahedral. The partial substitution of M2+ with M3+ with similar
16
This net positive charge is compensated by anions (for example, CO32-), which are
located between two brucite-type sheets (Figure 8). Hydrotalcite-type compounds have the general formula showed below and different divalent cations (Mg2+, Ni2+,
Zn2+, Cu2+, etc) and trivalent cations (Al 3+, Cr 3+, Fe 3+, etc) can be used with
different anions An- (CO32-, SiO44-, NO3-, etc).
[M
2+1-x
M
3+x(OH)
2]
x+A
n-x/n· m
H
2O
Figure 8 - Hydrotalcite crystalline structure56.
Hydrotalcite-type materials are formed with x value in the range of 0.1-0.5, while to produce pure hydrotalcite compounds the x value must be in the range 0.20-0.33. The higher x values lead to a too high density of neighbouring M3+ in the brucite-type layer
sheet and metal hydroxides side phases can be formed. These materials are used as catalysts precursors because, after calcination, mixed oxides obtained present several advantages:
✓ High specific surface area;
✓ Are chemically homogeneous and have strong Lewis basic sites; ✓ Stable to thermal treatments, small crystal size;
The preparation method of HT supports used for the gold nanoparticles immobilization will be discuss in detail in the following Experimental Section of this thesis
17
2)
Experimental part – methods and calculation
During this research project, the selective furfural oxidation in liquid phase was studied. Firstly, some catalysts were prepared to test in the reaction and the operating conditions of the process were optimized. The research was focalized to work in a base-free system and without the utilization of any organic solvent. Indeed, the only solvent used was distillate H2O. The reaction mixtures were analysed using High
Performance Liquid Chromatography (HPLC) to obtain the concentrations of furfural and its oxidation products. The concentration values were used to calculate conversion, yields, selectivity and overall carbon balance of each catalytic test.
2.1) Calculations
The conversion (X%) represent the real amount of reagent that is converted into the products. It is expressed as follow:
X = 100 * [n(t0) – n(tf)] / n(t0)
Where n(t0) is the mole number of furfural in t0 and n(tf) is the number of moles of furfural after the reaction.
The yield (Y%) is calculated using the number of the moles of the product obtaining during the reaction. It is expressed as follow:
Y = 100 * nprod(tf) / nreag(t0)
The selectivity (S%) is calculated comparing the yield to the conversion of the reagent, as follow:
S = 100 * Y / X
The carbon balance is a very useful and necessary parameter to check the possible degradation of the furfural and it is calculated as follow:
18
2.2) Instruments
The catalytic tests were performed in a multiphase semi-batch reactor equipped with mechanical stirrer and external heating system and on a SPR High Pressure reactor on the REALCAT platform. The catalysts synthesized were characterized using many different qualitative and quantitative techniques. The final solutions were analysed too to quantify the possible leaching of the catalysts. All equipment used is described below.
2.2.1) Bench scale reactor
The TOPIndustry Autoclave reactor was used to perform the catalytic tests. The autoclave used is equipped with high precision heating system and mechanical stirrer. It is possible to perform tests up to 250 °C (using refrigeration system in the top of the reactor) and 100 bar of pressure. Liquid reagents are insert in the steel vessel of the autoclave with a total volume of 30 mL. The flow system, linked with a pure O2 tank,
permits to introduce/charge oxygen in the reactor. Temperature and stirring rate are controlled with and external electronic device. Technical scheme of the reactor is given in the following Figure 9.
19
2.2.2) Reactor settings and conditions
The reactor was used in batch conditions linked with a pure O2 tank. The reaction
solutions were prepared adding a certain amount of furfural in 21 mL of total volume of H2O stirring the solution to dissolve furfural before to add it in the vessel. 1 mL of
solution was taking off for HPLC analysis of the t0. Then a very precise amount of
catalyst was added in the autoclave before to close it and to purge three times with oxygen. The pression used (6 bar) was reached and after that the heating system turned on. The time necessary to reach the desired temperature was not considered in the reaction time, indeed the 2 hours of reaction started just when the system reached the right temperature and the final solutions were discharged only at the end of the reactions. At the end, the temperature was decreased using an external air cooler system. The reaction mixtures were taken away and filtered with an appropriate filter for syringe. 1 mL of the final solutions were diluted for HPLC analysis of the tf and
the rest stored in the fridge for further analyses.
2.2.3) Screening Pressure Reactor (SPR)
The Screening Pressure Reactor (SPR) is an automated high pressure, high temperature reactor that accelerates catalyst discovery and reactions optimization. This high throughput system can screen hundreds of reaction conditions, explore new synthetic routes, optimize reaction yield and identify alternate reaction conditions to reduce costs or identify a suitable solvent. The SPR has very wide applications like: hydrogenation/dehydrogenation, oxidation, acid/base reactions, biomass processing, petrochemicals, fine chemicals. In our case, it was useful to test and screen several catalysts in shorter time and to do some tests using higher pressure conditions. The SPR equipment in REALCAT platform was used and the relative results are shown in the Results and Discussion chapter of this thesis.
Main characteristics:
• High throughput runs: catalysts testing in parallel (24 samples) and examine multiple variables simultaneously for rapid and high information content screening.
20
• Wide process window: temperatures up to 400 °C and pressures up to 200 bar.
• Automated operation: temperature, pressure, and flow profiles controlled automatically based on a user defined recipe.
• Powerful mixing: High intensity vortexing (up to 800 rpm) provides for good solid/gas/liquid contacting during reaction and limits mass transfer issues.
2.3) Analytical instruments for catalytic tests
2.3.1) High Performance Liquid Chromatography (HPLC)
High Performance Liquid Chromatography is a very widely used analytical technique developed around 1960-70s. It is very powerful and useful separation method of analysis in different fields such as biotechnology, pharmaceuticals, polymer and food industries. A flow scheme of a HPLC instrument is shown in the following Figure 10.
Figure 10 - HPLC simplified scheme57
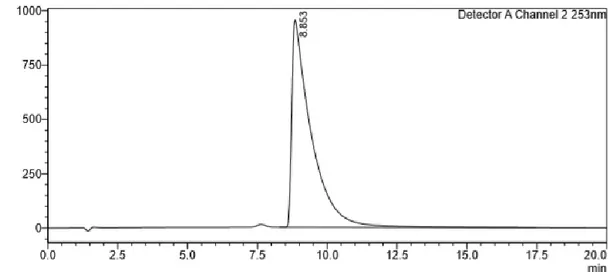
The analyses are started after the injection of a very small amount of liquid sample that is directly inserted in the mobile phase (eluent choose for the analysis) that passes through a column packed with particles of stationary phase. The separation of each component of a mixture depends on different degrees of retention of the components in the column. This is related with the repartition coefficient between the liquid phase and the stationary phase (solid). For this reason, the different components are going out from the column at different time and this is called retention time (Figures 11-13). The retention time is the time between injection and detection using an appropriate HPLC detector. There are numerous detectors used in HPLC analyses, but during our
21
research project an UV detector was used. Detector is a device that provides to transform the information received to an electrical signal and so to understand the measures performed. The changing in the operating conditions during the analyses can change the retention times of the compounds, but also the injection can affect the measurements; for this reason, the HPLC instrument used it was provided of the automatic injector to provide always reproducible injection volumes.
Figure 11 - Furfural HPLC chromatogram to show its retention time (8.85 min) in the analysis conditions used.
Figure 12 - 2-Furoic acid HPLC chromatogram to show its retention time (7.51 min) in the analysis conditions
22
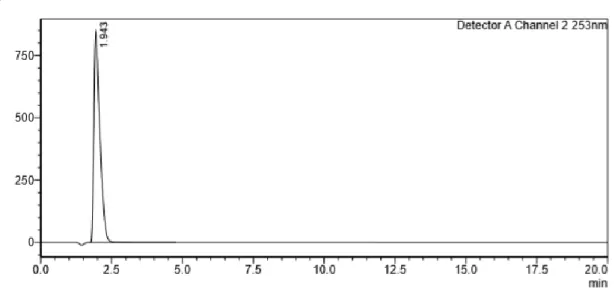
Figure 13 - Maleic acid HPLC chromatogram to show its retention time (1.94 min) with analysis conditions used.
2.3.2) HPLC calibration curves
The conditions of the analysis were as follow: flow 0.300 mL/min, t = 30 °C, Pmax =
240 bar and 0.5 % v/v CHCOOHas mobile phase. The detection was carried out with an UV lamp at 253 nm and the time of analysis was 20 minutes for all the molecules. The column used for the calibration was a Synergi 2.5u hydro-RP100A with size of 100 x 2.0 mm. The curves used for the calibration are shown on Figures 14-16.
Table 1 - Furfural concentrations used to have HPLC calibration curve.
Furfural calibration Concentration HPLC Area 0.003 27595133 0.005 44714517 0.0075 64281939 0.01 86849358 0.015 129324000
23
Figure 14 - Furfural HPLC calibration curve using commercial solution.
Table 2 - Furoic acid concentrations used to have HPLC calibration curve.
Furoic Acid calibration
Concentration HPLC Area 0.00059915 12826997 0.00099858 22200017 0.00139801 29888294 0.00199715 44199680 0.00299573 63226711 y = 8E+09x + 2E+06 R² = 0,9997 0 20000000 40000000 60000000 80000000 100000000 120000000 140000000 0 0.002 0.004 0.006 0.008 0.01 0.012 0.014 0.016 H PLC Area Concentration
Furfural calibration
24
Figure 15 - Furoic acid HPLC calibration curve using commercial solution.
Table 3 - Maleic acid concentrations used to have HPLC calibration curve.
Maleic Acid calibration
M (mol/L) HPLC Area 0.00301034 3883997 0.00501723 6565396 0.00752584 9972370 0.01003446 12854669 0.01505169 18834963 y = 2E+10x - 165554 R² = 0,9994 0 10000000 20000000 30000000 40000000 50000000 60000000 70000000 0 0.0005 0.001 0.0015 0.002 0.0025 0.003 0.0035 HPLC Are a Concentration
25
Figure 16 - Maleic acid HPLC calibration curve using commercial solution.
2.4) Catalysts synthesis
The catalysts tested in the selective furfural oxidation were composed of gold nanoparticles supported on different oxides. Firstly, hydrotalcite Mg:Al supports were synthesized with four different molar ratios between magnesium and aluminium (2:1, 3:1, 4:1 and 5:1) and then used to immobilize gold nanoparticles for the preparation of the final catalysts. The Au NPs were prepared using different preparation methods. Then other commercial and industrial supports were used with the same aim and in the end, some catalysts were also prepared to change the selectivity to maleic acid.
2.4.1) Synthesis of hydrotalcites Mg:Al
Different molar ratios between MgO and Al2O3 were prepared to study how the
acid-base properties of the supports affect the final activity of the catalysts. Hydrotalcite samples (HTs) were prepared by co-precipitating an aqueous solution of Mg and Al salts as precursors with a highly basic carbonate solution58
I. The first solution containing Mg(NO3)2 • 6 H2O and Al(NO3)3 • 9 H2O was
dissolved in 120 mL of deionized water with Mg/Al molar ratios of 2:1, 3:1, 4:1 and 5:1. y = 1E+09x + 367821 R² = 0,9988 0 2000000 4000000 6000000 8000000 10000000 12000000 14000000 16000000 18000000 20000000 0 0.005 0.01 0.015 0.02 H PLC Area Concentration
26
II. The second solution containing amounts of Na2CO3 that was added on a certain
ratio so that the final Al/CO32- molar ratio equals to 2 and the pH of the final
solution was kept at 10.5 ± 0.1
To dissolve the nitrate salts in H2O appropriates volumes were used as indicated in
Table 1, while to dissolve the carbonate salts a different volume of deionized water was used as showed in Table 1 as well. The first solution was added dropwise to the second one and then 1M NaOH was added to the slurry to maintain the pH in the range of 10.5 ± 0.1. The temperature during the synthesis was 55 °C ± 0.2 and the value of pH was kept constant around 10.5. At the end of the dripping the solution was stirred for one hour keeping the temperature constant. The suspension was filtered using Buchner filter, recycling the mother liquid if the precipitate was not completely restrained. At the end of the filtration, the solid was washed with 1L of warm distillate water. The final solid was dried overnight at 70 °C in oven and then it was ground using a mortar. To transform HTs to the oxides, the samples were calcined at 500 °C for 3 hours with a temperature ramp of 5°C/min. Finally, to verify the crystalline structure of the samples, XRD analysis of the calcined material was carried out. Further catalysts will be prepared by adding to the mixed oxide supports the gold nanoparticles following two different methods: the Turkevich method59 with Na3C6H5O7
• 2 H2O using HauCl4 as a precursor of gold and the second one will be based on a
chemical reduction with hydrazine using HauCl4 • 3 H2O as a gold precursor. The
calcination of the 5:1 HT sample was disturbed. Indeed, the calcination oven did not stop during the night and so only this sample was calcined for 10~12 hours at 500 °C.
Table 4 – Quantities used for the HTs synthesis.
Molar ratio Mg(NO3)2
(g) Al(NO3)3 (g) Na2CO3 (g) VH2O metals solution (mL) V H20 carbonates (mL) 2ː1 19.49 14.25 8.06 120 76.00 3ː1 22.38 10.91 6.17 120 58.18 4ː1 24.17 8.84 5.00 120 47.13 5ː1 25.39 7.43 4.20 120 39.61
27
2.4.2)
Different preparation methods for Au nanoparticles
2.4.3) “Hydrazine method”
Au/HT catalysts were prepared by a chemical reduction – deposition of gold nanoparticles using hydrazine as reductant of Au (III). The reduction of gold is expected to proceed according to the following reaction60:
AuCl4 - + N2H4 + 2 OH- Au (0) + N2 + 4 Cl- + 2 H3O+
For the deposition, the reaction flask was fitted with a reflux condenser and a thermocouple for the temperature control during the reaction. A suspension of 2 g of the supports (HT 2:1, HT 3:1, HT 4:1 and HT 5:1) in 100 mL of distillate water were stirred at room temperature. Then the temperature was set up to 80 °C and a suspension of 40 mg of HAuCl4 • 3 H2O dissolved in a small amount of distillate water
was added. Then 6 mL of N2H4 • H2O was added, the reaction was finished after 30
minutes at 80 °C with a stirring frequency of 600 rpm. The solid was filtered using a Buchner filter, washed with 200 mL of warm distillate water and dried in the oven at 70 °C overnight. At the end, the prepared catalysts were grinding using a mortar.
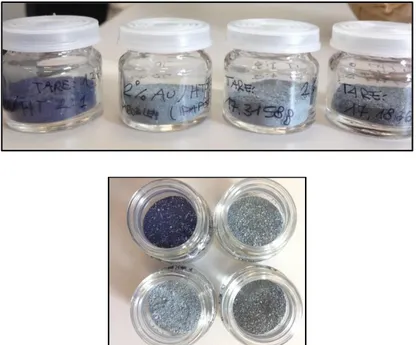
Figure 17 - Image of different Au/HT catalysts prepared by “hydrazine method”.
The synthesized catalysts did not result completely homogeneous and they present different colors (Figure 17). The reagents used for this synthesis were purchased
28
from Sigma-Aldrich®: gold (III) chloride trihydrate (≥ 49.0% Au basis) and hydrazine
hydrate solution ~78-82% water solution.
2.4.4) Turkevich’s method
To follow the Turkevich’s method to prepare Au nanoparticles, 20 mL of 1.0 mM HAuCl4 solution (containing 7.88 mg of HAuCl4 • 3 H2O) was heated to the boiling
point in a 50mL beaker with a magnetic stir bar and a stirring frequency of 400 rpm. To the boiling solution 2 mL of sodium citrate solution (20.02 mg of Na3C6H5O7 • H2O
in 2 mL of H2O, 38.8 mM) was added. The gold sol (colloidal gold) gradually formed
as the citrate reduced the Au (III) to Au (0). Immediately after the addition of sodium citrate the reaction medium became dark grey; as aurate ions are reduced, the reaction medium was changed to purple before turning to deep red and then it was stable. After 15 minutes, the heating system was stopped, and the solution was cooled at room temperature. This solution will be used to impregnate the hydrotalcite supports using the Incipient Wetness Impregnation method, but firstly it will be necessary to know pores volume of these supports. Using this method, it is expected to prepare “bigger” gold nanoparticles with a diameter around 15-20 nm.
2.4.5) Sol-immobilization method with a stabilizer
The Au nanoparticles were prepared following a method based on the available literature61,62. First, a 2% solution of PVA in distillated water was prepared considering
the ratio PVA/Au (w/w) = 1.2 and when the PVA was completely dissolved the solution was added to an aqueous solution of HAuCl4•3H2O (5.08 x 10⁻⁴ mol/L) under vigorous
stirring. A freshly prepared NaBH4 solution (0.1 mol/L) was prepared considering the
molar ratio NaBH4/Au = 5 and then added drop by drop to form the metallic sol. The
color of the sol was deep purple. After 30 minutes of sol generation, the Au nanoparticles were immobilized by adding different supports (commercial MgO, hydrotalcites Mg:Al, industrial VPP, activated carbon) under vigorous stirring. The amount of the support was calculated to give a final metal loading of 2 wt%. After 2 hours the slurry was filtered, the solid washed with 100 mL of hot water (T=50-60 °C) and 50 mL of ethanol and after was dried in the oven at 100 °C for 1 hour. The solid was finally grinded. Using this preparation method, it is expected to prepare smaller
29
gold nanoparticles with a diameter around 2-4 nm, but a TEM analysis will be performed to check the real nanoparticles size.
2.4.6) Calculations for the synthesis using PVA
❖ 2000 mg of commercial MgO, Activated Carbon (purchased from Sigma-Aldrich®) and hydrotalcites supports were previously synthesized as already reported, were used as supports.
2 wt% of Au 40 mg of gold nAu= 2.03 x 10⁻⁴ mol
nAu = nHauCl4 nAu precursor = 2.03 x 10⁻⁴ mol m = 79.97 mg (80 mg)
[HauCl4] = 5.08 x 10⁻⁴ mol/L V = n/M = 399.76 mL (400 mL of aqueous solution)
2% PVA solution 98 mg of PVA in 5 mL of distillated water
[NaBH4] 0.1 mol/L solution n = 1,015 x 10-3 mol m = 38.41 mg V = 10.15 mL
❖ 1000 mg of DuPont® VPP was used.
2 wt% of Au 20 mg of gold nAu= 1.015 x 10⁻⁴ mol
nAu = nHauCl4 nAu precursor = 1.015 x 10⁻⁴ mol m = 39.99 mg (40 mg)
[HauCl4] = 5.08 x 10⁻⁴ mol/L V = n/M = 199.76 mL (200 mL of aqueous solution)
2% PVA solution 49 mg of PVA in 2.5 mL of distillated water
[NaBH4] 0.1 mol/L solution n = 5.08 x 10⁻³ mol m = 19.21 mg V = 5 mL
❖ 1000 mg of industrial activated carbon M17067, Saint-Gobain supports and V2O5 were used. 2 wt% AC, V2O5, Au/AR 1, AR 2 and AR 3 catalysts were
prepared.
2 wt% of Au 20 mg of gold nAu= 1.015 x 10⁻⁴ mol
nAu = nHauCl4 nAu precursor = 1.015 x 10⁻⁴ mol m = 39.99 mg (40 mg)
[HauCl4] = 5.08 x 10⁻⁴ mol/L V = n/M = 199.76 mL (200 mL of aqueous solution)
30
[NaBH4] 0.1 mol/L solution n = 5.08 x 10⁻³ mol m = 19.21 mg V = 5 mL
Saint-Gobain supports chemical composition:
▪ SZ 39140 AR 1 (wt %) = ZrO2 58%, TiO2 41%, SiO2 0.46%, HfO2 1.1%.
▪ SZ 61143 AR 2 (wt %) = ZrO2 83.2%, WO3 15.3%, HfO2 1.5%.
▪ SZ 61156 AR 3 (wt %) = ZrO2 90.06%, La2O3 7.96%, HfO2 1.75%, Al2O3
0.23%.
Some of the prepared catalysts are shown in the Figure 18:
Figure 18 - Gold nanoparticles supported on hydrotalcite supports with different molar ratios Mg:Al (2:1, 3:1, 4:1,
5:1, from left to right respectively).
2.5)
Au NPs on different supportsThe Au nanoparticles were prepared following a method based on the available literature and then immobilized on some industrial supports. First, a 2% solution of PVA in distillate water was prepared considering the ratio PVA/Au (w/w) = 1.2 and when the PVA was completely dissolved the solution was added to an aqueous solution of HAuCl4•3H2O (5.08 x 10⁻⁴ mol/L) under vigorous stirring. A freshly prepared
NaBH4 solution (0.1 mol/L) was prepared considering the molar ratio NaBH4/Au = 5
and then added drop by drop to form the metallic sol. The colour of the sol was deep purple. After 30 minutes of sol generation, the Au nanoparticles were immobilized by adding different supports: V2O5, industrial activated carbon and different Saint-Gobain
supports under vigorous stirring. The amount of the support was calculated to give a final metal loading of 2 wt%. H2SO4 concentrated was used to adjust the pH around
the value of 2-3 for vanadium (V) oxide and of 1-2 for the other supports. After 2 hours the slurry was filtered, the solid was washed with 100 mL of warm water (T=50-60 °C) and 50 mL of ethanol and after was dried in the oven at 70 °C for 1 hour. The solid
31
was finally grinded. It was noticed that during the synthesis not all gold nanoparticles were immobilized on the catalyst surface. This is probably due to the pH values and the quantity of H2SO4 added during the synthesis. However, the exact gold loading will
be determined by the ICP-OES analysis on REALCAT platform.
2.6)
Catalysts characterizationAll synthesized catalysts were characterized using different techniques, for example X-Ray Diffraction (XRD) analyses were performed on the supports and after the gold nanoparticles immobilization also, to check the crystalline structures and the presence of the Au NPs. X-Ray Fluorescence (XRF) analyses were done to check qualitatively the quantity of gold. ICP-OES analyses were performed on the catalysts to quantify the amount of gold and the supports composition. The Au particle sizes were determined using TEM microscopy. Brunauer-Emmett-Teller (BET) theory was used for the measurements of the specific surface area of the prepared materials. Finally, the acidic-basic properties of the supports used were characterized with TPD (Temperature Programmed Desorption) of NH3 and CO2.
2.6.1) X-Ray Diffraction (XRD)
The XRD measurements of the solids were performed using the Bruker D8-Advance Powder X-ray diffractometer in REALCAT platform. The patterns were obtained using Cu Kα radiation with an accelerating voltage of 40 kV and an emission current of 40 mA. The samples were scanned over a 2θ range of 10° - 70°, with a step size of 0.014° and a time of 19.2 s par step. The setting of 10 mm divergence, fent primaire Soller 2.5° were used. The phases were identified using the powder diffraction file (PDF) database.
2.6.2) X-Ray Fluorescence (XRF)
X-Ray Fluorescence spectrometry is an analytical technique used for elemental analysis of solids, liquids and thin-film samples. When a high-energy electron beam interacts with matter two things happen: 1) emission of photoelectron and 2) ejection of photoelectrons from the inner shells of the atoms leaves a “hole” in the electronic structure of the atom, and an electron from a higher energy shell fills the hole. During
32
this the atom undergoes fluorescence, or the emission of an X-ray photon whose energy is equal to the difference in energies of the initial and final states. Detecting this photon and measuring its energy allows determining the element and specific electronic transition from which it originated. For the analysis, the X-Ray Fluorescence spectrometer of the REALCAT platform was used (Bruker).
2.6.3) ICP-OES
The instrument used was a ICP-OES Agilent Technologies. The ICP-OES is an analytical technique used for quantitative, semi-quantitative or qualitative determination of elements constituting the catalysts. More than 70 elements can be determined by ICP-OES at trace level. This instrument analysis only digested catalyst by acid or base digestion procedures. An automated digester was associated to ICP to digest the powder catalyst precisely. Vulcan 42 S – Questron Technologies / Horiba was the automated digestion system used of REALCAT platform, combining the two essential steps in sample preparation before ICP analyses. It performs with precision and security the following steps:
• Volumetric liquid dispending;
• Heating/cooling and temperature monitoring of a block of 42 positions ensuring thermal uniformity for all the samples;
• Level volume adjustment of the tubes; • Mixing samples;
• Dilution and/or transfer of a known amount of each sample prior to analysis. Almost all the digestor components are made with plastic to avoid the acid corrosion. This digester uses also a highly efficient fume removal neutralizing the acid vapor and so avoiding contamination between samples.
2.6.4) Transmission Electronic Microscopy
The transmission electronic microscope (TEM) analysis with EDS probe (Figure 19) is based on the electron-matter interaction and it is useful to know about composition, phases presented, crystallinity degree and particles size with a resolution of 0.2 nm, for the high-resolution instruments.
33
Figure 19 - TEM simplified scheme.
During the analysis, a beam of electrons is accelerated with an electric potential in high vacuum and focused on the sample using magnetic lenses. The beam can traverse through a very thin sample layer and it is partially diffracted and partially it does not undergo any deviation. Subsequently, both of electron beams come to a fluorescent screen that allow to see the greatly enlarged bi-dimensional projection. The TEM analyses were performed to know the metal nanoparticles distribution and them size. The most active catalysts were characterized in the morphology and in the metal dispersion on the surface. Before the analysis, the catalysts were dispersed in EtOH and left for 10 minutes in the ultrasonic bath. To perform the analyses, the suspensions were deposited on the copper grill\grate and the instrument used was the microscopy TEM/STEM FEI TECNAI F20 combined with an Energy Dispersive X-ray Spectrometry (EDS) a 200 keV. Three of the prepared catalysts were analyzed by Transmission Electron Microscopy and the results will show in the next chapter.
2.6.5) NH3 and CO2 – TPD
The total acidity or basicity of the catalysts was determined using a TPD/TPR/TPO Micromeritics instrument equipped with a MKS MS Spectrometer. Generally, 15-30 mg of catalyst were pretreated up to 500°C (calcination temperature of the samples) under He flow. For the NH3-TPD and CO2-TPD experiment the samples were cooled
down to 50°C and 40°C respectively and the adsorption of the probe molecule was performed for 1 h flowing a mixture of 10% NH3 or 10% CO2 in Helium. Then, He flow
34
physiosorbed molecule. Finally, the temperature was increased up to 500°C (10°C/min) and maintained at this temperature for 1 hour.
2.6.6) Nitrogen adsorption – desorption (BET analysis)
Nitrogen adsorption and desorption analyses on the different supports and catalysts were performed using a TriStar II Plus analyzer (Micrometrics). The samples were subjected to a pre-treatment before the analysis to eliminate impurities that are adsorbed on the surfaces. This pre-treatment consists of degassing by heating up to 150 °C with a temperature ramp of 2 °C/min with a pressure of 30 mmHg and maintaining the samples at this temperature for 30 minutes. Subsequently, it is heated up to 250 °C with a temperature ramp of 10 °C/min and maintained at this temperature for 60 minutes. All the catalysts synthesized were characterized by adsorption and surface desorption analysis that allowed to measure them surface area and pore volumes. At the end of the analysis, isotherms of adsorption and desorption are obtained to have information about morphology and the structural properties of the catalysts prepared. To determine the total surface area of the analysed catalysts the BET model was used (Brunauer, Emmett and Teller). The pore volume and the values of surface area of all the supports and catalysts were calculated. The results are given in the next chapter.
3)
Results and discussion
3.1) Screening of the catalysts
Several catalytic systems have been synthesized and tested in furfural oxidation to find the best catalytic system, optimizing the process conditions and increasing the furoic acid yield in base-free conditions. All catalysts used in our work are listed below:
▪ 2 wt% Au/HT 2:1; ▪ 2 wt% Au/HT 3:1; ▪ 2 wt% Au/HT 4:1; ▪ 2 wt% Au/HT 5:1; ▪ 1 wt% Au/Mg(OH)2;
35
▪ Au/VPP; ▪ Au/V2O5;
▪ 2 wt% Au/AC ;
▪ 2 wt% Au/Saint-Gobain Norpro support 1 ▪ 2 wt% Au/Saint-Gobain Norpro support 2 ▪ 2 wt% Au/Saint-Gobain Norpro support 3
3.2) Catalytic tests
The tests were performed in the batch oxidation reactor (Top Industry Autoclave) in liquid phase using operating condition as follow: P=6 bar of pure O2, T=110°C,
mechanical stirrer 600 rpm and initially 43 µL of C5H4O2 (furfural) in 20 mL of H2O
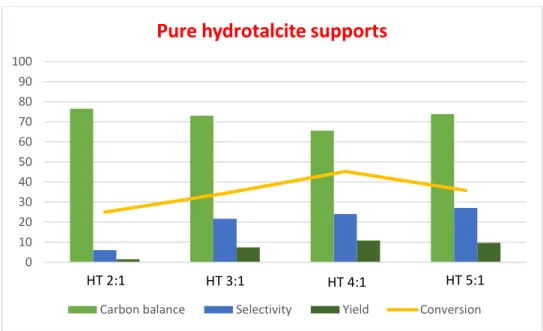
were used [Furfural concentration: 0.026 mol/L]. For all tests in the first moment, 100 mg of catalysts were used with a molar ratio furfural/Au = 50. At the end, the reaction mixtures were analysed with HPLC analyses and furfural and furoic acid concentrations were calculated according to the calibration curves done. Then, conversions, selectivities and yields were obtained. The more interesting tests were performed several times to check the reproducibility of the obtained data. The reactions with pure supports without the gold nanoparticles were firstly performed to check if the support itself is already active in the oxidation of furfural. Some conversion was observed, however, the yield of furoic acid was very low (Figure 20).
36
Figure 20 - Comparison of the performance of hydrotalcite supports with different molar ratios Mg:Al. Batch
oxidation reactor, P=6 bar (O2), T=110°C, 2h, 600 rpm.
This means some degradation of furfural occurred, confirmed in fact by the decrease in the carbon balance values.
3.2.1) Au supported on HT supports
An increase in the conversion and yield of furoic acid with the increase of the Mg content in the Au/Hydrotalcite materials was observed (Figure 21). This is probably due to an increase in the overall basicity of the support, which would promote the general activity of the catalysts. The obtained results are shown in the Figure 21. In this case, different Mg:Al molar ratios were evaluated in order to study whether the increase in the Mg content would result in more basic supports, consequently enhancing the catalytic performances of the Au catalysts. The unexpected lower conversion of furfural using HT 5:1 may be due to a problem observed during the preparation of the support, as already reported above. The catalysts prepared by a chemical deposition-reduction of gold nanoparticles on HT supports show similar conversions of furfural, but the increase in the selectivity and yield to furoic acid was observed. Indeed, the gold-mediated oxidation is known to avoid radical pathways; thus, the degradation of furfural is less favourable as confirmed by the improved carbon balance. 0 10 20 30 40 50 60 70 80 90 100 1 2 3 4
Pure hydrotalcite supports
Carbon balance Selectivity Yield Conversion
37
Figure 21 - Comparison of the performance of gold nanoparticles on different HT supports. Batch oxidation
reactor, P=6 bar (O2), T=110°C, 2h, 600 rpm.
The worst catalytic activity was observed for the 2% Au/HT 4:1 catalyst prepared by a chemical reduction-deposition of gold nanoparticles using sodium citrate instead of hydrazine as reductant. The change in the reducing agent might have affected the size of the nanoparticles (dispersion).
3.2.2) Effect of the reaction time
The effect if the reaction time on catalytic activity was studied using 2 different catalysts: 1% wt. Au/HT 2:1 and 1 % wt. Au/HT 4:1. The results are presented in Tables 5 and 6.
Table 5. Catalytic results with 1 wt% Au/HT 2:1 catalyst
1%Au/HT 2:1 X% S% Y% c.b.%
2h 22.5 20.4 4.6 82.0 4h 28.7 45 12.9 84.2 6h 26.8 63.5 17.0 90.2
Table 6. Catalytic results with 1 wt% Au/HT 4:1 catalyst
1%Au/HT 4:1 X% S% Y% c.b.% 2h 14.2 93 13.2 99.0 4h 27.1 66 17.0 90.8 6h 29.3 99.7 29.2 99.9 0 10 20 30 40 50 60 70 80 90 100 1 2 3 4
Au/HT catalysts (Hydrazine method)
Carbon Balance Selectivity Yield Conversion
38
Only a slight increase of the conversion has been noticed in the case of the Au/HT 2:1 catalyst when the reaction time increased from 2 to 4 hours. Moreover, no significant changes were further observed (Table 5). After 4 and 6 hours of reaction the yields in furoic acid and the overall carbon balances increased. However, hydrazine reduced catalysts have shown a maximum conversion of around 30%. In fact, they were not very active in the oxidation of furfural to furoic acid. As expected the preparation method used for the synthesis of gold nanoparticles plays a crucial role in the activity of the final catalysts.
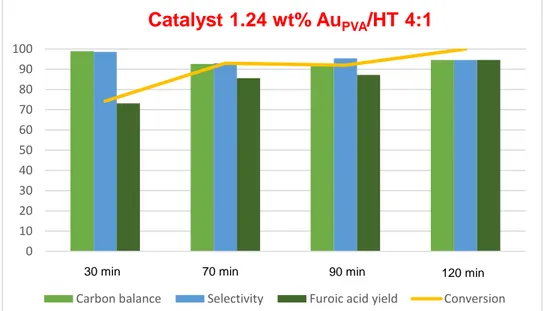
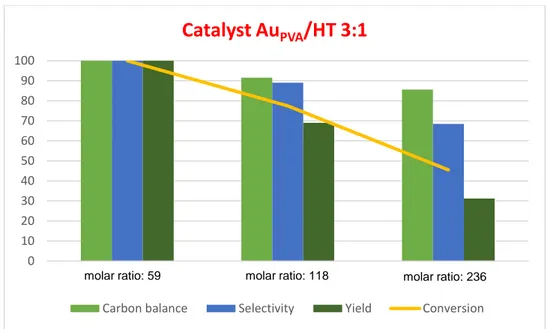
The reaction time was also studied for the AuPVA/HT catalysts (Figure 22). In this case
complete furfural conversion was observed already after 70 minutes of reaction as shown in Fig. 22. The selectivity to furoic acid was very high in all cases. In addition, the carbon balance was also very high, indicating minimum degradation of furfural in these conditions. This shows that the catalysts are very active already at the initial time of the reaction, but also that AuPVA/HTs catalysts display completely different
performances as compared to the hydrazine and citrate reduced catalysts.
Figure 22 - Effect of the reaction time using 1.24 wt% AuPVA/HT 4:1. Furfural oxidation, P=6 bar (O2), T=110°C, 600 rpm, molar ratio: 81.
The effect of the time of the reaction was also evaluated for the 1.32 wt% Au/ZrO2
-TiO2 catalyst (industrial support, Au/AR1) after the leaching problems occurred using
Au/HT 5:1 and Au/MgO catalysts. The catalyst reached 75% of conversion after only
0 10 20 30 40 50 60 70 80 90 100 1 2 3 4 Catalyst 1.24 wt% AuPVA/HT 4:1
Carbon balance Selectivity Furoic acid yield Conversion