Dottorato di Ricerca in Scienze Matematiche, Fisiche ed Informatiche
Curriculum in Sistemi e Tecnologie del Software
XI Ciclo
Search-Based Approaches for
Software Development Effort Estimation
Doctoral Dissertation of
Federica Sarro
Coordinator Advisor
I am deeply grateful to my supervisor Professor Filomena Ferrucci for her continuous and invaluable advice, encouragement and support. I had the honor and privilege to benefit from the expertise of an extraordinarily passionate professor.
I wish to thank Dr. Carmine Gravino for all our valuable discussions and his advice which was always delivered with passion and rigor. I also wish to thank my colleagues for providing a stimulating and fun-filled environment and to my friends in Salerno and other parts of the world. They were always a great source of laughter, joy and support.
A special thanks to my mum and sister, for believing in my dreams, and to Maria Laura, whose endless love and encouragement allowed me to take this journey. I owe them everything and wish I could show them just how much I love and appreciate them.
To them and to the rest of my family I say, ‘my name is written on the first page but your names are written on every page because there wasn’t a moment of this journey that you weren’t by my side.’
Finally, I would like to dedicate this work to my father, who left us too soon. I hope that this work makes you proud.
Contents
INTRODUCTION ... 3!
Outline ... 6
CHAPTER 1: Background ... 7!
1.1 Estimating Software Development Effort ... 7!
1.2 Search-Based Approaches for Effort Estimation ... 10!
1.2.1 Hill Climbing ... 10!
1.2.2 Tabu Search ... 11!
1.2.3 Genetic Algorithms ... 12
CHAPTER 2: Literature Review ... 14!
2.1 Empirical studies that investigated search based approaches to estimate software development effort ... 14!
2.2 Empirical studies that investigated search based approaches to improve the effectiveness of existing estimation techniques ... 18
CHAPTER 3: Using Search-based Approaches for Building Effort Estimation Models ... 23!
3.1 Designing Search-based Approaches for building effort estimation models ... 24!
3.1.1 Setting of Hill Climbing and Tabu Search ... 26!
3.1.2 Setting of Genetic Programming ... 27!
3.2 Empirical Study Design ... 27!
3.2.1 Dataset ... 31!
3.2.2 Validation Method and Evaluation Criteria ... 32!
3.3 Analysis and Interpretation of the Results ... 36!
3.3.1 RQ1 and RQ2 ... 36!
3.3.2 RQ3 ... 41!
3.3.3 RQ4 ... 43!
3.3.4 RQ5 ... 44!
CHAPTER 4: How the Objective Function Choice Affects the Effort Estimation Accuracy of
Search-Based Approaches ... 47!
4.1 Empirical Study Planning ... 48!
4.1.1 Setting of Genetic Programming and Tabu Search ... 49!
4.1.2 Validation Method and Evaluation Criteria ... 50!
4.2 Analysis and Interpretation of the Results ... 51!
4.3 Validity Evaluation ... 65
CHAPTER 5: Using Tabu Search to Configure Support Vector Regression for Effort Estimation ... 66!
5.1 Using Support Vector Regression in combination with Tabu Search for effort estimation ... 69!
5.1.1 Support Vector Regression ... 69!
5.1.2 Using Tabu Search to configure SVR ... 73!
5.2 Empirical Study Design ... 77!
5.2.1 Datasets ... 77!
5.2.2 Null Hypotheses ... 80!
5.2.3 Validation Method ... 82!
5.2.4 Evaluation Criteria ... 83!
5.3 Results and Discussion ... 83!
5.4 Validity Assessment ... 89
CONCLUSIONS ... 91
REFERENCES ... 94
Appendix ... 106!
A. Datasets descriptions ... 106!
B. Manual Stepwise Regression ... 114!
INTRODUCTION
Effort estimation is a critical activity for planning and monitoring software project development and for delivering the product on time and within budget. Indeed, significant over or under-estimates expose a software project to several risks. As a matter of fact under-estimates could lead to addition of manpower to a late software project, making the project later (Brooks’s Law), or to the cancellation of activities, such as documentation and testing, negatively impacting on software quality and maintainability. Thus, the competitiveness of a software company heavily depends on the ability of its project managers to accurately predict in advance the effort required to develop software system. However, several challenges exists in making accurate estimates, e.g., the estimation is needed early in the software lifecycle, when few information about the project are available, or several factors can impact on project effort and these factors are usually specific for different production contexts.
Several techniques have been proposed in the literature to support project managers in estimating software project development effort.
To date, expert opinion is a commonly used estimation method and is still used by software and Web companies [66]. However, relying on the expertise of the company’s practitioners the results are less repeatable, being mainly based on subjective judgments [13]. Moreover, this made difficult to quantify and to determine those attributes that have been used to derive an estimate [89].
To overcome this limitation, several techniques which rely on a more formal approach have been proposed. These include the application of some algorithms to a number of factors that influence the development cost, such as the size, to produce an estimate or a model providing the estimation in an objective way. COCOMO and COCOMO II are probably the best known generic methods [13]. They are based on a regression formula, with parameters that are derived from some historical project data and current project characteristics. They are generic methods that often need to be calibrated to local data to take into account the characteristics of the specific production context. Alternatively, a software company can construct its specific model (or estimation) using an estimation technique that takes as input the information coming from past projects. Usually the employed data consist of information about some relevant factors (named cost drivers) and the effort
actually spent by the company to develop prior projects. In this class of data-driven estimation techniques we can find Linear and Stepwise Regression [13][89] and some artificial intelligence techniques, such as Classification and Regression Tree (CART), Case-Based Reasoning (CBR), and Bayesian Networks (BN) [89].
In the last years the use of search-based (SB) approaches has been suggested to be employed as an effort estimation technique. These approaches include a variety of meta-heuristics, such as local search techniques (e.g., Hill Climbing, Tabu Search, Simulated Annealing) or Evolutionary Algorithms (e.g., Genetic Algorithms, Genetic Programming). They search for suitable solutions to problems characterized by large search space, using an objective function that gives an indication of how a solution is suitable for the problem under investigation.
The generic nature of these meta-heuristics let them to be fruitful for different goals and issues, simply by redefining the solution representation and the objective function. As a matter of fact, in the last years there has been an explosion of researches on the use of SB techniques in many software engineering fields [55][56], giving rise to a very active field known as Search-Based Software Engineering (SBSE) [54]. The idea underlying the use of such techniques is based on the reformulation of software engineering problems as search or optimization problems whose goal is to find the most appropriate solutions that conform to some adequacy criteria (i.e., problem goals). In particular, the use of SB approaches in the context of effort estimation is twofold: they can be exploited to build effort estimation models or to enhance the use of other effort estimation techniques. In the first case the problem of building an estimation model is reformulated as an optimization problem where the SB method builds many possible models - exploiting past projects data - and tries to identify the best one, i.e., the one providing the most accurate estimates. In the second case, SB methods can be exploited in combination with other estimation techniques to improve critical steps of their application (e.g., features subset selection or the identification of critical parameters) aiming to obtain better estimates.
The usage reported in the literature of the SB approaches for effort estimation have provided promising results that encourage further investigations. However, they can be considered preliminary studies [2]. As a matter of fact, the capabilities of these approaches were not fully exploited, either the employed empirical analyses did not consider the more recent recommendations on how to carry out this kind of empirical assessment in the effort estimation and in the SBSE
contexts [4][6][73][135]. The main aim of the PhD dissertation is to provide an insight on the use of SB techniques for the effort estimation trying to highlight strengths and weaknesses of these approaches for both the uses above mentioned.
In particular, on the basis of the weakness highlighted in the state of the art, the research has been carried out aiming at answer the following questions:
• How the design choices characterizing the use of the SB approaches impact on the performance of these techniques?
• Are there any differences in the use of different SB techniques?
• Are the SB techniques as effective as widely used effort estimation methods?
• Are the SB techniques effective to improve the accuracy of other data-driven effort estimation techniques?
In particular, as for the first question, an often overlooked aspect of research on computational search algorithms lies in the selection and tuning of the algorithmic parameters. Let us observe that a suitable setting is usually obtained via a trial-and-error process for each new problem to be addressed. As a matter of fact, in previous work the number of solutions and iterations of search-based approaches was empirically determined carrying out a validation process with different values for these parameters and selecting the one providing the best results (see e.g., [42][43][44]). However, this practice is time consuming and it has to be repeated every time new data is used, thus limiting the adoption of search-based approaches by practitioners. To overcome this limitation we employed and assessed an heuristics originally suggested in [40] to set population size and generation number of a Genetic Algorithm. Moreover, special attention has been given to the role played by the use of different objective functions since this is the most important design choice to be made in the use of any SB technique. In particular, we experimented several objective functions based on both single and combined evaluation measures and assessed how the accuracy of GP and TS is affected by this choice. To answer the second question we designed and assessed the use of three different SB techniques, namely Hill Climbing, Tabu Search, and Genetic Programming, and compared them in terms of accuracy and cost-effectiveness.
To understand the actual effectiveness of SB effort estimation approaches, we compared them with baseline methods, such as the mean and median of effort, and some widely used effort estimation techniques, such as Manual Stepwise Regression (MSWR) [89] and Case-Based Reasoning (CBR) [122]. Indeed, if the investigated estimation method does not outperform the results achieved with these baseline methods it cannot be transferred to industry [89].
As for the last question, we employed SB techniques to configure Support Vector Regression (SVR) that is a new generation of Machine Learning algorithms that have turned out to be effective for effort estimation. Nevertheless, its prediction accuracy is heavily influenced by its parameter setting [25] and no general guidelines are available to select these parameters. Thus, we investigated the use of Tabu Search in combination with SVR to select the parameters of SVR to be employed for effort estimation.
The research has been carried out to verify the effectiveness of the proposed techniques in a quantitative and reproducible way carrying out several empirical studies carefully taking into account the biases that might affect the obtained results (i.e., threats to validity). To this end we performed several empirical research following the guidelines proposed in [4][73][135].
Preliminary results of this research have been published in
[26][27][36][41][42][43][44][45][46][115].
Outline
The thesis is structured as follows. Chapter 1 provides background on software development effort estimation and search-based approaches. Chapter 2 discusses the work carried out so far on the use of search-based approaches for software development effort estimation. Chapter 3 focuses on the definition and assessment of three search-based approaches (i.e., Hill Climbing, Tabu Search and Genetic Programming) to build effort estimation models reporting results concerning with their setting, effectiveness, and comparison. Chapter 4 presents the results of the empirical analysis aiming to assess the impact of using different objective functions with both Tabu Search and Genetic Programming. Chapter 5 focuses on the use of Tabu Search to configure a machine learning technique for effort estimation, namely Support Vector Regression. Final remarks conclude the thesis.
CHAPTER 1: Background
1.1 Estimating Software Development Effort
The prediction of software development effort plays a crucial role for the competitiveness of a software company and it is very important not only for the company that produces the software but also for its customers. Several benefits can be derived from an accurate estimate of software project development effort. Among them [13]:
- the possibility of defining the appropriate software costs, thus obtaining the contracts for the development of the software projects;
- the possibility of suitably planning/monitoring the project and allocate resources adequately, thus ensuring time to market and adequate software quality.
Software development effort can be influenced by several factors, among them the size of the software is the main factor. Other factors are the skill and the experience of the subjects involved in the projects, the complexity of the software, the non functional requirements, the adopted software development process, etc. In the last decades, several approaches have been defined, which combine, in different ways, these factors by employing modeling techniques. A widely accepted taxonomy of estimation methods classified them in Non-Model Based and Model Methods [13]. While Non-Model Based Methods mainly take into account expert judgments (thus obtaining highly subjective evaluations), Model Based Methods involve the application of some algorithms to a number of factors to produce an effort estimation. These!approaches!use!data!from!past!projects,! characterized! by! attributes! that! are! related! to! effort! (e.g.! the! size),! and! the! actual! effort! to! develop!the!projects,!in!order!to!construct!a!model!that!is!used!to!estimate!the!effort!for!a!new! project!under!development.
Widely! employed! Model Based estimation! methods! are! Linear! Regression! (LR),! CaseBBased! Reasoning! (CBR),! and! Classification! And! Regression! Tree! (CART)! [13][14][15][122].! Other! novel!approaches!have!been!proposed!in!the!literature.!Any!new!approach!must!be!validated! by!some!empirical!studies!in!order!to!verify!its!effectiveness,!i.e.,!whether or not the predicted efforts are useful estimations of the actual development efforts. To this aim historical datasets are employed. In order to ensure strength to the validation process, it is recommended that data coming
from the industrial world are employed. They can come from a single company or from several companies (cross-company datasets), such as the publicly available ISBSG repository that contains data from a great number of projects developed by companies around the world [64]. A technique that is widely employed to validate an estimation approach is validation. One round of cross-validation involves partitioning the dataset into two randomly complementary sets: the training set for model building and the test set (or validation set) for model evaluation [13]. To reduce variability, multiple rounds of cross-validation are performed using different partitions. The prediction accuracies are then averaged over the rounds. Several strategies have been proposed to obtain training and test sets. The k-fold cross validation suggests to partition the initial dataset of N observations in k randomly test sets of equal size, and then for each test set we have to consider the remaining observations as training set in order to build the estimation model. The leave-one-out
cross-validation is widely used in the literature when dealing with small datasets (see, e.g. [14]). To
apply the cross-validation, the original dataset of N observations is divided into N different subsets of training and validation sets, where each validation set has one project. Then, N steps are performed to get the predictions for the N validation sets.
Another technique that is often exploited is the hold-out validation, where a subset of observations is chosen randomly from the initial dataset to form the training set, and the remaining observations compose the test set. Usually, about a third of the initial dataset is used as validation set.
To assess the accuracy of the derived estimations some evaluation criteria are proposed in the literature. Among them several summary measures, like MMRE, MdMRE, and Pred(25) [22], are widely employed and considered de facto standard evaluation criteria. They are based on the evaluation of the residuals, i.e., the difference between the actual and estimated efforts. In the following, we will report the definitions of these summary measures taking into account a validation set of n elements.
In order to take into account the error with respect to the actual effort, the Magnitude of Relative
Error [22] is defined as!
EFreal - EFpred MRE =
where EFreal and EFpred are the actual and the predicted efforts, respectively. MRE has to be calculated for each observation in the validation dataset. All the MRE values are aggregated across all the observations using the mean and the median, giving rise to the Mean of MRE (MMRE), and the Median MRE (MdMRE), where the latter is less sensitive to extreme values [98].
The Prediction at level l [22] is defined as
k Pred(l)=
n
where k is the number of observations whose MRE is less than or equal to l, and n is the total number of observations in the validation set. Generally, a value of 25 for the level l is chosen. In other words, Pred(25) is a quantification of the predictions whose error is less than 25%. According to Conte et al. [22], a good effort prediction model should have a MMRE≤0.25 and Pred(25)≥0.75, meaning that at least 75% of the predicted values should fall within 25% of their actual values. Kitchenham et al. [72] suggest also the use of the Magnitude of Relative Error relative to the Estimate (EMRE). The EMRE has the same form of MRE, but the denominator is the estimate, giving thus a stronger penalty to under-estimates:
EMRE = EFreal – EFpred \ EFpred.
As with the MRE, we can also calculate the Mean of EMRE (MEMRE) and Median of EMRE (MdEMRE).
Other summary measures less frequently used are the Balanced MMRE (BMMRE), the Mean
Squared Error (MSE) [22] and the Adjusted Mean Square Error (AMSE) [16]. They are defined as
follows:
(
)
100 n n i i i=1 i i EFreal - EFpred BMMRE =min EFreal ,EFpred
! " # $ # $ % &
∑
∑
n 2 i=1 1MSE = (EFreal - EFpred) n 2 n i i i=1 i i EFreal - EFpred AMSE = EFreal * EFpred
∑
where EFReali and EFpredi are the actual and the estimated efforts of the ith observation of the
validation set and n is the number of observations in the validation set.
Finally, in order to have an insight on the usefulness of a new method, its estimation accuracy is compared with the ones of other techniques. Several different benchmark methods are exploited to carry out such a comparison taking into account the above evaluation criteria. It is worth to noting that in the last years it has been widely recognized that the summary measures should be complemented by the analysis of boxplot of residuals and the comparisons among estimation techniques should be carried out by testing also the statistical significance of the absolute residuals. Such tests should be used to verify the following null hypothesis: “the considered populations of absolute residuals have identical distributions”, thus allowing us to assess if the differences exist due to chance alone or due to the fact that the samples are from different populations [72].
1.2 Search-Based Approaches for Effort Estimation
On the basis of the observations in the previous section, it is clear that the problem of identifying an estimation method on the basis of historical data can be seen as the problem of finding an estimation method that minimise the residual values, i.e. the difference between the actual and predicted efforts. Thus, it can be seen as an optimisation problem and search-based approaches could be exploited to address it. As a matter of fact, in the last years Genetic Algorithms (GAs), which are based on the evolutionary ideas of natural selection [51], have been defined to estimate software development effort (e.g., [16][38][82][118]). At the same time, some other approaches have been proposed aiming to improve some existing techniques by suitably combining them with GA (e.g., [11][19][78][125]).
In the following sections we describe the three search-based we employed in our work and in the next chapter we report on the most relevant empirical studies conducted to assess their effectiveness in estimating software development effort.
1.2.1 Hill Climbing
Hill climbing starts from a randomly chosen candidate solution. At each iteration, the elements of a set of ‘near neighbors’ to the current solution are considered. Just what constitutes a near neighbor is
problem specific, but typically neighbors are a ‘small mutation away’ from the current solution. A move is made to a neighbor that improves fitness.
There are two choices: In next ascent hill climbing, the move is made to the first neighbour found to have an improved fitness. In steepest ascent hill climbing, the entire neighborhood set is examined to find the neighbor that gives the greatest increase in fitness. If there is no fitter neighbor, then the search terminates and a (possibly local) maxima has been found. Figuratively speaking, a ‘hill’ in the search landscape close to the random starting point has been climbed. Clearly, the problem with the hill climbing approach is that the hill located by the algorithm may be a local maxima, and may be far poorer than a global maxima in the search space. For some landscapes, this is not a problem because repeatedly restarting the hill climb at a different locations may produce adequate results (this is known as multiple restart hill climbing). Despite the local maxima problem, hill climbing is a simple technique which is both easy to implement and surprisingly effective [57][103].
1.2.2 Tabu Search
Tabu Search (TS) is a meta-heuristics search algorithm that can be used for solving optimization problems. The method was proposed originally by Glover to overcome some limitations of Local Search (LS) heuristics [50]. Indeed, while classical LS heuristics at each iteration constructs from a current solution i a next solution j and checks whether j is worse than i to determine if the search has to be stopped, a TS optimization step consists in creating from a current solution i a set of solutions
N(i) (also called neighboring solutions) and selecting the best available one to continue the search.
In particular, TS usually starts with a random solution and applies local transformations (i.e., moves) to the current solution i to create N(i). When no improving neighboring solution exists, TS allows for a climbing move, i.e., a temporary worsening move can be performed. The search terminates when a stopping condition is met (e.g., a maximum number of iteration is reached). To determine whether a solution is worse (or better) than another an objective function is employed. In order to prevent loops and to guide the search far from already visited portions of the search space, some moves can be classified as tabu which means that are forbidden. The tabu moves can be stored in a list, named Tabu List, of fixed or variable length following a short-term (i.e., moves leading to already visited solutions are stored) or a long-term memory strategy (i.e., moves that have been performed several times are stored). Since tabu moves sometimes may prohibit attractive solution or
may lead to an overall stagnation of the searching process [50], the so called aspiration criteria can be used to revoke the tabu status of a move. A common aspiration criterion allows for a tabu move if it results in a solution which has an objective value better than the current solution.
To summarize, TS starting from a random solution, at each iteration explores a search space consisting of a set of moves. Such moves are often local transformations of the current solution and depend on the problem to be solved. Among these moves, the one that provides the best objective value and is not tabu or matches an aspiration criterion is selected to continue the search.
Thus, to tailor the TS meta-heuristics to a given problem we have to perform the following choices: - define a representation of possible solutions and the way to generate the initial one;
- define local transformations (i.e., moves) to be applied to the current solution for exploring the
neighbor solutions;
- choose a means to evaluate the neighborhood (i.e., an objective function), thus guiding the search in a suitable way;
- define the Tabu list, the aspiration criteria, and the termination criteria.
1.2.3 Genetic Algorithms
Basically Genetic Algorithms (GAs) simulate the evolution of natural systems, emphasising the principles of survival of the strongest, first set by Charles Darwin. As such they represent an intelligent exploitation of a random search within a defined search space to solve a problem. Genetic Algorithms were first pioneered by John Holland in the 1960s [59]. Then they have been extensively studied, experimented, and applied in many fields in the world of science and practice. It is important to note that GA not only provides an alternative method to solving problems, but, in several cases, it consistently outperforms other traditional methods [51][54].
In the computer implementation of a genetic algorithm, a crucial role is played by the solution representation. In general a solution for the problem being solved is represented by a fixed length binary string, which is called chromosome (in analogy with the biological equivalent). Each solution is evaluated using a fitness function that gives an indication of its goodness.
Despite of a number of variations, the elementary process of the genetic algorithm is the follows: (i) first a random initial population, i.e., a family of chromosome, is generated; (ii) then, a new population (i.e., generation) is created starting from the previous one by applying genetic operators
(e.g., crossover, mutation) to the best chromosomes (according to the fitness value); (iii) the second step is repeated until either the fitness of the best solution has converged or a certain number of generations have been made. The chromosome that gives the best solution in the final population is taken in order to define the best approximation to the optimum for the problem under investigation. The analysis of the process suggests that there are several key parameters that have to be determined for the application of GAs to any given optimisation problem [51][54]. In particular, the following issues have to be addressed:
1. defining the way for encoding a solution and the number of solutions (i.e. population size). 2. choosing the fitness function, to measure the goodness of a solution;
3. defining the combination of genetic operators, to explore the search space; 4. defining the stopping criteria.
CHAPTER 2: Literature Review
Some investigations have been carried out so far on the use of SB approaches for effort estimation. These studies have provided promising results that encourage further investigations. However, they can be considered preliminary studies. As a matter of fact, the capabilities of SB approaches have not been fully exploited and often the empirical analyses have not taken into account the more recent recommendations on how to carry out this kind of empirical assessment in the effort estimation and in the SBSE contexts [4][6][73][135], as detailed in the follow.
2.1 Empirical studies that investigated search based approaches to estimate
software development effort
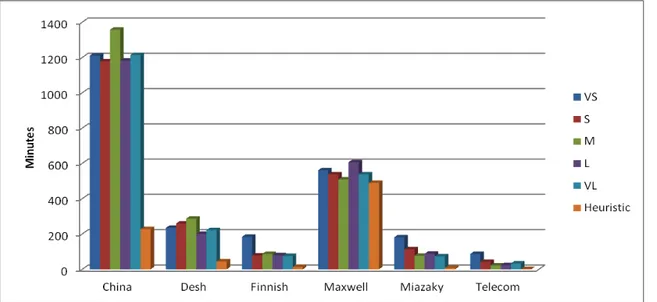
Table 1 summarizes the main aspects (e.g., employed technique, dataset, validation method, and evaluation criteria) of the studies carried out so far to assess SB approaches for building effort estimation models.
First of all we observe that all the previous studies [16][38][82][118] employed Genetic Programming (GP) and no attempts have been reported on the use of other SB techniques (e.g., the ones based on local-search), although they have many similarities but also distinguishing features. Moreover, each SB technique has specific design choices that may affect the performance of the method. As an example, for GP we have to choose the solution encoding, the fitness function (i.e., objective function), the strategy for creating the initial population, the operators for mating and survival selection, the crossover and mutation operators, and the stopping criteria. The choice of the objective function is common to all the SB techniques and represents one of the most critical step since such function guides the search towards suitable solutions. In the context of effort estimation this choice should be based on a measure of model accuracy. The studies carried out so far exploited two measures as fitness function, namely MMRE [16] [82] and MSE [38] [118]. However, several measures have been proposed to evaluate effort estimation accuracy and all of them could be exploited as objective function [53]. Nevertheless, the use of multiple criteria has not been investigated although there are recommendations on the use of several different accuracy measures
to carry out a more reliable evaluation of estimation models. The existing studies have neither fully investigated the impact of the other design choices such as the stopping criterion and its impact on the method convergence.
Table 1. Summary of the empirical studies that assessed SB approaches for building effort estimation models Reference Employed technique Case study Dataset Validation method Evaluation Criteria Benchmark Methods [16] GP with MMRE as fitness function Desharnais hold-out training set: 149 test set: 15 AMSE, MMRE, BMMRE, Pred(25) ANN, LR, CBR [38] GP with MSE as fitness function Academic projects hold-out training set: 30 test set: 16
MMRE, Pred(25) LR, ANN
[82] GP with MMRE as fitness function Finnish hold-out training set: 63 test set: 18 AMSE, MMRE BMMRE, Pred(25) ANN, LR, CBR [118] GP with MSE as fitness function ISBSG hold-out training test: 211 test set: 212 MMRE, Pred(25) Pred(50), MSE LR
Concerning the empirical analyses, all the studies employed only one dataset thus affecting their external validity. Moreover, a hold-out validation was applied, where the dataset is split into a training set used to build the estimation model and a test used to validate it. Unfortunately this procedure can be biased since the prediction performance may depend on how the dataset is split. Regarding the evaluation criteria only summary measures were employed: in particular MMRE and Pred(25) in all the case studies, and in some cases also MSE, AMSE, BMMRE, and Pred(50).
As for the benchmarks, useful to understand the actual effectiveness of the proposed approach, all the case studies employed several estimation methods, such as Linear Regression (LR) and Case-Base Reasoning (CBR). However, often there is a lack of details about their application. As for
example, studies that employed LR did not state if the underlying assumptions were verified [71] while this aspect is crucial for the internal validity of the empirical study.
Finally, little attention has been given by previous studies to the random variation in results due to the non-deterministic nature of SB techniques: indeed, very few executions were performed and often only results related to the best execution were reported, thus affecting the conclusion validity of these case studies.
In the following, we provide some more details for each proposal, highlighting the validation results.
Dolado [38] was the first to employ an evolutionary approach in order to automatically derive equations alternative to multiple linear regression. The aim was to compare the linear equations with those obtained automatically. The proposed algorithm was run a minimum of 15 times and each run had an initial population of 25 equations. Even if in each run the number of generation varied, the best results were obtained with three to five generations (as reported in the literature, usually more generations are used) and by using MSE as fitness function. As dataset, 46 projects developed by academic students (using Informix-4GL) were exploited through a hold-out validation. It is worth noting that the main goal of Dolado work was not the assessment of evolutionary algorithms but the validation of the component-based method for software sizing. However, he observed that the investigated algorithm provided similar or better values than regression equations.
Burgess and Lefley [16] performed a case study using the Desharnais dataset [33] to compare the use of genetic algorithms for estimating software development effort with other techniques, such as LR, CBR, and ANN (Artificial Neural Networks). The comparison was carried out with respect three dimensions, namely estimation accuracy, transparency, and ease of configuration. The settings they used for the employed genetic algorithm were: an initial population of 1000, 500 generations, 10 executions, and a fitness function designed to minimize MMRE. They compared the accuracy of the analysed estimation techniques by taking into account summary statistics based on MRE, namely MMRE, Pred(25), BMMRE, and AMSE.! Even if GP did not outperform the other techniques the results were promising and Burgess and Lefley suggested that a better set up of the evolutionary algorithm could improve the accuracy of the estimations. In particular they highlighted
that the use of a fitness function specifically tied to optimize one particular measure could degrade the other evaluation measures. As a matter of fact GA obtained the best estimates in terms of MMRE and the worst in terms of the other summary measures AMSE, Pred(25), BMMRE. As for the transparency of the solution, the authors highlighted that widely used techniques such as LR and CBR allowed the user to have a deep insight on the problem making explicit any information about the contribution of each variables in the prediction model and the degree of similarity to the target project respectively. GAs also produced transparent solution because the solution is an algebraic expression, while neural networks did not make explicit any information. As for the ease of configuration, i.e. the effort required to build the prediction system, LR and CBR were easy to use because are widely used method often well supported by tool [122]. Neural networks and GA approaches required instead some effort to choose appropriate values for control parameters because different settings may be lead to different results.
Successively, Shepperd and Lefley [82] also assessed the effectiveness of an evolutionary approach and compared it with several estimation techniques such as LR, ANN, and CBR. As for genetic algorithm setting, they applied the same choice of Burgess and Lefley[16], while a different dataset was exploited. This dataset is refereed as “Finnish Dataset” and included 407 observations and 90 features, obtained from many organizations. After a data analysis, a training set of 149 observations and a test set of 15 observations were used for a hold-out validation. Even if the results revealed that there was not a method that provided better estimations than the others, the evolutionary approach performed consistently well. In particular the proposed approach applied on general company wide data obtained the best results in terms of AMSE, MMRE and Pred(25), while on the company specific dataset the best results were achieved only in terms of MMRE and BMMRE. However, the authors again observed that the algorithm was quite hard to configure and companies have to weigh the complexity of the algorithm against the small increases in accuracy to decide whether to use it to estimate development effort [82].
An evolutionary computation method, named Grammar Guided Genetic Programming (GGGP), was proposed in [118] to overcome some limitations of GAs, with the aim of improving the estimation of the software development effort. Indeed they proposed to use grammars in order to impose
syntactical constraints and incorporate background knowledge aiming to guide the evolutionary process in finding optimal or near-optimal results. Data of software projects from ISBSG [64] database was used to build the estimation models using GGGP and LR. The fitness function was designed to minimize MSE, an initial population of 1000 was chosen, the maximum number of generations was 200, and the number of executions was 5. The models were built and validated performing a hold-out validation with training and test sets of the same size. The results revealed that GPPP performed better than Linear Regression on all the exploited evaluation criteria, not just on the MSE, the criterion that was used as fitness function.
2.2 Empirical studies that investigated search based approaches to improve the
effectiveness of existing estimation techniques
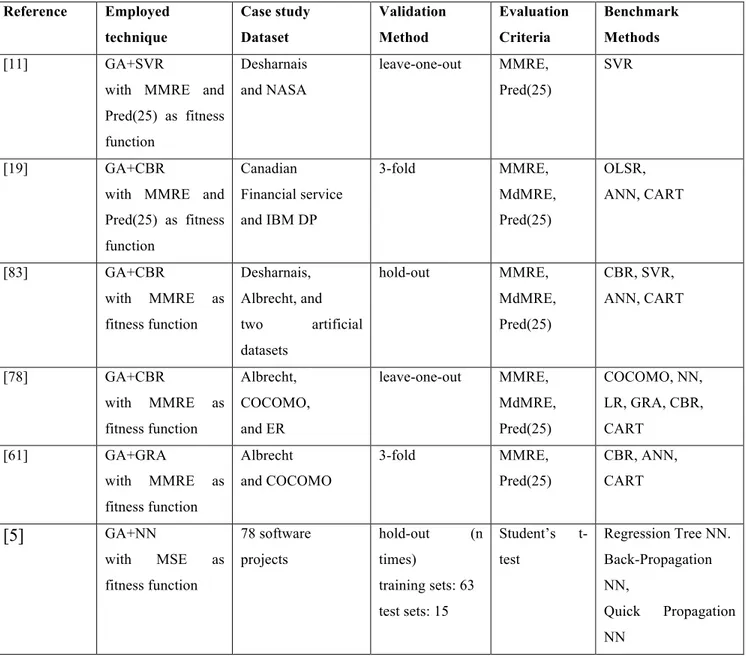
Despite some efforts have been made to improve the estimation performance of existing estimation techniques combining them with genetic algorithms, many of the above limitations can be found also in the studies that assessed the use of SB approaches to improve existing effort estimation techniques [5][11][19][61][78][83]. As we can observe from Table 2, all the studies exploited Genetic Algorithms.
In particular, three of the six proposed approaches combines GA with CBR, the other ones combine GA with less frequently used techniques, such as Artificial Neural Networks (ANN), Support Vector Regression (SVR) and Gray Relational Analysis (GRA). To evaluate the goodness of a solution two settings exploited a combination of MMRE and Pred(25) as fitness function and three settings used a fitness function based only on MMRE. Only one setting used MSE values as fitness function. As for the empirical studies carried out to assess the above proposals, we can observe that all the case studies employed industrial dataset and several validation methods were applied, such as k-fold cross-validation [19][61][125], leave-one-out cross-validation [11][78] and hold-out validation [83]. Almost all case studies employed the summary measures MMRE, MdMRE, and Pred(25) to evaluate the accuracy of the obtained estimates. Only one case study used a statistical significance test to evaluate the residuals, i.e. the difference between actual and predicted effort. Several estimation methods are employed as benchmark in each case study, ranging from widely used
techniques, such as COCOMO, CBR, CART, and LR, to less frequently used techniques (e.g. GRA, SVR, ANN and its variants).
In the following we provide a brief description for each proposal.
Table 2. Summary of the empirical studies that assessed the use of SB approaches in combination with existing estimation methods
Reference Employed technique Case study Dataset Validation Method Evaluation Criteria Benchmark Methods [11] GA+SVR
with MMRE and Pred(25) as fitness function Desharnais and NASA leave-one-out MMRE, Pred(25) SVR [19] GA+CBR
with MMRE and Pred(25) as fitness function Canadian Financial service and IBM DP 3-fold MMRE, MdMRE, Pred(25) OLSR, ANN, CART [83] GA+CBR with MMRE as fitness function Desharnais, Albrecht, and two artificial datasets hold-out MMRE, MdMRE, Pred(25) CBR, SVR, ANN, CART [78] GA+CBR with MMRE as fitness function Albrecht, COCOMO, and ER leave-one-out MMRE, MdMRE, Pred(25) COCOMO, NN, LR, GRA, CBR, CART [61] GA+GRA with MMRE as fitness function Albrecht and COCOMO 3-fold MMRE, Pred(25) CBR, ANN, CART [5] GA+NN with MSE as fitness function 78 software projects hold-out (n times) training sets: 63 test sets: 15 Student’s t-test Regression Tree NN. Back-Propagation NN, Quick Propagation NN
The first attempt to combine evolutionary approaches with an existing effort estimation technique was made by Shukla [125] applying genetic algorithms to Neural Networks (NN) predictor (namely, neuro-genetic approach, GANN) in order to improve its estimation capability. In particular, in the proposed approach the role played by NN was learning the correlation that exists between project features and actual effort and also learning any existing correlations among the predictor variables, while the GA had to minimize MSE values. The proposed case study exploited as dataset information from 78 software projects, obtained from the combination of the COCOMO [9] and the Kemerer [68] datasets and a statistical significance test was employed to assess whether the neuro-genetic approach provided significant improvement respect of common used AI-oriented methods [127][111][108]. In particular the employed Student’s t-test revealed that the mean prediction error for GANN is less to that for CARTX and less to that for Quick Propagation trained NN [108]. These results showed that GANN obtained significantly better prediction than CARTX and QPNN. It is worth to nothing that the authors highlighted that the employed chromosome encoding played a crucial role in the NN predictor system and that a number of experiments were needed to determine a suitable choose.
Recently, Chiu and Huang applied GA to another AI-based method such Case-Based Reasoning obtaining interesting results [19]. In particular, GA was adopted to adjust the reused effort obtained by considering similarity distances between pairs of software projects. As for the application of CBR, three similarity distances were considered, Euclidean, Minkowski, and Manhattan distances, and a linear equation was used to adjust the reused effort. As for the application of GA, the population included 10*V chromosomes and the generation was stopped after 1000*V trials, or when the best results did not change after 100*V trials, where V is the number of variables that GA explored. The performed case study exploited two industrial datasets [1][85] of 23 and 21 observations respectively and the results based on the MMRE, Pred(25) and MdMRE evaluation criteria revealed that the adjustment of the reused effort obtained by applying GA improved the estimations of CBR even if the achieved accuracy did not satisfy threshold proposed by Conte et al. [22]. As a matter of fact applying the proposed approach on the IBM DP service [85] dataset an improvement of 58% and 126% is reached in terms of MMRE and Pred(25) respectively, but the obtained values were far enough from the proposed threshold (i.e. MMRE=0.52, Pred(25)=0.43).
Furthermore, the proposed approaches was also comparable with the models obtained by applying traditional techniques such as ordinary least square regression (OLS), CART and ANN, on both the exploited datasets.
!
In [83] it was also proposed a combination of evolutionary approach with CBR aiming at exploiting genetic algorithms to simultaneously optimize the selection of the feature weights and projects. The proposed GA worked on a population of 10*V chromosomes and explored the solution space to minimize MMRE value by considering 1000*V evolutions, where V is the number of variables. As for CBR method the authors exploited several combinations of similarity measures, K value, and solution functions. The performed case study employed a hold-out validation on two industrial datasets [3][33] and two artificial datasets. The obtained estimates were compared with those achieved by applying only CBR and the results showed that the use of GA can provide significantly better estimations even if there was no clear conclusion about the influence of similarity and solution functions on the method performance. It is worth to nothing that on the Desharnais [33] [48] and Albrecht [3] dataset the accuracies of the obtained estimates did not satisfy the threshold proposed by Conte et al. [22], while this was true for the results obtained applying the proposed approach on the two artificial datasets.
GA was also used to improve the accuracy of an effort estimation model built by combining social choice and analogy-based approaches [78]. In particular, voting rules were used to rank projects determining similar projects and GA was employed to find suitable weights to be associated to the project attributes. To this end, a weight between 0 and 99 was assigned to each attribute and GA started with a population of 2000 random weight vectors. By exploiting error based on summary measures, the proposed GA searched through 1000 generations an optimal assignment for the weights. The validation of the obtained weighted model was performed with a leave-one-out approach by considering as dataset those used in [3], [8], and [9]. The accuracy of the proposed model was compared with that obtained by applying other estimation techniques, such as LR, ANN, CART, COCOMO, and GRA. The results revealed that the proposed approach provided the best value for Pred(25) but the worst MMRE value with respect to the other techniques.
Finally, we report on two case studies carried out to investigate the combination of GA with techniques not frequently employed for effort estimation. Braga et al. [11] exploited the use of GAs with Support Vector Regression (SVR) [28], a machine learning techniques based on statistical learning theory, building a regression model employed to predict effort of novel projects on the basis of historical data. In particular they exploited a GA previously used to solve classification problems [62] to address the problems of feature selection and SVR [28] parameters optimization aiming to obtain better software effort estimations. The proposed GA started with a population of 500 chromosomes and used roulette wheel selection, two-point crossover, mutation, and elitism replacement to create 25 generations. A combination of MMRE and Pred(25) is used as fitness function. To evaluate the proposed method they used two datasets, namely Desharnais [33] and NASA [107][124], and performed 10 runs for each dataset. The results showed that the proposed GA-based approach was able to improve the performance of SVR and outperformed some recent results reported in the literature [10][12][107][124]. It is worth nothing to note that the results obtained applying the proposed approach on NASA dataset satisfied the threshold proposed by Conte et al. [22]. On the other hand applying the same method on Desharnais dataset the obtained MMRE value is not less than 0.25, while the Pred(25) is greater than 0.75.
Chiu and Huang in [61] integrated a GA to the Grey Relational Analysis (GRA) [32] method to build a formal software estimation method. Since GRA is a problem-solving method that is used to deal with similarity measures of complex relations, the GA was adopted in the GRA learning process to find the best fit of weights for each software effort driver in the similarity measures. To this end the weights of each effort driver were encoded in a chromosome and the MMRE was the value to be optimized. A case study was performed by exploiting the COCOMO [9] and the Albrecht [3] datasets and the experimental results showed that when GA was applied to the former dataset the accuracies of the obtained estimates outperformed those obtained using CBR, CART, and ANN, while on Albrecht dataset all the exploited methods achieved a comparable accuracy. In both cases the accuracy obtained applying the proposed approach did not satisfy the thresholds proposed by Conte et al. [22].
CHAPTER 3: Using Search-based Approaches for Building Effort
Estimation Models
In the last decades, several methods have been proposed to estimate software development effort, among them data-driven methods exploit data from past projects to estimate the effort for a new project under development [14][15]. These data consist of information about some relevant factors (named cost drivers) and the effort actually spent to develop the projects. Usually a data-driven method tries to explain the relation between effort and cost drivers building an estimation model (equation) that is used to estimate the effort for a new project. Linear (StepWise) Regression [13] is a well known and widely used data-driven approach. Also search-based methods have been suggested to build effort estimation models [54]. The suggestion is based on the observation that, among possible estimation models, we have to identify the best one, i.e., the one providing the most accurate estimates. Thus, the effort estimation problem can be formulated as an optimization problem that can be addressed by search-based methods. Indeed, these meta-heuristics are able to find optimal or near optimal solutions to problems characterized by large space, using an objective function that gives an indication of how a solution is suitable for the problem under investigation. Examples of search-based methods are Simulated Annealing (SA), Tabu Search (TS), Hill Climbing (HC), Genetic Algorithms (GA) and Genetic Programming (GP), which differ under several aspects including the kind of employed search (local or global).
Some investigations have been reported in the literature on the use of search-based techniques for effort estimation. They showed some potentialities of these metaheuristics to build accurate estimation models as well as some difficulties to adopt them mainly related to the interpretation of solutions and the choice of a suitable setting. Nevertheless those previous studies mainly focused on Genetic Programming, a global search technique inspired by biological evolution [16][38][82][118]. Local search approaches, e.g., TS, have been investigated only in few preliminary studies [42][44]. In this paper we deepen the analysis of these metaheuristics from the point of view of their settings and the empirical assessment of their predictive capability. As for the setting, differently from previous works where it was adopted a time consuming trial-and-error process to set search-based approach parameters (e.g., number of moves and iterations for TS), in the present study we
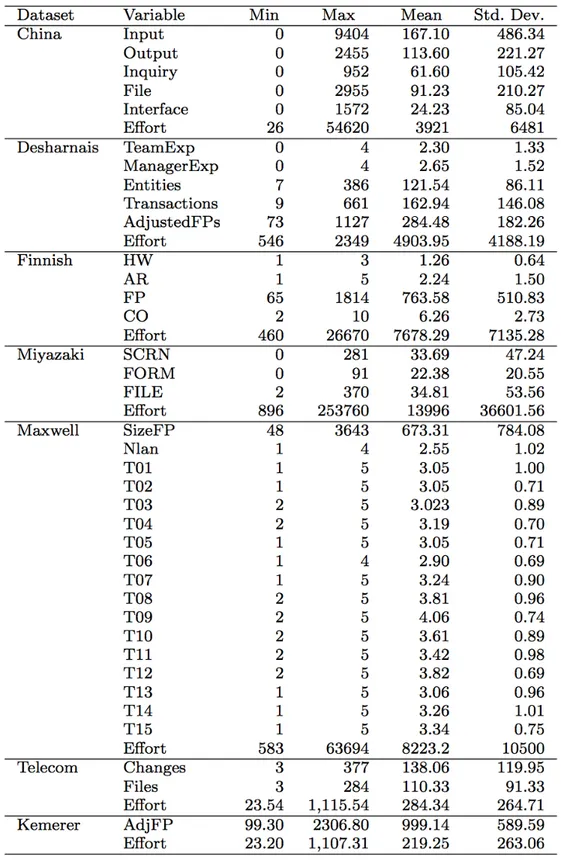
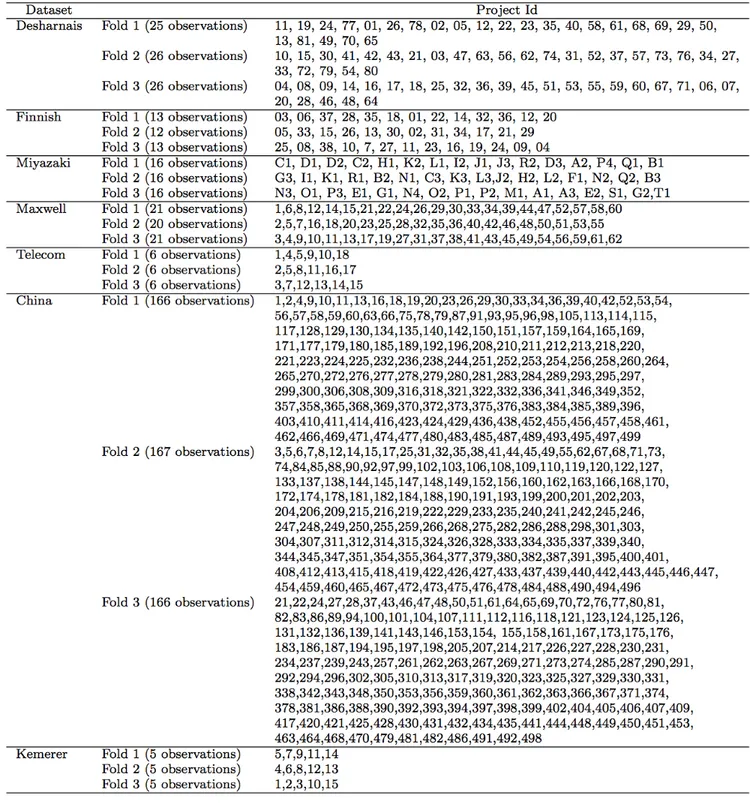
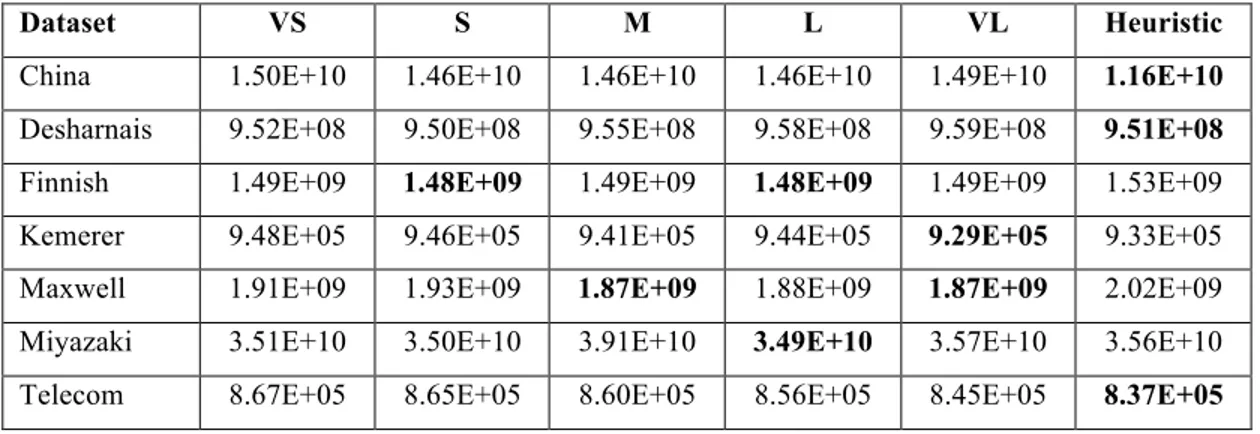
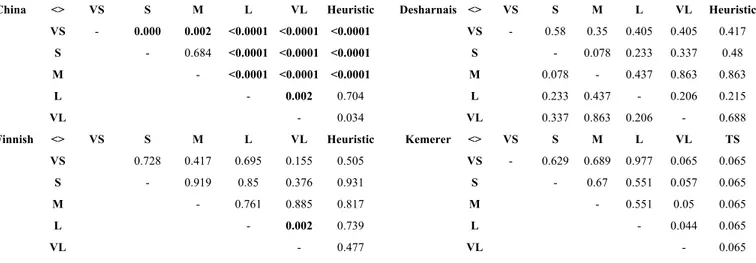
employed an heuristics which relates those parameters to the problem size and assessed its effectiveness by comparing it with five configurations varying for the number of solutions and iterations exploited. Moreover, we employed as objective function the sum of squared residuals (SSR) (also named sum of squared errors of prediction (SSE)) since we compared the results achieved with GP, TS, and HC with Linear (StepWise) regression which exploits SSR to fit data. Regarding the empirical assessment, let us observe that almost all previous studies employed only one dataset with a hold-out validation thus affecting both external and internal validity. In the present work, we assessed three search-based approaches, namely HC, TS, and GP, exploiting seven publicly available datasets (i.e., China, Desharnais, Finnish, Miyazaki, Kemerer, Maxweel, and Telecom) and performing a 3-fold cross validation. These datasets represent an interesting sample of industrial software projects containing both single- and cross-company data which vary for size, application domains, and project characteristics. Moreover, to assess the effectiveness of the three approaches we first compared them with respect to different baseline benchmarks (i.e., random search, mean and median of effort about past projects) since if they do not outperform the results achieved with simpler methods it cannot be transferred to industry [97]. Then, aiming to verify if HC, TS, and GP provide at least comparable results with respect to estimation techniques widely used in the literature and in industry, we considered as benchmark Manual StepWise Regression (MSWR).
The estimates obtained with the employed techniques were evaluated and compared by exploiting SSR and statistical tests on squared residuals [72].
The remainder of the chapter is organized as follows. In Section 3.1 we provide a description of the three applied search-based approaches, showing the employed setting. In Section 3.2 we describe the experimental method we exploited to assess and compare the prediction accuracy of HC, TS, and GP. The results of the empirical analysis are reported and discussed in Section 3.3, while Section 3.4 discusses the factors that can bias the validity of empirical studies.
3.1 Designing Search-based Approaches for building effort estimation models
Search-based methods are a set of algorithms that search for optimal or near optimal solutions to problems characterized by large space, using an objective function that indicates how a solution is suitable for the problem under investigation.
The idea of exploiting these methods to estimate software development effort is based on the observation that the effort estimation problem can be formulated as an optimization problem. As a matter of fact, among possible estimation models (equations), we have to identify the one that leads to the best predictions.
In order to have a better insight on search-based methods in our analysis we exploited three methods, HC, TS, and GP that have complementary characteristics. Indeed, HC and TS are local search-based methods, while GP follows a global search. This means that HC and TS are more exploitation oriented being designed to intensify the search in local regions, on the contrary GP is more exploration oriented allowing for a better diversification in the whole search space.
Some background on these three methods have been provided in Chapter 1, while in this section we present how we designed the HC, TS and GP for tying them to software development effort estimation.
In the context of effort estimation, a solution consists of an estimation model described by an equation that combines several factors, i.e.,
Effort = c1 op1 f1 op2 ... op2n−2 cn op2n−1 fn op2n C (1)
where fi represents the value of the i-th project feature and ci is its coefficient, C represents a
constant, while opi ∈{+, −, ·, ln, ^} represents the i-th mathematical operator of the model. It is
worth noting that the equations feasible for the effort estimation problem are those providing positive value for Effort.
The fitness function guides the search for the best estimation model. In the context of effort estimation such function should be able to determine whether a model leads to better predictions than another. In the literature several accuracy measures have been proposed to compare effort estimation models and each of them could be employed as objective function. In previous works [44][45], different designs have been experimented employing different accuracy measures revealing there was no significant difference in the results achieved with different objective functions except for Mean MRE [22] and Mean of EMRE [72] which should be avoided since they provided significantly worse predictions than other functions. Thus, in this work we employ SSR as objective function that is at the basis of MSWR, allowing a fair comparison with this benchmark. The same number of solutions and iterations characterizes all the SB approaches we employed. Let us observe that a suitable setting is usually obtained via a trial-and-error process for each new problem to be addressed. As a matter of fact, in previous work [42][44] the number of solutions and
iterations was empirically determined carrying out a validation process with different values for these parameters and selecting the one providing the best results. However, this practice is time consuming and it has to be repeated every time new data is used, thus limiting the adoption of such technique and in general of search-based approaches by practitioners. To overcome this limitation in the present paper we employed a heuristics originally suggested in [40] to set population size and generation number of a genetic algorithm employed for software clustering. The same heuristics has been successively adopted for setting GA in the context of effort estimation [19][61] and we employed it in this work also with HC and TS. In particular, given a project dataset containing V features, we set to 10V the number of solutions (i.e., neighbors for TS and HC), to V the Tabu List size, and stop the search after 1000V iterations or if the objective value of the best solution does not change in the last 100V iterations. Thus such heuristics allowed us to adapt the search process to the size of the problem under investigation.
Finally, let us observe that since search-based approaches do not give the same solution each time it is executed, we performed 30 runs and we retained as final results the average SSR values obtained in the 30 runs.
3.1.1 Setting of Hill Climbing and Tabu Search
As for the move employed in HC and TS to obtain a neighboring solution we applied the following steps to the current solution S:
• change each coefficient ci of S with probability 1/2. The new coefficient ci is calculated as
follows: ci' = f(ci , r) where f ∈ {+,-,*,/,^,ln} and r is randomly chosen in the range ]0,1];
• change the constant factor C of S with probability 1/2, in the same way coefficients are changed;
• change each arithmetic operator opi of S with probability 1/2.
As for the design of TS, we employed as Tabu List a short-term strategy to store the moves leading to the most recent already visited solutions and the following aspiration criteria: a tabu move is allowed only if it results in a solution with an objective function value better than the one of the best solution reached so far.
3.1.2 Setting of Genetic Programming
The initial population is generated by building random trees of fixed depth. As for the evolutionary process we employed two widely used selection operators, i.e., roulette wheel selector and tournament selector [80], whereas the crossover and mutation operators are specific for our solution encoding. In particular, we used the roulette wheel selector to choose the individuals for reproduction, while we employed the tournament selector to determine the individuals that are included in the next generation (i.e., survivals). The former assigns a roulette slice to each chromosome according to its fitness value. In this way, even if candidate solutions with a higher fitness have more chance to be selected, there is still a chance that they may be not. On the contrary, using the tournament selector only the best n solutions (usually n in [1, 10]) are copied straight into the next generation. Crossover and mutation operators were defined to preserve well-formed equations in all offspring. To this end, we used a single point crossover which randomly selects in each tree a node placed at the same depth and swaps the subtrees corresponding to the selected point. Since the two trees are cut at the same point, the trees resulting after the swapping have the same depth as compared to those of parent trees. Concerning the mutation, we employed an operator that selects a node of the tree and randomly changes the associated value. The mutation can affect internal node (i.e., operators) or leaves (i.e., coefficients) of the tree. In particular, when the mutation involves internal node, a new operator opi' in {{+,-,*,^,ln} - opi} is randomly generated
and assigned to the node, while if the mutation involves a leaf a new coefficient ci' in R is assigned
to the node. It is worth noting that the employed mutation preserves the syntactic structure of the equation. Crossover and mutation rate were fixed to 0.5 and 0.1, respectively.
3.2 Empirical Study Design
In this section we present the design of the empirical study we carried out to assess the effectiveness of the proposed HC, TS, and GP for estimating software development effort. In particular the research questions of our study can be outlined as follows:
RQ1 Are there any differences in the accuracy of the predictions achieved with different settings?
RQ2 Is it possible to identify a suitable heuristics to configure the considered search-based approaches?
RQ3 Are there any differences in the accuracy of the predictions achieved using different search-based approaches?
RQ4 Do the considered search-based approaches provide significantly better prediction accuracy than those obtained by employing baseline benchmarks?
RQ5 Do the considered search-based approaches provide prediction accuracy at least comparable with those provided by MSWR?
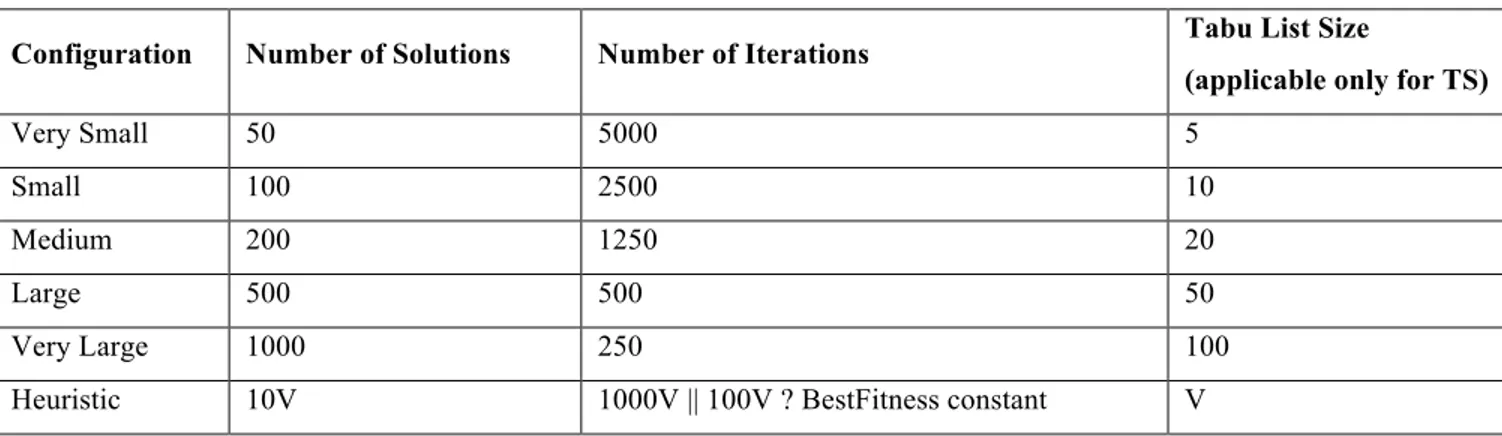
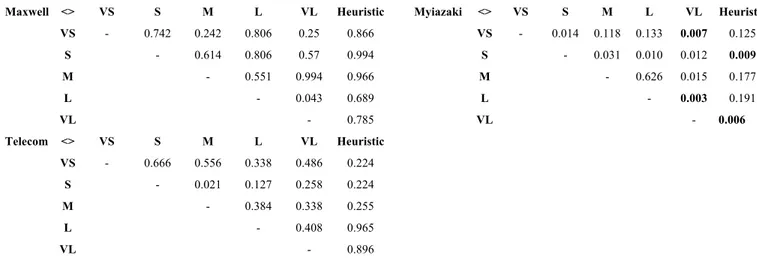
The fact that an overlooked aspect of research on computational search algorithms lies in the selection and tuning of the algorithmic parameters motivated us to investigate RQ1 and RQ2. Let us observe that a suitable setting is usually obtained via a trial-and-error process for each new problem to be addressed. As a matter of fact, in previous work (see e.g., [16][38]) the number of moves and iterations was empirically determined carrying out a validation process with different values for these parameters and selecting the one providing the best results. However, this practice is time consuming and it has to be repeated every time new data is used, thus limiting the adoption of such technique and in general of search-based approaches by practitioners. To overcome this limitation in the present paper we employed a heuristics originally suggested in [40] to set population size and generation number of a genetic algorithm employed for software clustering. The same heuristics was successively adopted for setting genetic algorithms in the context of effort estimation [45][62][61] and in this work we extended it to work also with TS. In particular, given a project dataset containing V features, we set to 10V the number of iterations, to V the Tabu List size (in case of TS), and stop the search after 1000V iterations or if the objective value of the best solution does not change in the last 100V iterations (in case of GP and TS). Thus such heuristics allowed us to adapt the search process to the size of the problem under investigation. To assess the effectiveness of the proposed heuristics we compared it with respect to the use of five different configurations characterized by very small, small, medium, large, and very large values for solutions as detailed in Table 3. All configurations were allowed an identical budget of objective function evaluations (250,000), thereby ensuring that all require the same computational effort, though they may differ in parameter settings. On the other hand the “search budget” required by the heuristics is at most 10V*100V evaluations due to the two different stopping criteria employed. In particular we answered to the following questions:
RQ1a Are there any differences in the accuracy of the predictions achieved by HC configured with the settings VS, S, M, L, VL?
RQ1b Are there any differences in the accuracy of the predictions achieved by TS configured with the settings VS, S, M, L, VL?
RQ1c Are there any differences in the accuracy of the predictions achieved by GP configured with the settings VS, S, M, L, VL?
RQ2a Is the prediction accuracy obtained with the Heuristics based setting comparable with those achieved with the other settings for HC?
RQ2b Is the prediction accuracy obtained with the Heuristics based setting comparable with those achieved with the other settings for TS?
RQ2c Is the prediction accuracy obtained with the Heuristics based setting comparable with those achieved with the other settings for GP?
Table 3. Settings employed for HC, TS, and GP
Configuration Number of Solutions Number of Iterations Tabu List Size
(applicable only for TS)
Very Small 50 5000 5
Small 100 2500 10
Medium 200 1250 20
Large 500 500 50
Very Large 1000 250 100
Heuristic 10V 1000V || 100V ? BestFitness constant V
RQ3 has been motivated by the fact that all previous work [16][38][82][118] exploited Genetic Programming (GP) to build effort estimation models. However, there exist different search-based methods that have complementary characteristics. In order to have a better insight on search-based methods in our analysis we compared three search-based methods, namely HC, TS, and GP. Indeed, HC and TS are local search-based methods, thus are more exploitation oriented, while GP follows a global search being more exploration oriented. In particular we answered to the following questions:
RQ3a Is the prediction accuracy provided by TS superior to the one provided by HC? RQ3b Is the prediction accuracy provided by GP superior to the one provided by HC?
RQ3c Is the prediction accuracy provided by TS superior to the one provided by GP?
Once we assessed whether there are differences in using different search-based techniques, we compared their performance with respect to the ones of different baseline benchmarks (RQ3), since if they do not outperform the results achieved with these baseline methods they cannot be transferred to industry [97]. To this end we considered the following baseline techniques:
• Random: the same number of solutions investigated by the three search-based approaches was generated in a totally random fashion and the best one among them was selected according to the same criterion employed for HC, TS, and GP. This is a natural ``sanity check'' when using meta-heuristics search techniques.
• Mean (Median) Effort: the mean (median) of the past project efforts is used as predicted effort for a new project. These are popular and simple baseline benchmarks for effort estimation techniques.
In particular, to address RQ4 we answered to the following questions:
RQ4a Is the prediction accuracy provided by HC superior to the one provided by Random, Mean Effort, and Median Effort?
RQ4b Is the prediction accuracy provided by TS superior to the one provided by Random, Mean Effort, and Median Effort?
RQ4c Is the prediction accuracy provided by GP superior to the one provided by Random, Mean Effort, and Median Effort?
Once we verified the usefulness of the employed search-based techniques comparing them with baseline benchmarks, we assessed if they are also effective. Indeed, RQ5 aimed to verify if the search-based approaches that have been revealed superior to the baseline benchmarks provide prediction accuracy at least comparable with the one of the technique widely used in the literature and in industry, namely Manual StepWise Regression (MSWR). MSWR is a regression technique proposed by Mendes and Kitchenham [97] whereby an equation (i.e., the prediction model) is built and represents the relationship between independent (e.g., Team Experience, Function Points) and dependent variables (e.g., effort expressed in person/hours). This technique builds the prediction model by adding, at each stage, the independent variable with the highest association to the dependent variable, taking into account all variables currently in the model. It aims to find the set of independent variables (predictors) that best explain the variation in the dependent variable
![Table 1. Summary of the empirical studies that assessed SB approaches for building effort estimation models Reference Employed technique Case study Dataset Validation method Evaluation Criteria Benchmark Methods [16] GP with MMRE](https://thumb-eu.123doks.com/thumbv2/123dokorg/7216215.76938/17.918.115.831.360.758/approaches-estimation-reference-employed-validation-evaluation-criteria-benchmark.webp)