Production of micro and
nanoparticles of thermolabile
compounds using supercritical
assisted atomization
Omaggio a:
Riccardo Dalisi
Unione Europea UNIVERSITÀ DEGLI STUDI DI SALERNO
FONDO SOCIALE EUROPEO
Programma Operativo Nazionale 2007/2013“Ricerca Scientifica, Sviluppo Tecnologico, Alta Formazione” Regioni dell’Obiettivo 1 – Misura III.4
“Formazione superiore ed universitaria”
Department of Industrial Engineering
Ph.D. Course in:
Scienza e tecnologie per l’industria Chimica,
Farmaceutica ed Alimentare
(XI Cycle-New Series)
PRODUCTION OF MICRO AND
NANOPARTICLES OF THERMOLABILE
COMPOUNDS USING SUPERCRITICAL
ASSISTED ATOMIZATION
Supervisor
Ph.D. student
Prof. Ernesto Reverchon
Sara Liparoti
Dr. Ing. Giuseppe Caputo
Scientific Referees
Dr. Ing Renata Adami
Dr. Ing. Andreas Braeuer
Ph.D. Course Coordinator
Prof. Paolo Ciambelli
I would like to thank here all the kind people around me who made this thesis possible with their help and support.
First of all, I am extremely grateful to my supervisor, Prof. Ernesto Reverchon, for giving me the opportunity to be part of his “Supercritical Fluid” team at the University of Salerno and for providing a stimulating and fun environment for me in which to learn and grow as a student and a researcher. His enthusiasm and passion for research, guidance and support, understanding and patience, added considerably to my experience.
My acknowledgements are also for Dr. Giuseppe Caputo for his valid suggestions.
I am grateful to Andreas Braeuer for his availability to take part in my scientific committee, for kindly giving me the opportunity to join his research group in Erlangen. His supervision with his expertise and valuable advices were precious for me. I want, also, to thank my mates in SAOT, especially Matthias „Bud Spencer” and Robert, who supported me during thesis drafting.
A special thank is for Renata Adami, who patiently introduced me in SAA process and in laser based technique. I appreciate her suggestions! She will be always „Mamma Chioccia” for me.
Thanks also to Supercritical Fluid group: Mariarosa, for her effective suggestions and her availability, Iolanda, Stefano, Giovanna, Marco, Andrea, Peppe, Lucia, Valentina, Francesco Cice, Massimiliano, Emilia, Titti and Paola. Moreover I want to mention my good Spanish friend Luis, who is known as Gigino. I always remember that I have “Vivere Piano…”, even if it is very difficult for me! Thank you Islane, my miss-stress!.
Many thanks to my friend Francesco Glielmi. He kindly supported me during the University period. We have been the nice couple „Sandra e Raimondo”! I hope that our friendship will be forever.
I would like to thank the person who divided with me this „PhD adventure”: Roberta Campardelli. We have shared everything, the desk, the computer and, sometimes the „brain”. You are a good friend for me, a sort of „wife”!
Special thanks also to my friends outside the University: Davide, Nadia, Niky, Dino, Rosanna, Ilaria, Antonio and Pietro. I am very lucky to have these good friends.
How to forget my parents and my brother, with Lidia. My family is always my landmark!
Very special Thanks to my husband Francesco. He is very precious for me. He supported and endured me in these years. I don’t know how he could do this! You are my best choose! Thank you so much!
Pubblication list
International joirnal
Renata Adami, Sara Liparoti, Ernesto Reverchon(2011). A new supercritical assisted atomization configuration, for the micronization of thermolabile compounds. CHEMICAL ENGINEERING JOURNAL. Vol. 173. Pag.55-61 ISSN:1385-8947.
Renata Adami, Sara Liparoti, Lorella Izzo, Daniela Pappalardo, Ernesto Reverchon (2012) “PLA–PEG copolymers micronization by supercritical assisted atomization” THE JOURNAL OF SUPERCRITICAL FLUIDS. Vol 72. Pag 15-21.
Sara Liparoti, Renata Adami, Ernesto Reverchon (2012) “PEG micronization by supercritical assisted atomization, operated under reduced pressure” THE JOURNAL OF SUPERCRITICAL FLUIDS. Vol 72. Pag. 46-51.
Giuseppe Caputo, Sara Liparoti, Renata Adami, and Ernesto Reverchon. (2012) “Use of Supercritical CO2 and N2 as Dissolved Gases for the Atomization of Ethanol and Water” INDUSTRIAL & ENGINEERING CHEMISTRY RESEARCH. Vol 51 Pag. 11803−11808.
Rita P. Aquino, Giulia Auriemma, Teresa Mencherini, Paola Russo, Amalia Porta, Renata Adami, Sara Liparoti, Giovanna Della Porta, Ernesto Reverchon, Pasquale Del Gaudio. (2012) “Design and production of gentamicin/dextrans microparticles by supercritical assisted atomisation for the treatment of wound bacterial infections” INTERNATIONAL JOURNAL OF PHARMACEUTICS.
http://dx.doi.org/10.1016/j.ijpharm.2012.07.074
L.M. Navarro, S.Liparoti, J.L. Marqués, G. Della Porta, E. Reverchon, A.M. Mainar, J.S. Urieta, R. Adami. “Rotenone Encapsulation in Biopolymers by Supercritical Assisted Atomization”, submetted to BIOTECHNOLOGY AND BIOENGINEERING
Proceeding
Sara Liparoti, Renata Adami, Ernesto Reverchon (2011). Supercritical assisted atomization under reduced pressure: formation of PEG microspheres loaded with lipophilic vitamins. In: 13th European meeting on supercritical fluids The Hague 9th-13th October 2011 Maaike KROON, Cor PETERS,
Caroline van Os-ROVERS, Pleunie SMITS, Geert-Jan WITKAMP, Jaap van SPROSEN, Maaike van ROOSMALEN Pag.1-6 ISBN:9782905267771
Liparoti, S.; Adami, R.; Reverchon, E(2010). Production of microspheres of Bovine Serum Albumin by supercritical assisted atomization at reduced pressure. In: 9th Confer. on Supercrit. Fluids an their Applic. Sorrento 5-8 Sept E. Reverchon Vol.1, Pag.223-228 ISBN:9788878970403
Adami, R; Liparoti, S.; Della Porta, G.; Del Gaudio, P.; Auriemma, G.; Prota, R.P.; Aquino, R.; Reverchon, E.(2010). Gentamicin loaded albumin/pectine microspheres for drug release obtained by SAA. Sorrento 5-8 Sept. E. Reverchon Vol.1, Pag.193-196 ISBN:975-85-85-875-8970403
Giuseppe Caputo, Sara Liparoti, Renata Adami, Libero Sesti Osséo(2011). Use of supercritical co2 as dissolved gas for the atomization of ethanol”. In: 12th International Conference on MULTIPHASE FLOW IN INDUSTRIAL PLANTS ischia (NA) 21-23 settembre 2011 ANIMP Pag.1-8 ISBN:9788889677223
Sara Liparoti, Renata Adami, Ernesto Reverchon (2012) “Supercritical Assisted Atomization: effect of operative conditions on PVP particle size and morphology” 10th International Symposium on Supercritical Fluids- May 13-16- San Francisco
Contents
Chapter I ... 1
General statement on atomization ... 1
I.1. Drop and spray formation ... 1
I.2. Supercritical fluid based processes ... 4
I.3. CO2-Assisted Nebulization with a Bubble Dryer (CAN-BD) ... 4
I.4. Supercritical Assisted Atomization (SAA) ... 5
Chapter II ... 9
Aim of the work ... 9
Chapter III ... 11
Analytical methods ... 11
III.1. Analysis on morphology ... 11
III.1.1. Scanning electron microscope field emission ... 11
III.1.2. Particle size analysis ... 11
III.2. Solid state analysis ... 12
III.2.1. X-Ray Diffractometry ... 12
III.2.2. Differential scanning calorimeter (DSC) ... 12
III.3. Stability and denaturation analysis ... 12
III.3.1. Protein stability: FTIR... 12
III.3.2. Dissolution rate test ... 12
III.3.3. Solvent residue analysis ... 13
III.4. Structural analysis ... 13
III.4.1. H and C NMR analysis ... 13
III.4.2. Gel Permeation Chromatography (GPC) ... 13
III.4.3. High-performance liquid chromatography (HPLC) ... 13
Chapter IV ... 15
Vapour liquid equilibria measurements ... 15
IV.1. Raman Scattering ... 16
IV.2. Description of Raman spectroscopy ... 18
IV.3. Concentration measurements ... 20
IV.4. Apparatus and methods ... 21
IV.4.1. Variable volume high pressure cell. ... 22
IV.5. Results and discussion ... 23
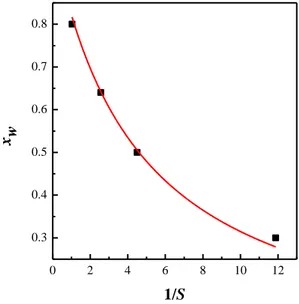
IV.5.1 Calibration curve ... 23
IV.6. Equilibria CO2-acetone. ... 27
IV.7. Equilibria CO2-acetone-water. ... 28
IV.8. Conclusions ... 30
Chapter V ... 33
Experimental study on atomization mechanism... 33
V.1 Supercritical dissolved gas atomization ... 34
V.2. Results ... 37
V.2.1 Atomization of ethanol and water using CO2 ... 39
V.3 Mechanism of atomization ... 44
V.4. Conclusions ... 47
Chapter VI ... 49
Effect of the solvent on particle size ... 49
VI.1 Material and methods ... 49
VI.2 Effect of solvents ... 50
Water ... 50
Mixture water-acetone ... 53
Ethanol ... 56
VI.3. Conclusions ... 61
Chapter VII ... 63
Choice of the operative conditions for the precipitation vessel. ... 63
VII.1 Drying mechanism ... 63
VII.1.1. Nitrogen flow rate in the precipitator ... 64
VII.2 Study of precipitation at low temperature ... 65
VII.2.1 Choice of the vacuum system ... 65
Chapter VIII ... 75
Validation of the SAA plant in the configuration operated at reduced pressure ... 75
VIII.1 Materials ... 75
VIII.1.1. Bovine serum albumin ... 75
VIII.1.2. Poly-L-Lactide Acid ... 76
VIII.1.3. Polyethylene glycol ... 77
VIII.1.4. Coprecipitates PLA-PEG ... 78
VIII.1.5. Coprecititates: PEG α-tochopherol acetate ... 81
VIII.2. Results and discussion ... 82
VIII.2.1. BSA ... 82
Behavior of the system water-SC-CO2. ... 82
Variation of the temperature in the precipitation vessel ... 83
Characterization of BSA microparticles ... 85
Discussion ... 86
VIII.2.2. PLLA ... 87
Behavior of the system chloroform-SC-CO2. ... 87
Variation of temperature at different precipitation pressure ... 88
Solvent Residue ... 92
Solid state ... 92
Discussion ... 94
VIII.2.3. PEG ... 94
Behavior of the system acetone-SC-CO2 ... 94
Variation of polymer concentration ... 97
Effect of PEG10000 concentration... 100
Solid state ... 107
Discussion ... 109
VIII.2.4. Copolymers PLA-PEG ... 109
1:4 copolymer processing ... 111
1:8 copolymer processing ... 112
Characterization: composition ... 117
Discussion ... 120
VIII.2.5. Coprecipitates: PEG-α Tocopherol acetate ... 120
Discussion ... 125
VIII.2.6. Effect of polymer architecture and molecular weight ... 125
VIII.3. Conclusions ... 129
Chapter IX ... 131
Conclusions ... 131
References ... 133
FIGURE INDEX
Figure I.1 (a) Rayleigh breakup. Drop diameters larger than the jet diameter. Breakup occurs many nozzle diameters downstream of nozzle. (b) First wind-induced regime. Drops with diameters of the order of jet diameter. Breakup occurs many nozzle diameters downstream of nozzle. (c) Second wind-induced regime. Drop sizes smaller than the jet diameter. Breakup starts some distance downstream of nozzle. (d) Atomization regime. Drop sizes much smaller than the jet diameter. Breakup starts at nozzle exit.
(Lin and Reitz, 1998) ... 2
Figure I.2 Sketch of the functioning principle of CAN-BD (Sievers et al., 2001). ... 5
Figure I.3 Sketch of the pneumatic atomization and decompressive atomization. ... 6
Figure I.4 Sketch of the formation of particles from drops at low evaporation rate. ... 7
Figure I.5 Sketch of the formation of particles from drops at high evaporation rate. ... 7
Figure IV.1 Energy level of diatomic molecules (Schrader, 2008) ... 17
Figure IV.2 Raman transitional scheme (Dowy et al., 2009) ... 19
Figure IV.3 Raman optical setup (Lopez and Leipertz, 2010) ... 21
Figure IV.4 Variable volume high pressure cell (Varona et al., 2012) . 23 Figure IV.5 Raman spectra for acetone, water and CO2. ... 24
Figure IV.6 Calibration curve for the system water-acetone... 25
Figure IV.7 Calibration curve for the system CO2-acetone at 60°C and 100 bar. ... 27
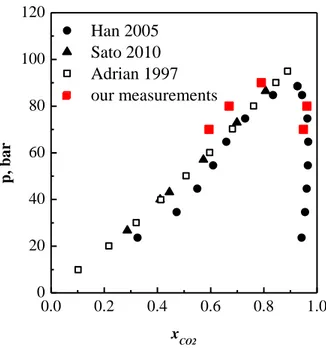
Figure IV.8 Ebuilibrium data for the system CO2-acetone at 60°C. Comparison between data reported in literature (Sato et al., 2010, Han et al., 2005, Adrian and Maurer, 1997) and data detected by Raman scattering (our measurement). ... 28
Figure IV.9 Comparison between the equilibria data obtained by Raman based technique and data reported in literature (Wendland et al., 1994) at 60°C and 100 bar ... 29
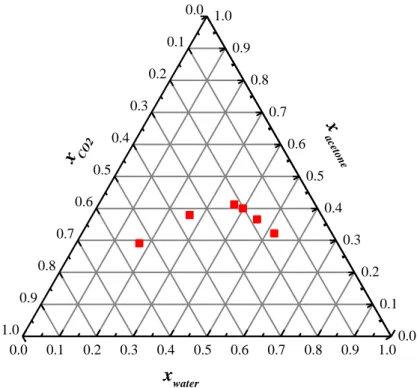
Figure IV.10 Molar fraction detection by Raman scattering at 80°C amd 90 bar, for the system CO2-acetone-water. ... 30
Figure V.1 Sketch of laser diffraction ... 33
Figure V.2 Scheme of the system used to study the droplet size distribution. (C) CO2 tank; (P1) CO2 pump; (P2) liquid pump; (M) saturator; (L) liquid tank; (SL) laser source; (R) receiver. ... 35
Figure V.3 Vapour liquid equilibria for the system water-CO2.(Bamberger et al., 2000) at 40°C (Δ), 60°C (□) and 80°C (○) ... 37
Figure V.4 VLE data (■) and operating points (□) of the system ethanol−CO2 at 40°C and 80°C (Knez et al., 2008) ... 38
Figure V.5 Influence of GLR on the SMD of the droplets measured using different solvents. CO2 flow rate=13 gr/min; N2 flow rate=9 gr/min;
Temperature=80°C; Pressure=70-90 bar; axial distance from the injector=135 mm; injector diameter=120 μm. ... 40 Figure V.6 Influence of GLR on the SMD of the droplets at different temperatures. CO2 flow rate=16 gr/min, injctor diameter=120 μm, and axial
distance=135 mm and 7 mm. ... 41 Figure V.7 Influence of GLR on the SMD of the droplets measured at different distances (h) from the injector. CO2 flow rate = 16 gr/min and
injector diameter = 120 μm. ... 42 Figure V.8 Influence of GLR on the SMD of the droplets measured at different CO2 flow rate. Temperature=80°C; Pressure=70-90 bar; axial
distance from the injector=7 mm; nozzle diameter=120 μm. ... 43 Figure V.9 Influence of GLR on the SMD of the droplets measured at different nozzle diameters. Temperature=80°C; Pressure=70-90 bar; axial distance from the injector=7 mm. ... 44
Figure V.10 Sketch of possible flow regimes in the discharge nozzle (Sovani et al., 2001). ... 46
Figure V.11 Changing in cone angle due to the increase of GLR. (T=40°C; p=70 bar; nozzle diameter 120 µm) ... 47
Figure VI.1 PVP microparticles obtained by SAA using water as solvent at different concentration of solute. (a) 20 mg/mL; (b) 40 mg/mL; (c) 80mg/mL. ... 52
Figure VI.2 Vapor liquid equilibria for the system water-CO2-acetone at
90 bar and 80°C detected by Raman based technology (see chapter IV. The operative points are indicated with the ratio water/acetone used, the GLR is 1.8 and is referred to the ratio between CO2 and liquid (water + acetone)
flow rate (w/w)... 53 Figure VI.3 PVP microparticles obtained by SAA using water-acetone as solvent (a) 1/1(v/v); (b) 1/2 (v/v). Solute concentration 40 mg/mL. ... 55
Figure VI.4 Vapor liquid equilibria for the system ethanol-CO2 at
different temperatures (■=40°C; □=60°C; ♦=80°C), adapted from Knez et al (Knez et al., 2008) ... 56
Figure VI.5 Microparticles obtained by SAA using ethanol and a concentration of PVP of 20 mg/mL. ... 57
Figure VI.6 PVP microparticles obtained by SAA changing the saturator temperature. Ethanol was used as solvent and the concentration of solute was 20 mg/mL; GLR=1.8; p=70-93 bar (see Table VI.3). ... 58
Figure VI.7 PVP microparticles obtained by SAA using different nozzle diameters. Ethanol was used as solvent and the concentration of solute was 20 mg/mL. ... 59
Figure VI.8 XRPD and DSC of PVP powder obtained by SAA compared
with the untreated material. ... 60
Figure VII.1 Scroll pump ... 68
Figure VII.2 Membrane pump ... 68
Figure VII.3 Piston pump ... 69
Figure VII.4 Rotative pump. ... 69
Figure VII.5 DVP pump ... 71
Figure VII.6 Vacuum rate scheme of DVP ZA-100P pump ... 72
Figure VII.7 Scheme of the condenser ... 72
Figure VII.8 Configuration with vacuum system of SAA plant. GP: gas pump; H: heat exchanger; M: saturator; L: liquid feed; LP: liquid pump; P: precipitator; C:condenser; VP1 and VP2 vacuum pump ... 73
Figure VIII.1 Schematic representation of copolymeric architectures synthesized in this work (Izzo and Pappalardo, 2010). ... 80
Figure VIII.2 SEM images showing the effect of precipitation temperature on the morphology of BSA microparticles. The operating conditions set in the precipitator were 80°C (a) and 60°C (b). See Table VIII.2. ... 84
Figure VIII.3 PSD of BSA powders obtained by SAA operating at 0.8 bar and at different precipitation temperatures. The calculations were performed in terms of volumetric cumulative percentages. ... 85
Figure VIII.4 High pressure vapor liquid equilibria at 80 °C; experimental data adapted from Peters et al (Peters and Florusse, 1995), for the binary system CO2-CHCl3. ... 87
Figure VIII.5 SEM images showing the effect of the precipitation temperature on the morphology of PLLA microparticles obtained using SAA. Different temperatures were set in the precipitator: 30°C (a) and 40°C (b). See Table VIII.3. ... 89
Figure VIII.6 Particle size distribution (PSD) of PLLA powders obtained by SAA operating at 0.65 bar and 30°C in the precipitation vessel. The calculations were performed in terms of volumetric cumulative percentages. ... 90
Figure VIII.7 SEM images showing the effect of precipitation temperature on the morphology of PLLA microparticles obtained using SAA. Saturator operated at 80°C, 100 bar; precipitator operated at 30°C (a) and 40°C (b), 0.5 bar. See Table VIII.3... 91
Figure VIII.8 PSD of PLLA powders obtained by SAA operating at 0.5 bar and at different temperatures in the precipitation vessel. The calculations were performed in terms of volumetric cumulative percentages. ... 92
Figure VIII.9 XRPD of PLLA untreated (raw material) and PLLA microparticles produced by SAA process at different temperatures (30°C and 40°C) in the precipitation vessel. ... 93
Figure VIII.10 Thermograms of untreated raw material and SAA produced PLLA microparticles at different temperatures (30°C and 40°C) in the precipitation vessel. ... 93
Figure VIII.11 VLE of the system CO2-acetone, at 40°C, adapted from
Sato et al [77]. ... 95 Figure VIII.12 SEM images showing the effect of high precipitation temperature on the morphology of PEG microparticles. ... 96
Figure VIII.13 SEM images showing the effect of low precipitation temperature on the morphology of PEG microparticles. The operating conditions set in the precipitator were 5°C and 0.6 bar. ... 96
Figure VIII.14 SEM images showing the effect of concentration on the morphology of PEG microparticles; 40 mg/mL (p03) and 60 mg/mL (p04). 98
Figure VIII.15 PSD of PEG 6000 powders obtained by SAA at different concentration of solute in the liquid feed. The calculations were performed in terms of volumetric cumulative percentages by DLS analysis. ... 99
Figure VIII.16 SEM images showing the microparticles obtained using PEG (Mw:10000). Set conditions 18°C and 0.8 bar in the precipitator and 40°C and 67 bar in the saturator. ... 100
Figure VIII.17 SEM images showing the effect of solute concentration on the morphology and diameter of PEG10000 microparticles obtained by SAA at 5°C and 0.8 bar, using (a) 20 mg/mL, (b) 30 mg/mL, (c) 40 mg/mL and (d) 60 mg/mL solute concentration. Histograms by count embedded. 102
Figure VIII.18 Volumetric cumulative PSDs, obtained DLS, of PEG10000 microparticles obtained by SAA at 5 ◦C and 0.8 bar, different concentrations. ... 103
Figure VIII.19 SEM images showing the effect of precipitation temperature on morphology and diameter of PEG10000 microparticles obtained by SAA at 0.8 bar, 20 mg/mL solute concentration and precipitation temperature: (a) 5°C, (b) 9°C and (c) 18°C. Histograms by count embedded. ... 105
Figure VIII.20 Volumetric cumulative PSDs, obtained by DLS, of PEG10000 powders obtained by SAA at 0.8 bar, 20 mg/mL solute concentration, operating at different precipitation temperatures. ... 106
Figure VIII.21 XRPD of PEG10000 untreated and microparticles produced by SAA at 5°C and 20 mg/mL concentration. ... 107 Figure VIII.22 DSC thermograms of PEG10000 untreated and PEG10000 microparticles produced by SAA at different solute concentration. Analyses performed with heating rate of 5°C/min. ... 108
Figure VIII.23 SEM photomicrographs of 1:4 (PEG:PLA) SAA precipitated microparticles. (a) l, (b) G1 branched copolymer (magnification 20Kx). ... 111
Figure VIII.24 SEM photomicrograph of 1:4 (PEG:PLA) microparticles of l copolymer (magnification 40Kx). ... 112
Figure VIII.25 SEM photomicrographs of 1:8 (PEG:PLA) microparticles. (a) l, (b) G1 and (c) G2 copolymer (magnification 20Kx). 113
Figure VIII.26 PSD of 1:8 PEG–PLA copolymer particles obtained by SAA. Calculations were performed in terms of volumetric cumulative percentages from SEM images. ... 115
Figure VIII.27 DSC analyses of PEG–PLA microparticles: l linear 1:4, l linear 1:8, G2 branched 1:4. ... 117
Figure VIII.28 Comparison between H NMR (CDCl3, 5°C) spectra
related to the copolymer as received and the processed polymer. ... 118 Figure VIII.29 PEG microparticles obtained by SAA, at 20°C and 0.8 bar in the precipitator; 40°C and 67 bar in the saturator. ... 121
Figure VIII.30 PEG loaded 5% (w/w) of α-TCP. Microparticles obtained by SAA at 20°C and 0.82 bar in the precipitator; 40°C and 67 bar in the saturator (see Table VIII.12). ... 121
Figure VIII.31 PEG loaded 10% (w) of α-TCP microparticles obtained by SAA at 23°C and 0.8 bar in the precipitator; 40°C and 68 bar in the saturator (see Table VIII.12). ... 122
Figure VIII.32 Cumulative volumetric particle size distribution of the particles produced using SAA. Comparison between the particles loaded with different percentage of α-TCP. ... 122 Figure VIII.33 XRPD of untreated raw material and SAA produced PEG-αTCP microparticles at different αTCP percentage in liquid feed. See Table 12. ... 123
Figure VIII.34 Thermograms: comparison among the analysis performed on the powder produced by SAA and the raw materials, PEG and α-TCP untreated. ... 124 Figure VIII.35 PLLA 120000 Da and PLLA 28000 Da, microparticles obtained by SAA at 40°C in the precipitator. The concentration of the solution is 20 mg/mL ... 126
Figure VIII.36 Volumetric cumulative particle size distribution of PLLA microparticles produced by SAA. ... 127
Figure VIII.37 PEG-PLA copolymer produced by SAA at 40°C and 0.65 bar in the precipitator; 80°C and 87 bar in the saturator. Ramified copolymer G2 (right); Linear copolymer (left). ... 128
Figure VIII.38 Volumetric particle size distribution of microparticles of copolymer PLA-PEG obtained by SAA. ... 129
TABLE INDEX
Table I.1 Comparision of state and transport properties of gases, liquids, and supercritical fluids. ... 4
Table IV.1 Parameter of selected methods ... 16 Table IV.2 Raman frequency shifts of the vibrational Q-branch of some molecules (Lopez and Leipertz, 2010) ... 20
Table IV.3 Molar fraction used for the calibration of water-acetone mixture. ... 25 Table IV.4 Molar fraction used for the calibration of CO2-acetone
mixture... 26 Table VI.1 Selected SAA experiments on PVP microparticles production using water as solvent. The nitrogen flow rate is 1380 NL/hr. (c: solute concentration; QCO2: CO2 flow rate; Tp: precipitation temperature; pp:
precipitation pressure; Tm: saturator temperature; pm: saturator pressure) 50 Table VI.2 Selected SAA experiments on PVP microparticles production using water-acetone mixture as solvent. The nitrogen flow rate is 1380 NL/hr. (c: solute concentration; QCO2: CO2 flow rate; Tp: precipitation
temperature; pp: precipitation pressure; Tm: saturator temperature; pm:
saturator pressure) ... 54 Table VI.3 Selected SAA experiments on PVP microparticles production using ethanol as solvent. The nitrogen flow rate is 1380 NL/hr. (c: solute concentration; QCO2: CO2 flow rate; Tp: precipitation temperature; pp:
precipitation pressure; Tm: saturator temperature; pm: saturator pressure) 57 Table VI.4 Mean diameter of PVP microparticles produced by SAA process, using different kind of solvents. ... 61
Table VII.1 Vacuum rate ... 67
Table VIII.1. Properties of copolymers PLA-PEG. Mw, weight average molecular weight; Mn, number average molecular weight evaluated from NMR analysis [64]; PI, polydispersity index; Tm, melting temperature; ΔH, enthalpy ... 80
Table VIII.2 Selected experiments performed using SAA equipped with the vacuum system. (Tp: precipitation temperature; pp: precipitation
pressure; Tm: saturator temperature; pm: saturator pressure; c: solute
concentration; GLR: gas to liquid ratio; QCO2: CO2 flow rate; QLIQ: solvent
flow rate; QN2: N2 flow rate). ... 83 Table VIII.3 Selected experiments performed using SAA equipped with the vacuum system. (Tp: precipitation temperature; pp: precipitation
concentration; GLR: gas to liquid ratio; QCO2: CO2 flow rate; QLIQ: solvent
flow rate; QN2: N2 flow rate). ... 89 Table VIII.4 Selection of SAA tests performed on PEG6000 and PEG10000: SAA operating conditions, and particle size. Solvent: acetone; CO2 flow rate 9 g/min; liquid flow rate 3 mL/min; GLR = 3.5; nitrogen flow rate 690 NL/h; saturator operating conditions 40 ◦C and 67 bar. ... 101 Table VIII.5 Composition, molecular weight and architecture of the copolymers used for SAA process... 109
Table VIII.6 Results of selected experiments performed using SAA. ... 112 Table VIII.7 PS and PSD of PEG–PLA copolymer particles obtained by SAA. ... 114
Table VIII.8 PSD of PEG–PLA copolymer particles obtained by SAA, suspended in water and measured by DLS. ... 115
Table VIII.9 Comparison between copolymers untreated (u) and after micronization (m): molecular mass, percentage in mole of lactide in the copolymer, polydispersity index, melting point and melting enthalpy.(Tf:
melting temperature; ΔHf: enthalpy of fusion) ... 116 Table VIII.10 H NMR analysis of the molecular mass and lactide percentage of the linear copolymer as received and after SAA process. ... 119
Table VIII.11 Evaluation of polydispersity index obtained using GPC. Comparison between copolymer as received and processed copolymer.... 119
Table VIII.12 Selected experiments performed using SAA equipped with the vacuum system. (Tp: precipitation temperature; pp: precipitation
pressure; Tm: saturator temperature; pm: saturator pressure; c: solute
concentration; GLR: gas to liquid ratio; QCO2: CO2 flow rate; QLIQ: solvent
flow rate; QN2: N2 flow rate). ... 120 Table VIII.13 Stability to hydrolysis, in water medium, of the vitamin in SAA formulation. The percentage was related to the content of vitamin loaded in polymer matrix. ... 125
Abstract
Supercritical Assisted Atomization (SAA) is a very efficient process to micronize several kind of compounds, such as catalysts, polymers and active principles, also for pharmaceutical applications.
The process is based on the solubilization of a controlled amount of CO2
in the liquid mixture, containing the compound to micronize, to reduce the cohesive forces, related to viscosity and surface tension, in order to obtain smaller particles than those could be obtained by process such as spray drying. The solution, formed by the liquid feed and supercritical CO2, is
injected through a nozzle in a precipitation chamber where fast and complete evaporation of the solvent from the droplets takes place. The particles are collected on a porous filter located at the bottom of the precipitator.
The SAA process has many applications in the micronization field, for this reason it is important to have a better comprehension of the principal mechanisms involved in the atomization process, to have a better control on particle size and distribution. For this reason the first part of this thesis work has been devoted to the evaluation of vapor liquid equilibria, involved in the saturator, and the fluid-dynamic of the jet break up. To evaluate the composition of the vapor-liquid phases, in the equilibrium conditions, a new approach, based on Raman Scattering, has been used. This technique, compared with the traditional used in thermodynamical studies, has the advantage to avoid any disturbance during the measurements. The systems aceton-CO2 and acetone-water-CO2 have been studied and the obtained
compositions have been compared with results reported in literatures. The obtained results revealed that the vapor liquid equilibria detected by Raman are comparable with those obtained by other techniques. This part of the work was made in collaboration with SAOT institute in Erlangen (Germany).
It is also important to understand the role of supercritical CO2 in the
atomization process, from fluid-dynamic point of view. For this reason Supercritical Dissolved Gas Atomization (SGDA) plant is used to analyze the spray by laser diffraction technique. The SGDA experiments were performed using two solvents: water and ethanol. Supercritical CO2 shows
different behaviours with these solvents, since it is not soluble in water but it has a good affinity with ethanol.
The laser diffraction analysis reveals that the droplet mean diameter strongly depends on gas to liquid ratio (GLR), since at low value of GLR (lower than 2) bigger droplets were obtained, whereas at GLR higher than 2, smaller droplets were obtained and no variation in droplet mean diameter was observed at higher value of GLR. Droplets obtained using ethanol are smaller than those obtained using water, this because the solubilization of supercritical CO2 in ethanol allows the decrease of cohesive forces due to
diffraction lets to make hypothesis on the regime of atomization: this is bubbly for low value of GLR<1 and become annular for higher GLR. This because the amount of gas not dissolved in the liquid becomes considerably high and induces the nucleation of bubbles in the inner zone of the injector. Moreover, when GLR>1.5 the SMDs are considerably smaller than the diameter of the injector (2 order of magnitude), accordingly to the hypothesis of annular flow.
On basis of the results obtained by the experiments on SGDA, a model compound was chosen for SAA micronization experiments, to enforce the theory previous discussed. Polyvinylpyrrolidone (PVP), that is a polymer that shows high affinity to polar solvents, was chosen as model compound. The solvents used were water, in which CO2 is not soluble, a water-acetone
mixture, where acetone is a non-solvent for PVP and enhance the affinity of the liquid feed with supercritical CO2, and ethanol, that has a good affinity
with CO2.
The bigger particles (mean diameter ranged between 1.20 and 1.86 µm) were obtained using water as solvent, whereas using ethanol it was possible to produce the smallest particles (mean diameter ranged between 0.4 and 1.36 µm).
Moreover, using ethanol as solvent, it was possible to change the operating conditions in the saturator in order to work in the one phase region of vapor liquid equilibria diagram. Keeping constant saturator temperature at 40°C, it was demonstrated that increasing saturator pressure (from 70 to 165 bar) smaller particles were obtained. When saturator pressure is higher than 100 bar, CO2 gives no contribution to a pneumatic effect, since, it is
completely dissolved in the liquid. This fact could contribute to the demonstration that the main factor that influences the mean dimensions of the micro particles produced by SAA could be the amount of dissolved CO2;
indeed, when SC-CO2 is completely solubilized in the liquid feed, smaller
particles can be obtained.
Furthermore, considering the main limit of SAA, that is related to temperature to be used to remove the solvent, a new plant configuration is proposed. In the new plant configuration, a vacuum system is added downstream the precipitator to allow the decrease of precipitation pressure and, as a consequence, of temperature that is necessary for the evaporation of the solvent from the droplets. Indeed, high temperatures might be prohibitive for proteins, that could denaturate, and for polymers with low glass transition temperature, that could soften on the filter, inducing the blockage of the filter and the increase of pressure up to the safety limits.
The project of the vacuum system faced several problems: 1) the process is continuous: a continuous flow of nitrogen is fed into the precipitator, and this flow has to be removed from the vacuum pump ;2) particulate could be present downstream the porous filter, these particles could decrease the efficiency of the vacuum pumps and could damage the mechanical
components of the pumps; 3) condensables are present due to the evaporation of the solvent, these fluids could condensate in the vacuum chamber of the pump, inducing, again, the decrease of pump efficiency. For these reasons, a condenser was projected, to separate condensables before they enter in the vacuum pump. Moreover, it was chosen a piston pump with diaphragm. The diaphram allows to separate the mechanical parts of the pump from the particles that might be present; this kind of pump is oil free, to avoid the formation of emulsions with condensables.
To validate the plant in the new configuration, experiments on protein and polymers with low glass transition temperatures were performed. For example, the micronization of Bovine Serum Albumin was successfully performed, setting 60°C and 0.8 bar in the precipitator. FTIR analysis demonstrated that operating at this temperature the denaturation of the protein was avoided. Other experiments were performed on micronization of polymers. The polymers chosen for these experiments are poly-L-lactide acid (PLLA), poly ethylene glycol (PEG) and copolymers PEG-PLA.
Comparing the results of SAA experiments on these polymers were performed also using the traditional plant configuration and it is interesting to see how the soften of the polymeric particles took place, this phenomenon induces the formation of membrane like structure on the filter. Instead, using the configuration operating at sub-atmospheric pressure in the precipitator, very regular and no agglomerated particles were obtained. Figure 1 shows an example of microparticles of PEG that can be obtained using the vacuum system:
Figure 1 PEG microparticles obtained by SAA process using both plant configuration; (a) membrane like structure; (b) microparticles.
PEG has very low glass transition temperature (-20°C) and, as reported in literature, it is very difficult to obtain microparticles of this polymer. Using the new plant configuration, it was possible to decrease precipitation temperature down to 5°C, taking advantage of the Joule–Thomson effect, produced by the CO2 expansion downstream the nozzle.
Generally, the mean dimension of the produced particles ranged between 0.2 and 3 μm. The diameter of the produced particles depends on operative
conditions used. For example, an increase of precipitation temperature induces the decrease of particle mean diameter; even the concentration of solute in the liquid feed has a no negligible effect on the particle size, since, at high concentration of solute bigger particles are produced.
In conclusion, in this PhD thesis, deeper understanding of the main mechanisms involved in the SAA process has been achieved. The Raman technique allows to evaluate the thermodynamic behavior of the system solvent-CO2 that is generated in the saturator at the SAA operating
conditions, that is of crucial importance in particle size control. The study of the atomization process, supported by SGDA experiments, gave an important comprehension of the role supercritical CO2 in the spray
formation. All these fundamental studies were also connected with particle formation, using SAA plant, giving a general interpretation of the main phenomena involved in micronization.
Furthermore, from the process point of view, a new layout for the SAA plant was proposed and validated. This new layout allows to operate under vacuum in the precipitator, in order to process, at low temperature, thermolabile compounds. Several compounds, for which the SAA micronization was unsuccessful, such as PLLA, copolymers PLA-PEG, PEG, were efficiently micronized, operating at low temperature, underlining the importance of this process improvement.
Chapter I
General statement on
atomization
Supercritical assisted atomization (SAA) is a micronization process in which the supercritical fluid is used as an atomizing medium. The process is based on the solubilization of supercritical carbon dioxide (SC-CO2) in the
liquid solution composed by the solute, that must be micronized, and the solvent, that can be an organic solvent (ethanol, methanol, acetone) or water.
The process can be divided into three steps:
Solubilization of SC-CO2 in the solution (solvent and compound to
be micronized);
Injection of the expanded liquid;
Drying of the droplets.
To understand the role of the supercritical fluid as atomization medium it is necessary to analyze the parameters that influence the atomization.
I.1. Drop and spray formation
Liquid jets are known to break up somewhere downstream the nozzle because of the interfacial forces between the jet and the surrounding air. When a liquid jet is discharged into air, disturbances on the jet surface will be increased because of the aerodynamic interactions between the jet and the surrounding ambient. The growth of these disturbances causes the liquid column to disintegrate into droplets soon after the discharge (Lefebvre, 1988). The most commonly accepted jet disintegration classification in the fluid mechanics literature dates back to the works of Ohnesorge (1936) (W, 1936) who combined the Reynolds (eq. 2) and Weber numbers and proposed a dimensionless group, Z (eq. 1), or the so-called Ohnesorge number shown as:
(1) where:
𝐑𝐞 =
𝛒𝐯𝐃
𝛍
(2)
v = jet velocity at injector exit;
ρ = density of the mixture formed by SC-CO2 and the solution;
σ = surface tension solution/drying medium (nitrogen-N2);
D = injector diameter ;
µ = viscosity of the mixture formed by SC-CO2 and the solution.
Jet breakup phenomena have been divided into regimes that reflect differences in the appearance of jets as the operating conditions are changed. The regimes are due to the action of dominant forces on the jet, leading to its breakup, and it is important that these forces are identified in order to explain the breakup mechanism in each regime (Lin and Reitz, 1998). The case of a round liquid jet injected into a stagnant gas is shown in Figure I.1.
Figure I.1 (a) Rayleigh breakup. Drop diameters larger than the jet diameter. Breakup occurs many nozzle diameters downstream of nozzle. (b) First wind-induced regime. Drops with diameters of the order of jet
diameter. Breakup occurs many nozzle diameters downstream of nozzle. (c) Second wind-induced regime. Drop sizes smaller than the jet diameter. Breakup starts some distance downstream of nozzle. (d) Atomization regime. Drop sizes much smaller than the jet diameter. Breakup starts at nozzle exit. (Lin and Reitz, 1998)
Four main breakup regimes have been identified, that correspond to different combinations of liquid inertia, surface tension, and aerodynamic forces acting on the jet. These have been named the Rayleigh regime, the first wind-induced regime, the second wind-induced regime, and the atomization regime (Lin and Reitz, 1998). At low jet velocities, the growth of long-wavelength, small-amplitude disturbances on the liquid surface promoted by the interaction between the liquid and ambient gas is believed to initiate the liquid breakup process. The existence of these waves is clearly shown in Figure I.1a and b. For high-speed liquid jets, the breakup is thought to result from the unstable growth of shortwavelength waves (Figure I.1c and d).
The breakup drop sizes are on the order of the jet diameter in the Rayleigh and first wind-induced breakup regimes. The drop sizes are very much less than the jet diameter in the second wind-induced and atomization regimes. To categorize jet breakup regimes, it is necessary to consider the length of the coherent portion of the liquid jet or its unbroken length as a function of the jet exit velocity. Beyond the dripping flow regime, the breakup length at first increases linearly with increasing jet velocity, reaches a maximum, and then decreases.
The effect of the liquid viscosity (which appears in the Reynolds number, Re, and the Ohnesorge number, Z) is seen to reduce the wave growth rate and to increase the wave length significantly as the liquid viscosity increases. At low jet velocities (small Weber numbers) it is reasonable to assume that disruption of the jet occurs when the dominant wave amplitude is equal to the jet radius.
Beyond the first wind-induced breakup regime there is even more confusion about the breakup-length trends. Hiroyasu et al (1991) (Hiroyasu H, 1991) discovered discontinuous elongations and shortenings of the jet with changes in the jet velocity. These apparent anomalies are associated with changes in the nozzle internal flowpatterns caused by separation and cavitation phenomena, which also exhibited hysteresis effects. Jets from cavitating nozzles were found to have very short breakup lengths.
Lin and Reitz (1998) (Lin and Reitz, 1998) have proposed the following expressions for different breakup regimes.
1. The Rayleigh breakup region: WeL>8 and Weg<0.4 or 1.2 + 3.41 Z
0.9
2. The first wind-induced region: 1.2+3.41Z0.9<Weg<13
13<Weg<40.3
4. Atomization region Weg>40.3
Weg is the Weber number referred to the atomizing gas.
No account is made of nozzle internal flow effects in the above correlations.
I.2. Supercritical fluid based processes
A supercritical fluid is any substance at a temperature and pressure above its critical point. In these conditions the properties of the fluid significantly change, indeed it can effuse through solids like a gas, and dissolve materials like a liquid. In addition, close to the critical point, small changes in pressure or temperature result in large changes in density, allowing many properties of a supercritical fluid to be "fine-tuned". Table I.1 gives a comparison between density and viscosity of supercritical fluids and gas and liquid. Table I.1 Comparision of state and transport properties of gases, liquids, and supercritical fluids1.
Density [kg/m3] Viscosity [μPa*s]
Gases 1 10
Supercritical Fluids 100-1000 50-100
Liquids 1000 500-1000
When the atomizing medium is a supercritical fluid we can speak about supercritical fluid based micronization process. In these processes SC-CO2
acts as co-solute. The main role of SC-CO2 is to reduce surface tension and
the viscosity to allow working in the atomization regime.
I.3. CO
2-Assisted Nebulization with a Bubble Dryer (CAN-BD)
Sievers et al. (Sievers et al., 2001) proposed a process in which the supercritical fluid and the liquid solution are fed in two separated lines and are mixed in a T-connection (Figure I.2) forming an emulsion. The emulsion is expanded in a nozzle downstream the T. The aerosol plume is dried as it mixes with nitrogen or air in the drying chamber where the formed particles are collected.
Figure I.2 Sketch of the functioning principle of CAN-BD (Sievers et al.,
2001).
Using this process it is possible to micronize some compounds:
Active molecules: budesonide, naproxen, anphotericin B (Sievers et al., 2003), ciprofloxacin HCl, moxifloxacin HCl, rifampicin, capreomycin, amikacin (Manion et al., 2012);
Proteins and enzymes: lysozyme, lactate dehydrogenase (Sievers et al., 2001).
I.4. Supercritical Assisted Atomization (SAA)
In this process (Reverchon, 2002b) SC-CO2 solubilizes in the liquid
solution in a saturator, a high-pressure vessel loaded with stainless steel perforated saddles, characterized by a high surface, favouring the contact between CO2 and the liquid solution, to promote the dissolution of the
gaseous stream in the liquid. The operating conditions are selected considering the binary VLE diagram solvent-CO2. The molar fraction of
CO2, the temperature and the pressure selected at the saturator ensure large
CO2 solubility in the liquid. However the presence of the solute could
modify VLEs, as a consequence the solute could precipitate in the saturator because of the antisolvent effect. The antisolvent effect takes place because the operative condition are upon the mixture critical point, of the mixture CO2-solvent, where the solvent, in which the compound to be micronized is
solubilized, has high solubility in SC-CO2 and the compound precipitates in
the saturator. This condition must be avoided in order to have the success in SAA process.
The injection of the mixture through a nozzle allows the formation of the droplets, that are dried in the precipitation vessel by the inert gas flow (N2).
The particles are collected at the bottom of the precipitation vessel on a porous filter (pores with a diameter less than 0.1 μm) while the condensable gases are separated from the inert gas by a separator vessel located downstream the precipitator.
• Precursors of catalysts and salts: Yttrium Acetate, sodium chloride, aluminum sulfate, zirconyl nitrate hydrate (Reverchon et al., 2008b) • Active molecules: carbamazepine, ampicillin trihydrate,
triclabenzadol, dexamethasone (Reverchon et al., 2008b), Rifampicin (Reverchon and Antonacci, 2006a);
• Enzymes: Lysozyme (Adami et al., 2009);
• Polymers: Chitosan, HPMC (Reverchon et al., 2008b);
• Coprecipitates: Ampicillin-Chitosan and Ampicillina-HPMC (Reverchon et al., 2008b), BSA-Gentamycin Sulfate (Della Porta et al., 2010).
The produced particles have a regular morphology and generally a mean diameter between 0.5 and 5 µm. The PS (particle size) and the PSD (particle size distribution) can be controlled modifying the process parameters.
Cai et al (Cai et al., 2008) propose a process very close to SAA called SAA-HCM where a cavitation mixer is located upstream the saturator.
Some compounds have been micronized using SAA-HCM: • levofloxacin-HCl (Cai et al., 2008)
• sodium cellulose sulfate (Wang et al., 2010)
The mean diameter of the produced particles is between 0.5 and 5 µm; the morphology is regular.
On the bases of the experiments performed using SAA process, a first hypothesis on atomization mechanism was proposed. This hypothesis expects that the atomization takes place following two mechanisms: the first step is the production of primary droplets at the exit of the nozzle by pneumatic atomization. The second step is due to the fast release of CO2,
from the inner of the droplets during decompression: a secondary atomization occurs, that produces smaller secondary droplets (Adami et al., 2009), as schematically reported in Figure I.3.
Figure I.3 Sketch of the pneumatic atomization and decompressive atomization.
However this hypothesis has not been verified. For this reason some experiments will be performed in this thesis work, to study spray formation at the exit of the injector.
After the formation of the droplets the drying of the solvent takes place; the drying is driven by the continuous flow of a warm inert gas (N2). The
solvent is continuously removed by the inert gas (N2) flow. It is possible to
apply the theory proposed by Vehering on the drying process that takes place during spray drying process (Vehring et al., 2007). When the solvent is dried, the solute reaches the saturation, forms a solid matrix through which the solvent diffuses before leaving the droplet. If the diffusion of the solvent through the solid matrix is not fast and the solute to micronize has a large solubility, precipitation takes place later than the evaporation process, and the solute precipitates homogeneously inside the drop. The resulting dry particles are expected to have little or no void space and a density close to the density of the dried bulk material (Figure I.4).
Figure I.4 Sketch of the formation of particles from drops at low evaporation rate.
If the diffusion of the solvent is fast and the solute solubility is small, the resulting particles will have a considerable void space (Figure I.5). These phenomena are influenced by the precipitation temperature and pressure (Vehring et al., 2007).
Figure I.5 Sketch of the formation of particles from drops at high evaporation rate.
SAA technique is more efficient than the traditional similar micronization techniques, that do not use supercritical fluid as atomized medium, because it is possible to obtain smaller particles (Reverchon, 2002b); particle size distribution can be changed according to the used operative parameters. Moreover it is possible to use several kinds of solvents; if water is used, the process can be clearly considered environmental friendly and it is possible to micronize a significant variety of pharmaceutical compounds that are water soluble. SAA process allows to obtain microspheres formed by a carrier, like polymers or proteins, and an active principle, that can be efficiently used in the controlled release (Reverchon et al., 2008b, Della Porta et al., 2010).
Chapter II
Aim of the work
SAA has many application, since it can be used to micronize many compounds of chemical and pharmaceutical interest. Moreover, it is possible to control particle size and crystalline degree, choosing appropriate operative conditions.
However, up to now, the mechanisms involved in SAA process are not well understood. Particularly, it could be interesting to understand how supercritical CO2 acts as atomizing medium.
The aim of this work can be divided in three steps, as following indicated:
study of vapor liquid equilibria in the saturator;
characterization of the spray at the exit of the nozzle, downstream the saturator;
improvement of precipitator performance decreasing the precipitation temperature
The evaluation of vapor liquid equilibrium is fundamental to choose the operating conditions in the saturator, where CO2 is mixed with the liquid
feed. Generally speaking, literature is poor of vapor liquid equilibrium data for the system CO2-solvent at high pressure, especially when mixture of
solvents are used. To overcome this limitation, an innovative technique is proposed to evaluate the concentration of the compounds in the two phase region of vapor liquid equilibria diagram. This technique allows to obtain concentration without disturbing the equilibria between the phases.
Up to now, it is believed that the atomization involves two mechanisms: the pneumatic atomization and the decompressive atomization, as indicated in the previous chapter. However no experiments were performed to verify this atomization mechanism. In this work supercritical dissolved gas atomization apparatus is proposed to analyze the spray at the exit of the injector, using laser diffraction technique.
The last goal of this work will be to enlarge the application field of SAA process to the micronization of thermosensitive compounds. For this purpose, it is necessary to project and implement a vacuum system that
operates downstream the precipitator, in order to reduce the precipitation pressure and to perform the drying of the drops at lower temperatures.
Chapter III
Analytical methods
III.1. Analysis on morphology
III.1.1. Scanning electron microscope field emission
A field-emission scanning electron microscope (FE-SEM model LEO 1525; Carl Zeiss SMT AG, Oberkochen, Germany) was used to study the morphology of the produced particles. Samples were fixed over an adhesive carbon tab, previously stuck to an aluminium stub and covered with gold (layer thickness 250 Å) using a sputter coater (model 108 A; Agar Scientific, Stansted, UK).
III.1.2. Particle size analysis
Particle size (PS) and particle size distribution (PSD) were measured from FE-SEM photomicrographs using the Sigma Scan Pro Software (release 5.0, Aspire Software International Ashburn, VA). Approximately 1000 particles were measured for each particle size distribution calculation. Histograms representing the particle size distribution were fitted using Microcal Origin Software (release 8.0, Microcal Software, Inc., Northampton, MA). Moreover, the produced microparticles were characterized by the dynamic laser scattering (DLS) method using a Nanosizer (NanoZS Malvern Instrument, UK) equipped with a He-Ne laser operating at 4.0 mW and 633 nm, for measuring the hydrodynamic diameter of the particles. PLLA and PLA-PEG microparticles were dispersed in a water solution containing 0.1 wt% of a stabilizing agent, sodium dodecyl sulphate (SDS); BSA microparticles were dispersed in chloroform; PEG and PEG-α Tocopherol microparticles were dispersed in cold acetone and the analysis was performed at 10°C; PVP was dispersed in ethyl acetate.
III.2. Solid state analysis
III.2.1. X-Ray Diffractometry
Solid state analysis of the samples was performed using an X-ray powder diffractometer (model D8 Advance; Bruker AXS, Madison, WI) with a Cu sealed tube source. Samples were placed in the holder and flattened with a glass slide to ensure a good surface texture. The measuring conditions were: Ni-filtered Cu Ka radiation, l¼1.54 A, 2Θ angle ranging from 5 to 60 with a scan rate of 3 s/step and a step size of 0.028.
III.2.2. Differential scanning calorimeter (DSC)
Thermograms of the samples were obtained using a differential scanning calorimeter (DSC, model TC11, Mettler Toledo, Inc., Columbus, OH). Fusion temperature and enthalpy were calibrated with an indium standard (melting point, 156.6°C). 10 mg of the sample was accurately weighed, crimped in an aluminum pan, and heated from 25 to 195°C under a nitrogen purge at 10°C/min.
III.3. Stability and denaturation analysis
III.3.1. Protein stability: FTIR
Fourier transform infrared (FT-IR) spectra were obtained via M2000 FTIR (MIDAC Co, Costa Mesa, CA), at a resolution of 0.5 cm-1. The scan wavenumber range was 4,000–400 cm-1, and 16 scan signals were averaged to reduce the noise. The powder samples were ground and mixed thoroughly with potassium bromide (KBr) as infrared transparent matrix. KBr discs were prepared by compressing the powders in an hydraulic press. All spectra were smoothed using a 13-point Savitzky–Golay smoothing function to remove white noise.
III.3.2. Dissolution rate test
Dissolution tests was performed on BSA microparticles. 10 mg of material were dissolved in distillated water (100 mL) at 25°C under stirring (300 rpm). The dissolution time were investigated measuring the increase of concentration of BSA in the solution mentioned above. This concentration was determined by an UV–Vis spectrophotometer (mod. Cary 50, Varian, Palo Alto, CA) measuring BSA absorbance (280 nm).
III.3.3. Solvent residue analysis
Chloroform residue in PLLA microparticles, produced by SAA, was measured by a headspace sampler (mod. 7694E, Hewlett Packard, USA) coupled to a gas chromatograph (GC) interfaced with a flame ionization detector (GC-FID, model 6890 GC-SYSTEM, Hewlett Packard, USA). Chloroform was separated using two fused-silica capillary columns connected in series by press-fit: the first column (model Carbowax EASYSEP, Stepbios, Italy) connected to the detector, 30 m length, 0.53 mm i.d., 1 μm film thickness and the second (model Cp Sil 5CB CHROMPACK, Stepbios, Italy) connected to the injector; 25 m length, 0.53 mm i.d., 5 μm film thickness. GC conditions were the one described in the USP 467 Pharmacopoeia with some minor modifications: oven temperature from 45 to 210 °C for 15 min. The injector was maintained at 135°C (split mode, ratio 4:1), and helium was used as the carrier gas (5 ml/min). Head space conditions were: equilibration time, 30 min at 95°C; pressurization time, 0.15 min; loop fill time, 0.15 min. Head space samples were prepared in 20 ml vials filled with internal standard DMI (3 ml) and 500 mg of NaCl and water (0.75 ml) in which PLLA particles were suspended.
III.4. Structural analysis
III.4.1. H and C NMR analysis
Spectra were recorded on a Bruker Advance 400MHz spectrometer at 298 K. The samples were prepared by introducing 20 mg of copolymer in 0.5mL of CDCl3 into a NMR tube (0.5mm outer diameter).
Tetramethylsilane (TMS) was used as internal reference.
III.4.2. Gel Permeation Chromatography (GPC)
GPC chromatograms were recorded on the system equipped with a Waters 1525 binary pump, a Waters 2414 RI detector and four Styragel columns (range 103–106 A°). The measurements were carried out at 25°C, using THF as eluent (1.0 mL/min) and polystyrene standards as references.
III.4.3. High-performance liquid chromatography (HPLC)
Vitamin loading was investigated by dissolving 5 mg of powder in 2.5 mL (5% α-TCP) and 5 mL (10% α-TCP ) of methanol, and vitamin concentration were monitored at 292 nm in a HPLC system, using methanol/acetonitrile (25/75 v/v) as eluent in a Spherisorb ODS-2 column at a flow rate of 1.5 ml/min.
The stability to hydrolysis of the vitamin in water medium was investigated dissolving the powder produced by SAA in water. 1 mL of the resulted solution was eluted in ethanol (50/50 v/v) and the concentration of the vitamin was measured using HPLC analysis as previously discussed.
Chapter IV
Vapour liquid equilibria
measurements
The knowledge of equilibrium states of binary or multicomponent mixtures is of high interest in chemical engineering, to know the composition of the mixture that is formed in the saturator of the SAA plant.
In SAA processing, the choice of the proper conditions in the saturator is fundamental to produce microparticles. Indeed, the jet-breakup in form of atomization process depends on the quantity of CO2 solubilized in the liquid
solution contained in the saturator Assuming that the solute has not a relevant influence on the vapor liquid equilibria (VLEs), the formation of an homogeneous mixture is assured if the SAA operative point is located in the liquid region of the VLE diagram for the binary system solvent-CO2
(Reverchon, 2002b, Wang et al., 2010). However, literature is poor of data which respect to vapor liquid equilibria at high pressure. This is due to the difficulties to measure the composition of two phase mixture, at high pressure, without interfering the system.
Different methods can be used to evaluate the equilibrium data. For example, bubble-point pressures could be determined from the relationship between the pressure and the inner volume of the cell used to mix the compounds (Sato et al., 2010, Campos et al., 2009). Another possibility is to measure the concentration in the phases by gas chromatographic analysis. The main limitations of these classical techniques are: possible disturbance of the equilibrium by the extraction of the probe, changes of the probe state between probe extraction and probe analysis, and the time delay between probe extraction and analysis (Stratmann and Schweiger, 2002). Noninvasive spectroscopic methods, such as Raman (Kiefer, 2010) or NIR spectroscopy (Stratmann and Schweiger, 2002), do not have this kind of drawback. In this chapter the evaluation of the composition of system CO2
IV.1. Raman Scattering
Laser optical measurement techniques are very useful for the determination of properties, such as composition of a mixture, because they do not affect the medium and have a short measuring time.
Furthermore, due to the particular type of interaction between laser photons and involved molecules, the Raman scattered light is specific to each molecule. Therefore it is possible to use this technique to detect simultaneously all components of a gas with only one laser source.
However, when light interacts with a material several physical processes take place. They are characterized from different frequencies and cross section, as reported in Table IV.1.
Table IV.1 Parameter of selected methods
Method Scattering centre Frequency
Scattering cross section
d d
in
sr
cm
2 Mie 10m particle 0
7 10 Mie 0,1m particle 0
13 10 Fluorescence molecule F
0 19 24 10 10 Rayleigh molecule 0
27 10 Raman molecule 0
R 30 31 10 10 CARS molecule 0
R 21 25 10 10 The linear Raman scattering is the weakest scattering process of all processes listed (see Table IV.1).
Every motion of a molecule can be regarded as a combination of translational, vibrational and rotational motions. The translational motion is not relevant in molecular spectroscopy, therefore, it will be neglected.
In many cases, the total energy of a molecule can be defined in a good approximation as the sum of electronic, vibrational and rotational energies. Electronic states are characterized with the main quantum number (n). Rotational and vibrational energy levels are indicated with the rotational quantum number (J) and the vibrational quantum number (v), respectively.
Figure IV.1 shows schematically the potential curves of the electronic ground state and the first two excited electronic states for a diatomic molecule. Considering molecules not having extended conjugated electronic system, electronic excitations normally cannot occur if light in the visible wavelength range is used because its energy is not high enough to excite this kind of transitions.
Distance between nuclei E n er g y n = 0 n = 1 n = 2
mostly larger than 20000 1/cm
Figure IV.1 Energy level of diatomic molecules (Schrader, 2008)
Normal vibration is defined as a vibration, at which all mass points of the system vibrate with the same frequency and a given phase relation. A normal vibration can be excited without exciting another normal vibration.
The vibrational energies are normally determined via quantum mechanical calculations. However, the vibrations of a simple linear diatomic molecule can be explained in a first approximation as those of a harmonic oscillator.
The vibrations of the harmonic oscillator are not damped. Only certain states of vibration are possible.
This description leads to a quantization of the vibrational states (term values) G(v). For the harmonic oscillator the vibrational energy is dependent on the vibrational quantum number v:
2 1 ) ( ) ( v v G c h v G (3) Where h is the Planck’s constant and c is the speed of light. The energy levels of the harmonic oscillator are equidistant. Reality is much better described by the inharmonic potential. Especially for large deviations from the equilibrium state, the distances between energy levels decrease with increasing vibrational quantum number v.
n 1