Contents lists available atScienceDirect
Environment International
journal homepage:www.elsevier.com/locate/envintA prophylactic multi-strain probiotic treatment to reduce the absorption of
toxic elements: In-vitro study and biomonitoring of breast milk and infant
stools
Maria Luisa Astolfi
a,⁎, Carmela Protano
b, Elisa Schiavi
b, Elisabetta Marconi
b,
Daniela Capobianco
b, Lorenzo Massimi
a, Martina Ristorini
a, Maria Elisabetta Baldassarre
c,
Nicola Laforgia
c, Matteo Vitali
b, Silvia Canepari
a, Paola Mastromarino
baDepartment of Chemistry, Sapienza University, Piazzale Aldo Moro 5, I-00185 Rome, Italy
bDepartment of Public Health and Infectious Diseases, Sapienza University, Piazzale Aldo Moro 5, I-00185 Rome, Italy
cDepartment of Biomedical Science and Human Oncology, Section of Neonatology and Neonatal Intensive Care Unit, University “Aldo Moro” of Bari, Piazza Giulio Cesare 11, I-70124 Bari, Italy
A R T I C L E I N F O Keywords: Breast milk Meconium Probiotic Biomonitoring Toxic element Risk assessment A B S T R A C T
Potential exposure to toxic elements initially occurs during gestation and after birth via breast milk, which is the principal source of nutrients for infants during the first months of life. In this study, we evaluated whether maternal oral supplementation with a multi-strain probiotic product can protect infants from exposure to arsenic (As), cadmium (Cd), mercury (Hg), and lead (Pb) via breast milk. In-vitro studies of the bacterial strains present in this probiotic product showed a high bacterial tolerance for As, Cd, Hg, and Pb, and good binding capacity for
Cd, Hg, and Pb (72%, 81%, and 64%, respectively) within 1 h of contact. We evaluated concentrations (5 mg L−1
for Cd and Pb, and 2 mg L−1for Hg) that largely exceeded the provisional tolerable weekly intake of these toxic
elements via food or water applicable for human consumption. Changes in the levels of these elements in breast milk and newborn stools were evaluated in the control (orally supplemented with placebo) and experimental (orally supplemented with probiotic) groups at birth (t0), 15 days (t15), and 30 days (t30) after delivery. Elemental analysis of breast milk did not show significant differences between the control and experimental groups at different stages of lactation; however, stool samples obtained from newborns of mothers supplemented with the probiotic product showed that Cd levels were significantly reduced (by 26%) at t15 compared with the levels of the controls. Our data did not show an association between concentration of toxic elements in breast milk and that in newborn stools. Indeed, the concentration of Cd, Hg, and Pb in breast milk decreased during the lactation period, whereas the levels of these elements in newborn stools were stable over time. Although our
in-vitro data indicate that the consortium of these probiotic strains can absorb toxic compounds, this study was
limited by its small sample size and potential uncontrolled confounding effects, such as maternal diet and lifestyle. Therefore, we could not confirm whether prophylactic use of this probiotic product can reduce the absorption of toxic elements. The risk assessment in the studied population evidenced a margin of exposure (MOE) of 1, or between 1 and 10 for Pb, and lower than 50 for As. This poses a potential risk for breastfed infants, indicating that interventions aimed to avoid breastfeeding-related health risks remain a major challenge in public health.
1. Introduction
Chemical elements are naturally present in the environment, where their distribution is determined by biogeochemical cycles. Industrial, domestic, agricultural, medical, and technological applications increase the levels of these elements above those occurring naturally, resulting
in contaminated water, air, soil, crops, and animals (WHO, 2004; Astolfi et al., 2006a, 2006b; ATSDR, 2007a, 2007b; EFSA, 2009a; Marconi et al., 2011;Kim et al., 2016;Astolfi et al., 2017;Ha et al., 2017; Canepari et al., 2018; Manigrasso et al., 2019). Indeed, toxic elements are present in foods such as vegetables (Noli and Tsamos, 2016;Shaheen et al., 2016;Li et al., 2017), fish (Miklavčič et al., 2013;
https://doi.org/10.1016/j.envint.2019.05.012
Received 21 January 2019; Received in revised form 5 May 2019; Accepted 6 May 2019
⁎Corresponding author.
E-mail address:[email protected](M.L. Astolfi).
Environment International 130 (2019) 104818
0160-4120/ © 2019 The Authors. Published by Elsevier Ltd. This is an open access article under the CC BY license (http://creativecommons.org/licenses/BY/4.0/).
Saha et al., 2016; Gu et al., 2017; Makedonski et al., 2017), dairy products (Suturović et al., 2014; Shahbazi et al., 2016), cereals (Cuadrado et al., 2000; Akinyele and Shokunbi, 2015), and water (Chowdhury et al., 2016). Therefore, the food chain is a major source of exposure to toxic elements for the general population (Morel et al., 1998;Kachenko and Singh, 2006;Sharma et al., 2007;Bensefa-Colas et al., 2011;JECFA, 2011a, b;Arnich et al., 2012; Miklavčič et al., 2013).
Toxic elements can cross the mammary glands and enter breast milk (Gundacker et al., 2010;Al-Saleh et al., 2011;Vacchina et al., 2017), which is the most important source of nutrients during the first months of life (Solomon and Weiss, 2002; LaKind et al., 2004;Kunter et al., 2017;Lehmann et al., 2018). Breast milk can be a pathway for maternal excretion of toxic elements and a potential source of exposure for in-fants (LaKind et al., 2004; U.S. EPA, 2011; Björklund et al., 2012; Ettinger et al., 2014; Rebelo and Caldas, 2016). This is concerning, because infants are particularly sensitive to toxic effects due to their rapid growth, organ immaturity, and vulnerability of the nervous system during the first year of life (Isaac et al., 2012). In addition, newborns absorb metals more readily than do adults, and have a lower capacity to excrete compounds in bile, thereby decreasing body clear-ance (Oskarsson et al., 1998; Rebelo and Caldas, 2016). Thus, even relatively low levels of toxic elements in breast milk can represent a risk for infant health (Rebelo and Caldas, 2016). Arsenic (As), lead (Pb), mercury (Hg), and cadmium (Cd) rank 1st, 2nd, 3rd, and 7th, respec-tively, on the U.S.A. National Priorities List (NPL) of the Agency for Toxic Substances and Disease Registry (ATSDR, 2015). Compounds containing inorganic As (IAs) and Cd, and inorganic Pb, are classified as carcinogens (Group I) and as probable carcinogens (Group IIA) in hu-mans, respectively, by the International Agency for Research in Cancer (IARC, 2016). Mercury, in the form of methylmercury (MeHg) or in-organic (IHg) mercury, is classified byIARC (2016)as probable carci-nogen in humans (Group IIB) or not classifiable as to its carcicarci-nogenicity (Group III), respectively. MeHg and IHg are teratogenic and neurotoxic, especially in the developing brain (WHO, 1991, 2010;NRC (National Research Council), 2000; JECFA, 2004; Clarkson and Magos, 2006; Ceccatelli et al., 2010). All these elements can exert serious effects on the health of children, affecting numerous systems and organs (Al-Saleh et al., 2011, 2016; Shrader-Frechette, 2012; Valent et al., 2013; Yurdakök, 2015;Rebelo and Caldas, 2016;Kunter et al., 2017). How-ever, the health effects related to the intake of these elements via human milk have not been extensively studied.
Assessing the levels of toxic chemicals in breast milk provides in-formation on the maternal toxic load, and serves as an indicator for prenatal and post-natal exposure of infants to these chemicals (Solomon and Weiss, 2002;Almeida et al., 2008;Al-Saleh et al., 2011;Ettinger et al., 2014;De Felip et al., 2014;Yurdakök, 2015;Dursun et al., 2016). The composition of breast milk varies over time (Emmett and Rogers, 1997;Ballard and Morrow, 2013). Consequently, the concentrations of essential or toxic elements may change during lactation (Krachler et al., 1998;Almeida et al., 2008). The transport of toxic elements into breast milk occurs via the same pathways as those used for other milk com-ponents and essential trace elements (Oskarsson et al., 1998; Rebelo and Caldas, 2016). However, differences in the metabolism of essential trace elements and toxic pollutants can cause specific changes in the level of each element. Moreover, the composition of human milk is not constant and depends on the nutritional status and diet of the mother, as well as her stage of lactation, socio-demographic status, and lifestyle (García-Esquinas et al., 2011;Ballard and Morrow, 2013;Vieira et al., 2013;Grzunov Letinić et al., 2016). Breast milk, which can be obtained non-invasively, is a suitable biological matrix for biomonitoring ex-posure to environmental pollution and related risks to human health (Esteban and Castaño, 2009;Björklund et al., 2012;Yurdakök, 2015; Grzunov Letinić et al., 2016). Breast milk is also suitable for evaluating the effectiveness of preventive measures (Fürst et al., 1994;Norén and Meironyté, 2000). Urine, stool, saliva, nails, and hair can also be
obtained non-invasively and are used for biomonitoring exposure to toxic elements (Claeys-Thoreau et al., 1987; Kikuchi et al., 2003; Esteban and Castaño, 2009;Protano et al., 2016;Protano et al., 2017; Protano et al., 2018). Risk management is meant to reduce life-long exposure because toxic elements are accumulated long before preg-nancy, and are released during gestation and lactation, posing a health risk to the offspring (Yurdakök, 2015).
The use of beneficial bacteria represents a potential preventive strategy. Recent studies have shown that some strains present in human microbiota, and some strains of probiotic lactobacilli, can reduce pes-ticide absorption in humans and wildlife (Trinder et al., 2015), and elemental toxicity in humans (Bisanz et al., 2014) and animals (Salim et al., 2011;Breton et al., 2013). Indeed, different species of lactic acid bacteria can adsorb heavy metals on their cell-wall surfaces (biosorp-tion) or accumulate them inside the cell (bioaccumula(biosorp-tion) (Bhakta et al., 2012;Daisley et al., 2018;Kinoshita, 2019). This has prompted the use of these organisms in biotechnology (Halttunen et al., 2007; Mrvčić et al., 2012), novel detoxification therapies (Brudnak, 2002; Urban and Kuthan, 2004; Zhai et al., 2013), and dietary strategies (Gerbino et al., 2014).
In this study, we evaluated the effects of prophylactic treatment with a multi-strain probiotic product on the concentrations of toxic elements in breast milk and newborn stools at different time points during lactation. For this, we used a sensitive analytical method to determine the total levels of As, Cd, Hg (estimated as MeHg), and Pb. In-vitro studies were conducted to verify tolerance and binding ability of these bacterial strains for As, Cd, Hg, and Pb. Additionally, we assessed the risk of toxic element intake via breastfeeding.
2. Materials and methods
2.1. In-vitro study: design, participants, and specimen collection
This study included 29 women who were recruited in a previous study (Mastromarino et al., 2015; ClinicalTrials.gov Identifier: NCT01367470). The present study was randomized, double blind, placebo-controlled, and designed to examine the health-promoting ef-fects of supplementation with a probiotic product during pregnancy and first month of breast-feeding. The probiotic mixture used for supple-mentation contained Lactobacillus (L.) paracasei DSM 24733, L. plan-tarum DSM 24730, L. acidophilus DSM 24735, L. delbrueckii subsp. bul-garicus DSM 24734, three strains of bifidobacteria (B. longum DSM 24736, B. breve DSM 24732, and B. infantis DSM 24737), and one strain of Streptococcus thermophilus DSM 24731. This product is produced by Danisco-Dupont, WI, USA and is currently sold in Continental Europe and USA under the brand Vivomixx® and Visbiome®, respectively. In Korea, this product is commercialized under the brand name De Simone Formulation. This probiotic product was packaged in bags containing 9 × 10¹¹viable lyophilized bacteria. Mothers were recruited between
April 2011 and December 2013 from the Department of Medical Sci-ence and Oncology, Section of Gynaecology and Obstetrics, Policlinico Hospital, University of Bari. One bag of probiotic or placebo (corn starch) was consumed daily before a meal starting at the 36th week of pregnancy and stopping at 4 weeks after delivery. A nutritionist pro-vided dietary guidelines to each mother according to the anthropo-metric values collected, and in accordance with the current re-commendations for diet during pregnancy set by the ItalianMinistry of Health (2011).
The control group included 13 mothers and 13 infants, and the treated group included 16 mothers and 18 infants. Infants received nutrition by breastfeeding exclusively during the study period. Breast milk (87 samples) and newborn stools (90 samples) were collected into sterile polypropylene tubes on day 1, 15, and 30. Samples of colostrum and meconium were collected on day 1. Milk was collected using a manual breast-pump after the nipple and areola were cleaned by wiping with a swab soaked in sterile water. During transport to the hospital,
the collected samples were maintained at a temperature of ~4 °C in a portable thermal refrigerator. The samples were then stored at −80 °C until further analyses.
2.2. In-vitro study 2.2.1. Bacterial strains
For each assay, the lyophilized probiotic was resuspended in dis-tilled sterile water (EuroClone S.p.A., MI, Italy), or in de Man, Rogosa and Sharpe (MRS) broth (CM0359; Oxoid S.p.A., MI, Italy) containing 0.05% w/v L-cysteine hydrochloride (≥98%; Sigma-Aldrich, St. Louis, MO, USA) and allowed to equilibrate under anaerobic conditions for 5 h at 37 °C. The cell suspension was centrifuged (ALC International, Cologno Monzese, MI, Italy) at 2500g for 10 min, and the pellet was resuspended in MRS broth to achieve a final concentration of 5 × 10⁸
or 5 × 10¹⁰bacterial cells mL−1. The bacteria were incubated at 37 °C
using a thermostatic shaking incubator for 1 h in distilled sterile water, or for 1 and 24 h in MRS broth supplemented with 0.05% w/v L-cy-steine hydrochloride under anaerobic conditions. This was performed to evaluate bacterial tolerance and capacity for element binding, as described inSection 2.2.2.
2.2.2. Tolerance and element-binding assays
Bacterial tolerance was assessed to determine the maximal con-centration of each metal not affecting bacterial viability, and to eval-uate the capacity of the probiotic strains to bind nontoxic concentra-tions of As, Cd, Hg, and Pb. For this, a 600-μL inoculum of probiotic strains (1011bacteria mL−1) was resuspended in culture medium,
placed into 24-well polystyrene microplates (Corning Life Sciences, Tewksbury, MA, USA), and treated with an equal volume of: 0 to 2 mg L−1Hg, or 0 to 5 mg L−1 As, Cd, or Pb, for 1 h; or with 0 to
10 mg L−1 Hg, or 0 to 50 mg L−1As, Cd, or Pb, for 24 h.. High
ele-mental concentrations, exceeding those outlined in regulatory guide-lines (Commission Regulation (EC) No 1881/2006; Council Directive 98/83/EC, 1998), were used to assess the effects of these bacterial strains under severe conditions. In our single-element bacterial toler-ance assays, we used a range of concentrations to examine the re-sistance and maintenance of binding capacity in these bacterial strains under unfavourable conditions; similar assessments have been con-ducted in several previous studies (Halttunen et al., 2007; Kinoshita, 2019;Kinoshita et al., 2013;Mrvčić et al., 2012;Rial et al., 2011).
Dilutions of standard stock solutions of 1002 ± 7 mg L−1Hg (SCP
Science, Baie D'Urfeé, Canada) and 1.000 ± 0.005 mg L−1As, Cd, or
Pb (Ultra Scientific/Agilent Technologies, North Kingstown, RI, USA) were freshly prepared prior to use in culture using deionized water (resistivity ≤ 18.3 MΩ cm; generated by an Arioso Power I RO-UP Scholar UV deionizer, Human Corporation, Songpa-Ku, Seoul, South Korea). The initial culture pH was ~5 or 6 for water and MRS broth, respectively. After culturing, viable microorganisms were identified by plating serial 10-fold dilutions of each sample onto MRS-agar plates. All assays were performed in triplicate. Colony counts were conducted after a 48-h incubation at 37 °C under anaerobic conditions. To evaluate element binding, culture samples were centrifuged at 9400g for 15 min (Eppendorf s.r.l., MI, Italy), separated into supernatant and pellet, and stored −20 °C until chemical analysis (described inSection 2.3). The original standard solution containing C0mg L−1of each element served
as control concentration. Element uptake (U) was expressed as a per-centage and calculated using the following equation:
=
U% (C0 C C1)/ 0 100
where C0and Cl(mg L−1) are element concentrations prior to, and post,
adsorption, respectively.
2.3. Analysis
2.3.1. Determination of total As, Cd, and Pb levels
Samples of breast milk (500 μL), stool (~100 mg), and pellets and supernatants (1 mL) of bacterial cells used in the binding experiments were transferred into 2.5-, 5-, and 10-mL graduated polypropylene tubes (Artiglass s.r.l., Due Carrare, PD, Italy) and subjected to acid di-gestion in an open vessel heated in a water bath at 80 °C (WBD;) as described previously (Di Dato et al., 2017;Astolfi et al., 2018). We used 1 mL 67% HNO3 and 0.5 mL 30% H2O2 high-purity solvents
(Pro-mochem, LGC Standards GmbH, Wesel, Germany) for trace analysis of breast milk and probiotic culture samples; for analysis of stool samples, the volumes of these reagents were reduced by half. The solutions were diluted with deionized water to a final volume of 10 mL. Then, the solutions were filtered through a pre-cleaned syringe filter (cellulose nitrate membranes, 0.45-μm pore size; GVS Filter Technology, In-dianapolis, IN, USA), ensuring to discard the first 2.5 mL of the solution needed to pre-flush the filter, and collecting ~7.5 mL of the remaining solution into a new tube. All the filters were pre-washed with 30 mL of 2% HNO3to reduce blank values. Breast milk samples were diluted at
1:2, and probiotic culture samples were diluted at 1:2, 1:10, 1:20, or 1:100, using deionized water; stool samples were analysed without any further dilution. Ten blank solutions, consisting of deionized water and reagents (H2O2and HNO3), were treated concurrently with each
di-gestion of the sample set; this was done to subtract the background signal due to unreacted reagents, and to control for contributions from possible sample contaminants. A quadrupole inductively coupled plasma mass spectrometer (ICP-MS, model 820-MS; Bruker, Bremen, Germany), equipped with a collision-reaction interface (CRI) and glass nebulizer (0.4 mL min−1; Analytik Jena AG, Jena, Germany), was used
to determine total levels of75As-,112Cd-, and208Pb. The typical spectral
interferences in75As were reduced by using a CRI with 30 mL min−1He
and 70 mL min−1H
2(99.9995% purity; SOL Spa, Monza, Italy) as cell
gases to the sampler and skimmer cones, respectively. Further details on instrumental conditions and method parameters can be found in Astolfi et al. (2018)andConti et al. (2018). Six-point matrix-matched external standard calibration was performed in the 0.5–50 μg L−1range
for all elements by serially diluting a multi-standard stock solution of 1.000 ± 0.005 mg L−1of As, Cd, and Pb. To control for nebulizer
ef-ficiency, 5 μg L−1yttrium (Y) was prepared using a standard stock
so-lution (1000 ± 2 mg L−1; Panreac Química, Barcelona, Spain) and
used as internal standard for all the measurements. Y was successfully used as internal standard in our previous works (Campopiano et al., 2014;Astolfi et al., 2018;Conti et al., 2018). ICP-MS was tuned daily using 1% HNO3and 5 μg L−1Ba, Be, Ce, Co, In, Pb, Mg, Tl, and Th
prepared from a multi-standard stock solution (10.00 ± 0.05 mg L−1;
SpectroPure, Ricca Chemical Company, Arlington, TX, USA) to ensure optimal instrument performance.
The limits of detection (LODs) and limits of quantification (LOQs) were set at 3 and 10 times the standard deviation (SD) of 10 replicate blank determinations, respectively. The values of blanks, subjected to similar sample preparation and analytical procedures, were deducted from all measurements. For breast milk and infant stools, the LOD and LOQ values, respectively, were as follows: 1 and 2 μg kg−1for As, 0.1
and 0.2 μg kg−1 for Cd, and 2 and 4 μg kg−1 for Pb in breast milk
(Astolfi et al., 2018); 10 and 40 μg kg−1for As, 0.2 and 0.8 μg kg−1for
Cd, and 10 and 30 μg kg−1for Pb in infant stools. The values for
su-pernatants and pellets of bacterial cells were as follows: 0.1–152 μg L−1
and 0.3–507 μg L−1for As, 0.1–9 μg L−1and 0.3–28 μg L−1for Cd, and
1–17 μg L−1 and 3–58 μg L−1 for Pb in supernatants; 0.003–0.04 μg
(5 × 10¹⁰ bacterial cells)−1 and 0.009–0.1 μg (5 × 10¹⁰ bacterial
cells)−1 for As, 0.0004–0.006 μg (5 × 10¹⁰ bacterial cells)−1 and
0.001–0.02 μg (5 × 10¹⁰bacterial cells)−1for Cd, and 0.0004–0.005 μg
(5 × 10¹⁰ bacterial cells)−1 and 0.001–0.02 μg (5 × 10¹⁰ bacterial
cells)−1for Pb in pellets.
Standard reference materials [SRM 1954 Organic Contaminants in
Fortified Human Milk, National Institute of Standards and Technology (NIST), Gaithersburg, MD, USA] were used to validate our method for breast milk analysis, which was used as reported previously (Astolfi et al., 2018). This method provides satisfactory detection limits and good performance (recovery percentages 89–96%, coefficient of varia-tion < 6%, and relative repeatability < 14%) for determinavaria-tion of As, Cd, and Pb levels in breast milk. Due to the lack of certified reference materials for trace elements, the accuracy of the results obtained for stool, supernatant, and pellet samples was assessed by evaluating per-cent recovery (R%) using samples of the same matrix fortified with multi-standard solution. These fortified samples contained all the ele-ments at concentrations 20 times higher than those in the third cali-bration standard (2 μg L−1As, Cd, and Pb). These fortified samples
were also subjected to the same WBD treatment as the unfortified samples. R% was calculated using the same equation as that used for determination of U (Section 2.2.2), but in this case, C0 denotes the
concentration of elements in the spiked samples, and C1 denotes the
concentration of elements in native samples. The resultant values were in good agreement with the spiked values (As: 100 ± 3%, Cd: 105 ± 7%, and Pb: 98 ± 4% in infant stool; As: 104 ± 5% and 107 ± 6%, Cd: 102 ± 4% and 100 ± 3%, and Pb: 105 ± 7% and 102 ± 6% in supernatants and pellets, respectively).
2.3.2. Determination of total Hg levels
Total Hg determination was carried out via Advanced Mercury Analyzer (AMA-254, Altec Ltd., Prague, Czech Republic), which can be used to analyse a liquid or solid sample directly, without any sample preparation. Moreover, analysis by AMA-254 is rapid and less prone to contamination than that using other similar instruments. Briefly, each sample was dried and then thermally decomposed. The generated gaseous decomposition products were carried in an oxygen stream (99.995% purity; SOL Spa) through the catalytic section of the furnace filled with a catalyst and maintained at constant temperature of ap-proximately 750 °C. The vapours of Hg(0) were then selectively trapped on a gold-based amalgamator that was rapidly heated to release the mercury vapours. Mercury was detected using a single-wavelength atomic absorption spectrophotometer at 253.65 nm. The seven-point matrix-matched external standard calibration was performed by serially diluting a standard stock solution in 1% HNO3v/v to obtain solutions in
the concentration range of 0.1–2 μg L−1or 1–40 μg L−1; these solutions
were then used for the analysis of breast milk or stool samples, and supernatant or pellet samples obtained from in-vitro cultures, respec-tively. Deionized water was used for serial dilutions.
Breast milk and stool samples were thawed at 19 to 21 °C and im-mediately analysed using AMA-254. The supernatants and pellets from the binding experiments were thawed at 19 to 21 °C, digested using WBD (described inSection 2.3.1), filtered (cellulose nitrate membranes, 0.45-μm pore size; GVS Filter Technology, Indianapolis, IN, USA), and diluted with deionized water at 1:2 or 1:10, respectively. The drying and decomposition temperatures were set at 120 and 750 °C, respec-tively. Drying, decomposition, and waiting times were set for 100 μL (two repeats) of breast milk and 30 mg (one repeat) of stools at 70 s, 120 s, and 45 s; 100-μL (one repeat) of each digest of supernatant or pellet at 30 s, 100 s, and 30 s. Under these conditions, the Hg recovery level for all the spiked samples ranged from 96 to 109%, the coefficient of variation was < 10%, and relative repeatability was < 13%. These values are considered acceptable by other studies (Vacchina et al., 2017). R% was calculated using the same equation as that used to de-termine U% (Section 2.2.1), but in this case, C0 denotes the
con-centration of elements in the spiked samples, and C1denotes the
con-centration of elements in native samples. Internal quality controls (e.g., reagent blanks to monitor possible cross-contamination or memory ef-fects) were included in the analysis of total Hg content as described previously (Vacchina et al., 2017). The LODs and LOQs, calculated as 3 and 10 times the SD of blank determination (10 replicates), respec-tively, were 0.02 μg L−1and 0.1 μg L−1in breast milk, 0.7 μg kg−1and
2 μg kg−1in infant stools, 4 μg L−1and 15 μg L−1in supernatants, and
0.02 μg (5 × 10¹⁰bacterial cells)−1 and 0.06 μg (5 × 10¹⁰ bacterial
cells)−1in pellets, respectively. The LOQs, obtained for total Hg in
breast milk, were in the same range as previously found in studies using AMA (Ursinyova and Masanova, 2005;Vacchina et al., 2017). 2.4. Assessment of risk posed to infants by breast milk
The health-based guidance values for Cd, Hg, and MeHg are pro-vided as provisional tolerable weekly intake (PTWI) at 2.5 μg kg−1body weight (BW)/week (EFSA, 2012a), 4 μg kg−1BW/
week (JECFA, 2011a), and 1.6 μg kg−1BW/week (JECFA, 2004). The
values for As and Pb are provided as benchmark dose lower bound (BMDL), which uses a lower confidence level at 3.0 μg kg−1BW/day
and 21.0 μg kg−1BW/week (JECFA, 2011a), and at 0.5 μg kg−1BW/
day and 3.5 μg kg−1BW/week (developmental toxicity in children;
EFSA, 2010), respectively. In our study, the risks of exposure to Cd, Hg, and MeHg through breast milk were assessed by comparing element intake with PTWI and expressing it as a percentage, as shown in Eq.(1). Risk may exist when the percentage is higher than 100. For As and Pb, risk is assessed by estimating the margin of exposure (MOE). MOE is defined as a reference point derived from the dose-response relation-ship, and can be calculated by dividing BMDL by estimated element intake, as shown in Eq.(2)(Rebelo and Caldas, 2016). In order to not to represent a public health concern, an MOE should be as high as possible (≥50 for As, based on BMDL0.5, and ≥10 for Pb, based on BMDL1)
(EFSA, 2005, 2010, 2014). It is important to emphasize, however, that MOE is not a quantification of risk for exposure to a chemical; MOE is only an indication of the level of concern (Benford, 2016;Rebelo and Caldas, 2016). For exposure assessment, the daily or weekly intakes (μg kg−1BW/day or μg kg−1BW/week) of As, Cd, Hg, MeHg, and Pb
were calculated for each breast-milk sample, obtained at different stages of lactation, and for each child, according to Eq.(3). MeHg was not measured, but was considered to represent 50% of the total Hg (THg) present in accordance withRebelo and Caldas (2016). The fol-lowing equations were used:
= ×
%PTWI weekly intake 100/PTWI (1)
=
MOE weekly BMDL/weekly intake (2)
= ×
Intake milk consumption [toxic element]/BW of infant (3) where “milk consumption” is the average amount of breast milk (L) consumed per infant per day or week; toxic element is the mean con-centration of As, Cd, Hg (MeHg), and Pb (μg L−1) detected in the
col-lected breast milk samples; and “BW” is the body weight (kg) of the infant. The average daily consumption of breast milk by nursing infants was 143 mL/kg-day (1.00 L/kg-week) at 0 to 7 days after birth (t0), 156 mL/kg-day (1.90 L/kg-week) at 2 weeks after birth (t15), and 150 mL/kg-day (1.05 L/kg-week) at 4 weeks after birth (t30) as re-ported in Tables 15–16 of the U.S. Environmental Protection Agency (U.S. EPA, 2011). The body weight at t0 lactation stage corresponds to the body weight at birth (3.10 ± 0.71 kg for the control groups and 3.34 ± 0.49 kg for the group treated with probiotic). For the other lactation stages (t15 and t30), body weight was calculated separately for boys and girls (9 boys and 9 girls in the control group, and 10 boys and 3 girls in the experimental group) using Tables 38 and 49 provided by the World Health Organization (WHO, 2006).
2.5. Statistical analysis
Statistical analyses of element concentrations recovered from breast milk and infant stools were performed using IBM-SPSS Statistics for Windows (version 25.0, released 2017; IBM Corp., Armonk, NY, USA). Values below the LOD were designated as half the LOD value, as re-commended for small datasets (Clarke, 1998; Hewett and Ganser,
2007). First, we calculated the percentage of values under the LOD for each monitored element. When the percentage under the LOD was ≥30%, the element was excluded from statistical analysis. For the other elements, a descriptive statistical evaluation was carried out by calcu-lating the most important descriptors such as arithmetic mean, median, minimum and maximum level, and 25–75th percentile. Prior to other analyses, the normality of distribution of each elemental concentration was evaluated via Kolmogorov-Smirnov test. In all cases, the distribu-tion was normal after natural logarithmic data transformadistribu-tion. Thus, univariate analyses were conducted using parametric techniques on ln-transformed values (t-test for independent samples or ANOVA with Bonferroni post-hoc tests). The results were considered statistically significant at p-values < 0.05. A t-test was used to compare differences in the level of each element between control and experimental groups, while ANOVA was used to evaluate differences in the concentrations of each element recovered at each stage of lactation (t0, t15, t30). Ken-dall's tau coefficients, at a significance level of 0.05, were used for correlation analysis of elemental levels per each stage of lactation. 3. Results and discussion
3.1. In-vitro study 3.1.1. Tolerance assessment
Because of the composition of microbial cell walls, microbial cells are natural adsorbents of metal ions (Blackwell et al., 1995). Various studies have shown that certain microorganisms can adsorb, tolerate, and/or bioaccumulate toxic elements, thereby preventing adverse ef-fects on human health (Mrvčić et al., 2012;Gerbino et al., 2014). The bacterial strains evaluated in our study were able to tolerate and sur-vive at up to 5 mg L−1As, Cd, and Pb, and at up to 2 mg L−1Hg, for
24 h in MRS broth (C1 concentration, Fig. 1). Dose-dependent toxic
activity was observed at higher concentrations of metal ions. At a concentration of 10 mg L−1 (C
2 concentration, Fig. 1), Cd reduced
bacterial viability by 55%. However, at the highest concentration of 50 mg L−1(C
3concentration,Fig. 1), the other elements exhibited low
toxicity; bacterial viability was inhibited by 29, 25, and 20% by As, Hg, and Pb, respectively. Bacteria exposed to 5 mg L−1As, Cd, and Pb, and
2 mg L−1Hg, in water and broth showed no inhibition of tolerance at
1 h post-exposure. These results agree with those obtained in a study examining 53 different lactic-acid bacteria, in which 11 strains showed high tolerance and ability to bind Cd and Pb from water and MRS (De Boever et al., 2000).
3.1.2. Element-binding assays
The binding of elements by bacteria is a complex process that de-pends on characteristics of the elements, physiological properties of the bacterial strain, and physico-chemical characteristics of the environ-ment such as pH, temperature, contact time, and eleenviron-ment concentration (Mrvčić et al., 2012). pH is one of the key parameters that can influence the biosorption of elements. As pH value changes in aqueous solutions, the chemical characteristics of metal ions, and competition between metal cations and protons for cell-wall binding sites, can also change. At pH < 3, the binding of metal ions is negligible and increases with in-crease of the initial pH value to 6 (Mrvčić et al., 2012). With increases in pH, the solubility of metal ions decreases, and precipitation of metal ions can occur (Mrvčić et al., 2012). For these reasons, we opted to perform in-vitro assessments at the two most common pH levels of 5 (in water) and 6 (in MRS broth) at 37 °C. Binding assays were performed using a constant number of bacteria, similar to that found in the human intestine (5 × 10¹⁰ bacteria mL−1), because variation in microbial
biomass concentration alters the contact area and number of possible bonding sites for metal ions. In particular, increasing the concentration of microbial biomass increases the amount of bound metal ions (Mrvčić et al., 2012). In our study, the best values of U% for Cd (72%) and Pb (64%) were obtained in water at 1 h, and for Hg in broth at 24 h (85%); U% for As under all conditions was very low. The binding of elements to probiotic bacteria is a rapid process. In water, the binding process re-quires only 1 h. Previous studies (Halttunen et al., 2007;Teemu et al., 2008) show that the genera Lactobacillus and Bifidobacterium can bind Pb and Cd in solution in 5 min to 1 h, and that the elements are strongly sequestered by the cell even at 48 h after the initial binding takes place. Ibrahim et al. (2006)compared the abilities of Lactobacillus rhamnosus LC-705 and Propionibacterium freudenreichii to bind and absorb Pb and Cd in solution, and found that these bacteria can rapidly bind maximal amounts of metal after only 1 h of exposure. Daisley et al. (2018) showed that several strains of lactobacilli can significantly reduce the amount of Pb and Cd in solution. In that study, the relative binding capacity of LGR-1 strain decreased at higher concentrations of Pb and Cd (Daisley et al., 2018). Conversely, our results indicate that the binding efficiency of probiotic strains grown in consortia increases with increasing Pb concentration but decreases with increasing concentra-tion of Cd. These differences are likely due to variaconcentra-tions in experimental conditions used in these studies.
Due to competition among metal ions, the presence of other ions increases the ionic strength of solutions and negatively affects the process of biosorption (Mrvčić et al., 2012). Consequently, the best
60 40 -20 0 40 20 60 80 100 % U %I As Cd Hg Pb
Water Broth Broth Broth Broth
1 h, C1 1 h, C1 24 h, C1 24 h, C2 24 h, C3
Fig. 1. Bacterial capacity to bind toxic elements [uptake percentage (U%); mean ± standard deviation] in Man, Rogosa and Sharpe (MRS) broth supplemented with 0.05% w/v L-cysteine hydrochloride (cys) or in deionized water. Inhibition of bacterial viability (I%), assessed using tolerance assays in broth (MRS/cys), is shown below. The concentrations used were: C1: As, Cd, Pb at
5 mg L−1and Hg at 2 mg L−1; C2: As, Cd, Hg and Pb at
10 mg L−1; C3: As, Cd, Hg, and Pb at 50 mg L−1(I% of Cd
was not measured at this concentration).
values for U% were obtained at pH 5 in water. Indeed, the MRS broth is rich in other elements such as K (from dipotassium hydrogen phos-phate, 2.0 g L−1), Na (from sodium acetate 3H
2O, 5.0 g L−1), Mg (from
magnesium sulphate 7 H2O, 0.2 g L−1), and Mn (from manganese
sul-phate 4H2O, 0.05 g L−1) (Sharpe et al., 1966). In a previous study, the
best values for binding were achieved with Cd and Pb ions, but not with those of As (Mrvčić et al., 2012). Unlike Pb and Cd, As is a negatively charged species, which may be why probiotic bacteria cannot readily bind As (U% equal to approximately 4%).
Indeed, the bacterial binding of metal ions results from electrostatic interactions between the net negative surface charge of the bacterial cell and the positively charged metal ion (Monachese et al., 2012). To the best of our knowledge, few studies have reported on the ability of lactobacilli or gut bacteria to bind and absorb Hg (Kinoshita, 2019; Kinoshita et al., 2013;Monachese et al., 2012). Our in-vitro procedures show that > 79% of Hg is sequestered by bacteria in both water and broth at concentrations ranging from 2 mg L−1to 50 mg L−1. During
this process, the bacteria showed a high tolerance for Hg at all the as-sessed concentrations and time points (1 and 24 h), and < 25% re-duction in bacterial viability was observed at higher ionic concentra-tions. It is possible that the bacteria can also bind and sequester cationic Hg in the human gastrointestinal tract. Organic mercury, the main source of which is fish, is fat soluble, readily absorbed across the in-testinal epithelium, and can be bioaccumulated. Bacterial detoxification of organic Hg involves the conversion of methylated Hg to inorganic Hg2+that is not as readily absorbed by the gastrointestinal tract, and
then to Hg0, which is poorly absorbed (Monachese et al., 2012).
3.2. In-vivo study
3.2.1. Levels of toxic elements in breast milk
The levels of As, Cd, Hg, and Pb in breast milk samples from women supplemented with placebo and the probiotic product were analysed, and the differences in the concentration of toxic elements in colostrum (t0), transitional (t15), and mature milk samples (t30) were compared between the two groups (Table S1, Supplementary Material). As was excluded from statistical analysis because the LOD was ≥30%. No significant differences in the mean levels of Cd, Hg, or Pb were observed between the two groups at any of the time points. Therefore, for all the time points, milk samples from the control group and the experimental group were considered a single population.
Table 1shows the statistical data for As, Cd, Hg, and Pb in breast milk samples, and summarizes the literature findings related to the contamination of human milk with these elements.
3.2.1.1. Arsenic. As was detected in 45% of colostrum and transitional milk samples, and in 62% of mature breast milk samples, with a mean level of 1.4 ± 2.3 μg L−1, 1.7 ± 2.9 μg L−1, and 1.3 ± 1.3 μg L−1,
respectively. When present, As concentrations exceeded the limit of 0.6 μg L−1 reported by the World Health Organization (WHO/IAEA,
1989). The observed levels were higher than those reported in Germany for all lactation stages (Sternowsky et al., 2002), and in Italy and Sweden for mature milk (Miklavčič et al., 2013;Björklund et al., 2012). As concentrations were lower than those reported in Portugal for colostrum and mature milk (Almeida et al., 2008) and in Poland for mature milk (Klein et al., 2017); however, the ranges detected in our study (< 1–12.1 μg L−1and < 1–5.7 μg L−1) were comparable to those
reported. These differences in the range of, and mean, concentration levels of As in breast milk among the various countries are likely due to multiple factors such as exposure of lactating mothers to As through contaminated drinking water and diet. Indeed, drinking water can be naturally high in As, typically present in its inorganic form (EFSA, 2009a; JECFA, 2011a). Furthermore, As in breast milk is associated with frequent consumption of fish and seafood (Miklavčič et al., 2013). We observed no statistically significant difference in As levels at the stages examined in our study; these results are in agreement with those
ofSternowsky et al. (2002).
3.2.1.2. Cadmium. Cd was detected in 93, 90, and 79% of colostrum, transitional, and mature breast-milk samples, respectively. The mean Cd concentrations (0.9 ± 1.1 μg L−1, 0.37 ± 0.28 μg L−1, and
0.36 ± 0.51 μg L−1 in colostrum, transitional, and mature
breast-milk, respectively) were below the limit of 1 μg L−1set by theWHO/
IAEA, 1989and the Italian reference range (Alimonti et al., 2010). The content of Cd in colostrum was comparable to that observed in the breast milk of nursing mothers in Austria and Croatia (Krachler et al., 1998;Grzunov Letinić et al., 2016), but higher than those reported in Greece, Poland, and Slovakia (Leotsinidis et al., 2005; Poniedziałek et al., 2018; Ursinyova and Masanova, 2005). In transitional milk samples, Cd levels were comparable to those reported in Austria (Krachler et al., 1998), lower than those reported in Croatia (Grzunov Letinić et al., 2016), and higher than those reported in Greece (Leotsinidis et al., 2005). In mature milk samples, Cd levels were comparable or lower than those reported in other studies from Italy and Europe, except for those byDe Felip et al. (2014)andBjörklund et al. (2012). These regional differences in Cd concentrations may stem from various levels of exposure to Cd via diet [legumes, cereals, and potatoes (0.02–0.13 mg kg−1);EFSA, 2009b] and cigarette smoke (CDC, 2009;
ATSDR, 2012).
3.2.1.3. Mercury. Hg was detected in all the colostrum samples and in 97% of transitional and mature milk samples. The mean values of Hg (1.5 ± 1.3 μg L−1, 0.52 ± 0.44 μg L−1, and 0.57 ± 0.42 μg L−1),
assessed at each time point, were below the limits of 1 μg L−1set by
theWHO (1989). Hg concentrations were comparable to those reported by other studies from Italy and Europe, except for those reported in Croatia, for all the lactation stages (Grzunov Letinić et al., 2016). Specifically, the Hg concentrations reported in Austria for colostrum (Rossipal and Krachler, 1998), and in Italy for mature milk (Abballe et al., 2008), are higher than the values obtained in our present study. The high levels measured in Croatia were associated with seafood intake, a typical dietary habit observed in coastal areas (Grzunov Letinić et al., 2016).
3.2.1.4. Lead. In 83% of colostrum samples and in 69% of transitional and mature breast-milk samples, the levels of Pb were above the LOD, with a mean concentration of 7.5 ± 7.0 μg L−1, 6.1 ± 8.4 μg L−1, and
2.4 ± 1.3 μg L−1, respectively. The mean levels at t0 and t15 exceeded
the limit of 5 μg L−1set by theWHO (1989), but were within the Italian
reference range (Alimonti et al., 2010). The concentration of Pb in our samples was greater than those reported in other European countries. Only studies from Italy, Poland, and Spain reported higher Pb levels in mature breast milk than those detected in our samples (Coni et al., 2000; Winiarska-Mieczan, 2014; García-Esquinas et al., 2011). Air pollution is a major source of Pb exposure (Yurdakök, 2015). Urban pollution and industrial activities also influence Pb content in food (Yurdakök, 2015). The content of Pb in breast milk is related to diet (consumption of fish and potatoes) and lifestyle (smoking tobacco) (Gundacker et al., 2002;García-Esquinas et al., 2011;Yurdakök, 2015). Furthermore, inadequate intake of calcium during lactation can determine the release of Pb from the mother's bony deposits (Ettinger et al., 2009).
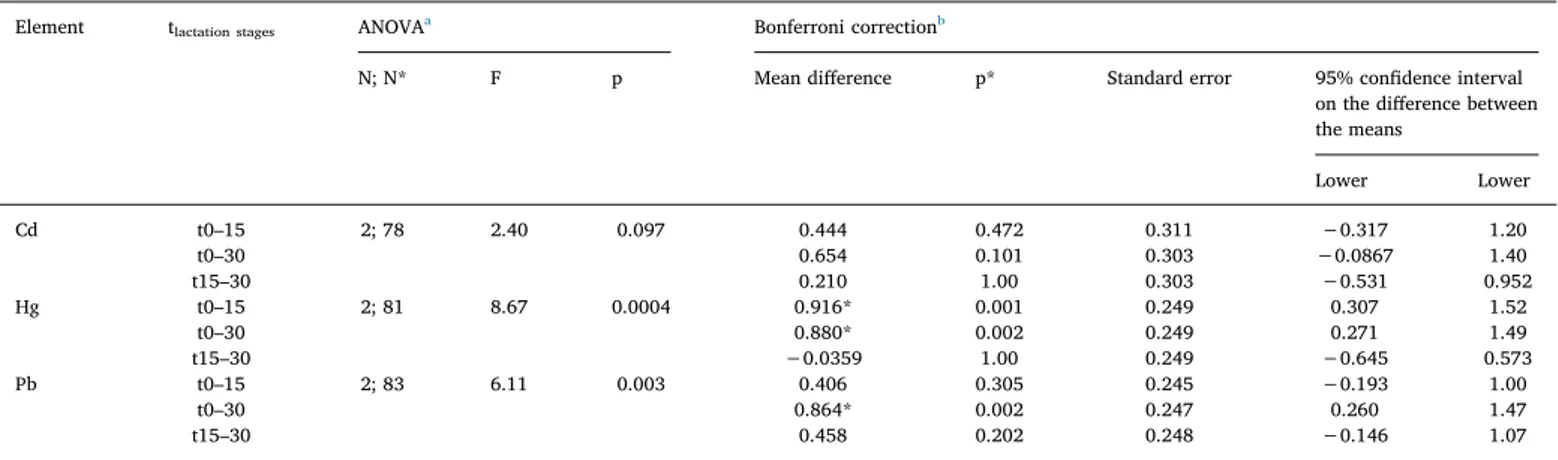
3.2.1.5. Differences in concentration levels during lactation period. Table 2 shows the differences in the levels of Cd, Pb, and Hg in breast milk during the time of lactation. The concentrations of Cd, Hg, and Pb decreased during the first month of lactation; those of Hg and Pb in breast milk samples were significantly different (p < 0.05) at different sampling times. Hg levels were significantly higher (p* < 0.05) at t0 compared with those sampled at t15 and at t30, while the level of Pb was significantly higher (p* < 0.05) at t0 compared with that at t30. Although the concentration of Cd was reduced by approximately
two-Table 1 Percentage of data points below the limit of detection (%N < LODs), concentration (μg L −1)of toxic elements in breast milk samples obtained at different stages of lactation [colostrum (t0), transitional (t15), and mature milk samples (t30)], and comparison with other studies and reference ranges (μg kg −1 or μg L −1 ) a. Element This work
Italian reference range
b Levels in Italy Levels in Europe WHO c reference range Stage of lactation %N < LOD Mean ± SD Median Range (min–max) Range (percentile 25°–75°) Mean ± SD or median (range) References Mean ± SD or median (range) Country; references As t0 55 1.4 ± 2.3 < 1 < 1–12.1 < 1–1.28 – – – 0.15 (0.15–1.1) <1.2 7.8 ± 2.2 (3.6–14.0) Germany; Sternowsky et al., 2002 Poland; Poniedziałek et al., 2018 Portugal; Almeida et al., 2008 0.2–0.6 t15 55 1.7 ± 2.9 < 1 < 1–12.2 < 1–1.1 – – 0.15 (0.15–0.8) Germany; Sternowsky et al., 2002 t30 38 1.3 ± 1.3 < 1 < 1–5.7 < 1–1.3 < 1 (< 1−12) < 3 0.3 (0.04–12) Astolfi et al., 2018 De Felip et al., 2014 Miklavčič et al., 2013 0.15 (0.15–2.8) 3.86 ± 1 (3.03–7.9) 5.8 ± 1.1 (4.2–7.8) 0.55 ± 0.70 (0.041–4.6) Germany; Sternowsky et al., 2002 Poland; Klein et al., 2017 Portugal; Almeida et al., 2008 Sweden; Björklund et al., 2012 Cd t0 7 0.9 ± 1.1 0.6 < 0.1–5.4 0.2–1.0 1–5 – – 1.1 (< 0.18–5.0) 0.88 (0.60–1.2) e 0.19 ± 0.15 (n.d.–0.70) < 0.26 0.43 (n.d.–1.7) Austria; Krachler et al., 1998 Croatia; Grzunov Letinić et al., 2016 Greece; Leotsinidis et al., 2005 Poland; Poniedziałek et al., 2018 Slovakia; Ursinyova and Masanova, 2005 < 1 t15 10 0.37 ± 0.28 0.29 < 0.1–1.17 0.16–0.47 – – 0.3 (< 0.18–0.8) 0.76 (0.58–1.2) d 0.14 ± 0.12 (nd–0.49) Austria; Krachler et al., 1998 Croatia; Grzunov Letinić et al., 2016 Greece; Leotsinidis et al., 2005 t30 21 0.36 ± 0.51 0.18 < 0.1–2.0 0.11–0.30 < 0.5 e 0.4 ± 0.6 (0.1–2.2) 0.8± 0.2 < 0.1 Abballe et al., 2008 Astolfi et al., 2018 Coni et al., 2000 De Felip et al., 2014 < 0.18 (< 0.18–0.6) 0.96 (0.68–1.3) d 2.1 ± 2.1 (0.21–7.35) 1.31 (1.15–1.41) f 0.086 ± 0.045 (0.028–0.27) Austria; Krachler et al., 1998 Croatia; Grzunov Letinić et al., 2016 Poland; Winiarska-Mieczan, 2014 Spain; García-Esquinas et al., 2011 Sweden; Björklund et al., 2012 Hg t0 0 1.5 ± 1.3 0.9 0.3–5.6 0.6–1.9 – – – 1.59 ± 1.2 7.7 ± 11 3.9 (2.9–7.6) d 0.94 (n.d.–4.74) 0.29 (0.06–2.1) Austria; Gundacker et al., 2002 Austria; Rossipal and Krachler, 1998 Croatia; Grzunov Letinić et al., 2016 Slovakia; Ursinyova and Masanova, 2005 Sweden; Björnberg et al., 2005 1.4–1.7 t15 3 0.52 ± 0.44 0.36 < 0.02–1.59 0.20–0.56 – 3.6 (3.2–4.5) d Croatia; Grzunov Letinić et al., 2016 t30 3 0.57 ± 0.42 0.43 < 0.02–1.36 0.25–0.92 2.63–3.53 e < 0.3 0.2 (< 0.045–28) 0.3 ± 1.3 (0–28.3) Abballe et al., 2008 De Felip et al., 2014 Miklavčič et al., 2013 Valent et al., 2013 0.2 (0.1–2) 0.8 ± 1.2 1.8 (0.98–3.4) d 0.2 (< 0.045–2.4 or 2.9) g 0.6 (< 0.045–12) 0.53 (0.45–0.62) f 0.14 (0.07–0.37) Austria; Gundacker et al., 2010 Austria; Rossipal and Krachler, 1998 Croatia; Grzunov Letinić et al., 2016 Croatia or Slovenia; Miklavčič et al., 2013 Greece; Miklavčič et al., 2013 Spain; García-Esquinas et al., 2011 Sweden; Björnberg et al., 2005 (continued on next page )
Table 1 (continued ) Element This work
Italian reference range
b Levels in Italy Levels in Europe WHO c reference range Stage of lactation %N < LOD Mean ± SD Median Range (min–max) Range (percentile 25°–75°) Mean ± SD or median (range) References Mean ± SD or median (range) Country; references Pb t0 17 7.5 ± 7.0 5.2 < 2–22.4 2.1–10.0 6–25 – – 1.63 ± 1.7 1.0 (0.2–5.6) 5.0 (2.6–10) d 0.48 ± 0.60 (n.d.–2.36) 1.3 ± 1.8 (1.0–15.1) 1.55 ± 1.4 (0.06–5.43) 4.7(n.d.–24.4) Austria; Gundacker et al., 2002 Austria; Krachler et al., 1998 Croatia; Grzunov Letinić et al., 2016 Greece; Leotsinidis et al., 2005 Poland; Poniedziałek et al., 2018 Portugal; Almeida et al., 2008 Slovakia; Ursinyova and Masanova, 2005 2–5 t15 31 6.1 ± 8.4 2.5 < 2–35.3 < 2–6.4 – – 2.0 (< 0.12–8.7) 3.4 (1.9–5.6) d 0.15 ± 0.25 (n.d.–0.94) Austria; Krachler et al., 1998 Croatia; Grzunov Letinić et al., 2016 Greece; Leotsinidis et al., 2005 t30 31 2.4 ± 1.3 2.5 < 2–6.2 < 2–3.0 0.85–1.07 e 2 ± 2 (< 2–7) 13 ± 6 2.59–5.99 Abballe et al., 2008 Astolfi et al., 2018 Coni et al., 2000 De Felip et al., 2014 1.5 (< 0.12–9.9) 2.6 (1.7–4.7) d 1.02 ± 0.26 (0.52–1.44) 6.3 ± 4.6 (0.49–12) 0.94 ± 1.0 (0.07–4.03) 15.6 (12.9–18.7) f 1.5 ± 0.90 (0.74–6.4) Austria; Rossipal and Krachler, 1998 Croatia; Grzunov Letinić et al., 2016 Poland; Klein et al., 2017 Poland; Winiarska-Mieczan, 2014 Portugal; Almeida et al., 2008 Spain; García-Esquinas et al., 2011 Sweden; Björklund et al., 2012 nd: not detected. aDifferences in concentrations of trace elements in human milk examined using mass-basis (μg kg −1), and compared with concentrations examined using volume-basis (μg L −1), are negligibly small because the density of human milk is approximately 1.03 gmL −1 (EPA, 2011). Therefore, concentrations of trace elements in human milk, expressed in μg kg −1 or μg L −1,have the same numerical values. bItalian reference range by Alimonti et al. (2010) .The data refer to the 25th–75th percentiles and 36 mothers. cJoint FAO/WHO Expert Committee on Food Additives ( JECFA, 1989 ). This was a study on composition of human milk acquired at approximately 3 months after the birth of the child. dResults are presented as median (interquartile range). The data for Cd and Pb are reported for non-smokers; the data reported for Hg assume 1–2 instances of seafood consumption per week. eThe values for Cd were < LOQ for all areas of Venice with low, medium, and high consumption (LC, MC, and HC) of local fish and fishery products, and in Rome. fResults are reported as geometric mean (at 95% confidence interval). gMedian (range) levels in breast milk acquired from Slovenian, Croatian, and Greek women were 0.2 (< 0.045–2.9), 0.2 (< 0.045–2.4), and 0.6 (< 0.045–12), respectively.
thirds in samples of transitional and mature milk compared with that in colostrum samples, the difference was not significant, perhaps due to the high variability of values.
In general, higher elemental concentrations are found in the colos-trum fraction than in transitional or mature milk (Krachler et al., 1998; Rossipal and Krachler, 1998; Björnberg et al., 2005; Almeida et al., 2008; Grzunov Letinić et al., 2016). This occurs because colostrum, transitional, and mature milk contain different levels of protein, fat, and other ligands that can bind trace elements. Elements principally bind to proteins; thus, a physiological decrease in the levels of proteins and other ligands during the course of lactation determines a reduction in the content of these elements in breast milk (Ballard and Morrow, 2013; EPA, 2011). Our results show that the levels of Hg and Cd were reduced by approximately two thirds after 15 days of lactation, while Pb was reduced by two thirds only after 1 month.
As shown inTable 3, examining the different breastfeeding stages separately enabled us to highlight a significant positive correlation (p < 0.01) between the levels of Cd and Pb for all three stages of lactation. This is likely because Cd and Pb are equally distributed among the low-molecular-weight components present in breast milk, while Hg can interact with a broader range of milk proteins (Gundacker and Zödl, 2005;Rebelo and Caldas, 2016). The significant correlation between Pb and Cd is likely due to their common source and equal distribution among the low-molecular-weight components present in human milk. Much of Pb and Cd in breast milk is not due to mother's exposure during lactation (Yurdakök, 2015). In fact, during the mobi-lization of calcium for foetal skeletal development, which occurs in maternal bones during pregnancy, Pb and Cd can enter maternal blood
circulation (Yurdakök, 2015), resulting in the transfer of some Pb and Cd into breast milk (Yurdakök, 2015).
3.2.2. Levels of toxic elements in newborn stools
We compared the concentrations of toxic elements in stools of new-borns from experimental and control groups; the stools were obtained concurrently with the sampling of breast milk at t0, t15, and t30 (Table S2, Supplementary Material). As and Pb were excluded from statistical ana-lysis because their levels were below the LOD (Table 4). Hg faecal levels were similar between the two groups, while that of Cd was significantly different (p = 0.006) between the two populations at t15. In particular, the mean Cd concentration was significantly lower in the stools of new-borns whose mothers were administered the probiotic product.
Table 4shows the levels of As, Cd, Hg, and Pb in infant stool samples, and summarizes the literature data related to the presence of these toxic elements in newborn stools. Measuring the concentration of toxic elements in the meconium of newborns allows for evaluation of intrauterine ex-posure (Ramirez et al., 2000;Ostrea Jr et al., 2002;Turker et al., 2006; Unuvar et al., 2007;Esteban and Castaño, 2009); however, few studies have evaluated this matrix. Currently, there are no available data on the content of toxic elements in faecal samples obtained in Italy, and few studies have reported on the content of toxic elements in faecal samples obtained in other European countries. Therefore, we compared the results generated in this study with those reported outside of the European con-tinent. We detected As in only 14% of our samples (10% in meconium, 2% at t15, and 2% at t30) with a mean level < 10 μg kg−1for all the
sam-pling time points. This value is lower than those reported in Taiwan and Turkey (Jiang et al., 2014;Hamzaoglu et al., 2014).
Cd was detected in all our samples, with a mean level of 8.5 ± 1.0 μg kg−1and 9.7 ± 2.6 μg kg−1in the meconium of control newborns
of placebo-treated and probiotic-treated mothers, respectively. These values are higher than those reported in the literature, with the ex-ception of those obtained in Turkey (Hamzaoglu et al., 2014). Hg was also detected in all the samples, with an overall mean level of 33 ± 29 μg kg−1. This value was higher than those reported in other
countries, but lower than that obtained in Taiwan, where the frequency of fish intake may influence Hg concentrations (Jiang et al., 2014).
Finally, Pb was detected in 61% of all samples (18% in meconium, 21% at t15, and 22% at t30) with an overall mean level of 21 ± 18 μg kg−1. The mean level of Pb in meconium
(17 ± 14 μg kg−1) was higher than those reported in Austria and
Canada (Gundacker et al., 2002;Arbuckle et al., 2016), but lower than those reported in Taiwan and Turkey (Jiang et al., 2014;Türker et al., 2006;Hamzaoglu et al., 2014).
Table 2
Comparison of toxic-element concentrations in samples of colostrum (t0), transitional milk (t15), and mature milk (t30). Element tlactation stages ANOVAa Bonferroni correctionb
N; N* F p Mean difference p* Standard error 95% confidence interval
on the difference between the means Lower Lower Cd t0–15 2; 78 2.40 0.097 0.444 0.472 0.311 −0.317 1.20 t0–30 0.654 0.101 0.303 −0.0867 1.40 t15–30 0.210 1.00 0.303 −0.531 0.952 Hg t0–15 2; 81 8.67 0.0004 0.916* 0.001 0.249 0.307 1.52 t0–30 0.880* 0.002 0.249 0.271 1.49 t15–30 −0.0359 1.00 0.249 −0.645 0.573 Pb t0–15 2; 83 6.11 0.003 0.406 0.305 0.245 −0.193 1.00 t0–30 0.864* 0.002 0.247 0.260 1.47 t15–30 0.458 0.202 0.248 −0.146 1.07
a ANOVA was used to compare variability in element concentration within the groups. Values (F) were obtained using N-1 (N = number of lactation stages) and
N*-3 degrees of freedom (N* = number of valid data points) at significance level α = 0.05.
b Bonferroni post-hoc test was used to compare differences in mean elemental levels in breast-milk samples at different stages of lactation.
Table 3
Kendall's tau-b correlation (K) of toxic-element concentrations in samples of colostrum (t0), transitional milk (t15), and mature milk (t30).
Parameters t0 t15 t30 Cd Hg Cd Hg Cd Hg Hg K 0.067 1.00 0.131 1.00 0.196 1.00 p 0.640 – 0.362 – 0.148 – N 26 28 26 28 28 28 Pb K 0.542a 0.115 0.496a 0.072 0.355a 0.029 p 0.0001 0.395 0.0004 0.593 0.009 0.834 N 26 28 26 28 28 28
a Values (K) were obtained using N (N = number of cases) at significance
level α = 0.01 (two-tailed).
3.2.2.1. Differences in concentration levels over time. No significant differences in faecal Hg and Cd over time were observed (Table 5).
In contrast with results obtained for breast milk, elemental levels did not decrease in stools sampled from birth to 1 month of age; therefore, the samples were combined for correlation analysis (Table 6). No significant correlation (p > 0.05) was found between faecal Cd and Hg concentrations, and between those in infant stools and breast
milk, sampled at all the stages of lactation (Table 6).
3.3. Characterization of intake of, and exposure to, toxic elements in infants For each lactation time, the mean levels of As, Cd, Hg, and Pb, detected in breast-milk samples (Table 1), were used to estimate the average daily or weekly intake of each toxic element in infants at Table 4
Percentage of data points below the limits of detection (%N < LODs), concentration (μg kg−1) of toxic elements in infant stools sampled at different times (t0, t15,
and t30), and comparison of our results with those obtained in other studies.
Element Values obtained in the present study Levels of toxic elements in samples of newborn stools examined in previous studies
Stage of lactation %N < LODs
(over time) Mean ± SD Median Range(min–max) Range(percentile 25°–75°)
Mean ± SD or median (range) Country; referencesa
As t0 68 < 10 < 10 < 10–41.7 < 10–10.7 37.3 (28.6)**
60 (< 5–110) or 70 (< 5–102)* Turkey;Taiwan;Hamzaoglu et al., 2014Jiang et al., 2014
t15 96 < 10 < 10 < 10–11.5 < 10 t30 93 < 10 < 10 < 10–15 < 10 Overall 86 < 10 < 10 < 10–41.7 < 10 Cdb t0 C 0 9.7 ± 2.6 9.5 5.3–14.8 7.9–10.6 < 4 (< 4–130) 7.27 (10.9)** 30 (< 5–135) or 35.5 (< 5–69)* 2.3 (55.6)**
Canada;Arbuckle et al., 2016
Taiwan;Jiang et al., 2014
Turkey;Hamzaoglu et al., 2014
Turkey;Türker et al., 2006
E 0 8.5 ± 1.0 8.3 6.9–9.9 7.8–9.4 t15 C 0 12.3 ± 3.4 11.2 8.4–20.9 10.1–14.4 E 0 9.1 ± 2.7 8.4 6.2–14.5 7.1–10.1 t30 C 0 12.2 ± 4.8 11.1 6.1–22.7 8.6–15.3 E 0 10.4 ± 2.7 10.3 4.8–14.0 9.5–11.3 Overall C 0 11.4 ± 3.9 10.5 5.3–22.7 8.9–13.8 E 0 9.3 ± 2.3 9.3 4.8–14.5 7.6–10.2 Hg t0 0 38 ± 30 36 8–86 21–41 4.0 (0.4–128) < 10 (< 10–140) 82.6 (43.9)** < 5 (< 5–160) or < 5 (< 5–44)*
Austria; Gundacker et al., 2002 Canada;Arbuckle et al., 2016
Taiwan;Jiang et al., 2014
Turkey;Hamzaoglu et al., 2014
t15 0 28 ± 28 18 1–72 11–37 t30 0 34 ± 37 27 4–81 6–55 Overall 0 33 ± 29 29 1–86 8–45 Pb t0 35 17 ± 14 13 < 10–57 < 10–27 15.5 (1.9–103) < 4 (< 4–480) 19.4 (24.0)** 84 (< 5–429) or 41 (< 5–330)* 46.5 (1400)**
Austria;Gundacker et al., 2002
Canada;Arbuckle et al., 2016
Taiwan;Jiang et al., 2014
Turkey;Hamzaoglu et al., 2014
Turkey;Türker et al., 2006
t15 39 24 ± 20 26 < 10–89 < 10–34
t30 37 22 ± 19 20 < 10–72 < 10–36
Overall 37 21 ± 18 18 < 10–89 < 10–32
a The data byHamzaoglu et al. (2014)refer to industrial and not industrial districts (*).Jiang et al. (2014)andTürker et al. (2006)show the inter-quartile range in
brackets (**). The data byTürker et al. (2006)are reported in mg kg−1.
b The data for Cd are reported separately for two populations [Control (C) and Experimental (E)], because there was a significant difference between the two
groups.
Table 5
Cd and Hg concentrations in infant stools sampled at different time points (T).
Elementa T ANOVAb Bonferroni correctionc
N; N* F p Mean difference p* Standard error 95% confidence interval
on the difference between the means Lower Lower Control Cd t0–15 2; 49 2.95 0.062 −0.248 0.108 0.080 −0.516 0.0211 t0–30 −0.200 0.107 0.203 −0.464 0.0653 t15–30 0.0479 0.107 1.00 −0.217 0.313 Experimental Cd t0–15 2; 31 1.27 0.297 −0.0376 0.104 1.00 −0.304 0.228 t0–30 −0.169 0.110 0.408 −0.449 0.111 t15–30 −0.131 0.110 0.727 −0.412 0.149 Overall Hg t0–15 2; 83 0.783 0.481 0.789 0.740 0.928 −1.30 2.88 t0–30 0.849 0.785 0.908 −1.36 3.06 t15–30 0.0601 0.785 1.000 −2.15 2.28
a Cd data are reported separately for two newborn populations [Control (C) and Experimental (E)], because at t15, the means were significantly different
(p* < 0.05). Conversely, all data on Hg were combined without distinguishing the two groups, because there were no significant differences between the groups.
b ANOVA was used to compare variability in element concentration within the groups with that among the groups. Values (F) were obtained using N-1
(N = number of lactation stages) and N*-3 degrees of freedom (N* = number of valid data points) at significance level α = 0.05.
c The Bonferroni post-hoc test was used to compare mean differences in elemental levels in infant stools sampled at different stages of lactation. Elemental
different time points (Table S3 and Table 7). When milk supply is abundant, the infant's milk intake is positively associated with infant weight. Because the mean weight of boys is greater than that of girls of the same age, intake is also associated with the sex of the infant (Institute of Medicine (US) Committee on Nutritional Status During Pregnancy and Lactation, 1991; U.S. EPA, 2011). Initially, we com-pared weekly toxic element intake between boys and girls at different lactation stages (Table S3). There were no significant differences be-tween the means of the two groups at different lactation stages. Therefore, these data were combined for further analyses.
3.3.1. Arsenic
In breast milk, As is present essentially as inorganic arsenic (IAs) (Fängström et al., 2008). Therefore, for purposes of risk assessment, the levels shown inTable 1for total As were assumed to correspond to those of IAs. As shown inTable 7, the average weekly intake of As by infants at each time point (1st, 3rd and 5th week) was 1.5, 1.9, and 1.3 μg kg−1BW/
week, all of which are less than the PTWI previously set by the WHO (15 μg kg−1BW/week;JECFA, 1989). However, in 2010, the Joint FAO/
WHO (JECFA, 2010, 2011a) concluded that the PTWI previously adopted for As was no longer safe for humans, and established a benchmark dose and lower confidence level (BMDL0.5) of 3 μg kg−1BW/day (or
21 μg kg−1BW/week) as the new reference point for risk assessment.
Using the approach currently employed to characterize the risk of ex-posure to toxic elements, we obtained mean MOEs of 14, 11, and 16 at 1st, 3rd and 5th week, respectively, which are higher than 10 but lower than 50. An MOE of 50 or higher for As, based on BMDL0.5obtained in a human
study, would pose low concern from a public-health standpoint (Rebelo and Caldas, 2016). However, our results were limited by the percentage of data points that fell below the limit of detection (55% of both colostrum and transitional milk samples and 38% of mature breast milk samples). The intake shown by our data is greater than the weekly intake of As reported by the European Food Safety Authority (EFSA, 2014) for 3-month-old European infants (0.28 μg kg−1BW/week, 6.1 kg BW, 800 mL
of breast milk) and bySternowsky et al. (2002)for 3-month-old German infants (0.14–0.42 μg kg−1BW/week, 6 kg BW, 790 mL of breast milk).
3.3.2. Cadmium
As shown inTable 7, the average weekly intake of Cd in infants de-creased during the course of lactation from 0.9 to 0.41 and 0.36 μg kg−1BW/week. These values are lower than the PTWI of
2.5 mg kg−1BW/week set by theEFSA (2014). Our calculated values are
greater than the intakes of 0.098 (3 days, 100 mL kg−1day) and
0.182 μg kg−1BW/week (14 days, 150 mL kg−1day) reported for Greece
by Leotsinidis et al. (2005), but lower than those reported for Poland (1.80 μg kg−1BW/week, 1 month, 4.5 kg, 700 mL/day of breast milk) by
Winiarska-Mieczan (2014). 3.3.3. Mercury
Only THg was analysed in breast milk samples. Currently, the PTWIs
for Hg are those for IHg (4 μg kg−1BW/week) and MeHg (1.6 μg kg−1
BW), which is relevant for pregnant women and infants (JECFA, 2011b). The mean ratio of MeHg to THg in breast milk varies widely from 0 to 0.6, but is mostly at ~0.5 (EFSA, 2012a, b;Rebelo and Caldas, 2016;Vacchina et al., 2017). MeHg represents 50% of the THg present (Rebelo and Caldas, 2016). We estimated a THg mean intake of 1.6 ± 1.4 μg kg−1BW/week
for the first week with respect to the third (0.59 ± 0.54 μg/kg−1BW/
week) and fifth (0.62 ± 0.48 μg kg−1BW/week) week. These values are
lower than the PTWI of 4 μg kg−1BW/week (JECFA, 2011a) and
max-imum tolerable intake value of 4.7 μg kg−1BW/week set by FAO/WHO
(JECFA, 1989). Based on our previous assumption, the MeHg mean intake in this study corresponded to 0.11 μg kg−1BW/day, or 0.78 μg kg−1BW/
week in colostrum, representing 49% of PTWI. The mean MeHg weekly intake in mature milk (0.31 μg kg−1BW/week) was within the average
range reported byEFSA (2012b). 3.3.4. Mercury
In this study, the average weekly intake of Pb in infants was 7.8, 6.8, and 2.5 μg kg−1BW/week for the first, third, and fifth week,
respec-tively (Table 7). These values, also observed for Cd, show a decreasing trend during the course of lactation, and all are lower than the PTWI of 25 μg kg−1BW/week previously set by theJECFA (1999). Our
calcu-lated values for Pb intake are higher than those reported in several European countries including Greece (0.28 and 0.49 μg kg−1BW/week
median weekly intake in colostrum and transitional milk, respectively) (Leotsinidis et al., 2005) and Slovakia (5.40 μg kg−1BW/week mean
weekly intake for transitional milk) (Ursinyova and Masanova, 2005), but lower than those reported in Poland for mature milk (2.94 μg kg−1BW/week) (Winiarska-Mieczan, 2014). Using the
ap-proach currently employed to characterize the risk of exposure to Pb, and a BMDL1 of 0.5 μg kg−1BW/day (EFSA, 2010; 3.5 μg kg−1BW/
week), we calculated the mean MOEs of 0.45, 0.51, and 1.4 for the first, third, and fifth week, respectively. The MOEs calculated in the present study were below 1, or between 1 and 10, indicating a potential risk to breastfed infants in accordance with the guidelines ofEFSA (2010). 4. Conclusions
Toxic elements, found in breast milk, show particularly high con-centrations in colostrum; thus, during breastfeeding, substantial amounts of elements are transferred to the intestine of the newborn. In this study, we assessed a novel application of a specific probiotic for-mulation to promote detoxification in humans, and protect the health of nursing mothers and their infants. Preliminary in-vitro experiments with the bacterial strains present in this probiotic product showed a high bacterial tolerance for As, Cd, Hg, and Pb, and good binding capacity for Cd, Hg, and Pb within 1 h of contact. Toxic element levels in the breast milk of women treated orally with this probiotic product from 36th week of pregnancy to 4 weeks postpartum did not differ sig-nificantly from the levels in women treated with placebo over the same Table 6
Kendall's tau-b correlation (K) of Cd and Hg concentrations between infant stools and breast milk sampled at all the stages of lactation.
Parametersa Control Probiotic-treated
Breast milk Infant stools Breast milk Infant stools
Cd Hg Cd Hg Cd Hg Cd Hg
Cd Infant stools K −0.153 −0.022 1.00 −0.067 −0.138 0.063 1.00 0.071
p 0.112 0.819 – 0.851 0.277 0.622 – 0.805
Hg K 0.067 0.200 −0.067 1.00 −0.143 −0.074 0.071 1.00
p 0.851 0.573 0.851 – 0.621 0.802 0.805 –
a As and Pb were excluded from statistical analysis because their levels were below the LOD. Values (K) were obtained at significance level α = 0.05 (two-tailed),
using the N (N = number of cases) of 52 and 34 control and treated individuals, respectively.. The Cd and Hg concentrations were not significantly correlated (p > 0.05) as assessed at different times.
![Fig. 1. Bacterial capacity to bind toxic elements [uptake percentage (U%); mean ± standard deviation] in Man, Rogosa and Sharpe (MRS) broth supplemented with 0.05% w/v L-cysteine hydrochloride (cys) or in deionized water](https://thumb-eu.123doks.com/thumbv2/123dokorg/5474625.62231/5.892.58.546.791.1112/bacterial-capacity-elements-percentage-deviation-supplemented-hydrochloride-deionized.webp)