R E S E A R C H A R T I C L E
Open Access
LRRK2 phosphorylates pre-synaptic
N-ethylmaleimide sensitive fusion (NSF)
protein enhancing its ATPase activity and
SNARE complex disassembling rate
Elisa Belluzzi
1,8†, Adriano Gonnelli
1†, Maria-Daniela Cirnaru
2, Antonella Marte
3, Nicoletta Plotegher
1,7,
Isabella Russo
1, Laura Civiero
1, Susanna Cogo
1, Maria Perèz Carrion
2, Cinzia Franchin
4,5, Giorgio Arrigoni
4,5,
Mariano Beltramini
1, Luigi Bubacco
1, Franco Onofri
3, Giovanni Piccoli
2,6and Elisa Greggio
1*Abstract
Background: Lrrk2, a gene linked to Parkinson’s disease, encodes a large scaffolding protein with kinase and GTPase activities implicated in vesicle and cytoskeletal-related processes. At the presynaptic site, LRRK2 associates with synaptic vesicles through interaction with a panel of presynaptic proteins.
Results: Here, we show that LRRK2 kinase activity influences the dynamics of synaptic vesicle fusion. We therefore investigated whether LRRK2 phosphorylates component(s) of the exo/endocytosis machinery. We have previously observed that LRRK2 interacts with NSF, a hexameric AAA+ ATPase that couples ATP hydrolysis to the disassembling of SNARE proteins allowing them to enter another fusion cycle during synaptic exocytosis. Here, we demonstrate that NSF is a substrate of LRRK2 kinase activity. LRRK2 phosphorylates full-length NSF at threonine 645 in the ATP binding pocket of D2 domain. Functionally, NSF phosphorylated by LRRK2 displays enhanced ATPase activity and increased rate of SNARE complex disassembling. Substitution of threonine 645 with alanine abrogates LRRK2-mediated increased ATPase activity.
Conclusions: Given that the most common Parkinson’s disease LRRK2 G2019S mutation displays increased kinase activity, our results suggest that mutant LRRK2 may impair synaptic vesicle dynamics via aberrant
phosphorylation of NSF.
Keywords: Parkinson’s disease, Leucine-rich repeat kinase 2, N-ethylmaleimide sensitive fusion, Presynapse, Phosphorylation
Background
Leucine-rich repeat kinase 2 (LRRK2) is a large kinase with protein-to-protein interaction domains and dual en-zymatic activities. The catalytic core includes a ROC (Ras Of Complex) domain with GTPase activity, followed by a COR (C-terminus Of ROC) domain likely involved in pro-tein dimerization, and a serine-threonine kinase domain [1–3]. Mutations in Lrrk2 cause late-onset autosomal
dominant Parkinson’s disease (PD) [4, 5], whereas more common variants around the Lrrk2 locus act as risk fac-tors for disease [6, 7]. As the most common G2019S mu-tation increases kinase activity in vitro and in vivo by ~3 fold, LRRK2 is being intensively explored as a pharmaco-logical target for the treatment of PD [8]. Several sub-strates of LRRK2’s kinase activity have been reported, however few of these have been extensively validated at a physiological level [9]. There is, therefore, an increasing interest in identifying LRRK2 substrates and cellular path-ways compromised during pathological conditions that could serve as therapeutic alternatives to directly targeting LRRK2 kinase activity. LRRK2 has been found associated
* Correspondence:[email protected]
†Equal contributors
1Department of Biology, University of Padova, via Ugo Bassi 58/B, 35131
Padova, Italy
Full list of author information is available at the end of the article
© 2015 Belluzzi et al. Open Access This article is distributed under the terms of the Creative Commons Attribution 4.0 International License (http://creativecommons.org/licenses/by/4.0/), which permits unrestricted use, distribution, and reproduction in any medium, provided you give appropriate credit to the original author(s) and the source, provide a link to the Creative Commons license, and indicate if changes were made. The Creative Commons Public Domain Dedication waiver (http://creativecommons.org/publicdomain/zero/1.0/) applies to the data made available in this article, unless otherwise stated.
with various membrane structures, including synaptic ves-icles (SV) [10–15]. Multiple studies on different experi-mental models support a role for LRRK2 at the synapse. Mutant LRRK2 rodent models display defects in neuro-transmission [16–19], and LRRK2 overexpression or knockdown results in impaired SV endocytosis/exocytosis [15, 20]. We recently showed that LRRK2 binds SV via interaction with a number of presynaptic proteins [21] and that its kinase activity modulates these interactions and impacts on SV dynamics [22]. Among the LRRK2 interactors identified, we found N-ethylmaleimide sensi-tive factor (NSF), which is involved in the fusion of SV or-chestrated by SNARE (Soluble NSF-Attachment protein REceptor) proteins. During membrane fusion, vesicular and target SNAREs assemble into an alpha-helical trans-SNARE complex that juxtaposes the two membranes to-gether to catalyze membrane fusion. NSF is the ATPase that catalyzes the release of SNARE complexes, thus allowing SV endocytosis and the next cycle of fusion [23]. Notably, NSF activity is tightly controlled by phosphoryl-ation/dephosphorylation [24–26]. In the present study, using dynamic assays of SV cycling, we found that SV fu-sion is altered by LRRK2 kinase function, suggesting com-ponents of the exo/endocytic machinery may be a target of LRRK2 kinase activity. Given that LRRK2 interacts with NSF, we assessed whether NSF is a substrate for LRRK2 kinase activity. We found that LRRK2 can efficiently phos-phorylate NSF in vitro, with phosphorylation primarily oc-curring at T645. Importantly, phosphorylated NSF displays enhanced ATPase activity and increased rate of SNARE complex disassembling in vitro. Our data impli-cate LRRK2 kinase activity in the regulation of SV exo/ endocytosis by phospho-modulation of NSF activity and suggest that pathological LRRK2 may disturb SV dynam-ics via aberrant phosphorylation of NSF.
Results
LRRK2 kinase activity influences synaptic vesicle dynamics We recently reported that inhibition of LRRK2 kinase activity causes impairment in synaptic vesicles (SV) dy-namics, indicating a role for LRRK2 catalytic activity in SV fusion cycle [22]. To further determine the role of LRRK2 kinase activity at the presynapse, we performed dynamic assays of SV taking advantage of the sypHy assay in two complementary models: a) primary cortical cultures in the presence or absence of the LRRK2
inhibi-tor GSK2578215A (GSK in, 0.2 μM, 2 h), a brain
pene-trant, selective LRRK2 inhibitor (IC50 10 nM) [27]; b)
primary cortical neurons obtained from BAC hG2019S mice characterized by higher LRRK2 kinase activity [28]. GSK treatment induced LRRK2 dephosphorylation at Ser935, as predicted (Additional file 1: Figure S1-b), but did not cause protein destabilization (Additional file 1:
Figure S1a–c), whereas BAC hG2019S neurons
displayed increased LRRK2 expression due to the presence of the transgene (Additional file 1: Figure S1a-b-c). Synaptophysin-pHluorin (sypHy) is a pH-sensitive fluores-cent reporter that, by analogy with the original synap-topHluorin (synaptobrevin-pHluorin), is quenched in the acidic intracellular space of the SV and will only become fluorescent upon SV fusion, when the contents of the SV is exposed to the more basic pH of the extracellular space [29]. As shown in Fig. 1, at the onset of the stimulus, exo-cytosis caused a rapid increase in sypHy fluorescence, which after cessation of the stimulus, slowly returned to baseline (Fig. 1a–b). The first stimulus, 40 AP, is predicted to mobilize SV belonging to the ready releasable pool, while 300 AP is sufficient to trigger the fusion of SV be-longing to the total recycling pool [29]. Furthermore, the kinetics describing the on-set and the decay of the fluores-cence are correlated to the efficiency of the exocytotic and endocytotic mechanism, respectively [29]. Interestingly, while we measured a significant impairment of SV fusion (decreased fluorescence) in the presence of GSK upon ei-ther 40 or 300 AP stimuli, BAC hG2019S neurons were characterized by a higher answer following the two stimu-lations (ΔF40/F0 and ΔF300/F0 respectively, Fig. 1c). Fur-thermore, while upon acute pharmacological inhibition
the time taken for fluorescence decay was extended, τ
decay was decreased in hG2019S cells (Tau decay, Fig. 1c). To further assess a role for LRRK2 in the SV cycle, we took advantage of the exo/endocytic assay previously re-ported [20, 21]. Using this approach, we previously dem-onstrated that acute pharmacological blockade of LRRK2 kinase activity impairs SV recycling [22]. Building upon these data, BAC hG2019S cortical cultures were trans-duced at DIV4 with control viruses co-expressing GFP to track neuronal processes and assayed at DIV14. Briefly, we exposed living cultures to rabbit polyclonal antibodies directed against the intravesicular domain of synaptotag-min1, which are internalized inside the vesicle lumen upon SV recycling [30]. Vesicles within GFP positive pro-cesses were then monitored via laser confocal microscopy. The vesicles appeared as clusters either synaptotagmin and synaptophysin positive (i.e. cycling vesicles) or only synaptophysin positive (Fig. 1d). The analysis showed that BAC hG2019S cultures are characterized by a significant increase in the number of synaptotagmin and synaptophy-sin positive clusters (Fig. 1e). The total number of synaptic contacts, however, remained unaltered despite any pharmacological treatments (Additional file 1: Figure S1d). Taken together, these results indicate that LRRK2 kinase activity is involved in the regulation of SV fusion. LRRK2 interacts with NSF
Having found that LRRK2 kinase activity influences SV fusion, we next asked what the molecular mecha-nisms behind this phenotype might be. We had
previously demonstrated that LRRK2 interacts with the vesicle fusing ATPase NSF through its WD40 domain [21].
We first confirmed LRRK2 and NSF interaction at the endogenous level in synaptosomal preparations. Using co-immunoprecipitation with endogenous proteins from
Fig. 1 LRRK2 kinase activity modulates synaptic vesicle fusion. a We recorded synaptophluorin fluorescence from DIV14 wild-type cortical neurons treated with DMSO (control) or treated with LRRK2 inhibitor GSK2578215A (GSK in, 0.2μM, 2 h) and from cortical neurons obtained from BAC hG2019S mice (hG2019S). Representative snapshots were taken at DIV16 from 1 Hz recordings at rest (0), after 40 action potential stimulation (40AP), after 300 action potential stimulation (300AP) and upon neutralization with 50 mM NH4Cl to reveal total fluorescence (Fmax). Panels size is 113 × 113μm. b The graph
shows representative pattern of fluorescence. Y-axis reportsΔF/F0 at the given time point (second). c The graphs report the increase in fluorescence after 40AP (ΔF40/F0) and 300AP (ΔF300/F0) and the kinetic of signal after 300AP expressed as time constant describing the increase (tau upstroke) and decay (tau decay) of fluorescence. Data are expressed as mean ± SEM, n = 4, at least 50 boutons from minimum five neurons were analyzed for experiment (* p < 0.05; ** p < 0.01 versus control, ANOVA). d The exo/endocytotic assay was performed at DIV14 on wild-type and BAC hG2019S cortical neurons infected at DIV4 with virus expressing GFP. Cycling SV appears as synaptotagmin (s-tagmin) positive clusters along neuron processes. Total SV pool was revealed by staining with anti-synaptophysin antibodies upon fixation and permeabilization. Images show signals acquired for synaptotagmin, synaptophysin and their superimposition plus GFP (merge). Panel size is 28 × 4μm. (e) The percentage of s-tagmin and s-physin positive clusters within the totality of s-physin positive clusters reflects the pool of cycling vesicles. Data are expressed as mean ± SEM, n = 4, at least 7 neurons were analyzed for experiment (** p < 0.01 Student’s t-test)
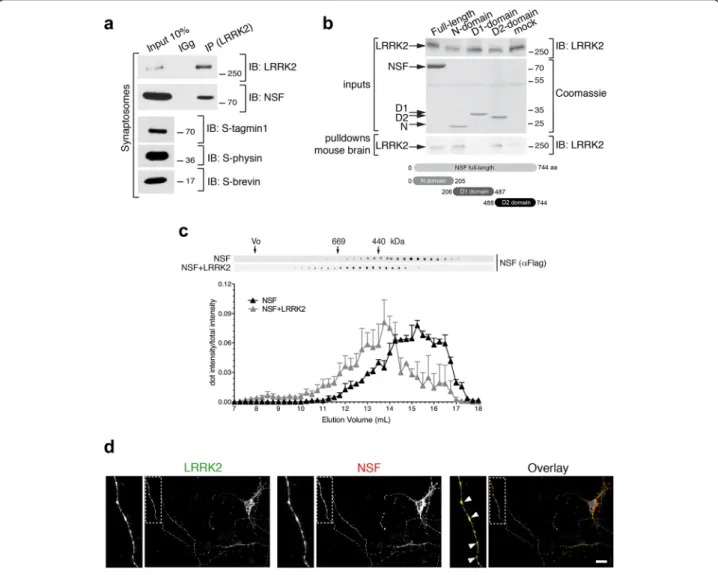
rat synaptosomes, we observed that LRRK2 efficiently co-precipitates NSF (Fig. 2a). Next, we dissected the do-main(s) of NSF involved in binding LRRK2. To this aim, we cloned human full-length NSF (aa 1–744) and its dif-ferent domains, namely N domain (aa 1–205), D1 domain (aa 206–487) and D2 domain (aa 488–744) in fusion with a N-terminal Flag-tag and purified the proteins from HEK293T cells. Proteins bounds to Flag-conjugated beads were adjusted to equal molar concentrations and subse-quently incubated with a mouse brain lysate. As shown in Fig. 2b, full-length NSF pulls-down endogenous LRRK2. Interestingly, N and D2 domains, but not D1, also pull-down endogenous LRRK2 (Fig. 2b). To further confirm the interaction between LRRK2 and NSF, we used size
exclusion chromatography (SEC) to fractionate HEK293T lysates expressing Flag-NSF or co-expressing Flag-NSF and 2xMyc-LRRK2, followed by dot blot analysis. As shown in Fig. 2c, NSF elutes between 11 and 17.5 mL. Interestingly, in the presence of LRRK2, NSF elution pro-file shifts toward shorter retention times (elution peak be-tween 10 and 16.5 mL) suggesting the formation of a complex with higher molecular weight than NSF alone (Fig. 2c). We also evaluated the cellular localization of en-dogenous NSF and LRRK2 in primary neuronal cultures and found that the two proteins largely co-localize, and co-localization is enriched within clusters along the neur-ites (Fig. 2d). Collectively these data indicate that LRRK2 and NSF form a complex in the cell.
Fig. 2 LRRK2 interacts with NSF. a Extracts of purified cortical synaptosomes were incubated with anti-LRRK2 antibodies or rabbit IgG. The immunocomplexes were sedimented with protein G-Sepharose and the samples were resolved by SDS-PAGE and analyzed by immunoblotting with anti NSF and anti LRRK2 antibodies. Immunoblotting against synaptotagmin 1 (S-tagmin1), synaptophysin (S-physin) and synaptobrevin (S-brevin) were performed to confirm purity of synaptosomal preparation. b Flag-NSF full-length or domains (N, D1, D2) purified from HEK293T and bound to M2 flag resin were incubated with a mouse brain lysate. Samples were subjected to immunoblotting using anti-LRRK2 (MJFF2) or stained with Coomassie to show flag inputs. c Size exclusion chromatography fractions of HEK293T expressing ectopic flag-NSF alone or together with 2xMyc-LRRK2 spotted onto nitrocellulose membrane and probed with anti-flag antibody (n = 3 independent experiments). d Immunofluorescence of primary cortical neurons stained for endogenous LRRK2 and endogenous NSF (scale bar is 10μm)
LRRK2 phosphorylates NSF in D2 domain
LRRK2 affects SV dynamics via its kinase activity (Fig. 1a–c) [22]. Therefore, we hypothesized that NSF could be a substrate of LRRK2 and, as such, be involved in the LRRK2 kinase dependent regulation of SV. To test this hypothesis, we performed in vitro kinase assays using recombinant LRRK2 and NSF purified from mam-malian cells. We first validated recombinant human NSF biochemically. NSF purified as described in the methods section folds into hexamers when loaded with 1 mM ATP as evidenced by negative-stain transmission elec-tron microscopy (TEM) (Additional file 1: Figure S2a). Of interest, Flag-tagged NSF purified with Flag affinity resin co-precipitates endogenous NSF as indicated by the presence of a band corresponding to endogenous NSF (Additional file 1: Figure S2b), further supporting the notion that Flag-NSF forms oligomers. To verify
that purified NSF is functional, we measured ATP to ADP hydrolysis rate by isocratic reverse-phase HPLC (Additional file 1: Figure S2c-d) and malachite green colorimetric assay (Additional file 1: Figure S2e). NSF efficiently hydrolyzes ATP to ADP over time under these purification and assay conditions.
Having validated recombinant human full-length NSF, we next purified soluble 3xFlag-LRRK2 wild-type, the hyperactive clinical mutant G2019S and the kinase dead K1906M from HEK293T cells and subsequently incubated these purified proteins with full-length NSF in kinase assay conditions [31]. As shown in Fig. 3a, at a 1:10 ratio of LRRK2:NSF, we observe robust phosphorylation of NSF by LRRK2. Importantly, in the presence of LRRK2 K1906M
or upon addition of 1 μM LRRK2 IN-1 inhibitor, NSF
phosphorylation corresponds to the background levels ob-served for NSF alone, confirming that the incorporation of
Fig. 3 LRRK2 phosphorylates NSF. a In vitro radioactive kinase assays of 3x-Flag LRRK2 wild-type, K1906M (kinase dead) and G2019S (hyperactive) and flag-NSF purified from HEK293T cells at 1:10 ratio. Radioactivity incorporated was revealed by autoradiography (upper panel) and total proteins loaded by flag immunoblotting (lower panels). LRRK2 inhibitor IN-1 was used at 1μM concentration to confirm LRRK2 specific phosphorylation on NSF. b In vitro kinase assays as in (a) with the hyperactive GST-LRRK2970–2527fragment. c Quantification of moles of33P incorporated by NSF using
a calibration curve with known concentration of33P-ATP. d In vitro kinase assays as in (a) using NSF full-length or domains as substrates of LRRK2
GST-LRRK2970–2527kinase activity at 1:10 ratio LRRK2:NSFs. Radioactivity incorporated was revealed by autoradiography (upper panel) and total proteins loaded by coomassie brilliant blue (CBB) staining for NSF (middle panel) or LRRK2 immunoblotting (lower panel). e In vitro radioactive kinase assays of 3xFlag-LRRK1 or 3xFlag-LRRK2 and Flag-NSF as substrate at 1:10 ratio. Left panel is an example of autoradiography and right panel represents the corresponding immunoblot of total loading
radioactive phosphate is genuinely due to LRRK2 kinase activity (Fig. 3a). We confirmed LRRK2-mediated phos-phorylation of NSF using the hyperactive
G2019S-LRRK2970–2527 fragment (Fig. 3b). The stoichiometry of
phosphate incorporation, measured using a calibration curve with different concentrations of33P-ATP, is approxi-mately 0.04 moles of phosphate per mole of monomeric NSF in the presence of LRRK2 wild-type, 0.1 in the pres-ence of G2019S and 0.4 with an artificial truncated variant
characterized by higher activity, G2019S-LRRK2970–2527
(Fig. 3c). The low value for this stoichiometry, when taken in the context of a hexameric NSF complex, is sufficient to imply the presence of at least one phosphorylated mono-mer per hexamono-mer. The reaction reached a plateau after 1-hour incubation (Additional file 1: Figure S3a-b), likely due to inactivation of LRRK2 under assay conditions as previously reported [32].
To define the region(s) of NSF phosphorylated by LRRK2, we performed kinase assays in the presence of NSF full-length or isolated domains. While we failed to detect any phosphorylation when N and D1
domains were incubated with G2019S-LRRK2970–2527,
we were able to measure phosphate incorporation in the D2 domain (Fig. 3d). Importantly, NSF is not a substrate of the cognate protein LRRK1 under these assay conditions (Fig. 3e), suggesting that this phos-phorylation event is specific to LRRK2. In toto, these results indicate that LRRK2 likely phosphorylates the D2 domain of NSF.
LRRK2 phosphorylates NSF at threonine 645
We next set out to identify NSF phosphorylation site(s) targeted by LRRK2. To achieve this, we used phospho-peptide enrichment coupled with liquid chromatography/
tandem mass spectrometry (LC-MS/MS) analysis on puri-fied NSF pretreated with alkaline phosphatase to eliminate possible cellular phosphorylation sites, and subsequently phosphorylated by LRRK2 in vitro. Under the
experimen-tal conditions used, we were able to achieve≈ 80 % NSF
sequence coverage (Additional file 1: Figure S4a) and identified the peptide 639KLLIIGTTSR648 as a bona fide phospho substrate. The MS analysis could not discrimin-ate whether single/multiple phosphorylation occurred at T645, T646 or S647 or whether these sites may be multi-phosphorylated (Additional file 1: Figure S4b). This phos-phopeptide was enriched following incubation with wild-type and G2019S LRRK2, but not in control samples
(LRRK2 kinase dead or in the presence of 1μM IN-1)
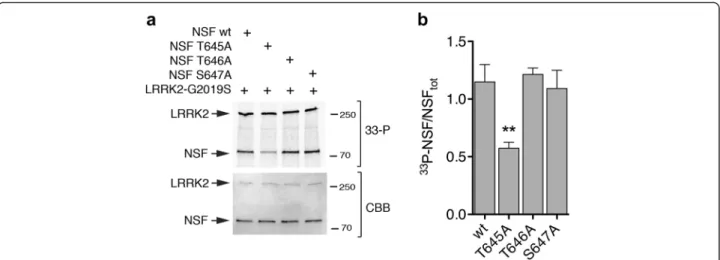
in-dicating it contains specific LRRK2 phosphorylation site(s). We next validated the MS data by site-direct muta-genesis and in vitro kinase assays. Wild-type and phospho-deficient NSF mutants T645A, T646A and S647A were expressed and purified in HEK293T cells and subsequently incubated in vitro with catalytically ac-tive LRRK2 under phosphorylation permissive
condi-tions. T645A displayed ~50 % reduction of 33P
incorporation compared to NSF wild-type, T646A and S647A (**p < 0.01, One-Way ANOVA with Bonferro-ni’s post-test) (Fig. 4). Since NSF is also phosphory-lated by PKC but within a different residue (S237) [26], we next assessed whether PKC is able to phos-phorylate NSF at T645 to rule out any promiscuous effect. As shown in Additional file 1: Figure S5, we confirm that PKC efficiently phosphorylates NSF in vitro, but NSFT645A exhibits similar 33P incorporation as NSF wild-type, suggesting that T645 is a LRRK2 specific phospho-site. Overall, our data indicate that T645 is a LRRK2 phosphorylation site within NSF.
Fig. 4 LRRK2 phosphorylates NSF at T645. a In vitro kinase assays with 3xFlag-LRRK2 G2019S and NSF wild-type or non-phosphorylatable mutants T645A, T646A and S647A mutants at 1:10 ratio LRRK2:NSF. The G2019S hyperactive mutant was used to maximize33P incorporation. b Quantification
of33P incorporated by NSF (autoradiography, upper panel) controlled for total NSF (NSF
TOT, coomassie staining, lower panel) from n = 4 independent
LRRK2-mediated phosphorylation increases NSF ATPase activity
We next investigated whether LRRK2 mediated phos-phorylation of NSF has a functional consequence on its ATPase activity. We first identified the optimal detergent concentrations at which both LRRK2 and NSF display max-imal catalytic activity (0.007 % of polysorbate 20, the critical micelle concentration of the detergent; Additional file 1: Figure S6). Subsequently, full-length NSF was exposed to
LRRK2-G2019S970–2527 or buffer in kinase assays
condi-tions (with 50μM ATP to minimize interference with the
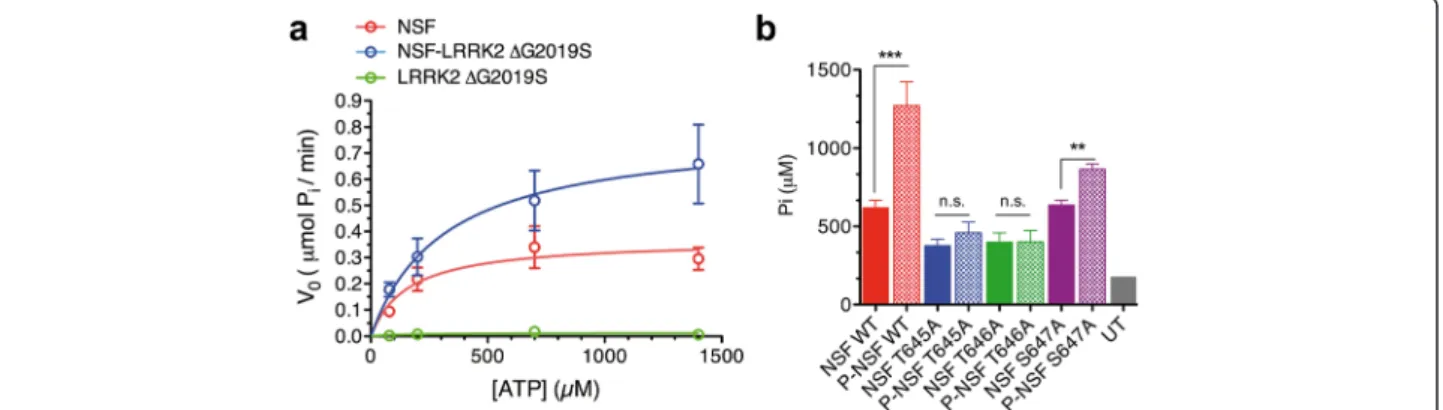
subsequent ATPase assay) for 30 min. As shown in Fig. 5a, NSF phosphorylated by LRRK2 exhibits increased ATPase activity (Km= 355 ± 50 μM; kcat= 40 ± 11 min−1; Vmax=
0.95 ± 0.22 μmol/min, from n = 4 independent
purifica-tions) compared to unphosphorylated NSF (Km= 178 ±
12 μM; kcat= 19 ± 4 min−1; Vmax= 0.37 ± 0.07 μmol/min,
from n = 4 independent purifications). Given that we identi-fied threonine 645 as a bona fide LRRK2 target, we next assessed the ATPase activity of NSFT645A, along with NSF
wild-type, NSFT646A and NSFS647A, pre-treated with
LRRK2-G2019S970–2527 or buffer control in kinase assay
conditions. As shown in Fig. 5b, NSFT645A displays
impaired ability to hydrolyze ATP and, importantly,
activity could not be restored when NSFT645A is
pre-phosphorylated by LRRK2. Interestingly, the neighbor-ing T646 mutated to alanine also exhibits impaired ATPase activity that cannot be recovered by LRRK2
phosphorylation, whereas NSFS647A, two residues
apart from T645, displays ATPase activity similar to wild-type, and this activity is enhanced by LRRK2 phosphorylation. These results strongly indicate that T645 and T646 are critical for NSF catalytic activity.
To rule out that NSFT645A impaired activity was due
to partial unfolding, we used circular dichroism (CD) and fluorescence spectroscopy to compare the secondary struc-tures of NSF wild-type and NSFT645A. Tryptophan fluores-cence is similar among wild-type and NSFT645A(Additional file 1: Figure S7a). CD spectra also confirm that the overall folding is maintained (Additional file 1: Figure S7b). In addition, TEM imaging confirms that NSFT645Aretains the ability to form hexamers (Additional file 1: Figure S7c). Taken together, these data indicate that NSF phosphory-lated by LRRK2 possesses enhanced ATPase activity and T645 is a crucial site for enzymatic catalysis.
LRRK2-mediated phosphorylation of NSF increases the rate of SNARE complex disassembling
NSF-mediated ATP hydrolysis promotes disassembly of the SNARE complex [33]. Given that NSF phosphoryl-ation by LRRK2 increases its ATPase activity (Fig. 5), we next postulated that this also impacts upon the rate of SNARE complex dissociation. To test this, we monitored the kinetic of SNARE complex disassembling in vitro as previously described [34, 35]. We co-expressed in E. coli recombinant soluble syntaxin, SNAP-25 and 6xHis-VAMP and purified the assembled complex by IMAC af-finity purification followed by size exclusion chromatog-raphy [35]. As shown in Additional file 1: Figure S8, the complex elutes as single band corresponding to the ex-pected molecular weight for the soluble SNARE complex (68 kDa), which is dissociated into the three SNARE components upon heating. To assess whether LRRK2 phosphorylation on NSF impacts the rate of SNARE complex disassembling in vitro, we incubated SNARE
complex (480 nM) with 1.5 μM of alpha-SNAP, an
es-sential co-factor, and 24 nM of NSF (phosphorylated or not by LRRK2) in the presence of 2 mM of ATP, and
Fig. 5 Phosphorylated NSF exhibits enhanced ATPase activity. a NSF ATPase activity was assessed with a Malachite green assays at 36nM NSF and increasing concentrations of ATP substrate (up to 1.4 mM) in the presence of NSF alone, NSF pre-phosphorylated by LRRK2-G2019S970–2527(ΔG2019S) or LRRK2-G2019S970–2527(ΔG2019S) alone (NSF:LRRK2 20:1). Data were fitted with the Michaelis-Menten kinetic model to determine kinetic constants. b Phosphate generated by ATP hydrolysis in the presence of NSF wild-type, NSFT645ANSFT646ANSFS647Apre-phosphorylated or not byΔG2019S was
measured with the Malachite Green Assay at 120 min with an initial concentration of ATP of 1.4 mM (NSFWTvs NSFT645A**p < 0.01; NSFWTvs
P-NSFWT***p < 0.001; NSFT645Avs P-NSFT645Ap > 0.05, non significant, n.s.; NSFT646Avs P-NSFT646Ap > 0.05, n.s.; NSFS647Avs P-NSFS647A**p < 0.01;
one-way ANOVA, Bonferroni’s post-test, n ≥ 3). UT = untrasfected cells subjected to Flag-affinity purification to monitor background activity (n = 1; excluded from the statistical analysis)
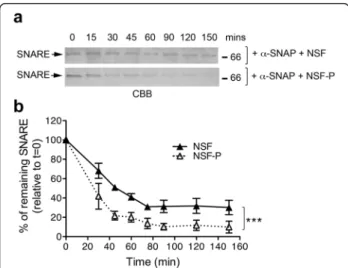
subsequently analyzed the kinetic of SNARE complex dis-appearance over 150 min. Under these assay conditions, NSF phosphorylated by LRRK2 displayed a markedly in-creased efficiency in disassembling SNARE complex com-pared to non-phosphorylated NSF (Fig. 6a–b). These data further support the notion that LRRK2-mediated phos-phorylation increases NSF catalytic activity with conse-quent acceleration of the disassembly of SNARE complexes in vitro.
Discussion
Identification of heterologous substrates of LRRK2 kin-ase activity is essential for understanding the cellular pathways deregulated in PD caused by mutations in this gene [3]. Here we provided evidence that the presynaptic ATPase NSF is a substrate of LRRK2 kinase activity, and that phosphorylated NSF displays enhanced ATP hy-drolysis and SNARE complex dissociation activity in vitro.
Multiple lines of evidence support a role of LRRK2 at the presynaptic compartment. We previously found that LRRK2 controls SV storage and mobilization within the recycling pool [20] and that this process is dependent on LRRK2 kinase activity [22]. Synaptosomes treated with LRRK2 inhibitors exhibit decreased evoked glutamate release [22] whereas elevated glutamate release and syn-aptic transmission were observed in LRRK2 G2019S knock-in mice [16]. Altogether, these data indicate that LRRK2 kinase may play an important role in modulating a step of the exo-endocytic pathway. LRRK2 is a com-plex kinase with several protein interaction domains,
which was shown to assemble multiprotein complexes during signal transduction [11]. At the presynapse, LRRK2 interacts with several proteins [21]. Moreover, accumulating literature suggests that LRRK2 regulates SV dynamics via phosphorylation of presynaptic pro-teins, such as Snapin, and EndophilinA [36–38]. The present work provides evidence that NSF is not only an interactor but also a substrate of LRRK2 in vitro. Re-cently, another LRRK2 interactor, the ribosomal protein s15, has been shown to serve as LRRK2 substrate [39], further emphasizing the value of examining LRRK2 interacting proteins as potential kinase substrates.
Here, we demonstrated that LRRK2 phosphorylates NSF at T645. The functional consequence of this is that NSF hydrolyses ATP faster when phosphorylated by LRRK2 at this residue. The physiological relevance of this finding is further supported by the observed in-creased rate of SNARE complex disassembling in the presence of phosphorylated NSF. Indeed, we found T645A is characterized by a reduced endogenous ATPase activity. Given that T645 is located within the D2 domain of NSF, which is thought to be important for NSF oligomerization via ATP binding [40], these results are consistent with our current understanding of NSF function. Specifically, T645 is part of the beta strand S4 (aa 639–646), which stabilizes the hexamer through interaction with the neighboring alpha-helix H5 [41]. Therefore, T645 is predicted to be a key residue for pro-tein oligomerization, which impacts the ability of the D1 domain to hydrolyze ATP. Clearly, further investigation is merited to determine whether LRRK2 phosphorylation at T645 directly alters NSF oligomerization.
Translating these findings into the neuronal context, these data imply that LRRK2 may play a role in tuning the kinetics of SV fusion by accelerating SNARE com-plex dissociation via NSF phosphorylation. Previous studies reported NSF as substrate of other serine-threonine kinases: NSF is phosphorylated by Pctaire1 at S569 in the D2 domain, and this phosphorylation re-duces NSF oligomerization [25]; NSF is also phosphory-lated by PKC in vitro at Ser-237 of the catalytic D1 domain which negatively regulate NSF binding to alpha-SNAP-SNARE complexes (Additional file 1: Figure S5) [26]. Therefore, both Pctaire1 and PKC appear to switch off NSF activity. In our current study, we report multiple strands of evidence that suggest that NSF phosphory-lated by LRRK2 is more active in vitro, however it is still unknown whether this is replicated in vivo. Wild-type LRRK2 is characterized by a low basal activity that may become pathologically relevant in the presence of gain of function mutations. We predict that in the presence of pathological hyperactive LRRK2 variant, SV endocyto-sis may be abnormally fast. Such alteration could result in 1) increased neurotransmitter release or 2) impaired
Fig. 6 Phosphorylated NSF exhibits increased rate of SNARE complex disassembling in vitro. a Representative coomassie gels (CBB, coomassie brilliant blue) of SNARE complex incubated for increasing time with NSF phosphorylated or not by LRRK2-G2019S970–2527in the presence of the co-factor alpha-SNAP. b Quantification of n = 3 independent experiments. Time points are relative to t = 0 which was set at 100 % (two-way ANOVA with Bonferroni’s post-test, ***p < 0.001)
neurotransmitter release by accelerating SV endocytosis. While the second hypothesis would fit with the reduced dopamine release observed in mice expressing LRRK2 G2019S selectively in midbrain dopaminergic neurons [42], increased glutamate release has been reported in
G2019S knock-in neurons [16] – consistent with the
first hypothesis. Thus, additional research is needed to clearly identify the best representative model of LRRK2 function and dysfunction in the neuron.
We also provide robust evidence that the kinase activ-ity of LRRK2 affects SV dynamics using two comple-mentary models: LRRK2 inhibition and hyperactive LRRK2 (BAC hG2019S) in primary cortical neurons. The strong impairment of SV exo-endocytosis observed in the presence of pharmacological inhibition (Fig. 1, [22]) suggests that a consequence of therapeutic LRRK2 kinase inhibition might be alterations in the biology of the pre-synaptic compartment, likely impairing neurotransmitter release and synaptic function. These observations, to-gether with the reported side effects in peripheral organs [43] suggest that additional strategies should be consid-ered to target pathological LRRK2 function.
Conclusions
In the present study, we report LRRK2 kinase as a posi-tive regulator of NSF activity and SNARE complex disas-sembling in vitro. Future studies should also be directed at understanding whether this phosphorylation is rele-vant in the pathogenesis of PD.
Methods
Animals, neuron cultures and drugs
Housing and handling of mice were carried out in com-pliance with the guidelines established by the European Community Council (Directive 2010/63/EU of March 4th, 2014) and approved by the Italian Ministry of Health (IACUC 625). Non-transgenic wild-type and LRRK2 BAC hG2019S mice, back-crossed on a C57BL/ 6J strain, were obtained from Mayo Clinic (Jacksonville, FL, USA) through a collaboration with Dr. Heather Mel-rose [28]. Animals were kept following guidelines of
Ministry of Education, Universities and Research
(MIUR). Neuron cultures were prepared from either mouse cortexes or hippocampi obtained from embryonic day 15.5–16.5 mice (C57BL/6 J). High-density (750–
1000 cells/mm2) and medium-density (150–200 cells/
mm2) neuron cultures were plated and grown as
de-scribed on 12-well plastic tissue culture plates (Iwaki; Bibby Sterilin Staffordshire, UK) or on 12 mm diameter coverslips put into 24-well plastic tissue culture plates (Iwaki) [44]. GSK-2578215A compound (Tocris Bio-science, Bristol, UK) or DMSO were added to culture media at the concentrations indicated through the text. For immunocytochemistry, primary cultured neurons
were fixed with 4 % paraformaldehyde and probed with primary rabbit anti-NSF (1:200, D31C7, Cell Signaling, Danvers, MA, USA) and mouse anti-LRRK2 (1:200 N231B/34, NeuroMab, Davis, CA, USA) and secondary anti-mouse Alexa Fluor 488 and anti-rabbit Alexa Fluor 568 (Thermo Fisher, Waltham, MA USA).
Plasmids and constructs
pCHMWS 3xFlag-tagged LRRK2 wild-type, K1906M and G2019S, 2x-Myc LRRK2 constructs have been previously described [31]. NSF constructs (full-length and domains) were cloned into p3XFLAG-CMV-7.1 vector (Sigma-Al-drich, St. Louis, MO, USA). NSF domains were amplified using forward primers with NotI overhang and reverse primers with KpnI overhang as following:
N-Domain (1–205): forward 5′-AAGCTTGCGGCCGC CTTCGCGGGCCGGAGC-3′ and reverse 5′-TCGAC TGGTACCTTAGCGATTTTCCTTGGTTTT-3′ D1 domain (206-477aa): forward 5′-AAGCTTGCGGC CGCCCAATCAATTATCAATC-3′ and reverse 5′-TC GACTGGTACCTTATCTCGTCACTTGCAGGC-3′ D2 domain (478-744aa): forward 5′-AAGCTTGCGGC CGCCGGAGACTTCCTTGCTTC-3′ and reverse 5′-TCGACTGGTACCTCAATCAAAATCAAGGGG-3′.
NSF mutants were generated using the QuickChange mutagenesis kit (Agilent Technologies, CA, USA) accord-ing to the manufacturer’s instructions. All plasmids were validated by restriction analysis and DNA sequencing. Cell culture and transfection
Human embryonic kidney cells (HEK293T) were cul-tured in Dulbecco’s modified Eagle’s medium (DMEM, Thermo Fisher, Waltham, MA USA) supplemented with 10 % fetal bovine serum (FBS, Thermo Fisher, Waltham,
MA USA) at 37 °C and 5 % CO2. HEK293T were
transi-ently transfected using linear polyethylenimine (PEI,
Polysciences) with ratio DNA:PEI 1:2. 40 μg of DNA
were dissolved in 1 ml of OPTI-MEM (Thermo Fisher,
Waltham, MA USA) and 80 μl of PEI (40 μM) were
added to 1 ml of OPTI-MEM. After 5 min of incubation the two solutions were mixed together and incubated for 20 min to allow the formation of DNA/PEI complexes. Then, the mix was added directly to the cells in Petri dishes of 15 cm2and used after 48–72 h.
Antibodies, SDS-PAGE and western blot analysis
Antibodies used for western blotting were as follows: anti-Flag M2 (1:10000, Sigma-Aldrich, St. Louis, MO, USA); anti-NSF (1:500, Cell Signaling, Danvers, MA, USA); anti-LRRK2 (1:1000, C41-2, Abcam, Cambridge, UK); Synaptobrevin, synaptophysin and
anti-Synaptotagmin 1 (1:1000, Synaptic System, Göttingen, Germany).
Between 10 and 20 μg of protein samples were
dis-solved in 4–20 % Tris-glycine polyacrylamide gels (Biorad) in SDS/Tris-glycine running buffer. Precision Plus molecular weight markers (Biorad) were used for size estimation. Solubilized proteins were then trans-ferred to polyvinylidenedifluoride (PVDF) membranes in transfer buffer containing 10 % methanol. The PVDF sheets were blocked in Tris-buffered saline plus 0.1 % Triton (TBS-T) plus 5 % nonfat dry milk for 1 h at 4 °C and then incubated overnight at 4 °C with primary anti-body in TBS-T plus 5 % non-fat dry milk. The PVDF membranes were washed in TBS-T (3 × 10 min) at room temperature (RT) followed by incubation for 1 h at RT with horseradish peroxidase-conjugated anti-mouse IgG. Blots were then washed in TBS-T (4 × 10 min) at RT and rinsed in TBS, and immunoreactive proteins were visualized using enhanced chemiluminescence plus (ECL +, GE Healthcare, Waukesha, WI, USA). Densitometric analysis was carried out using Image J software.
Protein purification
Human NSF with a N-terminal Flag tag or NSF domains were purified from HEK293T cells after transient trans-fection as described above. Cells were resuspended in 1 ml of a lysis buffer (20 mM Tris–HCl pH 7.5, 150 mM
NaCl, 1 mM EDTA, 2.5 mM Na4P2O7, 1 mM
beta-glycerophosphate, 1 mM Na3VO4, Protease Inhibitor
Mixture (Sigma-Aldrich, St. Louis, MO, USA)) and then lysed with 5 cycles of freezing and thawing in liquid ni-trogen. The cell lysate was collected after centrifugation at 18000xg for 40 min at 4 °C. The supernatant was in-cubate overnight with 40μl of Anti-Flag M2 Affinity gel (Sigma-Aldrich, St. Louis, MO, USA) at 4 °C. After cen-trifugation, the supernatant was discarded and the beads with human NSF were washed with 1 ml of different buffers: WB1 (20 mM Tris–HCl pH 7.5, 500 mM NaCl) twice, WB2 (20 mM Tris–HCl pH 7.5, 350 mM NaCl) twice, WB3 (20 mM Tris–HCl pH 7.5, 150 mM NaCl) six times. The protein was then eluted by incubating the
beads with 200 μl of 20 mM Tris–HCl pH 7.5, 150 mM
NaCl or directly in the kinase assay buffer (25 mM Tris–HCl pH 7.5, 5 mM beta-glycerophosphate, 2 mM
DTT, 0,1 mM Na3VO4, 10 mM MgCl2) with 150 ng/μl
3xFlag peptide and mixing the sample for about 2 h. The sample was centrifuged to pellet the resin and the super-natant was collected. Note that all the purification steps were carried out in the absence of detergent, a condition that resulted essential to maintain NSF folding and to de-tect specific phosphorylation by LRRK2. Purified human NSF was separated on SDS-PAGE and quantified by com-parison with different concentrations of BSA (Bovine Serum Albumin). Proteins were electrophoretically resolved
on 4–20 % Tris-glycine polyacrylamide gels (Biorad) using SDS/Tris-glycine running buffer. To estimate the molecular weight of proteins Precision Plus molecular weight marker (Biorad) was used. After the run, proteins were stained with Coomassie Brillant blue to enable the quantification with ImageJ software.
Synaptosomes preparation and immunoprecipitation Brains from adult rats were quickly removed and the cerebral cortex dissected out at 4 °C. Purified synapto-somes were prepared on Percoll gradients (Sigma-Al-drich, St Louis, MO, USA) essentially according to Nakamura et al. with minor modifications [45]. Briefly, the tissue was homogenized in 14 volumes of 0.32 M su-crose, Tris–HCl pH 7.4, using a glass-teflon tissue grinder (clearance 0.25 mm, 12 up–down strokes in about 1 min). The homogenate was centrifuged (5 min, 1000 g at 4 °C) to remove nuclei and debris and the supernatant was gently stratified on a discontinuous Per-coll gradient (2, 6, 10, and 20 % v/v in Tris-buffered su-crose) and centrifuged at 33,500 g for 5 min at 4 °C.
The layer between 10 and 20 % Percoll (synaptosomal fraction) was collected, washed by centrifugation and re-suspended in RIPA buffer (NaCl 150 mM, Tris 50 mM (pH 7.4), NP40 (1%v/v), SDS (0.1%v/v) and protease in-hibitors). To precipitate the immunocomplexes the extract was incubated for 2 h at RT with anti-LRRK2 antibodies
(10μg/sample; MJFF C41-2, Abcam, Cambridge, UK) or a
control rabbit IgG (10μg/sample; Sigma-Aldrich, St. Louis,
MO, USA) conjugated with 25 μl of settled prewashed
protein G-Sepharose beads (GE-Healthcare, Waukesha, WI, USA). The eluted proteins were separated by SDS-PAGE, transferred onto nitrocellulose membrane (GE-Healthcare, Waukesha, WI, USA) and analyzed by western-blotting with anti-LRRK2 and anti-NSF (Cell Sig-naling, Danvers, MA, USA) antibodies. Western-blotting with synaptotagmin 1, synaptophysin and anti-synaptobrevin were performed to confirm purity of synap-tosomal preparation.
Pull-down assays
NSF domains and full length NSF were purified after transient transfection from HEK293T cells. Cells were
harvested in 500 μl of Lysis buffer (50 mM Tris–HCl
pH 7.5, 1 mM EDTA, 2.5 mM Na4P2O7, 1 mM
beta-glycerophosphate, 1 mM Na3VO4, 0.27 M Sucrose, 1 %
Triton X-100, Protease Inhibitor Mixture (Sigma-Al-drich, St. Louis, MO, USA)). The cell lysate was then centrifuged at 18000xg for 30 min at 4 °C. Subsequently,
the lysate was incubated overnight with 20 μl of
Anti-Flag M2 Affinity gel (Sigma-Aldrich, St. Louis, MO, USA) at 4 °C. After centrifugation, the supernatant was discarded and the beads with NSF proteins were washed three times with 1 ml of a Washing buffer (50 mM
Tris–HCl pH 7.5, 1 mM EDTA, 0.27 M Sucrose, 250 mM NaCl, 0.02 % Triton X-100) and resuspended in
100 μl of the same buffer. Proteins were loaded on an
SDS-PAGE gel and their concentration was quantified measuring the intensity of the band against known BSA standards with ImageJ software.
Proteins were subsequently adjusted to the same
con-centration (2 μM) and incubated with 600 μl mouse
brain lysate (2.5 mg/ml concentrated) overnight at 4 °C. The day after, resins were boiled with sample buffer, loaded into a SDS-PAGE gel and transferred onto PVDF membranes.
Size Exclusion Chromatography (SEC) and dot blot analysis
Flag-NSF alone or Flag-NSF and 2xmyc-LRRK2 trans-fected HEK293T cells were lysed in 500μl of lysis buffer containing 0.06 % (v/v) Triton X-100 and centrifuged. Cell lysates clarified were separated on a Superose 6 10/ 300 column (Ge Healthcare, Waukesha, WI, USA) pre-equilibrated with 20 mM Tris–HCl pH 7.5, 150 mM NaCl and 0.06 % (v/v) Triton X-100. The flow rate used was 0.5 ml/min. A calibration curve was produced using the following proteins and relative elution volumes: 7.5 ml for Blue Dextran (void volume), 11.5 ml for hemocyanin from Carcinus aestuarii (900 kDa), 12 ml for thyroglobulin (669 kDa), 14 ml for ferritin (440 kDa) and 12.5 ml for catalase (232 kDa). Fractions of 0.25 ml were collected and spotted onto a nitrocellulose mem-brane and analyzed by dot blot. The memmem-brane was blocked with 10 % milk in TTBS and incubated with mouse monoclonal anti-Flag M2-peroxidase (Sigma-Al-drich, St. Louis, MO, USA) or anti-myc (Roche) in TTBS with 10 % milk. A secondary rabbit antibody (Sigma-Al-drich, St. Louis, MO, USA) was used to stain the anti-myc. Immunoproteins were visualized using ECL (GE, Healthcare, Waukesha, WI, USA).
Electron microscopy
Purified NSF proteins were incubated with 1 mM ATP
and 2 mM MgCl2. A total of 15 ng of protein was
adsorbed few minutes to a glow-discharged carbon-coated copper grid, washed with deionized water, and stained with 1 % uranyl acetate. Images were collected using a Fei Tecnai T12 electron microscope equipped with a LaB6 filament and operated at an acceleration voltage of 100 kV.
In vitro kinase assay
Purified NSFs eluted in kinase assay buffer were incu-bated with LRRK2 proteins dissolved in kinase buffer for
1 h at 30 °C in the presence of 33P-ATP (1 μCi) and
10μM cold ATP as previously described [31].
Incorporated 33P-ATP was detected by
autoradiog-raphy or by Phospho-Imager system (Cyclone, Perkin-Elmer). The same membranes were probed with anti-Flag antibody for total protein loading and analyzed using ImageJ software.
SypHy assay
We infected DIV4 primary neurons with viruses express-ing sypHy, a fusion construct of synaptophysin and super ecliptic pHluorin [29]. At DIV14 neurons were
treated with DMSO (control) or GSK2578215A (0.2μM,
2 h). Syphy positive boutons were assayed in a stimula-tion chamber on the stage of a Zeiss Axiovert 200 M equipped with a mono-chromator (Poly V) and a cooled CCD camera (PCO, Imago QE), both from TILL pho-tonics (Gräfelfing, Germany). The assay was carried out as described previously [46]. Briefly, cells were
sub-merged in 500μl of KRH buffer (125 mM NaCl, 5 mM
KCl, 1.8 mM CaCl2 2.6 mM MgSO4 5 mM Hepes,
pH 7.2) in presence of APV (2 μM, Sigma-Aldrich, St.
Louis, MO, USA) and CNQX (2μM, Sigma-Aldrich, St.
Louis, MO, USA). SypHy was excited at 475 nm and its fluorescence emission collected at 525 nm using a 60X, 1.1 NA water immersion objective. Images were ac-quired every second for 200 s using TillVision software (TILL Photonics). At frame 30, cells were stimulated with 40 action potential (AP, 20Hz) then at frame 70 with 300 AP (20 Hz). Total fluorescence was measured
upon incubation with 50 mM NH4Cl. Quantitative
mea-surements of the fluorescence intensity at individual boutons were obtained by averaging a selected area of pixel intensities using ImageJ. Net fluorescence changes (ΔF) were obtained by subtracting the average intensity of the first 15 frames (F0) from the intensity of each frame (Ft) for individual boutons and normalized F0 (ΔF/F0). The fluorescence increase and decay, reflect exo- and endocytosis, respectively [29]. Both the fluores-cence upstroke and decay were fitted with a single expo-nential τ (τupstroke and τdecay respectively). Data are
expressed as mean ± SEM and statistical significance was assessed by unpaired two-tailed Student’s t test (Graph-Pad Prism).
Exo/endocytotic assay
The endocytosis assay to monitor SV recycling was per-formed using rabbit polyclonal antibodies directed against the intravesicular domain of synaptotagmin1 (Synaptic System), applied for 5 min at RT on the cul-tures, as described previously [30]. Incubations with the antibody (1:400) were performed in Tyrode solution
containing 124 mM NaCl, 5 mM KCl, 2 mM MgCl2,
30 mM glucose, 25 mM HEPES, pH 7.4 and 2 mM CaCl2. After fixation and permeabilization, a
1:400 (Sigma-Aldrich) visualized the totality of synaptic vesicles. Acquired images were processed and quantita-tively analyzed with ImageJ software as previously de-scribed [47]. Briefly, cultures were infected at DIV4 with GPF expressing viruses and assayed at DIV14 as in [22]. GFP positive processes were manually tracked and the number of synaptotagmin and synaptophysin positive clusters and synaptophysin positive clusters present in the region of interest were automatically counted. Proteins digestion
Approximately 2μg of purified NSF pre-dephosphorylated
with alkaline phosphatase (Promega) and subsequently phosphorylated or not with LRRK2 in the presence of
100 μM ATP were loaded into a SDS-precasted gel
(Biorad). Gel slices corresponding to purified NSF were
ex-cised, cut in smaller pieces, dehydrated with 100 μl of
acetonitrile (ACN) for 10 min, then dried under vacuum.
A protein reduction step was performed with 100 μl of
freshly prepared 10 mM Dithiothreitol (DTT, Fluka) in
50 mM NH4HCO3, at 56 °C. After 1 h DTT solution was
discarded and 100 μl of a freshly prepared solution of
55 mM iodoacetamide (Sigma-Aldrich, St. Louis, MO,
USA) in 50 mM NH4HCO3was added to the gel pieces
for 45 min at room temperature and in the dark. Gel pieces were washed 4 times (10 min each) alternating
100 μl of 25 mM NH4HCO3 and 100 μl of ACN, dried
under vacuum, and suspended in 20 μl of a sequencing
grade modified trypsin solution (Promega, 12.5 ng/mL in 25 mM NH4HCO3). Digestion was performed overnight at
37 °C. Peptides were extracted with three changes (50μl each) of 50 % ACN/0.1 % formic acid (FA, Fluka). Samples
were dried under vacuum and stored at −20 °C till the
phosphopeptide enrichment procedure was performed. Enrichment of phosphopeptides
Phosphopeptides were enriched with home made
micro-columns of TiO2 as previously described [48]. TiO2
micro-columns were conditioned twice with 50 μl of
ACN and twice with loading buffer (80 % ACN/6 % tri-fluoroacetic acid (TFA, Riedel-de Haën)). Samples were
suspended in 50 μl of loading buffer and slowly loaded
into the columns, which were then washed twice with
50 μl of loading buffer and twice with washing buffer
(0.1 % TFA). Phosphopeptides bound to TiO2 were
eluted with 50 μl of freshly prepared 5 % NH4OH and
subsequently with 50μl of 50 % ACN/0.1 % FA. Samples
were immediately acidified by adding 5 μl of 100 % FA
and dried under vacuum. Mass spectrometry analysis
Mass spectrometry analysis of phosphopeptides was per-formed with a LTQ-Orbitrap XL mass spectrometer (Thermo Fisher Scientific) coupled online with a
nano-HPLC Ultimate 3000 (Dionex-Thermo Fisher Scientific).
Samples were dissolved in 30 μl of 3 % ACN/0.1 % FA
and for every analysis 8 μl of sample were loaded at a
flow rate of 8μl/min into a trap column (300 mm I.D.,
300 Å, C18, 3 mm; SGE Analytical Science). Samples were injected into a home-made 10 cm pico-frit capillary
column (75μm I.D., 15 μm tip; New Objective) packed
with C18 material (Aeris Peptide 3.6 um XB-C18, Phe-nomenex). Peptides were separated using a linear gradi-ent from 3 to 40 % of ACN/0.1 FA in 20 min at a flow rate of 250 nl/min.
To increase the confidence in the identification of phosphopeptides, the MS analysis of each sample was performed with three different acquisition methods, as
reported in [49]. A MS2 data dependent acquisition (1
full-MS scan in the range 300–1700 Da on the Orbitrap with a resolution of 60,000, followed by MS/MS spectra acquired in the linear ion trap for the ten most abundant ions); a MS3neutral loss-triggered dependent acquisition (one full-MS scan on the Orbitrap, followed by MS/MS
scans on the three most intense ions and by MS3upon
detection of neutral loss of phosphoric acid in MS2 spec-tra); a Multi Stage Acquisition (MSA) (1 full-MS scan at a resolution of 60,000 followed by MS/MS scans on the three most abundant ions with the activation of neutral loss product without an additional isolation cycle).
Raw data files were analyzed with Proteome Discov-erer software (version 1.4, Thermo Fisher Scientific) con-nected to a Mascot Server version 2.2.4 (Matrix Science, UK) and a SequestHT search engine version 28.0 (Thermo Fisher Scientific) against the Uniprot Human Database (version 2013.11.13 used by SequestHT, ver-sion 2014.04.16 used by Mascot). Trypsin was set as digesting enzyme with up to two missed-cleavages. Car-bamidomethyl cysteine was set as fixed modification, while phosphorylation of Ser/Thr/Tyr and methionine oxidation were set as variable modifications. Peptide and fragment tolerance were 10 ppm and 0.6 Da respectively. Percolator was used to calculate False Discovery Rate (FDR) based on the search against the corresponding randomized database. MS/MS spectra of phosphopep-tides were manually inspected for confirmation and as-signment of phosphorylation sites.
ATPase enzymatic assay
NSF ATPase activity was quantified using the Malachite Green Assay by measuring the release of inorganic phos-phate (Pi) due to the ATP hydrolysis with spectropho-tometer. The assay was adapted from the method of Lanzetta et al. [50]. The Malachite Green Stock solution used for the assay was a mixture of two different solu-tions (one with 34 mg Malachite Green oxalate salt (Sigma-Aldrich. St. Louis, MO, USA) into 40 ml HCl
(Sigma-Aldrich, St. Louis, MO, USA) into 14 ml HCl 4 M to a final volume of 100 ml with distilled water and then fil-tered through 0,45 nm. The concentration of human NSF used for the ATPase assay was 216 nM (36 nM hexameric concentration) with different ATP concentra-tion. Reaction was performed at 37 °C and followed for
120 min. The time point aliquots collected (20 μl) were
mixed with 150 μl of Malachite Green stock solution
until the solution became homogenous and the absorb-ance measured at 640 nm using a corresponding Mal-achite Green solution as blank. The values of absorbance
were then converted into μmol of free Pi in solution
using a standard curve. To reported values for the kin-etic constants (Km, kcat and Vmax) were obtained by data
fitting with the Michaelis-Menten kinetic model (Y = Vmax*S/(Km + [S])).
Reverse-phase HPLC ATPase assay
To determine the ATPase activity of NSF, 500 or
700μM ATP was added to 0.2 μM 3xFlag-NSF wt.
Pro-teins were purified as previously described and incu-bated at 37 °C for 1 h in the same kinase buffers and conditions of the Malachite Green Assay. At the
re-ported time-points, aliquots (20 μl) were taken up to
120 min and heated for 3 min at 95 °C with 0.1 M of
EDTA to stop the reaction. Samples were stored at−80 °
C. Reverse Phase High-Performance Liquid Chromatog-raphy (RP-HPLC) was used to monitor the amount of ATP and ADP present in the sample. Nucleotides were separated on a Jupiter 5u C4 300A (Phenomenex) col-umn using an Agilent HP 1100 HPLC, pre-equilibrated
with 50 mM NaH2PO4 pH 6.5, 10 mM
Tetra-n-butylammonium bromide and 4 % ACN. The flow-rate used was 0.5 ml/min and the amount of the nucleotides was monitored measuring the increase in area of the peak corresponding to ADP measured at 256 nm with a total run time of 35 min. To convert this value to the Pi released by the reaction, a standard curve generated with different ADP concentration was used. ADP concentra-tions detected in the assay were plotted as a function of time and an equation was obtained through linear re-gression with GraphPad Prism 5.
Recombinant alpha SNAP and SNARE proteins production Rat alpha-SNAP cloned in pET28 plasmid in fusion with a His-tag was a kind gift of Dr. Reinhard Jahn, Max-Planck-Institute, Göttingen). Alpha-SNAP was subse-quently expressed in E. Coli in BL21(DE3) strain. Bac-teria were grown at 37 °C to an OD at 600 nm of 0.4–
0.6, then induced with 0.25 mM isopropyl
β-D-1-thio-galactopyranoside (IPTG) for 4 h. Cells were then har-vested by centrifugation and the pellet of 250 ml of culture was resuspended in 5–10 ml of Tris–HCl
pH 8.0. Phenylmethylsulfonyl fluoride (PMSF) 100 μM
and a cocktail of protease inhibitors were added to the cells 1:100 (v/v) that were subsequently subjected to one French Press cycles (Constant Systems Ltd). The cell homogenate was centrifuged and the supernatant loaded
onto a Co2+ affinity column and eluted with a 0–
500 mM linear gradient of imidazole at 0.5 ml/min. Pro-tein solution was dialyzed versus Tris–HCl 20 mM pH 7.5, NaCl 150 mM.
Soluble SNARE complex was obtained by
co-expression of wild type SNAP-25A, of syntaxin-1A and of His-tagged VAMP2(1–96) using the Duet expression system (Novagen) in E. Coli in BL21(DE3) strain. VAMP2(1–96)-His6-TEV pACYC-Duet and syntaxin-1A/SNAP-25A pET-Duet were a kind gift of Prof. A. Brunger (Stanford University, California) [34]. Bacteria were grown at 37 °C to an OD at 600 nm of 0.6–0.8, then induced with 0.5 mM IPTG for 4 h. Cell pellets of 250 ml of culture were suspended in 10 ml of 50 mM NaPi, pH 8.0, 300 mM NaCl, 20 mM imidazole and 0.5 mM Tris(2-carboxyethyl)phosphine (TCEP) (SNARE
buffer), supplemented with PMSF 100 μM and protease
inhibitors cocktail. Cell were lyses by two French Press cycles (Constant Systems Ltd) and the lysate was clari-fied by centrifugation for 1 h at 15,000 g at 4 °C. The
supernatant was loaded onto a 1-ml Ni2+ affinity
col-umn, washed with 20 ml of SNARE buffer containing 7.5 M urea and then with 20 ml of SNARE buffer. The complex was then eluted with SNARE buffer containing 350 mM imidazole. After elution, SNARE complex was subjected to size exclusion chromatography using a Superdex 200 10/300 (GE Helthcare) that was equili-brated with 50 mM Tris–HCl, pH 7.5, 100 mM NaCl. The SNARE complex was checked and quantified by SDS-PAGE.
SNARE dissociation assay
As previously described [34] the SNARE dissociation
as-says were performed at 37 °C in 240 μl in a 1.5 ml
micro-tube. The assay buffer was composed of 25 mM Tris–HCl pH 7.5, 5 mM β–glycerophosphate, 2 mM
dithiotreitol (DTT), 0.1 mM Na3VO4, 10 mM MgCl2
and 0.007 % polysorbate 20. Subsequently 1.5 μM
αSNAP, 480 nM SNAREs, 24 nM NSF (hexameric con-centration) phosphorylated or not by LRRK2 (ratio NSF:LRRK2 20:1) were added in the presence of 2 mM ATP to start the reaction. At defined time points, an
ali-quot (20 μl) was collected and loaded into an
SDS-PAGE gel without boiling the samples: being the SNARE complex is SDS-resistant, it runs as a single band on SDS-PAGE gel. The intensity of each SNARE complex band was calculated and normalized to its time zero. The experiments were performed in triplicate up to 150 min of reaction.
Circular Dichroism (CD)
CD measurements were carried out on a JASCO J-810 spectropolarimeter interfaced with a personal computer. The CD spectra were acquired and processed using the J-700 software for Windows. All experiments were done at room temperature using an optical path length of 0.2 cm. The wavelength range of the measurements was 197–250 nm, using a bandwidth of 2 nm and a time constant of 8 s at a scan speed of 50 nm/min. The signal to noise ratio was improved by accumulating four scans. Spectra were acquired using purified proteins in the elu-tion buffer (20 mM Tris–HCl pH 7.5, 150 mM NaCl and 0.007 % polysorbate-20) using the same buffer with 3xFlag peptide as a control. All the spectra are reported in terms of mean residue molar ellipticity (deg cm2dmol
−1). Protein concentrations in the samples were
deter-mined by SDS-PAGE and all the spectra were normal-ized for the measured protein concentration.
Intrinsic fluorescence
Fluorescence emission spectra were recorded on a Cary Eclipse fluorescence spectrophotometer (Varian, Agilent Technologies, Santa Clara, CA) using the Cary Eclipse program. Sample measurements were carried out using optical path length of 10 mm. Fluorescence spectra were obtained using an excitation wavelength of 288 nm, with an excitation bandwidth of 5 nm and slit width of 10 nm. Emission spectra were recorded between 300 and 400 nm at a scan rate of 30 nm/sec. Spectra were acquired using 80 nM proteins in 20 mM Tris/HCl buf-fer (pH 7.5), 150 mM NaCl and 0.02 % Tween 20. Statistical analysis
All quantitative data are expressed as mean ± SEM and rep-resent at least three independent sets of experiments. Sig-nificance of differences between two groups was assessed by two-tailed unpaired t-test or one-way or two-way
ANOVA with Bonferroni’s post-test when more than two
groups were compared. Significance was set at p < 0.05. Additional file
Additional file 1: Figure S1. Expression and phosphorylation of LRRK2 in primary cortical neurons subjected to SypHy assays. Figure S2. Biochemical validation of recombinant human NSF. Figure S3. LRRK2 phosphorylation of NSF occurs within the first 30 minutes. Figure S4. LC-MS/MS analysis of NSF phosphorylated by LRRK2. Figure S5. PKC does not phosphorylate NSF at T645. Figure S6. Evaluation of optimal deter-gent concentration for LRRK2 and NSF activities. Figure S7. NSF wild-type and T645A have similar overall folding and T645A forms hexamers. Figure S8. Expression and purification of SDS-resistant SNARE complex. (DOCX 2062 kb)
Abbreviations
NSF:n-ethylmaleimide sensitive fusion; LRRK2: leucine-rich repeat kinase 2; SNARE: soluble NSF-attachment protein receptor; PD: Parkinson’s disease; ANOVA: analysis of variance; TBS: tris-buffered saline; SV: synaptic vesicles;
sypHy: synaptophysin-pHluorin; CD: circular dichroism; MS: mass spectrometry; TEM: transmission electron microscopy; DIV: days in vitro.
Competing interests
The authors declare that they have no competing interests.
Authors’ contributions
EB and AG performed and analyzed the kinase, ATPase and SNARE disassembling assays. MDC performed and analyzed the sypHy assay. AM performed the co-immunoprecipitation from synaptosomes. NP expressed and purified the SNARE complex. IR and LC helped with the in vitro experiments. SC cloned the NSF con-structs. MPC measured LRRK2 steady state levels in primary neurons. CF and GA performed the LC-MS/MS. MB, LB, FO, GP and EG conceived the study, designed the experiments and analyzed the data. EG wrote the paper with contribution from all authors. All authors read and approved the final manuscript.
Funding
We would like to thank Dr. Patrick Lewis for proofreading the manuscript. This study was supported by the Michael J Fox Foundation (to EG, FO and GP). We also thank the financial support of Telethon - Italy (Grant no. GGP12237 to EG, FO and GP) and the University of Padova (Progetto di Ateneo CPDA 124045/12 to MB), Regione Lombardia (Projects MbMM-Convenzione No. 18099/RCC to GP) and Fondazione Grigioni per il morbo di Parkinson (GP). We gratefully thank Prof. Axel T. Brunger and Dr. Sandro Vivona for the kind gift of the soluble SNARE constructs. The authors wish to thank the“Cassa di Risparmio di Padova e Rovigo” (Cariparo) for funding the acquisition of the LTQ-Orbitrap XL mass spectrometer.
Author details
1Department of Biology, University of Padova, via Ugo Bassi 58/B, 35131
Padova, Italy.2San Raffaele Scientific Park & University Vita-Salute San
Raffaele, Milan, Italy.3Department of Experimental Medicine, University of
Genova, Genova, Italy.4Department of Biomedical Sciences, University of
Padova, Padova, Italy.5Proteomics Center of Padova University, Padova, Italy. 6IN-CNR Milano, Milano, Italy.7Present Address: Department of Cell and
Developmental Biology, University College London, London WC1E 6BT, UK.
8Present Address: Rheumatology Unit, Department of Medicine– DIMED,
University Hospital of Padova, Padova, Italy.
Received: 24 July 2015 Accepted: 22 December 2015
References
1. Gasper R, Meyer S, Gotthardt K, Sirajuddin M, Wittinghofer A. It takes two to tango: regulation of G proteins by dimerization. Nat Rev Mol Cell Biol. 2009; 10(6):423–9. doi:10.1038/nrm2689.
2. Taymans JM. The GTPase function of LRRK2. Biochem Soc Trans. 2012;40(5): 1063–9. doi:10.1042/BST20120133.
3. Greggio E. Role of LRRK2 kinase activity in the pathogenesis of Parkinson’s disease. Biochem Soc Trans. 2012;40(5):1058–62. doi:10.1042/BST20120054. 4. Paisan-Ruiz C, Jain S, Evans EW, Gilks WP, Simon J, van der Brug M, et al.
Cloning of the gene containing mutations that cause PARK8-linked Parkinson’s disease. Neuron. 2004;44(4):595–600. doi:10.1016/j.neuron.2004.10.023. 5. Zimprich A, Biskup S, Leitner P, Lichtner P, Farrer M, Lincoln S, et al. Mutations in
LRRK2 cause autosomal-dominant parkinsonism with pleomorphic pathology. Neuron. 2004;44(4):601–7. doi:10.1016/j.neuron.2004.11.005.
6. Satake W, Nakabayashi Y, Mizuta I, Hirota Y, Ito C, Kubo M, et al. Genome-wide association study identifies common variants at four loci as genetic risk factors for Parkinson’s disease. Nat Genet. 2009;41(12):1303–7. doi:10. 1038/ng.485.
7. Simon-Sanchez J, Schulte C, Bras JM, Sharma M, Gibbs JR, Berg D, et al. Genome-wide association study reveals genetic risk underlying Parkinson’s disease. Nat Genet. 2009;41(12):1308–12. doi:10.1038/ng.487.
8. Rudenko IN, Cookson MR. Heterogeneity of leucine-rich repeat kinase 2 mutations: genetics, mechanisms and therapeutic implications. Neurotherapeutics. 2014;11(4):738–50. doi:10.1007/s13311-014-0284-z. 9. Reynolds A, Doggett EA, Riddle SM, Lebakken CS, Nichols RJ. LRRK2 kinase
activity and biology are not uniformly predicted by its autophosphorylation and cellular phosphorylation site status. Front Mol Neurosci. 2014;7:54. doi:10.3389/fnmol.2014.00054.
10. Alegre-Abarrategui J, Christian H, Lufino MM, Mutihac R, Venda LL, Ansorge O, et al. LRRK2 regulates autophagic activity and localizes to specific membrane microdomains in a novel human genomic reporter cellular model. Hum Mol Genet. 2009;18(21):4022–34.
doi:10.1093/hmg/ddp346.
11. Beilina A, Rudenko IN, Kaganovich A, Civiero L, Chau H, Kalia SK, et al. Unbiased screen for interactors of leucine-rich repeat kinase 2 supports a common pathway for sporadic and familial Parkinson disease. Proc Natl Acad Sci. 2014;111(7):2626–31. doi:10.1073/pnas.1318306111.
12. Berger Z, Smith KA, Lavoie MJ. Membrane localization of LRRK2 is associated with increased formation of the highly active LRRK2 dimer and changes in its phosphorylation. Biochemistry. 2010;49(26):5511–23.
doi:10.1021/bi100157u.
13. Biskup S, Moore DJ, Celsi F, Higashi S, West AB, Andrabi SA, et al. Localization of LRRK2 to membranous and vesicular structures in mammalian brain. Ann Neurol. 2006;60(5):557–69. doi:10.1002/ana.21019.
14. Hatano T, S-i K, Imai S, Maeda M, Ishikawa K, Mizuno Y, et al. Leucine-rich repeat kinase 2 associates with lipid rafts. Hum Mol Genet. 2007;16(6):678–90. doi:10.1093/hmg/ddm013.
15. Shin N, Jeong H, Kwon J, Heo HY, Kwon JJ, Yun HJ, et al. LRRK2 regulates synaptic vesicle endocytosis. Exp Cell Res. 2008;314(10):2055–65. doi:10. 1016/j.yexcr.2008.02.015.
16. Beccano-Kelly DA, Kuhlmann N, Tatarnikov I, Volta M, Munsie LN, Chou P, et al. Synaptic function is modulated by LRRK2 and glutamate release is increased in cortical neurons of G2019S LRRK2 knock-in mice. Front Cell Neurosci. 2014;8: 301. doi:10.3389/fncel.2014.00301.
17. Li X, Patel JC, Wang J, Avshalumov MV, Nicholson C, Buxbaum JD, et al. Enhanced striatal dopamine transmission and motor performance with LRRK2 overexpression in mice is eliminated by familial Parkinson’s disease mutation G2019S. J Neurosci. 2010;30(5):1788–97. doi:10.1523/JNEUROSCI.5604-09.2010. 18. Li Y, Liu W, Oo TF, Wang L, Tang Y, Jackson-Lewis V, et al. Mutant
LRRK2(R1441G) BAC transgenic mice recapitulate cardinal features of Parkinson’s disease.
Nat Neurosci. 2009;12(7):826–8. doi:10.1038/nn.2349.
19. Tong Y, Pisani A, Martella G, Karouani M, Yamaguchi H, Pothos EN, et al. R1441C mutation in LRRK2 impairs dopaminergic neurotransmission in mice. Proc Natl Acad Sci U S A. 2009;106(34):14622–7. doi:10.1073/pnas. 0906334106.
20. Piccoli G, Condliffe SB, Bauer M, Giesert F, Boldt K, De Astis S, et al. LRRK2 controls synaptic vesicle storage and mobilization within the recycling pool. J Neurosci. 2011;31(6):2225–37. doi:10.1523/JNEUROSCI.3730-10.2011. 21. Piccoli G, Onofri F, Cirnaru MD, Kaiser CJ, Jagtap P, Kastenmuller A, et al.
LRRK2 binds to neuronal vesicles through protein interactions mediated by its C-terminal WD40 domain. Mol Cell Biol. 2014;34:2147–61.
doi:10.1128/MCB.00914-13.
22. Cirnaru MD, Marte A, Belluzzi E, Russo I, Gabrielli M, Longo F, et al. LRRK2 kinase activity regulates synaptic vesicle trafficking and neurotransmitter release through modulation of LRRK2 macro-molecular complex. Front Mol Neurosci. 2014;7:49. doi:10.3389/fnmol.2014.00049.
23. Sudhof TC, Rizo J (2011) Synaptic vesicle exocytosis. Cold Spring Harb Perspect Biol 3 (12). doi: 10.1101/cshperspect.a005637
24. Huynh H, Bottini N, Williams S, Cherepanov V, Musumeci L, Saito K, et al. Control of vesicle fusion by a tyrosine phosphatase. Nat Cell Biol. 2004;6(9): 831–9. doi:10.1038/ncb1164.
25. Liu Y, Cheng K, Gong K, Fu AK, Ip NY. Pctaire1 phosphorylates N-ethylmaleimide-sensitive fusion protein: implications in the regulation of its hexamerization and exocytosis. J Biol Chem. 2006;281(15):9852–8. doi:10. 1074/jbc.M513496200.
26. Matveeva EA, Whiteheart SW, Vanaman TC, Slevin JT. Phosphorylation of the N-ethylmaleimide-sensitive factor is associated with depolarization-dependent neurotransmitter release from synaptosomes. J Biol Chem. 2001; 276(15):12174–81. doi:10.1074/jbc.M007394200.
27. Reith AD, Bamborough P, Jandu K, Andreotti D, Mensah L, Dossang P, et al. GSK2578215A; a potent and highly selective 2-arylmethyloxy-5-substitutent-N-arylbenzamide LRRK2 kinase inhibitor. Bioorg Med Chem Lett. 2012;22(17): 5625–9. doi:10.1016/j.bmcl.2012.06.104.
28. Melrose HL, Dachsel JC, Behrouz B, Lincoln SJ, Yue M, Hinkle KM, et al. Impaired dopaminergic neurotransmission and microtubule-associated protein tau alterations in human LRRK2 transgenic mice. Neurobiol Dis. 2010;40(3): 503–17. doi:10.1016/j.nbd.2010.07.010.
29. Granseth B, Odermatt B, Royle SJ, Lagnado L. Clathrin-mediated endocytosis is the dominant mechanism of vesicle retrieval at hippocampal synapses. Neuron. 2006;51(6):773–86. doi:10.1016/j.neuron.2006.08.029.
30. Matteoli M, Takei K, Perin MS, Sudhof TC, De Camilli P. Exo-endocytotic recycling of synaptic vesicles in developing processes of cultured hippocampal neurons. J Cell Biol. 1992;117(4):849–61.
31. Civiero L, Vancraenenbroeck R, Belluzzi E, Beilina A, Lobbestael E, Reyniers L, et al. Biochemical characterization of highly purified leucine-rich repeat kinases 1 and 2 demonstrates formation of homodimers. PLoS One. 2012; 7(8):e43472. doi:10.1371/journal.pone.0043472.
32. Webber PJ, Smith AD, Sen S, Renfrow MB, Mobley JA, West AB. Autophosphorylation in the leucine-rich repeat kinase 2 (LRRK2) GTPase domain modifies kinase and GTP-binding activities. J Mol Biol. 2011;412(1):94–110. doi:10.1016/j.jmb.2011.07.033. 33. Zhao C, Slevin JT, Whiteheart SW. Cellular functions of NSF: not just SNAPs
and SNAREs. FEBS Lett. 2007;581(11):2140–9. doi:10.1016/j.febslet.2007.03. 032.
34. Cipriano DJ, Jung J, Vivona S, Fenn TD, Brunger AT, Bryant Z. Processive ATP-driven Substrate Disassembly by the N-Ethylmaleimide-sensitive Factor (NSF) Molecular Machine. J Biol Chem. 2013;288(32):23436–45. doi:10.1074/ jbc.M113.476705.
35. Vivona S, Cipriano DJ, O’Leary S, Li YH, Fenn TD, Brunger AT. Disassembly of all SNARE complexes by N-ethylmaleimide-sensitive factor (NSF) is initiated by a conserved 1:1 interaction between alpha-soluble NSF attachment protein (SNAP) and SNARE complex. J Biol Chem. 2013;288(34):24984–91.
doi:10.1074/jbc.M113.489807.
36. Yun HJ, Park J, Ho DH, Kim H, Kim C-H, Oh H, et al. LRRK2 phosphorylates Snapin and inhibits interaction of Snapin with SNAP-25. Exp Mol Med. 2013; 45:e36. doi:10.1038/emm.2013.68.
37. Arranz AM, Delbroek L, Van Kolen K, Guimaraes MR, Mandemakers W, Daneels G, et al. LRRK2 functions in synaptic vesicle endocytosis through a kinase-dependent mechanism. J Cell Sci. 2015;128(3):541–52. doi:10.1242/jcs.158196. 38. Matta S, Van Kolen K, da Cunha R, van den Bogaart G, Mandemakers W,
Miskiewicz K, et al. LRRK2 Controls an EndoA Phosphorylation Cycle in Synaptic Endocytosis. Neuron. 2012;75(6):1008–21. http://dx.doi.org/10.1016/ j.neuron.2012.08.022.
39. Martin I, Kim JW, Lee BD, Kang HC, Xu JC, Jia H, et al. Ribosomal protein s15 phosphorylation mediates LRRK2 neurodegeneration in Parkinson’s disease. Cell. 2014;157(2):472–85. doi:10.1016/j.cell.2014.01.064.
40. Matveeva EA, He P, Whiteheart SW. N-Ethylmaleimide-sensitive fusion protein contains high and low affinity ATP-binding sites that are functionally distinct. J Biol Chem. 1997;272(42):26413–8.
41. Yu RC, Hanson PI, Jahn R, Brunger AT. Structure of the ATP-dependent oligomerization domain of N-ethylmaleimide sensitive factor complexed with ATP. Nat Struct Biol. 1998;5(9):803–11. doi:10.1038/1843.
42. Liu G, Sgobio C, Gu X, Sun L, Lin X, Yu J, Parisiadou L, Xie C, Sastry N, Ding J, Lohr KM, Miller GW, Mateo Y, Lovinger DM, Cai H (2015) Selective Expression of Parkinson’s disease-related Leucine-rich Repeat Kinase 2 G2019S Missense Mutation in Midbrain Dopaminergic Neurons Impairs Dopamine Release and Dopaminergic Gene Expression. Hum Mol Genet. doi: 10.1093/hmg/ddv249
43. Fuji RN, Flagella M, Baca M, Baptista MA, Brodbeck J, Chan BK, et al. Effect of selective LRRK2 kinase inhibition on nonhuman primate lung. Sci Transl Med. 2015;7(273):273ra215. doi:10.1126/scitranslmed.aaa3634.
44. Piccoli G, Verpelli C, Tonna N, Romorini S, Alessio M, Nairn AC, et al. Proteomic analysis of activity-dependent synaptic plasticity in hippocampal neurons. J Proteome Res. 2007;6(8):3203–15. doi:10.1021/pr0701308.
45. Nakamura Y, Iga K, Shibata T, Shudo M, Kataoka K. Glial plasmalemmal vesicles: a subcellular fraction from rat hippocampal homogenate distinct from synaptosomes. Glia. 1993;9(1):48–56. doi:10.1002/glia.440090107. 46. Sankaranarayanan S, Ryan TA. Real-time measurements of vesicle-SNARE
recycling in synapses of the central nervous system. Nat Cell Biol. 2000;2(4): 197–204. doi:10.1038/35008615.
47. Verderio C, Coco S, Bacci A, Rossetto O, De Camilli P, Montecucco C, et al. Tetanus toxin blocks the exocytosis of synaptic vesicles clustered at synapses but not of synaptic vesicles in isolated axons. J Neurosci. 1999; 19(16):6723–32.
48. Salvi M, Trashi E, Cozza G, Franchin C, Arrigoni G, Pinna LA. Investigation on PLK2 and PLK3 substrate recognition. Biochim Biophys Acta. 2012;1824(12): 1366–73. doi:10.1016/j.bbapap.2012.07.003.
49. Venerando A, Franchin C, Cant N, Cozza G, Pagano MA, Tosoni K, et al. Detection of phospho-sites generated by protein kinase CK2 in CFTR: mechanistic aspects of Thr1471 phosphorylation. PLoS One. 2013;8(9): e74232. doi:10.1371/journal.pone.0074232.
50. Lanzetta PA, Alvarez LJ, Reinach PS, Candia OA. An improved assay for nanomole amounts of inorganic phosphate. Anal Biochem. 1979;100(1):95–7.
• We accept pre-submission inquiries
• Our selector tool helps you to find the most relevant journal
• We provide round the clock customer support
• Convenient online submission
• Thorough peer review
• Inclusion in PubMed and all major indexing services
• Maximum visibility for your research Submit your manuscript at
www.biomedcentral.com/submit