Università degli Studi di Salerno
Dipartimento di Medicina e Chirurgia “Scuola Medica Salernitana” – Baronissi
Dottorato di ricerca in
“Medicina traslazionale dello sviluppo e dell’invecchiamento attivo”
XXIX CYCLE
Tesi di dottorato in
Metabolic control of FoxP3 expression in human
regulatory T cells
Coordinatore: Candidato: Prof. Corrado Rubino Dott.ssa Alessandra Colamatteo
Tutor:
Prof. Giuseppe Matarese
Volume unico
Index
1. Abstract...4
2. Introduction... 5-12 2.1 Regulatory T cell...5
2.2 Regulation of FoxP3 expression………..7
2.3 T cell metabolism ………... 8
2.4 Multiple Sclerosis………...10
3. Aim of the study ... 12
4. Materials and methods ………... 13-17 4.1 iTreg cell induction ... 13
4.2 Molecular signalling and Western blot analysis ... 13
4.3 Seahorse experiments ... 14
4.4 Cytofluorimetric analysis, T cell proliferation and CFSE staining ... 14
4.5 RNA extraction, qRT-PCR, qPCR and siRNA ... 15
4.6 Chromatin immunoprecipitation ... 16
4.7 Statistical analysis ... 17
5. Results ... 18-28 5.1 Generation of iTreg from Tconv cells following suboptimal TCR stimulation and their regulatory properties ... 18
5.2 Effect of either glycolysis or FAO inhibition on the generation, suppressive function and phenotypical markers of iTreg cells………... 20
5.3 Glycolysis influences FoxP3-E2 expression and suppressive function …… 22
5.5 Altered glycolysis and impaired suppressive function of human iTreg cells from RR-MS subjects………. 27
6. Discussion……… 29-30
7. Conclusion………... 31
1. Abstract
Regulatory CD4+CD25+ T (Treg) cells play a central role in the maintenance of
immune self-tolerance and homeostasis. Although Treg cells operate through multiple mechanisms, it appears that the expression of the transcription factor Forkhead-box-P3 (FoxP3) is crucial for their function. Here we describe human peripheral Treg (pTreg) cells that develop from CD4+CD25- T (Tconv) cells following suboptimal stimulation via the T cell antigen receptor (TCR). This population of pTreg cells, which we call inducible Treg (iTreg) cells, is characterized by high FoxP3 expression, strong suppressive capacity and an active proliferative and metabolic state. The development of iTreg cells tightly depends on glycolysis, which controls FoxP3 splicing variants containing exon 2 (FoxP3-E2), through the glycolytic enzyme enolase-1. Remarkably, iTreg cells suppressive activity is impaired in autoimmune diseases such as relapsing remitting multiple sclerosis (RR-MS), and associates with the reduction of FoxP3-E2 expression, secondarily to impaired glycolysis and IL-2/IL-2R/STAT-5 signalling. These results suggest a novel mechanism that links glucose metabolism to the induction of specific FoxP3 splicing variants, via enolase-1, that directly impact on human Treg cell function, in health and in autoimmunity.
2. Introduction
2.1 Regulatory T cells
Peripheral tolerance and immune homeostasis are maintained by different cellular subsets. One important subset is represented by naturally occurring regulatory T (Treg) cells, which constitutively express the transcription factor Forkhead-box-P3 (FoxP3). Their dysfunction (e.g. FoxP3 gene mutation) causes fatal autoimmune disease, immunopathology and allergy (1). FoxP3+Treg cells express CD25 (the interleukin-2 (IL-2) receptor α-chain), and are able to suppress the activation, proliferation and effector functions, a s a l s o cytokine production, of several immune cells, including CD4+ and CD8+ T cells, B cells and antigen-presenting cells (APCs), natural killer (NK) and NKT cells, both in vitro and in vivo (1, 2).
IL-2 has long been thought to be a major cytokine for T cell proliferation and differentiation, based on its effects on T cell growth in vitro. Moreover, FoxP3, together with other transcription factors and coactivators/corepressors, represses the transcription of IL-2 in Treg cells, rendering them hyporesponsive to a classical TCR stimulation and highly dependent on exogenous IL-2 (mainly produced by activated non-Treg cells) for their maintenance and function. FoxP3 also activates the genes encoding Treg-associated molecules such as CD25, Cytotoxic T-Lymphocyte Antigen 4 (CTLA-4) and Glucocorticoid-Induced TNF-Receptor-related protein (GITR) and confers suppressive activity to Treg cells (3). Treg cells express numerous surface molecules, essential for their function. Over to CD25, they express also selectins such as CD62 ligand (CD62L), CC-chemokine receptor 7 (CCR7) involved in lymph-node homing of naive and Treg cells and programmed cell death 1 (PD-1), that is able to suppress T cell proliferation and induce peripheral tolerance. Several groups showed that Treg cells are characterized by low levels of CD127 (IL-7 receptor α-chain). For this reason CD127 can be a useful alternative to CD25 for the delineation and purification of human Treg cells (4-6). The key role of FoxP3+ Treg cells is to prevent autoimmune disease, immunopathology and allergy. They are also involved in the maintenance of allograft and fetal-maternal tolerance during pregnancy (7). On the other hand, FoxP3+ Treg cells can also promote tumor progression by suppressing effective antitumor immunity (8). For all Treg cells, FoxP3 gene is important to regulate development and function. Its constitutive expression is the decisive factor driving the
immunosuppressive function of mouse and human Treg cells. FoxP3 gene mutation leads to severe systemic autoimmune inflammatory diseases both in mice (Scurfy disease) and humans (immune dysregulation, polyendocrinopathy, enteropathy, X-linked (IPEX) syndrome) (9-11).
There are two types of Treg cells: natural Treg (nTreg) cells, which develop in the thymus, and inducible peripheral Treg (iTreg) cells, which derive from naive CD4+ T cells in the periphery (Fig. 1) (12). The majority of FoxP3+ nTreg cells are produced by the thymus as an antigen-primed and functionally mature T cell subpopulation, specialized for immune suppression, and represent 5%-10% of the total peripheral CD4+ T cell subset. Thymic development of Treg cells requires high-affinity interactions between their T C R and self-peptide-MHC complexes presented by thymic stromal cells (13). The main role of FoxP3+ nTreg cells is to migrate to inflammation sites and suppress various effector lymphocytes, especially helper T (Th) cell subsets: Th1, Th2, Th17, and follicular Th (Tfh) cells (14, 15).
(Jochen H. et al. Seminars in Immunology 2015)
Fig. 1: Treg cells can either differentiate in the thymus from Treg-cell precursors giving rise to thymus-derived Treg cells or in the
periphery from naive conventional FoxP3-T cells giving rise to peripherally-induced Treg cells.
Previous studies have shown that TGF-β signalling and costimulation of TCR are able to convert CD4+CD25-conventional T cells (Tconv) in Treg cells, through the induction of FoxP3 expression, both in human and mice (16). However, cytokines can be dispensable for the generation of human iTreg cells, as these cells can also be generated by in vitro stimulation of Tconv cells in a cytokine-independent manner (17, 18).
2.2 Regulation of FoxP3 expression
FoxP3 is a master regulator of Treg cell differentiation and function and its expression is finely controlled at transcriptional and epigenetic level. The human FoxP3 gene is located at the small arm of the X-chromosome (p11.23-13.3), with 11 different coding exons, 3 noncoding exons, and 104 introns (19). After TCR stimulation, different Trascription Factors (TFs) (e.g. NFAT, AP1, CREB, Runx and c-Rel) are able to bind specific non-coding sequences (CNS1, CNS2 and CNS3), and determine FoxP3 gene regulation (20).
DNA methylation and histone modification are two major epigenetic mechanisms that cooperate to modify chromatin structure. In particular, a conserved CpG island named Treg-specific demethylated region (TSDR) in the CNS2 region has also been found.
(Piccirillo C. A. et al. Trends Mol. Med. 2012)
Fig. 2: Schematic representation of FoxP3 gene structure.
The methylation status of this region regulates FoxP3 expression level and the stability of Treg cells (Fig. 2). TSDR can lead to chromatin condensation when methylated, reducing the accessibility of DNA sequences and inhibiting the transcription of FoxP3. TSDR demethylation is essential for the transcription and the stability of FoxP3 in Treg cells, while partial methylation at the TSDR underlies the more labile FoxP3 expression seen in TGF-β-induced Treg (20, 21). The regulation of FoxP3 transcription is also related to the modification of the histone proteins. Histone acetylation is required for DNA transcription and its methylation inhibits DNA transcription (22). FoxP3 can be also regulated at the protein level by ubiquitination, phosphorylation and other post-translational modifications, that are important in determining the structural and physical properties of this protein and the complex that it forms in Treg cells, with significant functional consequences on its expression (23, 24). In addition,
through dimeric or inter-protein interactions, FoxP3 can form large protein complexes to regulate the expression of several genes associated with the Treg cell phenotype (25).
The identification and different regulation of FoxP3 splicing variants represents an additional level of complexity in the biology of human FoxP3. To date, it has been described about 12 different FoxP3 transcripts in humans, which can give rise to 4 to 8 different splicing forms of the protein, with a molecular weight ranging from 18 to 49 kDa. However, the molecular events driving their expression, as well as the functional relevance of these proteins, has been not completely understood (26-29). The four main alternatively spliced isoforms of FoxP3 identified in human Treg cells are full-lenght (FoxP3FL), isoforms lacking exon 2 (FoxP3Δ2) or exon 7 (FoxP3Δ7) and isoforms lacking both exon 2 and exon 7 (FoxP3Δ2Δ7)(30).
2.3 T cell metabolism
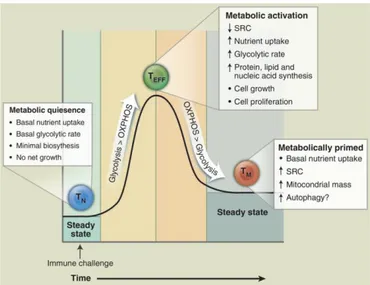
Several evidences revealed that T cell metabolism changes in course of activation. In particular, T cells dramatically alter their metabolic activity to meet the increased metabolic demands of cell growth, proliferation and effector function. More specifically, resting naïve T cells, that have not yet encountered antigen, maintain low rates of glycolysis and principally use oxidative phosphorilation (OXPHOS) or fatty acid oxidation (FAO) to produce ATP (31). Upon activation, T cells preferentially use glycolysis, to sustain their proliferation and effector functions. In this state, T cells are considered metabolically active (Fig. 3). TCR signalling controls the metabolic reprogramming of naïve T cells through the up-regulation of glucose and aminoacid transporters, facilitating nutrient uptake and T cell generation (32, 33).
Interestingly, immune-mediated disorders, such as Multiple Sclerosis (MS), display several metabolic alterations (34). In particular, Treg cells display a high degree of plasticity associated with different transcriptional programs, which are affected by cellular metabolism (35). In vivo, human Treg cells display a high glycolytic rate associated with hyperactivation of the environmental sensor mammalian target of rapamycin (mTOR). Furthermore, in vitro-proliferating
human Treg cells engage both glycolysis and FAO, whereas Tconv cells preferentially use aerobic glycolysis to generate ATP (35).
In vivo Treg cell metabolism is dynamic and finely regulated to ensure their
function, being intimately connected to the oscillatory cues, such as the strenght of TCR signal, cytokyne milieu and nutrient availability. Treg cells are highly proliferative in vivo, and their state reflects higher mTOR activity and ATP levels as compared to Tconv cells that do not proliferate in vivo. Previous studies have shown that different metabolic programs are able to modulate FoxP3 expression and, consequently, Treg lineage differentiation in vivo and in vitro (36, 37). FoxP3 expression is regulated also by pyruvate metabolism, a checkpoint in glucose metabolism. Pyruvate dehydrogenase contributes to the transformation of pyruvate into mitochondrial acetyl-CoA for oxidative metabolism, that also control FoxP3 stability. It is well known that Treg cells use both glycolysis and FAO to sustain their differentiation, phenotype stabilization and function, but how these metabolic pathways may influence FoxP3 expresssion is not well understood (35).
(Pearce E. L. et al. Science 2013)
2.4 Multiple Sclerosis
MS is one of the most common chronic and disabling disorders of the central nervous system (CNS), affecting 0.05–0.15% of Caucasians (38). The disease usually begins in young adulthood and the frequency is higher in women more than in men (2:1). In 80–90% of cases, MS starts with a relapsing–remitting course (RR-MS). Overtime, the number of relapses decreases, but most patients develop progressive neurological deficits that occur independently of relapses (the so-called secondary progressive phase). In 10-20% of patients, MS begins with a primary progressive course (PP-MS) without acute relapses. In general, the progression rate in RR-MS is comparable to that of PP-MS as soon as the patients enter the secondary progressive phase (39). Imaging studies have revealed differences between RR-MS and PP-MS. In patients that suffer from RR-MS, acute CNS lesions with spontaneous resolution are frequently detected, even in the absence of clinical attacks (40). These lesions are usually located in areas of white matter and are often characterized by a disturbance of the blood– brain-barrier, local edema and demyelination- features that are compatible with an inflammatory process. By contrast, when progressing to the secondary phase and in patients with PP-MS, such inflammatory activity is much less evident (39). Global brain atrophy, however, is more dominant in the progressive stage and seems to correlate with disability (41, 42). These findings indicate that early in the disease, ongoing inflammatory activity is present in most patients and is responsible for the relapsing-remitting course, whereas a distinct process might be operative in the progressive phase of the disease, when inflammatory activity diminishes despite faster evolution of disability.
The prevalence of MS varies significantly depending on the genetic background of the patient (43). MS is highly prevalent in Caucasians, but only rarely observed in Asians or Africans. Moreover, the risk of developing the disease is significantly higher in family members of patients with MS (44). These findings argue for a strong genetic predisposition to MS, and have prompted a large number of linkage and association studies to identify disease loci and alleles. The results of genomic screens in MS indicate that a considerable number of different genes, each having a relatively small contribution, are involved in the susceptibility to MS (45, 46). So far, only the human leukocyte antigen (HLA)
class II alleles DR15/DQw6 (HLA-DRB1*1501; HLA-DQB1*0601), which code for molecules that participate in antigen recognition by T lymphocytes, have been consistently associated with MS in Caucasians (47).
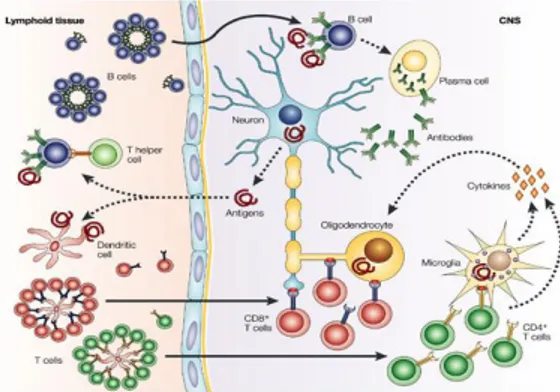
At molecular level, two steps are required to induce an immune response in the central nervous system (CNS): a pro-inflammatory milieu in the CNS, leading to upregulation of major histocompatibility complex (MHC) molecules, co-stimulatory receptors, inflammatory cytokines and an antigen-driven acquired immune response. T- and B-cell responses are primed in the peripheral lymphoid tissue by antigens that are released from the CNS or by cross-reactive foreign antigens. Dendritic cells that present neural antigens are strong stimulators of T-cell responses. Clonally expanded CD8+ T cells also invade the brain and could encounter their specific peptide ligand, presented by glial or neuronal cells on MHC class I molecules. CD4+ T cells migrate into the CNS and encounter antigens that are presented by microglial cells on MHC class II molecules. Reactivation of these cells leads to heightened production of inflammatory cytokines. These cytokines attract other immune cells, such as macrophages, which contribute to inflammation through the release of injurious immune mediators and direct phagocytic attack on the myelin sheath (Fig. 4) (48). The immune dysregulation that characterizes the pathogenesis of MS affects, in particular, the number and the suppressive function of Treg cells (49-51).It has been recently shown that the impairment of Treg cells activity is due to an altered interleukin-2 (IL-2) secretion and IL-2 receptor (IL-2R)-signal trasducer and activator of trascription 5 (STAT5) signalling. This was also associated with a decreased expression of FoxP3 44- and 47- kDa splicing forms (27, 52).
(HemmerB. et al. Nature Reviews Neuroscience 2002)
3. Aim of the study
Several evidences confirm that T cell function is intimately linked to metabolic programs. In particular, T cells undergo a profound metabolic reprogramming to cope with environmental changes that have a strong impact on proliferation, differentiation, regulatory and effector function (31). In this study, we aim at investigating the metabolic pathway controlling generation and function of human iTreg cells that develop from Tconv cells, following suboptimal stimulation via TCR. We also aim at evaluating which metabolic pathway affects the expression of FoxP3-E2 splicing variants, that have a greater role in providing suppressive ability in Treg cells (30). Finally, we would like to evaluate iTreg cells suppressive function in human autoimmune diseases, such as RR-MS. These results could unveil a novel mechanism that links metabolism to the induction of FoxP3-specific splicing variants that directly impact on human Treg cell function, in healthy and RR-MS subjects.
4. Material and methods
4.1 iTreg cell induction
iTregcellswere generated from CD4+CD25- (Tconv) cells from healthy donors and RR-MS subjects and in the presence of inhibitors of specific metabolic pathways (1 mM 2-Deoxy-D-glucose (2DG) and 200 μM Etomoxir (Etx) (all from Sigma Aldrich). Briefly, after Ficoll hypaque (GE-Healthcare) gradient centrifugation, Tconv cells were isolated from PBMCs by negative selection using human CD4+CD25+ T cell kit (Invitrogen) (cell purity was > 90% by FACS analysis) and the cells were cultured with RPMI 1640 medium supplemented with 100 UI/ml penicillin, 100 μg/ml streptomycin and supplemented with either 5% autologous serum or 5% AB human serum (Invitrogen). Cells were stimulated for 36 hours with anti-CD3/CD28 Dynabeads (0.1 bead/cell) (Invitrogen). Tconv cells were then stained with the following antibodies: FITC anti-human CD4 (clone RPA-T4), PE-Cy5 anti-human CD25 (clone M-A251) (all from BD PharMingen); the cells were FACS-sorted on the basis of their cell-surface CD25 levels by using BD FACSJazz (Becton-Dikinson) (Fig. 5a). The FACS-sorted cells in the presence of metabolic inhibitors at 36 hours were named: iTreg-CTR, iTreg-2DG and iTreg-Etx cells, respectively. RR-MS and healthy subjects were recruited at the Università di Napoli “Federico II”, they were all naïve-to-treatment, 40±20 years of age, with relapsing-remitting disease and with a Kurtzke expanded disability status score (EDSS) between 0 and 4. Healthy donors were age- and sex-matched with the RR-MS subjects, with no history of either inflammatory, endocrine, or autoimmune disease.
4.2 Molecular signalling and Western Blot analysis
FACS-Sorted iTreg-CTR, iTreg-2DG and iTreg-Etx cells were lysed after their isolation. Tconv cells from RR-MS and healthy subjects were lysed 24 and 36 hours upon anti-CD3/CD28 Dynabeads (0.1 bead/cell) (Invitrogen). Total cell lysates and immunoblot analyses were performed as described (53). The antibodies used were the following: anti-phospho-STAT5 (Tyr694), anti-STAT5 (all from Cell Signaling Technology); anti-ERK1/2 (clone H72); anti-FoxP3-all
(clone PCH101), anti-FoxP3-E2 (clone 150D/E4) (all from eBioscience). All filters were quantified by densitometric analyses as described (53). The graphs show the relative densitometric quantitation of each phosphorylated protein normalized on its total form (STAT5) or on ERK1/2 (FoxP3).
4.3 Seahorse experiments
The metabolic profile has been evaluated in Tconv cells and iTreg cells, in the presence or in the absence of anti-CD3/CD28 stimulation. Real-time measurements of oxygen consumption rate (OCR) and extracellular acidification rate (ECAR) were made using an XF-96 Extracellular Flux Analyzer (Seahorse, Bioscience). OCR was measured in XF media (non-buffered DMEM medium, containing 10 mM glucose, 2 mM L-glutamin, and 1 mM sodium pyruvate), under basal conditions and in response to 5 μM oligomycin, 1.5 μM of carbonylcyanide-4- (trifluoromethoxy)-phenylhydrazone (FCCP) and 1 μM of Antimycin and Rotenone (all from Sigma Aldrich). ECAR was measured in XF media in basal condition and in response to 10 mM glucose, 5 μM oligomycin and 100 mM of 2-DG (all from Sigma Aldrich). For the analysis of β-oxidation in all the above mentioned experimental conditions, we used the XF Palmitate-BSA FAO substrate (Seahorse Bioscience). Briefly, β-oxidation was measured in FAO buffer containing NaCl 111 mM, KCl 4.7 mM, MgSO4 2.0 mM, Na2HPO4 1.2 mM, supplemented with 2.5 mM glucose, 0.5 mM carnitine and 5 mM HEPES (final concentrations) pH to 7.4. We added Etx (Sigma Aldrich) (40 μM final) 15 min before to the XF assay being initiated (t = 0). At t = 0 cells were provided with 30 μl of 1mM Palmitate conjugated to 0.17 mM BSA.
4.4 Cytofluorimetric analysis, T cell proliferation and CFSE staining
PBMCs, Tconv and iTreg cells were stained with the following monoclonal antibodies: FITC anti-human CD4 (clone RPA-T4), PE anti-human CD25 (clone M-A251), PE-Cy 5 anti-human CD25 (clone M-A251), APC anti-human CD39 (clone TU66), APC anti-human CD71 (clone, M-A712), APC anti-human CD127 (clone HIL-7R-M21), PE-Cy 5 human CD152 (clone BNI3), APC anti-human CD62L (clone DREG-56) and PerCP-Cy 5.5 anti-anti-human CD279 (PD-1;
clone EH12.1) (all from BD PharMingen), Pe anti-human GITR (clone DT5D3, Miltenyi Biotec), Pe-Cy 5 anti-human CD45RO (clone UCHL1, Serotec); FITC anti-human CCR7 (clone 150503, R&D Systems). Subsequently cells were washed, fixed, permeabilized (fixation-permeabilization buffer, eBioscience) and stained with anti-FoxP3-PE (clone PCH101), anti-FoxP3-PE (clone 150D/E4) (all from eBioscience), anti-Alexa Fluor 647 phospho-S6 ribosomal protein Ser235/236 (clone D57.2.2E, Cells Signaling) and anti-Ki67-FITC (clone B56, BD Biosciences) monoclonal antibodies. Analyses were performed employing the Diva software from BD and the Flow-Jo Software (Tree Star Inc.).
The fluorescent dye CFSE (5, 6-carboxyfluorescein diacetate succinimidyl ester) was used at 1 μg/ml (Invitrogen). Flow cytometric analysis of CFSE dilution was performed by gating on CD4+ CFSE+ cells stimulated for 96 hours with anti-CD3/CD28 Dynabeads (0.2 beads/cell) (Invitrogen) alone, or co-cultured with iTreg cells at different ratios (from 1:1 to 1:0.125 CD4+:iTreg).
4.5 RNA extraction, qRT-PCR, qPCR and siRNA
Total RNA was extracted using Triazol (Gibco/Invitrogen). cDNA was synthesized in a 20 μl reaction volume containing 1 μg of total RNA, 100 units of Superscript III Reverse Transcriptase (Invitrogen), and 1 μl of random primers (200 ng/μl). mRNA was reverse-transcribed for 1 hour at 50 °C, and the reaction was heat inactivated for 15 min at 70 °C. The products were stored at -20 °C until use. Quantitative (q)RT-PCR and qPCR were performed three times in three replicates on a 7500 RT-PCR System (Applied Biosystems) using the SYBR Green-detection system (FS Universal SYBR Green MasterRox; Roche Applied Science). The complete list of primers used is reported in Table 1. Primers for 18S were used as internal standard control for the reactions (Table 1). To obtain FoxP3 and ENO1 knock down with siRNA, cells were transiently transfected, using a Neon® Transfection System, with siRNA in medium without serum to a final concentration of 10 nM and incubation was continued for 48 hours. Scrambled RNA, at the same concentration, was used as negative control. Specific siRNA against FoxP3 Exon 5; Exon 2 and scramble sequences were designed (Table 1). A mixture of siRNA specific for all ENO1 isoforms was used (target sequences, 5′-CAGUGGUGUCUAUCGAAGA-3′ and
5′-CCGUGACCGAGUCUCUUCA-3′) (4390821; Life Technologies). Briefly, Tconv cells transfection occurred at following conditions: pulse voltage, 2,400 V; pulse width, 20 ms; pulse number, 1. Then, Tconv cells were stimulated with anti-CD3/CD28 beads.
Table 1. Table reports specific list of primers used for PCR experiments.
4.6 Chromatin immunoprecipitation
After the appropriate treatment, cells (~7 × 10⁵ for each antibody) were fixed for 10 min at room temperature by the addition of 1 volume of 2% formaldehyde to a final concentration of 1%; the reaction was quenched by the addition of glycine to a final concentration of 125 mM. Fixed cells were harvested and the pellet was resuspended in 1 ml of lysis buffer (10 mM Tris-HCl, pH 8.0, 10 mM NaCl and 0.2% NP-40) containing 1× protease inhibitor cocktail (Roche Applied Science). The lysates were sonicated to generate DNA fragments 300–600 base pairs in length. Sonicated samples were centrifuged and supernatants were diluted twofold in chromatin immunoprecipitation buffer (20 mM Tris-HCl, pH 8.0, 150 mM NaCl, 2 mM EDTA and 1% Triton X-100). An aliquot (1/10) of sheared chromatin was further treated with proteinase K, then underwent extraction with phenol-chloroform and precipitation for measurement of DNA concentration and shearing efficiency (input DNA). Chromatin-immunoprecipitation reactions were set up according to the manufacturer's instructions (Abcam). The sheared chromatin was precleared by incubation for 2 hours with 1 μg of non-immune
PRIMERS
FoxP3-E2 Fw 5’- CACACTGCCCCTAGTCATGG -3’ FoxP3-E2 Rev 5’- GCATGAAATGTGGCCTGTCCT -3’ FoxP3-all Transcripts Fw 5’- AACATGCGACCCCCTTTCACCTAC -3’ FoxP3-all Transcripts Rev 5’- GCCCCCTTCTCGCTCTCCAC -3’ 18S Fw 5’-TCCCCATGAACGAGGAATTC-3’ 18S Rev 5’-GGCCTCACTAAACCATCCAA-3’ ChIP Promoter Fw 5’- GGTTGGCCCTGTGATTTATTTTAG -3’
ChIP Promoter Rv 5’- GTGTGGAAGCCGCAGACCTC -3’ ChIP CNS2 Fw 5’- TGAGAAACCCAGTCAGAAAGG -3’ ChIP CNS2 Rev 5’- GGCCAGAGCTAAGAATTCTCC -3’
ENO1 Fw 5' TGGCAACTCTGAAGTCATCCTG 3'
mouse IgG (sc-2025) and rabbit IgG (sc-2027) (both from Santa Cruz Biotechnology) and 20 μl of Protein A/G PLUS-Agarose (Santa Cruz Biotechnology) saturated with salmon sperm (1 mg/ml). Precleared chromatin was divided in aliquots and then was incubated for 16 hours at 4 °C with 1 μg of specific antibody (anti-enolase-1: 3810 (Cell Signaling Technology) or sc-15343 (Santa Cruz Biotechnology)) and non-immune IgG (identified above). The immunocomplexes were recovered by incubation for 3 hours at 4 °C with 20 μl of protein-A/G agarose, then beads were washed with wash buffers according to the manufacturer's instructions (sc-2003; Santa Cruz Biotechnology), and immunoprecipitated DNA was recovered and analyzed by quantitative PCR (primers, Table 1).
4.7 Statistical analysis
All statistical analyses were performed with the GraphPad program (Abacus Concepts). All the comparisons for immunoblot, PCR, proliferation and Seahorse analyses were evaluated with the nonparametric Wilcoxon/Kruskal-Wallis or the paired two-tailed Student's t-test. For all analyses, we used two-sided tests, with a P value of <0.05 indicative of statistical significance.
5. Results
5.1 Generation of iTreg from Tconv cells following suboptimal TCR stimulation and their regulatory properties
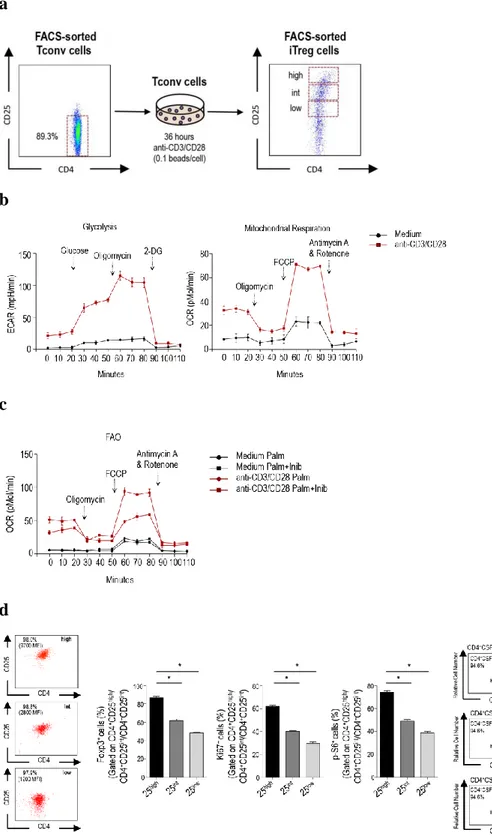
The induction of human iTreg cells from Tconv cells was obtained by negative selection of Tconv cells (90% pure) from peripheral blood mononuclear cells (PBMCs) of human healthy subjects activated in vitro with anti-CD3/CD28 stimulation (0.1 bead/cell) for 36 hours, according to the scheme reported in (Fig.
5a). After 24 hours of activation, we assessed different metabolic programs:
glycolysis, mitochondrial respiration and fatty acid oxidation (FAO) by measuring the extracellular acidification rate (ECAR) and oxygen-consumption rate (OCR). Tconv cells increased their mitochondrial respiration rate (OCR) and used both glucose and fatty acids, as indicated by an increase in glycolysis and FAO (Fig.5 b, c).
Tconv cells, 36 hours post activation, were sorted by flow cytometry in three different subsets, on the basis of their cell-surface CD25 levels. CD25 high (CD25high), CD25 intermediate (CD25int) and CD25 low (CD25low) were
subsequently analysed for their proliferative rate (using the Ki67 marker), metabolic asset (measuring the levels of p-S6, a downstream target of the mammalian-target of rapamycin, mTOR) and FoxP3 levels (Fig. 5d, middle
panels) and we found that CD25high cells had highest levels of all these markers (Fig. 5d, middle panels). In addition, we investigated the ability of these subsets to suppress the proliferation of CD4+CFSE-labelled T cells activated in vitro with anti-CD3/CD28 (Fig. 5d, right panels). We found that CD25high also had the strongest suppressive activity (Fig. 5d, right panels). These results indicated that human iTreg cells could be induced from Tconv cells stimulated by weak engagement of TCR in the absence of exogenous cytokines and that they retained their suppressive capacity over time.
a
b
c
d
Fig. 5: Metabolic state and regulatory properties of human iTreg cells. (a) Schematic representation of the
experimental procedure used to generate human iTreg cells from human activated Tconv cells. (b) ECAR and OCR of Tconv cells after 24 hours of in vitro stimulation with anti-CD3/CD28. (c) OCR quantifying FAO of Tconv cells after 24 hours of in vitro stimulation with anti-CD3/CD28. (d) (left) Representative flow cytometry plots of CD4+CD25+ T cells
FACS-sorted on the basis of surface CD25 expression; (middle) percentage of expression of Ki67, p-S6 and FoxP3 in CD25hi, CD25int and CD25low. Numbers in plots indicate percent CD25hi cells (top), CD25int cells (middle) or CD25low
cells (bottom) or mean fluorescence intensity (MFI) (in parentheses) of CD25 in those cells; (right) proliferation of CD4+CFSE-labelled T cells stimulated for 96 hours in vitro with anti-CD3/CD28 (filled gray histograms), in the presence
of FACS-sorted CD25hi, CD25int and CD25low (black lines in histograms), respectively and (right) percent proliferation of
CD4+ T cells in those conditions. (b, c) Data are from one experiment representative of three experiments with technical
duplicates (mean ± s.e.m). (d) (left) One experiment representative of seven experiments; (middle) mean ± s.e.m. of seven independent experiments, *P < 0.05 Wilcoxon matched-pairs test; (right) one representative of three experiments.
5.2 Effect of either glycolysis or FAO inhibition on the generation, suppressive function and phenotypical markers of iTreg cells
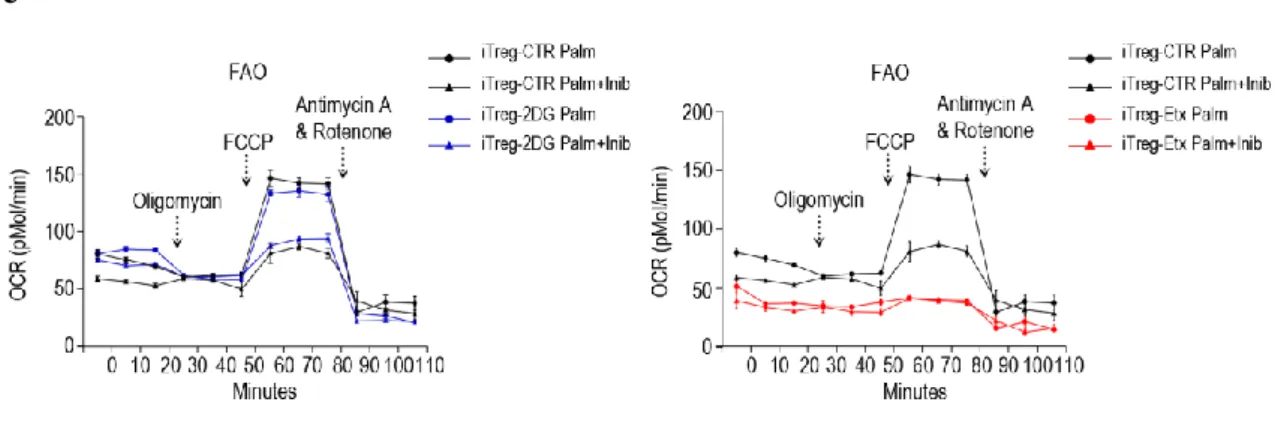
There is growing evidence that show how different metabolic pathways are involved in the generation and activation of T cells (54-56). For this reason we activated Tconv cells in the presence or in the absence of specific inhibitors of glycolysis and fatty acid oxidation (FAO), 2-Deoxy-D-Glucose (2DG) and Etomoxir (Etx), respectively with the same procedure shown in figure 5a. We found that both inhibitors significantly affected the ability to up-regulate CD25 (Fig. 6a, left panels). Strikingly, FoxP3 expression was markedly reduced in CD25high T cells generated in the presence of 2DG and sorted by flow cytometry (iTreg-2DG cells), but was increased in CD25high T cells generated in the presence of Etx (iTreg-Etx cells), when compared with untreated CD25high T cells (iTreg-CTR cells) (Fig. 6a, right panels). To determine whether metabolic perturbation associated with altered regulatory function, iTreg-2DG cells and iTreg-Etx cells were tested for their ability to suppress, at different ratios, the proliferation of CD4+CFSE-labelled T cells activated in vitro with anti-CD3/CD28. We found that iTreg-2DG cells showed a reduced suppressive function at all the different ratios analysed, whereas iTreg-Etx cells exhibited a higher suppressive activity when compared with iTreg-CTR cells (Fig. 6b). These findings suggest that glycolysis, but not fatty acid oxidation, is required for generation and suppressive function of human iTregcells. Inhibition of glycolysis with 2DG reduced the expression of several Treg cell markers such as CTLA-4, PD-1, CD39, GITR and CD71, as well as the phosphorylation of S6 (Fig. 6c), whereas Etx had a similar effect on PD-1, CD39 and phosphorylation of S6, slightly reduced CD71 and CCR7 but preserved the expression of CTLA-4 and up-regulated GITR levels compared to iTreg-CTR cells (Fig. 6c). By measuring ECAR and OCR (FAO and oxidative phosphorylation) of FACS-sorted iTreg cells, we found that iTreg-2DG cells had an impaired glycolytic capacity and mitochondrial respiration relative to that of iTreg-CTR cells (Fig. 6d, right and left panels), with FAO rates similar to those of iTreg-CTR cells (Fig. 6e, left panel), while Etx treatment affected FAO (Fig. 6c, right panel) and mitochondrial respiration (Fig. 6d, right panel), but preserved glycolysis when compared to iTreg-CTR cells (Fig. 6d, left panel). These data suggest that inhibition of glycolysis profoundly affects the generation
and function of human iTreg cells, particularly impairing the induction of FoxP3 and Treg specific molecular and surface markers.
a b
c
e
Fig. 6: Isolation, phenotypical characterization and metabolic programs of iTreg-CTR, iTreg-2DG and iTreg-Etx cells. (a) (left) Representative flow cytometry plots of CD4+CD25hi iTreg-CTR, iTreg-2DG and iTreg-Etx cells
FACS-sorted; (right) CD4+FoxP3+ T cells of FACS-sorted iTreg cells derived from each different condition. Numbers in plots
(top left corner) indicate percent CD25+ cells or MFI (in parentheses) of CD25 (left) or percent FoxP3+ cells or MFI (in
parentheses) of FoxP3 (right). (b) Schematic representation of suppression of T cell proliferation, at 96 hours, by FACS-sorted iTreg cells derived from different culture condition at different ratios (from 1:1 to 1:0.125). (c) Representative flow cytometry plots of Treg cell–specific markers in iTreg-CTR, iTreg-2DG and iTreg-Etx cells. (d) (left) ECAR and (right) OCR of iTreg-CTR, iTreg-2DG and iTreg-Etx cells stimulated for 24 hours in vitro with anti-CD3/CD28. (e) (left) OCR quantifying FAO of iTreg-CTR and iTreg-2DG or (right) of iTreg-CTR and iTreg-Etx, stimulated for 24 hours in vitro with anti-CD3/CD28, in the presence of palmitate alone or palmitate plus inhibitor. (a) Data are representative of three independent experiments; (b) mean ± s.e.m. of three independent experiments with technical triplicates, *P < 0.005 and **P < 0.005 by by Wilcoxon matched-pairs test; (c) One experiments representative of six; (d, e) one experiment representative of two experiments with technical duplicates (mean ± s.e.m).
5.3 Glycolysis influences FoxP3-E2 expression and suppressive function
We evaluated which specific metabolic program could control regulatory function in iTreg cells, acting on the expression of FoxP3 and its splicing variants. To this aim, we measured all FoxP3 splicing forms by dissecting their expression with two specific antibodies, one recognizing all FoxP3 splicing variants (recognized through a common epitope of the FoxP3 amino-terminous, clone PCH101), the other specific for the FoxP3-E2 variant (recognized an epitope contained in the E2 only, clone 150/E4). iTreg-2DG cells had a marked reduction of both the 47- and 44- kDa splicing forms, while their levels were not affected in iTreg-Etx cells as compared to iTreg-CTR (Fig, 7a, b). We also confirmed these findings by quantitative RT-PCR (data not shown). Since we have shown that iTreg-2DG cells displayed an impaired suppressive capacity and this associated with a reduced expression of FoxP3-E2 (Fig. 6b and 7b,
respectively), we studied whether FoxP3-E2 was indispensable for the regulatory
function of iTreg cells by using small interfering mRNA (siRNA). We designed small interfering mRNA (siRNA) specific for the exon 2 domain (siRNA-E2) and for exon 5 (E5), a sequence common to all FoxP3 transcripts (siRNA-E5), to
address whether FoxP3-E2 protein was indispensable for iTreg regulatory function. Therefore, iTreg cells were generated in the presence of these different siRNA and tested for their ability to suppress the proliferation of CD4+
CFSE-labelled T cells stimulated with anti-CD3/CD28. We found that iTreg cells generated in the presence of siRNA-E2 had a reduced suppressive ability at all the different ratios analysed, whereas iTreg cells generated in the presence of siRNA-E5 had no significant differences in their suppressive activity when compared to iTreg cells generated in the presence of scramble sequences siRNA (siRNA-Scr) (Fig. 7c). Our results suggest that glucose metabolism controls the FoxP3-E2 splicing variant which results to be indispensable for an appropriate iTreg cells suppressive function to occur.
a
b
c
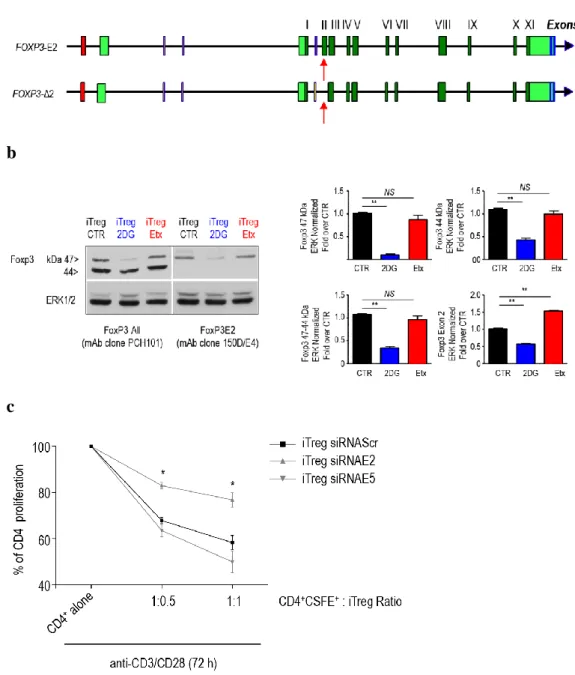
Fig. 7: Glycolysis controls the expression of FoxP3Exon2 splicing forms which are indispensable for suppressive function to occur. (a) Schematic representation of FoxP3 mRNA splicing variants. The exons are indicated by green
boxes (light green represent 5' and 3' untranslated regions (UTR), dark green represent coding DNA sequence and blue poly(A) sites), red boxes represents FoxP3 promoter. The spliced exon 2 in Foxp3-Δ2 are indicated by red arrow. (b) Western blotting analysis of FoxP3 protein levels in iTreg-CTR, iTreg-2DG and iTreg-Etx cells. The gels show expression of FoxP3 protein detected by using two mAbs recognizing different epitopes, (left) one reacting with a common epitope of the amino-terminous (PCH101), and (right) the other reacting with an epitope contained exon 2 (150D/E4). Total protein levels are assessed by measuring total Erk 1/2 levels. The graphs show relative densitometric quantitation of two different FoxP3 forms. (c) Suppression of CD4+CFSE-labelled T cells proliferation by iTreg cells generated in the presence of three
different small interfering mRNA (siRNA) one specific for a scramble sequence (siRNA-Scr, black square), another for exon 5 (siRNA-E5, gray triangle) and another for the exon 2 (siRNA-E2, grey triangle), respectively, at a ratio of 1:1 or 1:0.5. (b) Data represent mean ± s.e.m. (n = 10), *P < 0.005 by two-tailed Student's t-test; (c) mean ± s.e.m. of three independent experiments with 3 technical replicates in each (n = 9 replicates), *P < 0.05 by Wilcoxon matched-pairs test.
5.4 Enolase-1 controls FoxP3-E2 expression
Different isoforms of enolase-1, a key glycolytic enzyme, can bind DNA and regulate gene expression in several experimental system (57-59). In particular, the glycolytic enzyme enolase-1 (48-kDa) and the transcriptional repressor MBP-1 (37-kDa) arise from the gene ENOMBP-1 through the use of alternative translation start sites present on ENO1 mRNA (50, 60). Evidence from literature shows that enolase-1 isoforms control multifunctional activities within the cells, ranging from glycolytic activity in the cytoplasm to gene regulation in the nucleus (50, 60). To evaluate whether enolase-1 could be involved in the regulation of FoxP3 in iTreg cells, we performed chromatin-immunoprecipitation analysis that revealed that enolase-1 was recruited on both FoxP3 promoter and on CNS2 region. This recruitment was greater in iTreg-2DG cells than iTreg-CTR cells (Fig. 8a); on the contrary the association between enolase-1 and FoxP3 promoter was lower in iTreg-Etx cells than in iTreg- CTR cells, but in association with FoxP3 CNS2 was similar in iTreg-Etx cells and iTreg-CTR cells (Fig. 8a). To understand whether enolase-1 directly controlled the splicing of mRNA, we silenced ENO1 by using ENO1-specific siRNA (siRNA-ENO1) during the generation of iTreg cells. We found that silencing of ENO1 restored the expression of FoxP3 mRNA in iTreg-2DG cells (evaluated through qRT-PCR). (Fig. 8b). Specifically, silencing of ENO1 in iTreg-2DG cells led to the recovery of all FoxP3 transcripts and an even greater recovery of FoxP3-E2 mRNA (Fig.
8a). In addition, the level of FoxP3-E2 mRNA was significantly higher, whereas
the level of total FoxP3 mRNA was slightly lower in iTreg-CTR cells generated in the presence of siRNA-ENO1 than in those generated with siRNA-Scr (si-RNA that does not inhibit FoxP3 expression) (Fig. 8a). Together these data suggest that enolase-1 specifically repressed the expression of FoxP3-E2 in iTreg cells.
a
b
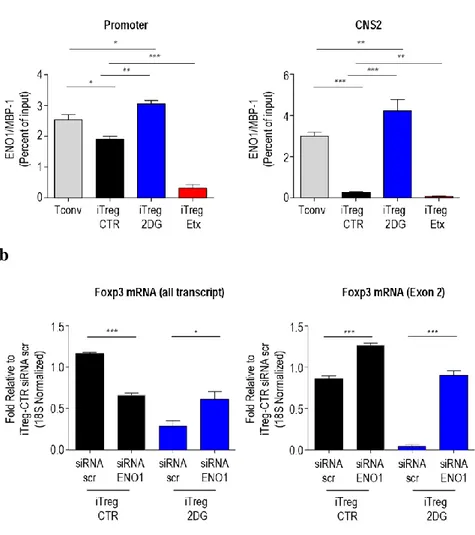
Fig. 8: Localization of enolase-1 on FoxP3 promoter and CNS2 controls FoxP3-E2 expression. (a) localization of
enolase-1 on the promoter (left) and CNS2 (right) in Tconv, iTreg-CTR, iTreg-2DG and iTreg-Etx cells, observed by chromatin immunoprecipitation with mAb to enolase-1. (b) qRT-PCR analysis of all FoxP3 transcripts (left) and FoxP3-E2 mRNA (right) in iTreg-CTR and iTerg-2DG cells generated in the presence of siRNA-Scr or siRNA-ENO1; results were normalized to those of control 18S rRNA and are presented relative to those of iTreg-CTR cells treated with siRNA-Scr. (a) Data are four independent experiments with technical duplicates (mean ± s.e.m.), *P < 0.05, **P < 0.005, ***P < 0.0005 by two-tailed Student's t-test; (b) mean ± s.e.m. of four independent experiments, *P < 0.05, ***P < 0.0005 by two-tailed Student's t-test.
5.5 Altered glycolysis and impaired suppressive function of human iTreg cells from RR-MS subjects
To investigate the physiological impact of our findings in autoimmunity, we evaluated the generation, phenotype and functional properties of iTreg cells from Tconv cells of naïve-to-treatment relapsing-remitting multiple sclerosis (RR-MS) subjects. Firstly, we observed that glycolysis, during Tconv cells activation, was impaired in RR-MS subjects when compared with healthy controls. (Fig. 9a). Moreover we found that iTreg cells from RR-MS subjects showed reduced levels of FoxP3-E2, CTLA-4, PD-1, GITR, CD71 and phosphorylation of S6, when compared with iTreg cells generated from healthy subjects (Fig. 9b). Since we have previously reported that generation and function of iTreg cells was strictly dependent on glycolysis, iTreg cells from both RR-MS and healthy controls were FACS-sorted and tested for their ability to suppress the proliferation of CD4+CFSE-labelled T cells activated in vitro with anti-CD3/CD28. We observed that iTreg cells from RR-MS subjects showed a reduced suppressive function at both ratios when compared to iTreg cells from healthy individuals (Fig. 9c). To assess whether these phenomena associated with altered IL-2/IL-2R/STAT5 signalling pathway, which is pivotal for the generation and the homeostasis of Treg cells (27), we performed western blotting analysis of Tconv cells from RR-MS and healthy subjects, activated in vitro with suboptimal anti-CD3/CD28 stimulation for 24 and 36 hours. There was a profound delay in the induction of both 47- and 44 kDa FoxP3 forms in RR-MS subjects (at 24 hours) which correlated with an impairment of p-STAT5 signalling (Fig. 9d). These data suggest that the normal glycolytic rate of Tconv cells from healthy subjects determins the generation of functional iTreg cells that express correct amount of FoxP3-E2. On the contrary, RR-MS subjects, in whitch there is an impairment of glycolysis, have a reduced expression of FoxP3-E2 that correlates with reduced suppressive capacity of iTreg cells.
a
b c
d
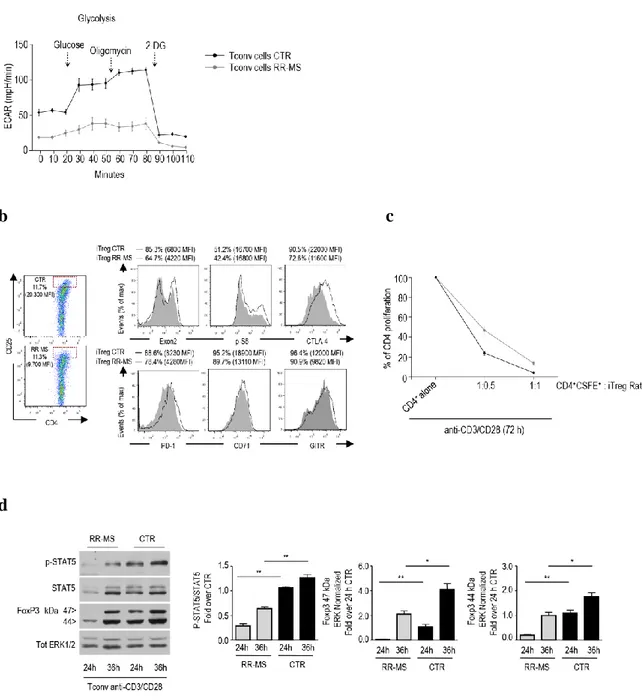
Fig. 9: Impaired glycolysis, altered FoxP3-E2 expression, reduced IL-2/IL-2R/STAT5 signalling in iTreg cells from RR-MS subjects. (a) ECAR of Tconv cells isolated from RR-MS subjets (n = 5) and healthy subjects (n = 12) after 24
hours in vitro stimulation with anti-CD3/CD28. (b) Representative dot plots showing CD25, FoxP3-E2 and other Treg cell markers in FACS-sorted iTreg cells from healthy and RR-MS subjects. Shown are the MFI and percent of expression of markers in iTreg cells from control (black lines) and from RR-MS subjects (grey full lines). (c) Suppression of T cell proliferation (96 hours) by FACS-sorted iTreg cells from control and RR-MS subjects, at different ratio (1:1 and 1:0.5).
(d) Western blot of IL-2/IL-2R/STAT5 signalling and 44-47-kDa FoxP3 protein forms, after 24 and 36 hours of in vitro
stimulation with anti-CD3/CD28 of Tconv cells from RR-MS and healthy subjects. Graphs show relative densitometric quantitation of FoxP3 bands normalized on total ERK 1/2 and p-STAT5 normalized on its total form. (a) Data shown as mean ± s.e.m.; (b) representative of four independent experiments; (c) data from four independent experiments (mean ± s.e.m.), *P < 0.05 by Wilcoxon matched-pairs test; (d) results are from three independent experiments in duplicates, performed on two healthy and two RR-MS subjects (mean ± s.d.); *P < 0.05, **P < 0.05 by Wilcoxon test.
6. Discussion
This study shows that human iTreg cells can be generated de novo from non regulatory Tconv cells following suboptimal TCR stimulation and without the requirement of exogenous regulatory-type cytokines, thus providing evidence that TCR signal strenght is a critical determinant of FoxP3 induction and Treg cell generation (61, 62).We find that iTreg cells represent the highly proliferative and metabolically active fraction of activated T cells, whose generation mainly relies on glycolysis. Indeed, 2DG (a glycolytic inhibitor) affects FoxP3 induction, reduces expression of Treg cell markers (CTLA-4, PD-1, GITR, CD39, CD71 and p-S6) and impairs suppressive function of iTreg cells. The inhibition of FAO with Etx increses FoxP3 expression and the generation of iTreg cells with strong regulatory properties. These results are in agreement with recent literature showing that the engagement of distinct metabolic pathways controls T cell function and differentiation (54-56). This study also demonstrates the crucial role of glycolysis in the modulation of the expression of specific FoxP3 splicing forms that are indispensable for iTreg cell suppressive function. We find that 2DG specifically affects the 47- and 44-kDa splicing form: 2DG treatment is able to reduce the exon 2 containing FoxP3 splicing forms, which we show necessary for the regulatory function of iTreg cells (reduced suppressive ability in iTreg-2DG cells). iTreg-Etx have higher expression of FoxP3-E2 at protein level (but also as mRNA), and this associates with stronger suppressive function.
Several factors are able to bind the regulatory regions of FoxP3 gene, regulate gene expression thanks to transient modification of chromatin. Among them, enolase-1, a key glycolytic enzyme, has been reported to bind DNA and to suppress gene expression(57, 58). Here we describe that enolase-1 is selectively recruited on the promoter and CNS2 region of FoxP3 gene in iTreg-2DG cells to act as a FoxP3 gene repressor. On the contrary, iTreg-Etx cells have reduced amount of enolase-1 on FoxP3 gene, thus accounting for the higher levels of FoxP3-E2 observed. In all, the evidence that glycolysis and FAO differentially control expression of FoxP3 splicing variants in iTreg cells, and their suppressive ability, indicates that a specific metabolic program is required for generation of Treg cells following Tconv cell activation.
To investigate the impact of our findings in human autoimmunity, we also evaluated the generation rate, the phenotype and the functional properties of iTreg cells from Tconv cells of RR-MS subjects. iTreg cells from these subjects have a marked reduced suppressive function, associated with a specific impairment of FoxP3-E2 expression, secondary to a defect in glycolysis following Tconv cell activation. At the molecular levels, altered FoxP3 induction associates with functional impairment of IL-2/IL-2R/STAT5 signalling pathway in iTreg cells from RR-MS subjects, which has a pivotal role in FoxP3 induction, generation and homeostasis of Treg cells (63, 64).
7. Conclusions
In conclusion, this study shows that distinct metabolic pathways can contribute to the generation of human iTreg cells from previously non regulatory Tconv cells, after suboptimal-low TCR engagement. The newly generated iTreg cells represented a small fraction of the activated CD4+ T cells with the strongest proliferation and metabolic activity associated with marked FoxP3 expression and suppressive function. Glycolysis, via the glycolytic enzyme enolase-1, had a crucial role in the generation and function of these cells, through the modulation of the FoxP3-E2 splicing form, which was indispensable for their suppressive function. Moreover, the defect of the Treg cell compartment in MS could be ascribed to a disequilibrium between T cell activation and induction of specific FoxP3 splice variants, secondary to an impaired glycolysis and IL-2/IL-2R/STAT5 signalling.
Restoring glycolysis in Tconv cells could help to improve immune tolerance and could have potential therapeutic implications in MS and in other autoimmune diseases.
8. References:
1) Sakaguchi S, et al. Regulatory T cells and immune tolerance. Cell; 2008;133,
775–787.
2) Ohkura N, Kitagawa Y, Sakaguchi S. Development and maintenance of
regulatory T cells. Immunity. 2013 Mar 21; 38(3):414-23.
3) Sakaguchi S, Yamaguchi T, Nomura T, Ono M. Regulatory T cells and
immune tolerance. Cell. 2008 May 30; 133(5):775-87.
4) Marinić I, Gagro A, Rabatić S. Regulatory T cells. Acta Med Croatica. 2006
Dec;60(5):447-56.
5) Liu W. CD127 expression inversely correlates with FoxP3 and suppressive
function of human CD4+ T reg cells. J Exp Med; 2006;203, 1701–1711.
6) Seddiki N, et al. Expression of interleukin (IL)-2 and IL-7 receptors
discriminates between human regulatory and activated T cells. J Exp Med;2006;203, 1693-1700.
7) Baecher-Allan C & Hafler DA. Human regulatory T cells and their role in
autoimmune disease. Immunol. Rev; 2006;212, 203–216.
8) Takeuchi Y, Nishikawa H. Roles of regulator y T cells in cancer
immunit y. Int. Immunol. 2016 Aug;28(8):401 -9.
9) Brunkow ME, et al. Disruption of a new forkhead/winged-helix protein,
scurfin, results in the fatal lymphoproliferative disorder of the scurfy mouse. Nature Genet; 2001;27, 68–73.
10) Wildin RS, et al. X-linked neonatal diabetes mellitus, enteropathy and
endocrinopathy syndrome is the human equivalent of mouse scurfy. Nature Genet; 2001;27, 18–20.
11) Bennett CL, et al. The immune dysregulation, polyendocrinopathy,
enteropathy, X-linked syndrome (IPEX) is caused by mutations of FOXP3. Nature Genet;2001;27, 20–21.
12) Workman CJ, Szymczak-Workman AL, Collison LW, Pillai MR, Vignali
DA. The development and function of regulatory T cells. Cell Mol Life Sci. 2009 Aug;66(16):2603-22.
13) Picca CC, et al. Role of TCR specificity in CD4+ CD25+ regulatory T-cell
14) Ohkura N, Kitagawa Y, Sakaguchi S. Development and maintenance of
regulatory T cells. Immunity. 2013 Mar 21; 38(3):414-23.
15) Bilate AM, Lafaille JJ. Induced CD4+FoxP3+ regulatory T cells in immune
tolerance. Annu Rev Immunol. 2012; 30:733-58.
16) Chen W, Jin W, Hardegen N, Lei KJ, Li L, Marinos N, McGrady G, Wahl
SM. Conversion of peripheral CD4+CD25- naive T cells to CD4+CD25+ regulatory T cells by TGF-beta induction of transcription factor FoxP3. J Exp Med. 2003 Dec 15; 198(12):1875-86.
17) Walker MR, Kasprowicz DJ, Gersuk VH, Benard A, Van Landeghen M,
Buckner JH, Ziegler SF. Induction of FoxP3 and acquisition of T regulatory activity by stimulated human CD4+CD25- T cells. J Clin Invest. 2003 Nov; 112(9):1437-43.
18) Walker MR, Carson BD, Nepom GT, Ziegler SF, Buckner JH. De novo
generation of antigen-specific CD4+CD25+ regulatory T cells from human CD4+CD25- cells. Proc Natl Acad Sci U S A. 2005 Mar 15; 102(11):4103-8.
19) Oda JM, Hirata BK, Guembarovski RL, Watanabe MA. Genetic
polymorphism in FOXP3 gene: imbalance in regulatory T-cell role and development of human diseases. J Genet. 2013 Apr;92(1):163-71.
20) Kitagawa Y, Wing JB, Sakaguchi S. Transcriptional and Epigenetic Control
of Regulatory T Cell Development. Prog Mol Biol Transl Sci. 2015; 136:1-33.
21) Barbi J, Pardoll D, Pan F. Treg functional stability and its responsiveness to
the microenvironment. Immunol Rev. 2014 May; 259(1):115-39.
22) Lal G, Bromberg JS. Epigenetic mechanisms of regulation of Foxp3
expression. Blood. 2009 Oct 29;114(18):3727-35.
23) Li X, Zheng Y. Regulatory T cell identity: formation and maintenance.
Trends Immunol. 2015 Jun; 36(6):344-53.
24) Luo X, Nie J, Wang S, Chen Z, Chen W, Li D, Hu H, Li B.
Poly(ADP-ribosyl)ation of FOXP3 Protein Mediated by PARP-1 Protein Regulates the Function of Regulatory T Cells. J Biol Chem. 2015 Nov 27;290(48):28675-82. doi: 10.1074/jbc.M115.661611.
25) Fu W, Ergun A, Lu T, Hill JA, Haxhinasto S, Fassett MS, Gazit R, Adoro S,
Glimcher L, Chan S, Kastner P, Rossi D, Collins JJ, Mathis D, Benoist C. A multiply redundant genetic switch 'locks in' the transcriptional signature of regulatory T cells. Nat Immunol. 2012 Oct;13(10):972-80.
26) Allan SE, Passerini L, Bacchetta R, Crellin N, Dai M, Orban PC, Ziegler SF,
Roncarolo MG, Levings MK. The role of 2 FOXP3 isoforms in the generation of human CD4+ Tregs. J Clin Invest. 2005 Nov; 115(11):3276-84.
27) Carbone F, De Rosa V, Carrieri PB, Montella S, Bruzzese D, Porcellini A,
Procaccini C, La Cava A, Matarese G. Regulatory T cell proliferative potential is impaired in human autoimmune disease. Nat Med. 2014 Jan; 20(1):69-74.
28) Joly AL, Liu S, Dahlberg CI, Mailer RK, Westerberg LS, Andersson J. FoxP3
lacking exons 2 and 7 is unable to confer suppressive ability to regulatory T cells in vivo. J Autoimmun. 2015 Sep; 63:23-30.
29) Smith EL, Finney HM, Nesbitt AM, Ramsdell F, Robinson MK. Splice
variants of human FOXP3 are functional inhibitors of human CD4+ T-cell activation. Immunology. 2006 Oct;119(2):203-11.
30) Kaur G, Goodall JC, Jarvis LB, Hill Gaston JS. Characterisation of FoxP3
splice variants in human CD4+ and CD8+ T cells--identification of FoxP3Δ7 in human regulatory T cells. Mol Immunol. 2010 Nov-Dec;48(1-3):321-32.
31) Pearce EL, Poffenberger MC, Chang CH, Jones RG. Fueling immunity:
insights into metabolism and lymphocyte function. Science. 2013 Oct 11; 342(6155):1242454.
32) Frauwirth KA, Riley JL, Harris MH, Parry RV, Rathmell JC, Plas DR,
Elstrom RL, June CH, Thompson CB. The CD28 signaling pathway regulates glucose metabolism. Immunity. 2002 Jun; 16(6):769-77.
33) Carr EL, Kelman A, Wu GS, Gopaul R, Senkevitch E, Aghvanyan A, Turay
AM, Frauwirth KA. Glutamine uptake and metabolism are coordinately regulated by ERK/MAPK during T lymphocyte activation. J Immunol. 2010 Jul 15; 185(2):1037-44.
34) Galgani M, De Rosa V, La Cava A, Matarese G. Role of Metabolism in the
Immunobiology of Regulatory T Cells. J Immunol. 2016 Oct 1;197(7):2567-75.
35) Procaccini C, Carbone F, Di Silvestre D, Brambilla F, De Rosa V, Galgani
M, Faicchia D, Marone G, Tramontano D, Corona M, Alviggi C, Porcellini A, La Cava A, Mauri P, Matarese G. The Proteomic Landscape of Human Ex Vivo Regulatory and Conventional T Cells Reveals Specific Metabolic Requirements. Immunity. 2016 Feb 16;44(2):406-21.
36) Newton R, Priyadharshini B, Turka LA. Immunometabolism of regulatory T
37) Lu LF, Rudensky A. Molecular orchestration of differentiation and function
of regulatory T cells. Genes Dev. 2009 Jun 1;23(11):1270-82.
38) Noseworthy JH, et al. Multiple sclerosis. N Engl J Med;2000;343, 938–952. 39) Kremenchutzky M, et al. The natural history of multiple sclerosis: a
geographically based study. 7. Progressive-relapsing and relapsing-progressive multiple sclerosis: a re-evaluation. Brain;1999;122, 1941–1950.
40) Miller DH, et al. The role of magnetic resonance techniques in understanding
and managing multiple sclerosis. Brain;1998;121, 3–24.
41) Losseff NA, et al. Progressive cerebral atrophy in multiple sclerosis. A serial
MRI study. Brain;1996;119, 2009–2019.
42) Fox NC, et al. Progressive cerebral atrophy in MS: a serial study using
registered, volumetric MRI. Neurology;2000;54, 807–812.
43) Compston A. Genetic epidemiology of multiple sclerosis. J Neurol Neurosurg
Psychiatry;1997;62, 553–561.
44) Ebers GC, et al. A genetic basis for familial aggregation in multiple sclerosis.
Canadian Collaborative Study Group. Nature;1995;377, 150–151.
45) Ebers GC & Dyment DA. Genetics of multiple sclerosis. Semin
Neurol;1998;18, 295–299.
46) Oksenberg JR, at al. Multiple sclerosis: genomic rewards. J
Neuroimmunol;2001;113, 171–184.
47) Olerup O & Hillert J. HLA class II-associated genetic susceptibility in
multiple sclerosis: a critical evaluation. Tissue Antigens,1991;38, 1–15.
48) Hemmer B, Archelos JJ, Hartung HP. New concepts in the
immunopathogenesis of multiple sclerosis. Nat Rev Neurosci. 2002 Apr;3(4):291-301.
49) Sakaguchi S, Ono M, Setoguchi R, Yagi H, Hori S, Fehervari Z, Shimizu J,
Takahashi T, Nomura T. FoxP3+ CD25+ CD4+ natural regulatory T cells in dominant self-tolerance and autoimmune disease. Immunol Rev. 2006 Aug;212:8-27.
50) Viglietta V, Baecher-Allan C, Weiner HL, Hafler DA. Loss of functional
suppression by CD4+CD25+ regulatory T cells in patients with multiple sclerosis. J Exp Med. 2004 Apr 5;199(7):971-9.
51) Haas J, Fritzsching B, Trübswetter P, Korporal M, Milkova L, Fritz B, Vobis
naive regulatory T cells (Treg) is critical for Treg suppressive function and determines Treg dysfunction in multiple sclerosis. J Immunol. 2007 Jul 15;179(2):1322-30.
52) De Rosa V, Galgani M, Porcellini A, Colamatteo A, Santopaolo M, Zuchegna
C, Romano A, De Simone S, Procaccini C, La Rocca C, Carrieri PB, Maniscalco GT, Salvetti M, Buscarinu MC, Franzese A, Mozzillo E, La Cava A, Matarese G. Glycolysis controls the induction of human regulatory T cells by modulating the expression of FOXP3 exon 2 splicing variants. Nat Immunol. 2015 Nov;16(11):1174-84.
53) De Rosa V, Procaccini C, Calì G, Pirozzi G, Fontana S, Zappacosta S, La
Cava A, Matarese G. A key role of leptin in the control of regulatory T cell proliferation. Immunity. 2007 Feb;26(2):241-55.
54) Michalek RD, Gerriets VA, Jacobs SR, Macintyre AN, MacIver NJ, Mason
EF, Sullivan SA, Nichols AG, Rathmell JC. Cutting edge: distinct glycolytic and lipid oxidative metabolic programs are essential for effector and regulatory CD4+ T cell subsets. J Immunol. 2011 Mar 15;186(6):3299-303.
55) Procaccini C, De Rosa V, Galgani M, Abanni L, Calì G, Porcellini A, Carbone
F, Fontana S, Horvath TL, La Cava A, Matarese G. An oscillatory switch in mTOR kinase activity sets regulatory T cell responsiveness. Immunity. 2010 Dec 14;33(6):929-41.
56) Pearce EL, Pearce EJ. Metabolic pathways in immune cell activation and
quiescence. Immunity. 2013 Apr 18;38(4):633-43.
57) Wang W, Wang L, Endoh A, Hummelke G, Hawks CL, Hornsby PJ.
Identification of alpha-enolase as a nuclear DNA-binding protein in the zona fasciculata but not the zona reticularis of the human adrenal cortex. J Endocrinol. 2005 Jan;184(1):85-94.
58) Hsu KW, Hsieh RH, Lee YH, Chao CH, Wu KJ, Tseng MJ, Yeh TS. The
activated Notch1 receptor cooperates with alpha-enolase and MBP-1 in modulating c-myc activity. Mol Cell Biol. 2008 Aug;28(15):4829-42.
59) Subramanian A, Miller DM. Structural analysis of alpha-enolase. Mapping
the functional domains involved in down-regulation of the c-myc protooncogene. J Biol Chem. 2000 Feb 25;275(8):5958-65.
60) Pancholi V. Multifunctional alpha-enolase: its role in diseases. Cell Mol Life
61) Miskov-Zivanov N, Turner MS, Kane LP, Morel PA, Faeder JR. The duration
of T cell stimulation is a critical determinant of cell fate and plasticity. Sci Signal. 2013 Nov 5;6(300):ra97.
62) Gottschalk RA, Corse E, Allison JP. TCR ligand density and affinity
determine peripheral induction of FoxP3 in vivo. J Exp Med. 2010 Aug 2;207(8):1701-11.
63) Cheng G, Yu A, Malek TR. T-cell tolerance and the multi-functional role of
IL-2R signaling in T-regulatory cells. Immunol Rev. 2011 May;241(1):63-76.
64) Maruyama T, Konkel JE, Zamarron BF, Chen W. The molecular mechanisms