Dottorato di ricerca in
Biochimica e patologia dell’azione dei farmaci X ciclo nuova serie
2008-2012
Le complicanze cardiovascolari nel diabete mellito:
studio delle basi molecolari
Dottoranda
Anna Carratú
Tutor
Ch.mo Prof. Antonello Petrella
Coordinatore
Ch.mo Prof. Antonietta Leone
To my Family
ABSTRACT
1
INTRODUCTION
3
AIM OF THE STUDY
5
CHAPTER 1
7
D
IABETESM
ELLITUS7
1.1
C
LASSIFICATION7
1.2
E
PIDEMIOLOGY9
1.3
I
NSULIN BIOSYNTHESIS,
SECRETION AND ACTION10
1.3.1 Biosynthesis
10
1.3.2 Secretion
10
1.3.3 Action
11
1.4.
T
YPE1
DM
13
1.4.1 Genetic Considerations
13
1.4.2 Pathophysiology
14
1.4.3 Immunologic markers
15
1.4.4 Environmental factors
15
1.5
T
YPE2
DM
16
1.5.1 Genetic Considerations
16
1.5.2 Pathophysiology
16
1.5.3 Abnormal Muscle and Fat Metabolism
17
1.5.4 Impaired Insulin Secretion
18
1.5.5 Increased Hepatic Glucose and Lipid Production
18
1.6
INSULIN
RESISTANCE
SYNDROMES
19
CHAPTER 2
21
C
OMPLICATIONS OFD
IABETESM
ELLITUS21
2.1
B
IOCHEMISTRY AND MOLECULAR CELL BIOLOGY21
2.1.2 Shared Pathophysiologic Features of Microvascular Complications 21
2.1.3 Abnormal Endothelial Cell Function
22
2.1.4 Microvascular Cell Loss and Vessel Occlusion
23
2.1.5 Genetic Determinants of Susceptibility to Microvascular
Complications
23
2.2
P
ATHOPHYSIOLOGICF
EATURESOFM
ACROVASCULARC
OMPLICATIONS24
2.2.1
I
MPAIREDC
OLLATERALB
LOODV
ESSELF
ORMATION FROMB
ONEM
ARROWP
ROGENITORC
ELLS25
2.3
M
ECHANISMS OFH
YPERGLYCEMIA-I
NDUCEDD
AMAGE27
2.3.3 Hyperglycemia-Induced Protein Kinase C Activation.
29
2.3.4 Increased Hexosamine Pathway Flux
29
2.4
D
IFFERENTH
YPERGLYCEMIA-I
NDUCEDP
ATHOGENICM
ECHANISMSR
EFLECT AS
INGLEP
ROCESS30
CHAPTER 3
33
M
ETABOLICM
EMORY33
3.1
G
ENERATION OF IRREVERSIBLE BIOCHEMICAL RESPONSE FROM ATRANSIENT STIMULUS
34
CHAPTER 4
37
M
ATERIAL ANDM
ETHODS37
4.1
M
ATERIALS37
4.2
C
ELLC
ULTURE CONDITIONS37
4.3
R
EACTIVE OXYGEN SPECIES QUANTIZATION37
4.4
M
ITOCHONDRIAL MEMBRANE POTENTIAL38
4.5
I
MMUNOPRECIPITATION ANDW
ESTERN BLOTTING38
4.6
D
ETERMINATION OFGSK-3β
ACTIVITY38
4.7
D
ETERMINATION OFA
KT1
ACTIVITY38
4.8
D
ETERMINE OFPP2A
A
CTIVITY38
4.9
D
ETERMINATION OF INTRACELLULAR FREE IRON39
4.10
C
HROMATINI
MMUNOPRECIPITATIONE
XPERIMENTS39
4.11
S
TATISTICS40
CHAPTER 5
41
R
ESULTS41
5.1
T
RANSIENTH
IGHG
LUCOSE CAUSES SUSTAINEDROS
PRODUCTION41
5.2
S
USTAINED INCREASE IN MITOCHONDRIALROS
PRODUCTION IS MAINTAINEDBY A MULTI
-
COMPONENT POSITIVE FEEDBACK LOOP46
5.3
P
HENOCOPYING LOOP ACTIVATION51
5.4
D
ISRUPTION OF FEEDBACK LOOP COMPONENTS REVERSES THE SUSTAINEDEFFECTS OF TRANSIENT GLUCOSE STIMULUS
52
CHAPTER 6
57
D
ISCUSSION57
DCCT Diabetes Control and Complications Trial
DFO Deferoxamine
DM Diabetes Mellitus
EDIC Epidemiology of Diabetes Interventions and Complications study GSK-3β Glycogen Synthase Kinase 3 β
HAEC Human Aortic Endothelial Cells HbA1C hemoglobin A1c
HK Hexokinase
MnSOD Manganese Superoxide Dismutase PP2A Protein Phosphatase 2A
ROS Reactive Oxygen Species
ABSTRACT
Diabetes is characterized by development of specific microvascular complications and by a high incidence of accelerated atherosclerosis.
The assumption underlying current clinical treatment is that lowering the level of time-averaged glucose concentration, measured as hemoglobin A1c (HbA1c), prevents the development and progression of microvascular complications. This current treatment recommendation, adopted by diabetes professional societies around the world, is based on data from the 1993 Diabetes Control and Complications Trial (DCCT).
Recent Diabetes Control and Complications Trial data analyses show that 89% of the variation in microvascular complications risk in type 1 diabetes is not captured by HbA1c values (time-averaged glucose concentration). Recent experimental evidence from Dr Brownlee’s lab, shows that transient exposure to threshold levels of high glucose reprograms human endothelial cells to continue overproducing reactive oxygen species in the presence of physiologic glucose concentrations. This persistent ROS overproduction causes an equally persistent overexpression of pro-inflammatory genes in normal glucose due to hystone modifications in the proximal promoter of the NF-κB subunit p65.
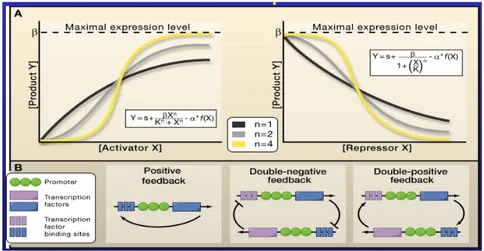
Since in normal cells the epigenetic changes are rapidly reversed by histone demethylases and histone methyltransferases my thesis work aimed to understand how transient exposure to high glucose reprograms endothelial cells, and characterize the critical regulatory networks that shift vascular endothelial cells to a state of persistent excess ROS production after transient exposure to high glucose. We found that transient spikes of hyperglycemia cause persistent mitochondrial overproduction of ROS during subsequent periods of prolonged normal glucose, causing persistent activation of the epigenetic changes and resultant vascular inflammatory gene expression. We identified a multi-component positive feedback loop induced by transient exposure to high glucose in human vascular endothelial cells which maintains persistently increased ROS production in normal glucose, thus we verified that transient disruption of any of the elements in the feed back loop rapidly restores the system to its normal state, including reversing persistent increased ROS production, persistent hyperglycemia-induced epigenetic changes and persistent increased NF-κB-dependent pro-inflammatory gene expression.
Our results highlight the dramatic and long-lasting effects that short-term hyperglycemic spikes can have on vascular cells and suggest that transient spikes of hyperglycemia may be an HbA1c–independent risk factor for diabetic complications. Moreover we understood the mechanism underlying the continue overproducing of reactive oxygen species in the presence of physiologic glucose concentrations in human endothelial cells. This knowledge will provide the basis for developing new type 1 diabetes treatment paradigms that more effectively prevent the development and progression of microvascular complications.
INTRODUCTION
Diabetes mellitus (DM) refers to a group of common metabolic disorders characterized by hyperglycemia. The metabolic dysregulation associated with DM causes secondary pathophysiologic changes in multiple organ systems, leading to end-stage renal disease (ESRD), non-traumatic lower extremity amputations, and adult blindness. It also predisposes to cardiovascular diseases.
The assumption underlying current clinical treatment is that lowering the level of time-averaged glucose concentration, measured as hemoglobin A1c (HbA1c), prevents the development and progression of microvascular complications. This current treatment recommendation, adopted by diabetes professional societies around the world, is based on data from the 1993 Diabetes Control and Complications Trial (DCCT), where intensive therapy reduced the risk of sustained retinopathy progression by 73% compared with standard treatment. After the announcement of the DCCT results, many patients who had been in standard therapy group adopted more intensive therapeutic regiments, and their level of glycemic control improved. The post-DCCT HbA1c values for both groups have become nearly identical during the approximate 10 years of follow-up in the Epidemiology of Diabetes Interventions and Complications Study (EDIC). Surprisingly, the effects of 6.5-years difference in HbA1c, during the DCCT on the incidence if retinopathy and nephropathy, have persisted. People in standard treatment group continued to have a higher incidence of microvascular complications even with an improvement in glycemic control during the EDIC. HbA1c and duration of diabetes (glycemic exposure) explained only about 11% of the variation in retinopathy risk for the entire study population, suggesting that the remaining 89% of the variation in risk is presumably explained by other factors not captured by measurement of HbA1c.
What factors not captured by HbA1c measurements might explain the remaining 89% of microvascular complications risk for people with type 1 diabetes? Since HbA1c represents the time-averaged mean level of glycemia, it provides no information about how closely the fluctuations of blood glucose levels around that mean mimic the normal narrow range of blood glucose excursion, and patients with identical HbA1c values differ significantly in amplitude and duration of glycemic spikes.
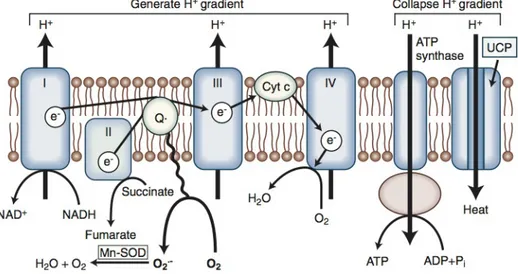
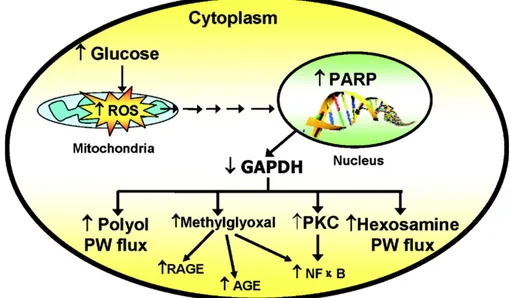
Oxidative stress plays a pivotal role in the development of diabetes vascular and neurologic complications. High intracellular concentrations of glucose cause increased superoxide production from the mitochondria. This increased superoxide production causes the activation of the five major pathways implicated in the pathogenesis of complications over the past 40 years: polyol pathway flux, increased formation of AGEs (advanced glycation end products), increased expression of the receptor for AGEs, (RAGE) and its activating ligands, activation of protein kinase C isoforms, and overactivity of the hexosamine pathway. Through these pathways, increased intracellular reactive oxygen species (ROS) cause defective angiogenesis in response to ischemia and activate a number of proinflammatory pathways as demonstrated by overexpression of superoxide dismutase in transgenic diabetic mice that prevents diabetic retinopathy, nephropathy, and cardiomyopathy.
Experimental evidence both in cultured primary human endothelial cells and in non-diabetic mice shows that short exposure to hyperglycemia (6-16 hr) triggers persistent increases in proinflammatory gene expression during long subsequent periods of normal glycemia (6 days) by inducing persistent epigenetic changes in the proximal promoter of NF-κB p65,
increasing p65 expression. This in turn causes persistent increased expression of the proinflammatory proteins monocyte chemotactic protein-1, vascular cell adhesion molecule-1, intercellular adhesion molecule-1, interleukin-6, and inducible nitric oxide synthase.
These persistent changes in gene expression are induced by spikes of hyperglycemia that have durations too short (6-16 hours followed by 6 days of normal glycemia) to influence HbA1C values. Since regulation of gene expression by methylation of histone lysines is rapidly reversible by the action of demethlases and histone methyltransferases, however, the mechanism responsible for the persistence of these epigenetic changes has remained puzzling.
The ability of hyperglycemia to elicit epigenetic changes may be associated with diabetes complications. Further exploration into epigenetic mechanisms can yield new insights into the pathogenesis of diabetes and its complications and uncover potential therapeutic targets and treatment options to prevent the continued development of diabetic complications even after glucose control has been achieved.
AIM OF THE STUDY
The existing paradigm for treatment of type 1 diabetes is to lower hemoglobin A1c values, based on the assumption that hemoglobin A1c explains a large proportion of microvascular complication risk. However, recent analysis of the Diabetes Control and Complications Trial data shows that 89% of the variation in retinopathy risk in type 1 diabetes is not captured by HbA1c values (time-averaged glucose concentration).
Transient exposure to threshold levels of high glucose reprograms human
endothelial cells to continue overproducing reactive oxygen species in the presence
of physiologic glucose concentrations for many days. This persistent ROS overproduction causes an equally persistent overexpression of pro-inflammatory
genes in normal glucose. The specific aims of this thesis are to identity and
characterize critical regulatory networks that shift vascular endothelial cells to a
CHAPTER 1
Diabetes Mellitus
Diabetes mellitus (DM) refers to a group of common metabolic disorders characterized by hyperglycemia. Depending on the etiology of the DM, factors contributing to hyperglycemia include reduced insulin secretion, decreased glucose utilization, and increased glucose production. The metabolic dysregulation associated with DM causes secondary pathophysiologic changes in multiple organ systems, leading to end-stage renal disease (ESRD), nontraumatic lower extremity amputations, and adult blindness. It also predisposes to cardiovascular diseases.
1.1 Classification
DM is classified on the basis of the pathogenic process that leads to hyperglycemia, as opposed to earlier criteria such as age of onset or type of therapy. The two broad categories of DM are designated type 1 and type 2. Type 1 DM is the result of complete or near-total insulin deficiency. Type 2 DM is a heterogeneous group of disorders characterized by variable degrees of insulin resistance, impaired insulin secretion, and increased glucose production and is preceded by a period of abnormal glucose homeostasis classified as impaired fasting glucose (IFG) or impaired glucose tolerance (IGT).
Table 1 Etiologic Classification of Diabetes Mellitus
I. Type 1 diabetes (beta cell destruction, usually leading to absolute insulin deficiency)
A. Immune-mediated B. Idiopathic
II. Type 2 diabetes (may range from predominantly insulin resistance with relative insulin deficiency to a predominantly insulin secretory defect with insulin resistance)
III. Other specific types of diabetes
A. Genetic defects of beta cell function characterized by mutations in: 1. Hepatocyte nuclear transcription factor (HNF) 4 (MODY 1) 2. Glucokinase (MODY 2)
3. HNF-1α (MODY 3)
4. Insulin promoter factor-1 (IPF-1; MODY 4) 5. HNF-1β (MODY 5)
6. NeuroD1 (MODY 6) 7. Mitochondrial DNA
8. Subunits of ATP-sensitive potassium channel 9. Proinsulin or insulin
B. Genetic defects in insulin action 1. Type A insulin resistance 2. Leprechaunism
3. Rabson-Mendenhall syndrome 4. Lipodystrophy syndromes
C. Diseases of the exocrine pancreas—pancreatitis, pancreatectomy, neoplasia, cystic fibrosis, hemochromatosis, fibrocalculous pancreatopathy, mutations in carboxyl ester lipase
D. Endocrinopathies—acromegaly, Cushing's syndrome, glucagonoma, pheochromocytoma, hyperthyroidism, somatostatinoma, aldosteronoma E. Drug- or chemical-induced—glucocorticoids, vacor (a rodenticide), pentamidine, nicotinic acid, diazoxide, β-adrenergic agonists, thiazides, hydantoins, asparaginase, α-interferon, protease inhibitors, antipsychotics (atypicals and others), epinephrine
F. Infections—congenital rubella, cytomegalovirus, coxsackievirus
G. Uncommon forms of immune-mediated diabetes— "stiff-person" syndrome, anti-insulin receptor antibodies
H. Other genetic syndromes sometimes associated with diabetes— Wolfram's syndrome, Down's syndrome, Klinefelter's syndrome, Turner's syndrome, Friedreich's ataxia, Huntington's chorea, Laurence-Moon-Biedl syndrome, myotonic dystrophy, porphyria, Prader-Willi syndrome
Two features of the current classification of DM diverge from previous classifications. First, the terms insulin-dependent diabetes mellitus (IDDM) and
non-insulin-dependent diabetes mellitus (NIDDM) are obsolete. Since many
individuals with type 2 DM eventually require insulin treatment for control of glycemia, the use of the term NIDDM generated considerable confusion. A second difference is that age is not a criterion in the classification system. Although type 1 DM most commonly develops before the age of 30, an autoimmune beta cell destructive process can develop at any age. It is estimated that between 5 and 10% of individuals who develop DM after age 30 years have type 1 DM. Although type 2 DM more typically develops with increasing age, it is now being diagnosed more frequently in children and young adults, particularly in obese adolescents (Harrison's Principles of Internal Medicine textbook, 18e 2011).
1.2 Epidemiology
The worldwide prevalence of DM increased dramatically over the past 20 years, from ~ 30 million cases in 1985 to about 285 million in 2010. Approximately 1.6 million individuals (>20 years) were newly diagnosed with diabetes in 2010. Based on current trends, the International Diabetes Federation expects that 438 million individuals will have diabetes by the year 2030. Among type 1 and type 2 DM, the prevalence of type 2 DM is rising much more rapidly, presumably because of increasing obesity and the aging of the population. DM increases with aging. In 2010, the prevalence of DM in the United Sates was estimated to be 0.2% in individuals aged <20 years and 11.3% in individuals aged >20 years. In individuals aged >65 years, the prevalence of DM was 26.9%. The prevalence is similar in men and women throughout most age ranges (11.8% and 10.8%, respectively, in individuals aged >20 years). Worldwide estimates project that in 2030 the greatest number of individuals with diabetes will be aged 45–64 years (Harrison's Principles of Internal Medicine textbook, 18e 2011).
1.3 Insulin biosynthesis, secretion and action
1.3.1 Biosynthesis
Insulin is produced in the beta cells of the pancreatic islets. It is initially synthesized as a single-chain 86-aminoacid precursor polypeptide, known as preproinsulin. Subsequent proteolytic processing removes the N-terminal signal peptide, generating proinsulin. Proinsulin is structurally related to insulin-like growth factors I and II, which bind weakly to the insulin receptor. Cleavage of an internal 31-residue fragment from proinsulin generates the C peptide and the A (21 amino acids) and B (30 amino acids) chains of insulin, which are connected by disulfide bonds. The mature insulin molecule and C peptide are stored together and co-secreted from secretory granules in the beta cells. Because C peptide is cleared more slowly than insulin, it is a useful marker of insulin secretion and allows discrimination of endogenous and exogenous sources of insulin in the evaluation of hypoglycemia. Pancreatic beta cells co-secrete islet amyloid polypeptide (IAPP) or amylin, a 37-amino-acid peptide, along with insulin. The role of IAPP in normal physiology is not fully defined, but it is the major component of the amyloid fibrils found in the islets of patients with 2 DM, and an analogue is sometimes used in treating type 1 and type 2 DM. Human insulin is produced by recombinant DNA technology; structural alterations at one or more amino acid residues modify its physical and pharmacologic characteristics.
1.3.2 Secretion
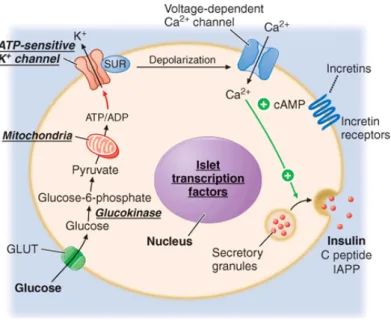
Glucose is the key regulator of insulin secretion by the pancreatic beta cell, although several other molecules (e.g. amino acids, ketones, various nutrients, gastrointestinal peptides, and neurotransmitters) also influence insulin secretion. Glucose levels >3.9 mmol/L (70 mg/dL) stimulate insulin synthesis, primarily by enhancing protein translation and processing. Glucose stimulation of insulin secretion begins with its transport into the beta cell by a facilitative glucose transporter (Fig.1.1). Glucose phosphorylation by glucokinase is the rate-limiting step that controls glucose-regulated insulin secretion. Further metabolism of glucose-6-phosphate via glycolysis generates ATP, which inhibits the activity of an ATP-sensitive K+ channel. This channel consists of two separate proteins: one is the binding site for certain oral hypoglycemics (e.g., sulfonyl-ureas, meglitinides); the other is an inwardly rectifying K+ channel protein. Inhibition of this K+ channel induces beta cell membrane depolarization, which opens voltage-dependent calcium channels (leading to an influx of calcium), and stimulates insulin secretion. Insulin secretory profiles reveal a pulsatile pattern of hormone release, with small secretory bursts occurring about every 10 min, superimposed upon greater amplitude oscillations of about 80–150 min. Incretins are released from neuroendocrine cells of the gastrointestinal tract following food ingestion and amplify glucose-stimulated insulin secretion and suppress glucagon secretion. Glucagon-like peptide 1 (GLP-1), the most potent incretin, is released from L cells in the small intestine and stimulates insulin secretion only when the blood glucose is above the fasting level. Incretin analogues, are used to enhance endogenous insulin secretion.
Figure 1.1 Mechanisms of glucose-stimulated insulin secretion and abnormalities in diabetes.
Glucose and other nutrients regulate insulin secretion by the pancreatic beta cell. Glucose is transported by a glucose transporter (GLUT1 in humans, GLUT2 in rodents); subsequent glucose metabolism by the beta cell alters ion channel activity, leading to insulin secretion. The SUR receptor is the binding site for some drugs that act as insulin secretagogues. SUR, sulfonylurea receptor; ATP, adenosine triphosphate; ADP, adenosine diphosphate, cAMP, cyclic adenosine monophosphate. IAPP, islet amyloid polypeptide or amylin.
1.3.3 Action
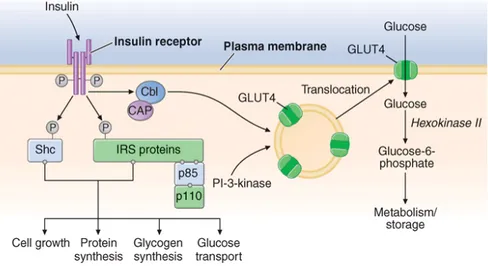
Once insulin is secreted into the portal venous system, ~50% is removed and degraded by the liver. Unextracted insulin enters the systemic circulation where it binds to receptors in target sites. Insulin binding to its receptor stimulates intrinsic tyrosine kinase activity, leading to receptor autophosphorylation and the recruitment of intracellular signaling molecules, such as insulin receptor substrates (IRS) (Fig.1.2). IRS and other adaptor proteins initiate a complex cascade of phosphorylation and dephosphorylation reactions, resulting in the widespread metabolic and mitogenic effects of insulin. As an example, activation of the phosphatidylinositol-3′-kinase (PI-3-kinase) pathway stimulates translocation of a facilitative glucose transporter (e.g., GLUT4) to the cell surface, an event that is crucial for glucose uptake by skeletal muscle and fat. Activation of other insulin receptor signaling pathways induces glycogen synthesis, protein synthesis, lipogenesis, and regulation of various genes in insulin-responsive cells.
Glucose homeostasis reflects a balance between hepatic glucose production and peripheral glucose uptake and utilization. Insulin is the most important regulator of this metabolic equilibrium, but neural input, metabolic signals, and other hormones (e.g.,glucagon) result in integrated control of glucose supply and utilization. In the fasting state, low insulin levels increase glucose production by promoting hepatic gluconeogenesis and glycogenolysis and reduce glucose uptake in insulin-sensitive tissues (skeletal muscle and fat), thereby promoting mobilization
of stored precursors such as amino acids and free fatty acids (lipolysis). Glucagon, secreted by pancreatic alpha cells when blood glucose or insulin levels are low, stimulates glycogenolysis and gluconeogenesis by the liver and renal medulla. Postprandially, the glucose load elicits a rise in insulin and fall in glucagon, leading to a reversal of these processes. Insulin, an anabolic hormone, promotes the storage of carbohydrate and fat and protein synthesis. The major portion of postprandial glucose is utilized by skeletal muscle, an effect of insulin-stimulated glucose uptake. Other tissues, most notably the brain, utilize glucose in an insulin-independent fashion (Harrison's Principles of Internal Medicine textbook, 18e 2011).
Figure 1.2 Insulin signal transduction pathway in skeletal muscle. The insulin receptor has intrinsic
tyrosine kinase activity and interacts with insulin receptor substrates (IRS and Shc) proteins. A number of "docking" proteins bind to these cellular proteins and initiate the metabolic actions of insulin [GrB-2, SOS, SHP-2, p110, and phosphatidylinositol-3′-kinase (PI-3-kinase)]. Insulin increases glucose transport through PI-3-kinase and the Cbl pathway, which promotes the translocation of intracellular vesicles containing GLUT4 glucose transporter to the plasma membrane
1.4. Type 1 DM
Type 1 DM is the result of interactions of genetic, environmental, and immunologic factors that ultimately lead to the destruction of the pancreatic beta cells and insulin deficiency. Type 1 DM results from autoimmune beta cell destruction, and most, but not all, individuals have evidence of islet-directed autoimmunity. This autoimmune process is thought to be triggered by an infectious or environmental stimulus and to be sustained by a beta cell–specific molecule. In the majority, immunologic markers appear after the triggering event but before diabetes becomes clinically overt. Beta cell mass then begins to decrease, and insulin secretion progressively declines, although normal glucose tolerance is maintained. The rate of decline in beta cell mass varies widely among individuals, with some patients progressing rapidly to clinical diabetes and others evolving more slowly. Features of diabetes do not become evident until a majority of beta cells are destroyed (70–80%). At this point, residual functional beta cells exist but are insufficient in number to maintain glucose tolerance. The events that trigger the transition from glucose intolerance to frank diabetes are often associated with increased insulin requirements, as might occur during infections or puberty. After the initial clinical presentation of type 1 DM, a "honeymoon" phase may ensue during which time glycemic control is achieved with modest doses of insulin or, rarely, insulin is not needed. However, this fleeting phase of endogenous insulin production from residual beta cells disappears as the autoimmune process destroys remaining beta cells, and the individual becomes insulin deficient. Some individuals with long-standing type 1 diabetes produce a small amount of insulin (as reflected by C-peptide production) and some individuals have insulin-positive cells in the pancreas at autopsy.
1.4.1 Genetic Considerations
Susceptibility to type 1 DM involves multiple genes. The concordance of type 1 DM in identical twins ranges between 40 and 60%, indicating that additional modifying factors are likely involved in determining whether diabetes develops. The major susceptibility gene for type 1 DM is located in the HLA region on chromosome 6. Polymorphisms in the HLA complex account for 40–50% of the genetic risk of developing type 1 DM. This region contains genes that encode the class II major histocompatibility complex (MHC) molecules, which present antigen to helper T cells and thus are involved in initiating the immune response. The ability of class II MHC molecules to present antigen is dependent on the amino acid composition of their antigen-binding sites. Amino acid substitutions may influence the specificity of the immune response by altering the binding affinity of different antigens for class II molecules.
Most individuals with type 1 DM have the HLA DR3 and/or DR4 haplotype. Refinements in genotyping of HLA loci have shown that the haplotypes DQA1*0301, DQB1*0302, and DQB1*0201 are most strongly associated with type 1 DM. These haplotypes are present in 40% of children with type 1 DM as compared to 2% of the normal U.S. population. However, most individuals with predisposing haplotypes do not develop diabetes.
In addition to MHC class II associations, genome association studies have identified at least 20 different genetic loci that contribute susceptibility to type 1 DM
(polymorphisms in the promoter region of the insulin gene, the CTLA-4 gene, interleukin-2 receptor, CTLA4, and PTPN22, etc.). Genes that confer protection against the development of the disease also exist. The haplotype DQA1*0102, DQB1*0602 is extremely rare in individuals with type 1 DM (<1%) and appears to provide protection from type 1 DM.
Although the risk of developing type 1 DM is increased ten fold in relatives of individuals with the disease, the risk is relatively low: 3–4% if the parent has type 1 diabetes and 5–15% in a sibling (depending on which HLA haplotypes are shared). Hence, most individuals with type 1 DM do not have a first-degree relative with this disorder.
1.4.2 Pathophysiology
Although other islet cell types [alpha cells (glucagon-producing), delta cells (somatostatin-producing), or PP cells (pancreatic polypeptide-producing)] are functionally and embryologically similar to beta cells and express most of the same proteins as beta cells, they are spared from the autoimmune destruction. Pathologically, the pancreatic islets are infiltrated with lymphocytes (a process termed insulitis). After all beta cells are destroyed, the inflammatory process abates, the islets become atrophic, and most immunologic markers disappear. Studies of the autoimmune process in humans and in animal models of type 1 DM (NOD mouse and BB rat) have identified the following abnormalities in the humoral and cellular arms of the immune system: (1) islet cell autoantibodies; (2) activated lymphocytes in the islets, peripancreatic lymph nodes, and systemic circulation; (3) T lymphocytes that proliferate when stimulated with islet proteins; and (4) release of cytokines within the insulitis. Beta cells seem to be particularly susceptible to the toxic effect of some cytokines [tumor necrosis factor α (TNF-α), interferon γ, and interleukin 1 (IL-1)]. The precise mechanisms of beta cell death are not known but may involve formation of nitric oxide metabolites, apoptosis, and direct CD8+ T cell cytotoxicity. The islet destruction is mediated by T lymphocytes rather than islet autoantibodies, as these antibodies do not generally react with the cell surface of islet cells and are not capable of transferring DM to animals. Suppression of the autoimmune process at the time of diagnosis of diabetes slows the decline in beta cell destruction, but the safety of such interventions is unknown.
Pancreatic islet molecules targeted by the autoimmune process include insulin, glutamic acid decarboxylase (GAD, the biosynthetic enzyme for the neurotransmitter GABA), ICA-512/IA-2 (homology with tyrosine phosphatases), and a beta cell–specific zinc transporter (ZnT-8). Most of the auto-antigens are not beta cell–specific, which raises the question of how the beta cells are selectively destroyed. Current theories favor initiation of an autoimmune process directed at one beta cell molecule, which then spreads to other islet molecules as the immune process destroys beta cells and creates a series of secondary auto-antigens. The beta cells of individuals who develop type 1 DM do not differ from beta cells of normal individuals, since islets transplanted from a genetically identical twin are destroyed by a recurrence of the autoimmune process of type 1 DM.
1.4.3 Immunologic markers
Islet cell autoantibodies (ICAs) are a composite of several different antibodies directed at pancreatic islet molecules such as GAD, insulin, IA-2/ICA-512, and ZnT-8, and serve as a marker of the autoimmune process of type 1 DM. Assays for autoantibodies to GAD-65 are commercially available. Testing for ICAs can be useful in classifying the type of DM as type 1 and in identifying non-diabetic individuals at risk for developing type 1 DM. ICAs are present in the majority of individuals (>85%) diagnosed with new-onset type 1 DM, in a significant minority of individuals with newly diagnosed type 2 DM (5–10%), and occasionally in individuals with GDM (<5%). At present, the measurement of ICAs in non-diabetic individuals is a research tool because no treatments have been approved to prevent the occurrence or progression to type 1 DM. Clinical trials are testing interventions to slow the autoimmune beta cell destruction.
1.4.4 Environmental factors
Numerous environmental events have been proposed to trigger the autoimmune process in genetically susceptible individuals; however, none have been conclusively linked to diabetes. Identification of an environmental trigger has been difficult because the event may precede the onset of DM by several years. Putative environmental triggers include viruses (coxsackie, rubella, enteroviruses most prominently), bovine milk proteins and nitrosourea compounds.
1.5 Type 2 DM
Insulin resistance and abnormal insulin secretion are central to the development of type 2 DM. Although the primary defect is controversial, most studies support the view that insulin resistance precedes an insulin secretory defect but that diabetes develops only when insulin secretion becomes inadequate. Type 2 DM likely encompasses a range of disorders with common phenotype of hyperglycemia. Most of our current understanding of the pathophysiology and genetics is based on studies of individuals of European descent. It is becoming increasing apparent that DM in other ethnic groups (Asian, African, and Latin American) has a different, but yet undefined, pathophysiology. In these groups, DM that is ketosisprone (often obese) or ketosis-resistant (often lean) is commonly seen.
1.5.1 Genetic Considerations
Type 2 DM has a strong genetic component. The concordance of type 2 DM in identical twins is between 70 and 90%. Individuals with a parent with type 2 DM have an increased risk of diabetes; if both parents have type 2 DM, the risk approaches 40%. Insulin resistance, as demonstrated by reduced glucose utilization in skeletal muscle, is present in many non-diabetic, first-degree relatives of individuals with type 2 DM. The disease is polygenic and multifactorial, since in addition to genetic susceptibility, environmental factors (such as obesity, nutrition, and physical activity) modulate the phenotype. The genes that predispose to type 2 DM are incompletely identified, but recent genome-wide association studies have identified a large number of genes that convey a relatively small risk for type 2 DM (>20 genes, each with a relative risk of 1.06–1.5). Most prominent is a variant of the transcription factor 7–like 2 gene that has been associated with type 2 diabetes in several populations and with impaired glucose tolerance in one population at high risk for diabetes. Genetic polymorphisms associated with type 2 diabetes have also been found in the genes encoding the peroxisome proliferators–activated receptor-γ, inward rectifying potassium channel, zinc transporter, IRS, and calpain 10. The mechanisms by which these genetic loci increase the susceptibility to type 2 diabetes are not clear, but most are predicted to alter islet function or development or insulin secretion. While the genetic susceptibility to type 2 diabetes is under active investigation (estimation that <10% of genetic risk is determined by loci identified thus far), it is currently not possible to use a combination of known genetic loci to predict type 2 diabetes.
1.5.2 Pathophysiology
Type 2 DM is characterized by impaired insulin secretion, insulin resistance, excessive hepatic glucose production, and abnormal fat metabolism. Obesity, particularly visceral or central (as evidenced by the hip-waist ratio), is very common in type 2 DM (80% or more are obese). In the early stages of the disorder, glucose tolerance remains near-normal, despite insulin resistance, because the pancreatic beta cells compensate by increasing insulin output. As insulin resistance and compensatory hyperinsulinemia progress, the pancreatic islets in certain individuals are unable to sustain the hyperinsulinemic state. A further decline in insulin
secretion and an increase in hepatic glucose production lead to overt diabetes with fasting hyperglycemia. Ultimately, beta cell failure ensues.
1.5.3 Abnormal Muscle and Fat Metabolism
Insulin resistance, the decreased ability of insulin to act effectively on target tissues (especially muscle, liver, and fat), is a prominent feature of type 2 DM and results from a combination of genetic susceptibility and obesity. Insulin resistance impairs glucose utilization by insulin-sensitive tissues and increases hepatic glucose output; both effects contribute to the hyperglycemia. Increased hepatic glucose output predominantly accounts for increased FPG levels, whereas decreased peripheral glucose usage results in postprandial hyperglycemia. In skeletal muscle, there is a greater impairment in non-oxidative glucose usage (glycogen formation) than in oxidative glucose metabolism through glycolysis. Glucose metabolism in insulin-independent tissues is not altered in type 2 DM.
The precise molecular mechanism leading to insulin resistance in type 2 DM has not been elucidated. Insulin receptor levels and tyrosine kinase activity in skeletal muscle are reduced, but these alterations are most likely secondary to hyperinsulinemia and are not a primary defect. Therefore, "post-receptor" defects in insulin-regulated phosphorylation/dephosphorylation appear to play the predominant role in insulin resistance. For example, a PI-3-kinase signaling defect might reduce translocation of GLUT4 to the plasma membrane. Other abnormalities include the accumulation of lipid within skeletal myocytes, which may impair mitochondrial oxidative phosphorylation and reduce insulin-stimulated mitochondrial ATP production. Impaired fatty acid oxidation and lipid accumulation within skeletal myocytes also may generate reactive oxygen species such as lipid peroxides. Of note, not all insulin signal transduction pathways are resistant to the effects of insulin (e.g., those controlling cell growth and differentiation using the mitogenic-activated protein kinase pathway). Consequently, hyperinsulinemia may increase the insulin action through these pathways, potentially accelerating diabetes-related conditions such as atherosclerosis.
The obesity accompanying type 2 DM, particularly in a central or visceral location, is thought to be part of the pathogenic process. The increased adipocyte mass leads to increased levels of circulating free fatty acids and other fat cell products. For example, adipocytes secrete a number of biologic products (non-esterified free fatty acids, retinol-binding protein 4, leptin, TNF-α, resistin, and adiponectin). In addition to regulating body weight, appetite, and energy expenditure, adipokines also modulate insulin sensitivity. The increased production of free fatty acids and some adipokines may cause insulin resistance in skeletal muscle and liver. For example, free fatty acids impair glucose utilization in skeletal muscle, promote glucose production by the liver, and impair beta cell function. In contrast, the production by adipocytes of adiponectin, an insulin-sensitizing peptide, is reduced in obesity, and this may contribute to hepatic insulin resistance. Adipocyte products and adipokines also produce an inflammatory state and may explain why markers of inflammation such as IL-6 and C-reactive protein are often elevated in type 2 DM. In addition, inflammatory cells have been found infiltrating adipose tissue. Inhibition of inflammatory signaling pathways such as the nuclear factor κB (NF-κB) pathway appears to reduce insulin resistance and improve hyper-glycemia in animal models.
1.5.4 Impaired Insulin Secretion
Insulin secretion and sensitivity are interrelated. In type 2 DM, insulin secretion initially increases in response to insulin resistance to maintain normal glucose tolerance. Initially, the insulin secretory defect is mild and selectively involves glucose-stimulated insulin secretion. The response to other non-glucose secretagogues, such as arginine, is preserved. Abnormalities in proinsulin processing is reflected by increased secretion of proinsulin in type 2 diabetes. Eventually, the insulin secretory defect progresses to a state of inadequate insulin secretion. The reason(s) for the decline in insulin secretory capacity in type 2 DM is unclear. The assumption is that a second genetic defect—superimposed upon insulin resistance—leads to beta cell failure. Beta cell mass is decreased by approximately 50% in individuals with long-standing type 2 diabetes. Islet amyloid polypeptide or amylin is co-secreted by the beta cell and forms the amyloid fibrillar deposit found in the islets of individuals with long-standing type 2 DM. Whether such islet amyloid deposits are a primary or secondary event is not known. The metabolic environment of diabetes may also negatively impact islet function. For example, chronic hyperglycemia paradoxically impairs islet function ("glucose toxicity") and leads to a worsening of hyperglycemia. Improvement in glycemic control is often associated with improved islet function. In addition, elevation of free fatty acid levels ("lipotoxicity") and dietary fat may also worsen islet function.
1.5.5 Increased Hepatic Glucose and Lipid Production
In type 2 DM, insulin resistance in the liver reflects the failure of hyperinsulinemia to suppress gluconeogenesis, which results in fasting hyperglycemia and decreased glycogen storage by the liver in the postprandial state. Increased hepatic glucose production occurs early in the course of diabetes, though likely after the onset of insulin secretory abnormalities and insulin resistance in skeletal muscle. As a result of insulin resistance in adipose tissue, lipolysis and free fatty acid flux from adipocytes are increased, leading to increased lipid [very low density lipoprotein (VLDL) and triglyceride] synthesis in hepatocytes. This lipid storage or steatosis in the liver may lead to non-alcoholic fatty liver disease and abnormal liver function tests. This is also responsible for the dyslipidemia found in type 2 DM [elevated triglycerides, reduced high-density lipoprotein (HDL), and increased small dense low-density lipoprotein (LDL) particles] (Harrison's Principles of Internal Medicine textbook, 18e 2011).
1.6 INSULIN RESISTANCE SYNDROMES
The insulin resistance condition comprises a spectrum of disorders, with hyperglycemia representing one of the most readily diagnosed features. The
metabolic syndrome, the insulin resistance syndrome, or syndrome X are terms
used to describe a constellation of metabolic derangements that includes insulin resistance, hypertension, dyslipidemia (decreased HDL and elevated triglycerides), central or visceral obesity, type 2 diabetes or IGT/IFG, and accelerated cardiovascular disease.
A number of relatively rare forms of severe insulin resistance include features of type 2 DM or IGT. Mutations in the insulin receptor that interfere with binding or signal transduction are a rare cause of insulin resistance. Acanthosis nigricans and signs of hyperandrogenism (hirsutism, acne, and oligomenorrhea in women) are also common physical features. Two distinct syndromes of severe insulin resistance have been described in adults: (1) type A, which affects young women and is characterized by severe hyperinsulinemia, obesity, and features of hyperandrogenism; and (2) type B, which affects middle-aged women and is characterized by severe hyperinsulinemia, features of hyperandrogenism, and autoimmune disorders. Individuals with the type A insulin resistance syndrome have an undefined defect in the insulin-signaling pathway; individuals with the type B insulin resistance syndrome have autoantibodies directed at the insulin receptor. These receptor autoantibodies may block insulin binding or may stimulate the insulin receptor, leading to intermittent hypoglycemia (Harrison's Principles of Internal Medicine textbook, 18e 2011.
CHAPTER 2
Complications of Diabetes Mellitus
2.1 Biochemistry and molecular cell biology
All forms of diabetes, both inherited and acquired, are characterized by hyperglycemia, a relative or absolute lack of insulin, and the development of diabetes-specific microvascular pathology in the retina, renal glomerulus, and peripheral nerve. Diabetes is also associated with accelerated atherosclerotic macrovascular disease affecting arteries that supply the heart, brain, and lower extremities. The risk of cardiovascular complications is increased by two-fold to six-fold in subjects with diabetes. Overall, life expectancy is about 7 to 10 years shorter than for people without diabetes mellitus because of increased mortality from diabetic complications (Skyler, 1996).
2.1.2 Shared Pathophysiologic Features of Microvascular
Complications
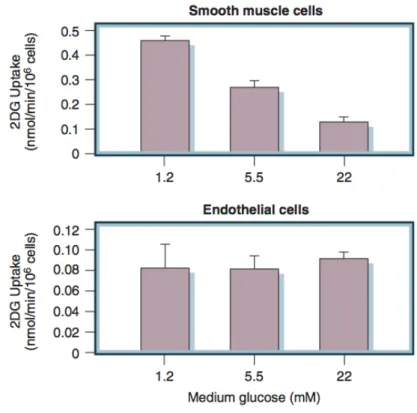
In the retina, glomerulus, and vasa nervorum, diabetes-specific microvascular disease is characterized by similar pathophysiologic features. Although all diabetic cells are exposed to elevated levels of plasma glucose, hyperglycemic damage is limited to those cell types (e.g., endothelial cells) that develop intracellular hyperglycemia. Endothelial cells develop intracellular hyperglycemia because, unlike many other cells, they cannot downregulate glucose transport when exposed to extracellular hyperglycemia. As illustrated in Figure 2.1, vascular smooth muscle cells (VSMC), which are not damaged by hyperglycemia, show an inverse relationship between extracellular glucose concentration and subsequent rate of glucose transport measured as 2-deoxyglucose uptake (Fig. 2.1, upper part). In contrast, vascular endothelial cells show no significant change in subsequent rate of glucose transport after exposure to elevated glucose concentrations (see Fig. 2.1, lower part)(Kaiser et al., 1993).
Figure 2.1 Lack of downregulation of glucose transport in cells affected by diabetic complications. Upper
panel, 2-deoxyglucose (2DG) uptake in vascular smooth muscle cells pre-exposed to 1.2, 5.5, or 22 mmol/l glucose. Lower panel, 2DG uptake in bovine endothelial cells pre-exposed to 1.2, 5.5, or 22 mmol/l glucose. (Kaiser et al., 1993)
2.1.3 Abnormal Endothelial Cell Function
Early in the course of diabetes mellitus, before structural changes are evident, hyperglycemia causes abnormalities in blood flow and vascular permeability in the retina, glomerulus, and peripheral nerve vasa nervorum (Tooke et al., 1996; Kihara et al., 1991). The increase in blood flow and intracapillary pressure is thought to reflect a hyperglycemia-induced decrease in nitric oxide (NO) production on the efferent side of capillary beds and possibly an increased sensitivity to angiotensin II. Morover, the common pathophysiologic feature of diabetic microvascular disease is progressive narrowing and eventual occlusion of vascular lumina, which results in inadequate perfusion and function of the affected tissues.
Early hyperglycemia-induced microvascular hypertension and increased vascular permeability contribute to irreversible microvessel occlusion by three processes
• The first process is an abnormal leakage of periodic acid–Schiff (PAS)-positive, carbohydrate-containing plasma proteins, which are deposited in the capillary wall and can stimulate perivascular cells such as pericytes and mesangial cells to elaborate growth factors and extracellular matrix.
• The second process is extravasation of growth factors, such as transforming growth factor-β1 (TGF-β1), which directly stimulates overproduction of extracellular matrix components (Kopp et al., 1996) and can induce apoptosis in certain complication-relevant cell types.
• The third process is hypertension-induced stimulation of pathologic gene expression by endothelial cells and supporting cells, which include GLUT1, growth factors, growth factor receptors, extracellular matrix components, and adhesion molecules that can activate circulating leukocytes (Chien et al., 1998).
2.1.4 Microvascular Cell Loss and Vessel Occlusion
The progressive narrowing and occlusion of diabetic microvascular lumina are also accompanied by microvascular cell loss. In the retina, diabetes mellitus induces programmed cell death of Müller cells and ganglion cells (Hammes et al., 1995), pericytes, and endothelial cells (Mizutani et al., 1996). In the glomerulus, declining renal function is associated with widespread capillary occlusion and podocyte loss, but the mechanisms underlying glomerular cell loss are not yet known. In the vasa nervorum, degeneration of endothelial cells and pericytes occur (Giannini and Dyck, 1993), and these microvascular changes appear to precede the development of diabetic peripheral neuropathy (Giannini and Dyck, 1995).
2.1.5 Genetic Determinants of Susceptibility to Microvascular
Complications
Clinicians have long observed that different patients with similar duration and degree of hyperglycemia differ markedly in their susceptibility to microvascular complications. Such observations suggested that genetic differences exist that affected the pathways by which hyperglycemia damages microvascular cells.
A role for a genetic determinant of susceptibility to diabetic nephropathy is most strongly supported by familial clustering, with an estimated heritability of at least 40% (Wagenknecht et al., 2001a). In two studies of families in which two or more siblings had T1DM, the risk of nephropathy in a diabetic sibling was 83% or 72% if the probrand diabetic sibling had advanced diabetic nephropathy, but only 17% or 22% if the index patient did not have diabetic nephropathy (Fig. 2.2) (Seaquist et al., 1989; Quinn et al., 1996) or retinopathy.
Figure 2.2 Familial clustering of diabetic nephropathy. Prevalence of diabetic nephropathy in two
studies of diabetic siblings of probands with or without diabetic nephropathy. Adapted from (Seaquist et al., 1989; Quinn et al., 1996)
Numerous associations have been made between various genetic polymorphisms and the risk of diabetic complications. Examples include the 5′ insulin gene polymorphism (Raffel et al., 1991), the G2m23+ immunoglobulin allotype (Stewart et al., 1993), angiotensin-converting enzyme (ACE) insertion/deletion polymorphisms (Marre et al., 1994; Marre et al., 1997), HLA-DQB10201/0302 alleles (Agardh et al., 1996), polymorphisms of the aldose reductase gene (Oates and Mylari, 1999), and a polymorphic CCTTT(n) repeat of nitric oxide synthase 2A (NOS2A) (Warpeha et al., 1999). An individual-based genetic association study of subjects from the DCCT/EDIC found that multiple variations in superoxide dismutase 1 were significantly associated with persistent microalbuminuria and severe nephropathy (Al Kateb et al., 2008). In all of these studies, there was no indication that the polymorphic gene actually plays a functional role rather than simply being in linkage disequilibrium with the locus encoding the unidentified relevant genes.
As genes are identified that affect susceptibility to diabetic complications, a new area of research has emerged that will make it possible to identify genetic modifiers of the clinical manifestations of complications.
2.2 Pathophysiologic Features of Macrovascular Complications
Unlike microvascular disease, which occurs only in patients with diabetes mellitus, macrovascular disease resembles that in subjects without diabetes. However, subjects with diabetes have more rapidly progressive and extensive CVD than non-diabetic persons (Granger et al., 1993).The importance of hyperglycemia in the pathogenesis of diabetic macrovascular disease is suggested by studies that show how hyperglycemia is a continuous risk factor for macrovascular disease (Gerstein, 1999; Gall et al., 1995; Kuusisto et al., 1994; Salomaa et al., 1995; Laakso and Kuusisto, 1996).
However, data from the United Kingdom Prospective Diabetes Study (UKPDS) show for microvascular disease end points, that there is an almost 10-fold
increase in risk as HbA1c increases from 5.5% to 9.5%, whereas over the same HbA1c range, macrovascular risk increases only about two-fold (1998). Hyperglycemia is not nearly as central a determinant of diabetic macrovascular disease as it is in microvascular disease like insulin resistance. Insulin resistance is commonly associated with a pro-atherogenic dyslipidemia with a characteristic lipoprotein profile that includes a high level of very-low-density lipoprotein (VLDL) and low levels of high-density lipoprotein (HDL) and small, dense low-density lipoprotein (LDL). Both low HDL and small, dense LDL are independent risk factors for macrovascular disease. This profile arises as a direct result of increased net free fatty acid (FFA) release by insulin-resistant adipocytes (Fig. 2.3) (Ginsberg, 2000).
Figure 2.3 Schematic summary relating insulin resistance (IR) to the characteristic dyslipidemia of type
2 diabetes mellitus. IR at the adipocyte results in increased free fatty acid (FFA) release. Increased FFA flux stimulates secretion of very-low-density lipoprotein (VLDL), causing hypertriglyceridemia (TG). VLDL stimulates a reciprocal exchange of TG to cholesteryl ester (CE) from both high-density lipoprotein (HDL) and low-density lipoprotein (LDL), catalyzed by CE transfer protein (CETP). TG-enriched HDL dissociates from apolipoprotein (Apo) A-1, leaving less HDL for reverse cholesterol transport TG-enriched. LDL serves as a substrate for lipases that convert it to atherogenic small, dense LDL particles (SD LDL). (Ginsberg, 2000)
2.2.1 Impaired Collateral Blood Vessel Formation from Bone
Marrow Progenitor Cells
It has become apparent that diabetic complications result not only from damage to vascular cells but also from a defective repair process. Normally, in response to acute ischemia, new blood vessel growth rescues stunned areas of the heart or central nervous system, reducing morbidity and mortality. In response to chronic ischemia, collateral vessel development reduces the size and severity of subsequent infarction. In response to ischemia, circulating endothelial progenitor cells from the bone marrow promote the regeneration of blood vessels, acting in concert with cells and extracellular matrix at the site of injury. In experimental diabetes, however, these circulating endothelial progenitor cells are depleted and dysfunctional. As a result, diabetic animals have decreased vascular density after hind limb ischemia. Similarly, in human diabetes, endothelial progenitor cells are also depleted and dysfunctional (Nathan et al., 2005).
Diabetes is associated with poor outcomes after acute vascular occlusive events. This results in part from a failure to form adequate compensatory microvasculature in response to ischemia.
formation of the HIF-1α heterodimer with arylhydrocarbon receptor nuclear translocator (ARNT) and by impaired binding of the coactivator p300 to the HIF-1α– ARNT heterodimer. Hyperglycemia-induced covalent modification of p300 by the dicarbonyl metabolite methylglyoxal is responsible for this decreased association. In diabetic mouse models of impaired angiogenesis and wound healing, decreasing mitrochondrial formation of reactive oxygen species (ROS) normalizes both ischemia-induced new vessel formation and wound healing (Krolewski et al., 1996; Wagenknecht et al., 2001b).
2.3 Mechanisms of Hyperglycemia-Induced Damage
2.3.1 Increased Polyol Pathway Flux
Aldose reductase is a NADPH-dependent oxidoreductase that catalyzed the reducion of a wide variety of carbonyl compounds, including glucose. Aldose reductase has a low-affinity (high Michaelis constant [Km]) for glucose and at the
normal glucose concentrations, found in nondiabetic patients, the metabolism of glucose by this pathway constitutes a small percentage of total glucose utilization. In a hyperglycemic environment, however, increased intracellular glucose results in increased enzymatic conversion to the polyalcohol sorbitol, with concomitant decreases in NADPH. In the polyol pathway, sorbitol is oxidized to fructose by the enzyme sorbitol dehydrogenase, with nicotinamide adenine dinucleotide (NAD+) reduced to NADH. A number of mechanisms have been proposed to explain the potential detrimental effects of hyperglycemia-induced increases in polyol pathway flux. These include sorbitol-induced osmotic stress, decreased activity of the sodium-potassium adenosine triphosphatase (Na+,K+-ATPase) pump, increased cytosolic NADH/NAD+, and decreased cytosolic NADPH. More recently, it has been proposed that oxidation of sorbitol by NAD+ increases the cytosolic NADH/ NAD+ ratio, thereby inhibiting activity of the enzyme glyceraldehyde-3-phosphate dehydrogenase (GADPH) and increasing the concentrations of triose phosphate (Williamson et al., 1993). Elevated triose phosphate concentrations could increase the formation of both methylglyoxal, a precursor of AGEs, and (via α-glycerol-3-phosphate) diacylglycerol (DAG) thus activating PKC. It has also been proposed that reduction of glucose to sorbitol by NADPH consumes the cofactor NADPH. Because NADPH is required for regeneration of reduced glutathione, this could induce or exacerbate intracellular oxidative stress. Indeed, overexpression of human aldose reductase increased atherosclerosis in diabetic mice and reduces the expression of genes that regulate regeneration of glutathione (Vikramadithyan et al., 2005). In vivo studies of polyol pathway inhibition have yielded inconsistent results. In a 5-year study in dogs, aldose reductase inhibition prevented diabetic neuropathy but failed to prevent retinopathy or capillary basement membrane thickening in the retina, kidney, or muscle (Engerman et al., 1994). Several negative clinical trials have questioned the relevance of this mechanism in humans (Trial of sorbinil 1990). However, the positive effect of aldose reductase inhibition on diabetic neuropathy has been confirmed in humans in a rigorous multidose, placebo-controlled trial with the potent aldose reductase inhibitor, zenarestat (Greene et al., 1999).
2.3.2 Increased Intracellular Formation of Advanced Glycation
End Products
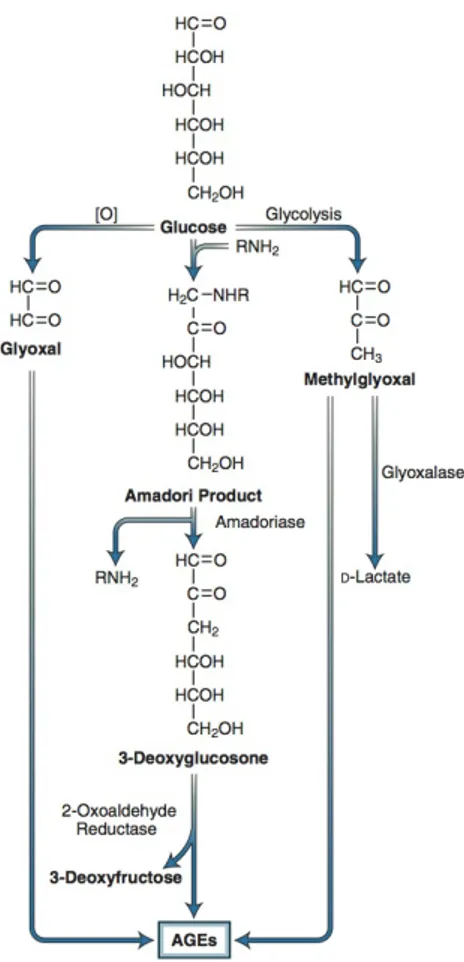
AGEs were originally thought to arise from non-enzymatic reactions between extracellular proteins and glucose. However, the rate of AGE formation from glucose is orders of magnitude slower than the rate of AGE formation from glucose-derived dicarbonyl precursors generated intracellularly, and it now seems likely that intracellular hyperglycemia is the primary initiating event in the formation of both intracellular and extracellular AGEs (Degenhardt et al., 1998). AGEs can arise from
intracellular auto-oxidation of glucose to glyoxal (Wells-Knecht et al., 1995), decomposition of the Amadori product to 3-deoxyglucosone, and fragmentation of glyceraldehyde-3-phosphate to methylglyoxal (Fig. 2.4) (Takahashi et al., 1993). Intracellular production of AGE precursors damages target cells by three general mechanisms:
• Intracellular proteins modified by AGEs have altered function.
• Extracellular matrix components modified by AGE precursors interact abnormally with other matrix components and with matrix receptors (integrins) on cells.
• Plasma proteins modified by AGE precursors bind to AGE receptors on cells such as macrophages, inducing receptor-mediated ROS production. This AGE-receptor ligation activates the pleiotropic transcription factor nuclear factor-κB (NF-κB), causing pathologic changes in gene expression (Oldfield et al., 2001)
Figure 2.4 Potential pathways leading to the formation of advanced glycation end products (AGEs) from
intracellular dicarbonyl precursors. Glyoxal arises from the auto-oxidation of glucose, 3-deoxyglucosone arises from decomposition of the Amadori product, and methylglyoxal arises from fragmentation of glyceraldehyde-3-phosphate. These reactive dicarbonyls react with amino groups of proteins to form AGEs. Methylglyoxal and glyoxal are detoxified by the glyoxalase system. (Adapted from Shinohara M,Thornalley PJ, Giardino I, et al. Overexpression of glyoxalase-I in bovine endothelial cells inhibits intracellular advanced glycation end-product formation and prevents hyperglycemia-induced increases in macromolecular endocytosis. J Clin Invest. 1998;101:1142-1147.)
2.3.3 Hyperglycemia-Induced Protein Kinase C Activation.
The PKC family comprises at least 11 isoforms, 9 of which are activated by the lipid second messenger, DAG. Intracellular hyperglycemia increases DAG content in cultured microvascular cells and in the retina and renal glomeruli of diabetic animals (Inoguchi et al., 1992; Craven et al., 1990; Shiba et al., 1993).
In early experimental diabetes, activation of PKC-β isoforms has been shown to mediate retinal and renal blood flow abnormalities (Ishii et al., 1996), perhaps by depressing NO production and increasing endothelin-1 activity.
In addition to affecting hyperglycemia-induced abnormalities of blood flow and permeability, activation of PKC contributes to increased microvascular matrix protein accumulation by inducing the expression of TGF-β1, fibronectin, and α1 type IV collagen in cultured mesangial cells (Pugliese et al., 1994; Studer et al., 1993) and in glomeruli of diabetic rats (Craven et al., 1994).
2.3.4 Increased Hexosamine Pathway Flux
A fourth hypothesis about how hyperglycemia causes diabetic complications (Sayeski and Kudlow, 1996a; Kolm-Litty et al., 1998; Daniels et al., 1993; McClain et al., 1992) states that glucose is shunted into the hexosamine pathway. In this pathway, fructose-6-phosphate is diverted from glycolysis to provide substrate for the rate-limiting enzyme of this pathway, glutamine:fructose 6-phosphate amidotransferase (GFAT). GFAT converts fructose phosphate to glucosamine 6-phosphate, which is then converted to UDP-N-Acetylglucosamine. Specific O-GlcNAc transferases use this for post-translational modification of specific serine and threonine residues on cytoplasmic and nuclear proteins by O-GlcNAc. Inhibition of GFAT blocks hyperglycemia-induced increases in the transcription of both TGF-α and TGF-β1 (Sayeski and Kudlow, 1996b).
Although it is not entirely clear how increased flux through the hexosamine pathway mediates hyperglycemia-induced increases in the gene transcription of key genes such as TGF-α, TGF-β1, and PAI-1, it has been shown that
hyperglycemia causes a 4-fold increase in O-GlcNAcylation of the transcription factor Sp1, which mediates hyperglycemia-induced activation of the PAI-1 promoter in vascular smooth muscle cells (Chen et al., 1998) and of TGF-β1 and PAI-1 in arterial endothelial cells (Du et al., 2000a).
Of particular relevance to diabetic vascular complications is the inhibition of eNOS activity in arterial endothelial cells by O-GlcNAcylation at the Akt activation site of eNOS protein (Yamagishi et al., 2001; Hart, 1997; Musicki et al., 2005). Hyperglycemia also increases GFAT activity in aortic smooth muscle cells, which increases O-GlcNAc-modification of several proteins in these cells (Akimoto et al., 2001).
Finally, diabetic hyperglycemia impairs cardiomyocyte calcium cycling through increased nuclear O-GlcNAcylation, which reduced sarcoplasmic reticulum Ca(2+)-ATPase 2a (SERCA2a) mRNA and protein expression, and decreased SERCA2a promoter activity (Clark et al., 2003). In isolated perfused rat hearts, increased GlcNAcylation inhibited phenylephrine-induced inotropy by impairing capacitative Ca2+ entry (CCE), the influx of Ca2+ through plasma membrane channels activated in response to depletion of endoplasmic or sarcoplasmic reticulum Ca2+ stores (Pang et al., 2004).