Continuous Supercritical Emulsion
Extraction: process
characterization and optimization
of operative conditions to produce
biopolymer microspheres
Nunzia Falco
Unione Europea UNIVERSITÀ DEGLI STUDI DI SALERNO
Department of Industrial Engineering
Ph.D. Course in Chemical Engineering
(X Cycle-New Series)
Continuous Supercritical Emulsion Extraction:
process characterization and optimization of
operative conditions to produce biopolymer
microspheres
Supervisor
Ph.D. student
Prof. Ernesto Reverchon
Ing. Nunzia Falco
Scientific Referees
Dr. Giovanna Della Porta
Prof. Erdogan Kiran
Ph.D. Course Coordinator
Acknowledgements
I would like to thank here all the kind people around me who made this thesis possible with their help and support.
First of all, I am extremely grateful to my supervisor, Prof. Ernesto Reverchon, for giving me the opportunity to be part of his “Supercritical Fluid” team at the University of Salerno and for providing a stimulating and fun environment for me in which to learn and grow as a student and a researcher. His enthusiasm and passion for research, guidance and support, understanding and patience, added considerably to my experience. I appreciated his unsurpassed knowledge and skill in many areas, and his assistance at all levels of the research project. Throughout my PhD work, he provided encouragement, good teaching and wise advice on how to optimize my work.
I would like to thank the other members of my committee, Dr. Giovanna Della Porta and Prof. Erdogan Kiran. Thanks to Giovanna, since this PhD project profited a lot from our several interesting and fruitful discussions. I received from her lots of good ideas and constructive advice during the whole course of my PhD.
My further acknowledgement to Giovanna and Prof. Reverchon, who promoted the collaboration with Prof. Kiran at Virginia Tech University.
I am grateful to Prof. Kiran for his availability to take part in my scientific committee, for kindly giving me the opportunity to join his research group in Blacksburg for several months and for taking his precious time out from his busy schedule to help me every time I needed. His supervision with his expertise and valuable advice were precious for me. It was a great pleasure for me to work with him. I am confident that this experience was helpful for my personal and professional growth. I would also thank his family for their hospitality during my stay at Virginia Tech University, who have been able to let me feel “at home” nevertheless the distance from my family.
I wish also to thank Dr. J. C. Hassler for his help with the electronics and data acquisition algorithms for the experimental system that I used at Virginia Tech.
My sincere thanks to the “Supercritical Fluids” group at the University of Salerno, for providing me a supportive atmosphere and for friendly discussions, exchanges of knowledge and skills, which helped to enrich my experience. So, thanks to all my Lab-mates, Roberta Campardelli, Sara Liparoti, Enza Torino, Renata Adami, Iolanda De Marco, Stefano Cardea and Paola Pisanti. My particular appreciation also goes out to Mariarosa Scognamiglio, always ready to help me with her kind technical assistance every time I was in trouble throughout these years.
Thanks also to my PhD-mates; particularly, Mariarenata, Igino and Maria Letizia for sharing with me this PhD experience and significant moments.
Many thanks to my friends; above all, my special friends Mena, Francesco and Nicla for the friendship, company, emotional support, entertainment and caring they provided me. In this context, I wish also to thank my international friends; particularly, Heather for being so kindly, helpful in my everyday life in Blacksburg and such a nice friend. I wish that we can meet again very soon.
It is difficult to express my infinite gratitude to my parents and my sister; they always believed in me providing me their unequivocal ever-present support in all its forms, encouragement and motivation in many occasions. I doubt that I will ever be able to convey my appreciation fully, but I owe them my eternal gratitude. Their presence in my life helped me to grow into a better person and gave me self-confidence. To my family I dedicate this thesis.
Last, but by no means least, I am heartily thankful to my dear Cristian for helping me get through the difficult moments, supporting me and my own ideas, for his editing assistance, careful dedication, love, great patience with me and my requests at all time, as always, for which my expression of thanks likewise does not suffice.
Papers produced during this
work
International journals:
1) Della Porta G., Falco N., Reverchon E.
“NSAID Drugs Release from Injectable Microspheres Produced by Supercritical Fluid Emulsion Extraction”, Journal of Pharmaceutical Sciences, 99(3), 2010, pp. 1484-1499.
2) Della Porta G., Campardelli R., Falco N., Reverchon E.
“PLGA Microdevices for Retinoids Sustained Release Produced by Supercritical Emulsion Extraction: Continuous Versus Batch Operation Layouts”, Journal of Pharmaceutical Sciences, 100(10), 2011, pp. 4357-4367.
3) Della Porta G., Falco N., Reverchon E.
“Continuous Supercritical Emulsions Extraction: A New Technology for Biopolymer Microparticles Production”, Biotechnology and Bioengineering, 108(3), 2011, pp. 676-686.
4) Falco N. and Kiran E.
“Volumetric Properties of Ethyl Acetate + Carbon Dioxide Binary Fluid Mixtures at High Pressures”, The Journal of Supercritical Fluids, 61, 2012, pp. 9-24.
5) Falco N., Reverchon E., Della Porta G.
“Continuous Supercritical Emulsions Extraction: Packed Tower Characterization and Application to PLGA+Insulin Microspheres Production”, submitted to Industrial & Engineering Chemistry Research, 2012.
6) Della Porta G., Falco N., Giordano E., Reverchon E.
“PLGA/Insulin Microdevices Produced by Continuous Supercritical Emulsions Extraction Technology as Active Support for Cardiomioblast Proliferation”, submitted to Acta Biomaterialia, 2012.
7) Falco N., Reverchon E., Della Porta G.
“PLGA/Hydrocortisone Microspheres Produced by Continuous Supercritical Emulsions Extraction”, submitted to International Journal of Pharmaceutics, 2012.
Proceedings of International Conferences:
1) Falco N., Reverchon E., Della Porta G.
“Continuous Supercritical Emulsions Extraction: An Innovative Process Layout for Microcarriers Production”, Proceedings of the 9th Conference on Supercritical Fluids and Their Applications, Sorrento (Italy), 5-8 September 2010.
2) Falco N., Reverchon E., Della Porta G.
“Continuous Supercritical Fluid Emulsion Extraction: a Low Impact Route for Biopolymer Microspheres Production”, Proceedings of 2011 AIChE Spring Meeting & 7th Global Congress on Process Safety, Chicago (Illinois) 13-17 March 2011.
3) Della Porta G., Falco N., Reverchon E.
“Continuous Supercritical Emulsions Extraction: Capabilities and Performances of an Innovative Process for Biopolymer Microspheres Production”, Proceedings of the 13th European Meeting on Supercritical Fluids, The Hague (Netherlands), 9-12 October 2011.
CONTENTS
CONTENTS ... I INDEX OF FIGURES ... V INDEX OF TABLES ... XIII ABSTRACT ... XV INTRODUCTION ... XIX
CHAPTER I
STATE OF THE ART... 1
I.1 Microencapsulation technology in controlled release formulations ... 1
I.2 Emulsions ... 6
I.2.1 The theory of emulsification ... 8
1.2.2 Physical instability of emulsions ... 9
I.3 Microencapsulation techniques from emulsions... 11
I.3.1 Conventional techniques of microencapsulation ... 12
I.3.2 Supercritical Emulsion Extraction (SEE) ... 15
I.4 Factors influencing the properties of microspheres ... 21
I.4.1 Choice of materials ... 22
I.4.1.1 Dispersed phase ... 22
I.4.1.2 Continuous phase ... 25
CHAPTER II AIM OF THE WORK ... 27
CHAPTER III CONTINUOUS SUPERCRITICAL EMULSION EXTRACTION (SEE-C) ... 29
III.1 SEE-C apparatus description ... 29
III.2 SEE-C process description ... 32
III.3 SEE-C process mechanism ... 33
CHAPTER IV MATERIALS AND METHODS ... 37
IV.1 Materials ... 37
IV.1.1 Biopolymer: Poly (lactic-co-glycolic acid) (PLGA) ... 37
IV.1.2 Pharmaceutical compounds ... 39
IV.1.3 Surfactant: Polyvinyl alcohol (PVA) ... 41
IV.1.5 Other materials ... 42
IV.2 Methods ... 43
IV.2.1 Emulsion Preparation ... 43
IV.2.2 Droplets and microspheres morphology ... 45
IV.2.3 Droplets and microspheres size and distribution ... 46
IV.2.4 Solvent residue analysis ... 46
IV.2.5 Solid state characterization ... 46
IV.2.6 Active principle loading ... 47
IV.2.7 Active principle release ... 48
IV.2.8 Microspheres degradation ... 49
CHAPTER V PROCESS OPTIMIZATION ... 51
V.1 Volumetric properties of ethyl acetate+carbon dioxide binary mixtures at high pressures ... 51
V.1.1 System description ... 52
V.1.2 Operational procedures ... 54
V.1.3 Carbon dioxide... 58
V.1.3.1 Density ... 58
V.1.3.2 Isothermal compressibility, isobaric expansivity, and isochoric pressure coefficients ... 61
V.1.4 Ethyl acetate ... 63
V.1.4.1 Density ... 63
V.1.4.2 Isothermal compressibility, isobaric expansivity, and isochoric pressure coefficients ... 67
V.1.5 Ethyl acetate+carbon dioxide mixtures ... 70
V.1.5.1 Density ... 70
V.1.5.2 Isothermal compressibility, isobaric expansivity, and isochoric pressure coefficients ... 80
V.1.6 Excess volume ... 86
V.2 SEE-C operating parameters ... 90
V.3 Flooding calculations ... 90
CHAPTER VI PLGA MICROPARTICLES PRODUCTION BY SEE-C TECHNOLOGY .... 99
VI.1 Droplets and microparticles size and morphology ... 99
VI.2 Comparison between SEE-C and solvent evaporation (SE) ... 105
VI.3 Microparticles solid state analyses ... 108
VI.4 PLGA microparticles degradation: morphological study ... 110
CHAPTER VII NSAID/PLGA INJECTABLE MICROSPHERES: CONTINUOUS VERSUS BATCH OPERATION LAYOUTS ... 113
VII.1 Microspheres produced by SEE-C: particle size control ... 113
VII.2 Comparison between SEE, SEE-C and SE ... 117
VII.2.1 PSD and morphology ... 117
VII.2.2 Drug loading ... 121
VII.2.3 Solid state characterization ... 122
CHAPTER VIII HYDROCORTISONE/PLGA MICROSPHERES PRODUCTION AND DRUG
RELEASE STUDY ... 127
VIII.1 Particle size and morphology ... 128
VIII.1.1 HA/PLGA microspheres from w1-o-w2 emulsion (w1: EtOH) .... 128
VIII.1.2 HA/PLGA microspheres from w1-o-w2 emulsion (w1: DMSO) .. 130
VIII.1.3 HA/PLGA microspheres from s-o-w suspension emulsion ... 132
VIII.2 Solid state characterization ... 134
VIII.3 Hydrocortisone Acetate encapsulation efficiency ... 135
VIII.4 In vitro Hydrocortisone Acetate release ... 137
CHAPTER IX PREPARATION AND CHARACTERIZATION OF INSULIN-LOADED PLGA MICRODEVICES ... 141
IX.1 Size tailoring and morphology ... 142
IX.2 Insulin encapsulation efficiency ... 146
IX.3 In vitro Insulin release study ... 147
CHAPTER X CONCLUSIONS AND FUTURE DEVELOPMENTS ... 151
INDEX OF FIGURES
Figure I.1 Schematic representation of microencapsulation applications. ... 2 Figure I.2(a-b) Comparison between (a) traditional dosing and (b)
controlled delivery dosing (MEC = minimum effective concentration, MTC = minimum toxic concentration). ... 4
Figure I.3(a-b) Classification of controlled release systems: (a) microsphere
and (b) microcapsule. ... 5
Figure I.4 Schematic representation of oil-in-water (o-w), water-in-oil (w-o)
and water-in-oil-in-water (w-o-w) emulsions. ... 7
Figure I.5 Schematization of surfactants. ... 7 Figure I.6 Schematization of the adsorption of surfactant at the interface
between an aqueous phase and an oil phase. ... 8
Figure I.7 Films of surfactants at the water/oil interface of w-o and o-w
emulsions. ... 9
Figure I.8 Schematic representation of the break-down processes in
emulsions. ... 10
Figure I.9 Schematic diagram showing the preparation of microparticles by
o-w single emulsion solvent evaporation/extraction method. ... 13
Figure I.10 Schematic diagram showing the preparation of microparticles
by the w-o-w double emulsion-solvent evaporation method. ... 14
Figure I.11 Pressure-Temperature diagram of pure CO2. ... 16
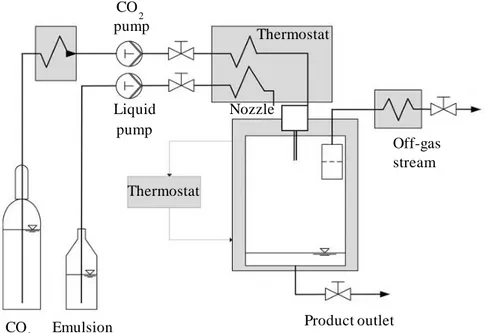
Figure I.12 Schematic representation of the SEE experimental system
proposed by Chattopadhyay et al. ... 18
Figure I.13 Schematic representation of the SEE apparatus proposed by
Della Porta and Reverchon. ... 19
Figure I.14 Schematic representation of the SEE setup proposed by Mazzotti
and co-workers for solvent extraction experiments. ... 20
Figure I.15 Scheme of the factors influencing the properties of
microspheres. ... 22
Figure III.1 Continuous tower diagram: C, CO2 supply; E, emulsion supply; PG_1 and PG_2, pressure gauges; SC_P, diaphragm pump used for high pressure SC-CO2; L_P, piston pump used for the emulsion; TC1…TC8, thermocouples; S, separator; R, rotameter; E_1 and E_2, heat exchangers; V_1…V_8, valves. ... 30
Figure III.2 Schematic representation of SEE-C process. ... 31 Figure III.3 Laboratory SEE-C apparatus located at the University of
Salerno (Italy)... 32
Figure III.4 Schematic representation of the possible mass transfer
pathways of the oily phase during the SEE process. Two parallel pathways: (A) diffusion of the organic solvent into water followed by subsequent supercritical extraction of the solvent from the aqueous phase; (B) direct supercritical extraction upon contact between SC-CO2 and the organic phase into the droplet. ... 35
Figure IV.1 Half life of various lactic acid and glycolic acid as copolymers
implanted in rat tissue. ... 38
Figure IV.2 Chemical structure of PLGA. ... 39 Figure IV.3 Chemical structures of Piroxicam and Diclofenac Sodium. .... 39 Figure IV.4 Chemical structure of Hydrocortisone Acetate. ... 40 Figure IV.5 Chemical structure of Insulin. ... 41 Figure IV.6 Chemical structure of PVA. ... 42 Figure V.1 Schematic diagram of the experimental system: SL, solvent line;
PG, pressure gauge; PGN, pressure generator; LP_1 and LP_2, liquid pumps; LVDT, linear variable differential transformer; VC, view cell; VVP, variable-volume part of the view cell; SW, sapphire window; SP, sample port; PS, pressure sensor; L, laser; PRU, position readout unit; PI, pressure indicator; TI, temperature indicator; TC, thermocouple; DAQ, computerized control and data acquisition units; TLI, transmitted light intensity; TV, transfer vessel; B, balance; V_1...V_12, valves. ... 53
Figure V.2 Experimental system used, located at Virginia Polytechnic
Institute and State University (USA). ... 54
Figure V.3(a-d) Real-time recording of pressure (a), piston position (b), cell
volume (c) during a up-and-down pressure scan of CO2 at 340 K, and the resulting pressure-density plot along with a polynomial fit (d). ... 56
Figure V.4(a-d) Real-time recording of pressure (a), piston position (b), cell
volume (c) during a up-and-down pressure scan of the binary fluid mixture (ethyl acetate+CO2) containing 67.3% by mass CO2 at 313 K, and the resulting pressure-density plot along with a polynomial fit (d). ... 57
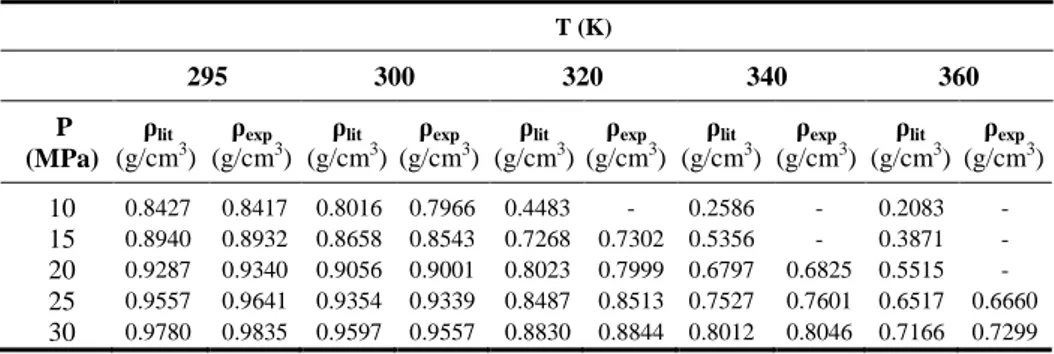
Figure V.5 Variation of density with pressure of CO2 at different temperatures. The filled symbols are the present experimental data at the indicated temperatures, the black solid curves are the polynomial fits to the data, and the open symbols are values from the NIST data base at the corresponding temperatures. ... 59
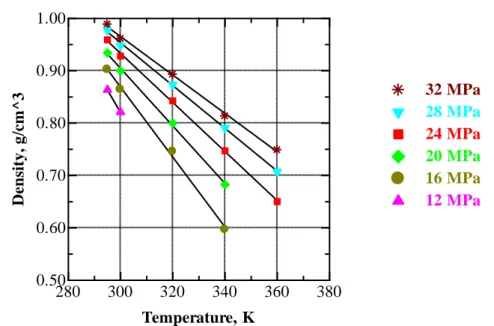
Figure V.6 Temperature dependence of density of CO2 at selected pressures.
... 61 Figure V.7 Isothermal compressibility kT of CO2 at selected temperatures. 62
Figure V.8 Isobaric expansivity αP of CO2 at selected pressures. ... 62
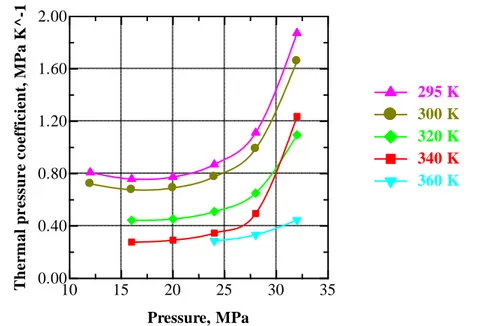
Figure V.9 Thermal pressure coefficient γρ of CO2 at selected temperatures.
Figure V.10 Pressure dependence of density of EA at selected temperatures.
The solid lines are the linear fits to the data. ... 64
Figure V.11 Variation of density of EA with temperature at selected
pressures. ... 65
Figure V.12 Comparison of density data of EA (filled symbols) at
atmospheric pressure at different temperatures with literature values (open symbols) from Vargaftik (1975). ... 66
Figure V.13 Variation of isothermal compressibility kT of EA at selected temperatures. ... 67
Figure V.14 Isobaric expansivity αP of EA at selected pressures. ... 68
Figure V.15 Thermal pressure coefficient γρ of EA at selected temperatures.
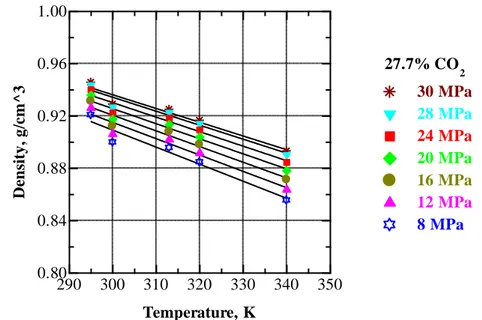
... 69 Figure V.16 Pressure dependence of density of EA+CO2 mixture with 27.7 wt % CO2 at 295, 300, 313, 320 and 340 K. ... 70
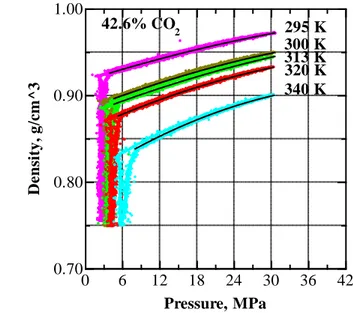
Figure V.17 Pressure dependence of density of EA+CO2 mixture with 42.6 wt % CO2 at 295, 300, 313, 320 and 340 K . ... 71
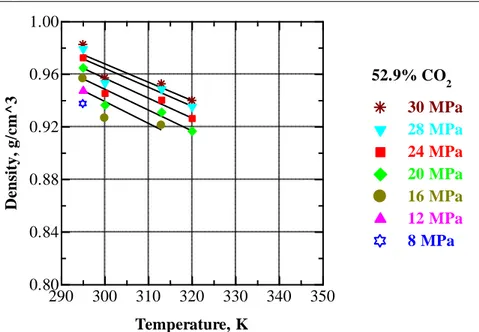
Figure V.18 Pressure dependence of density of EA+CO2 mixture with 52.9 wt % CO2 at 295, 300, 313, 320 and 340 K. ... 71
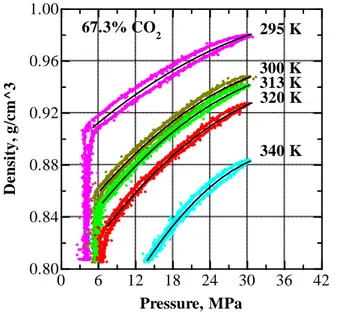
Figure V.19 Pressure dependence of density of EA+CO2 mixture with 67.3 wt % CO2 at 295, 300, 313, 320 and 340 K. ... 72
Figure V.20 Pressure dependence of density of EA+CO2 mixtures at 295 K (compositions are in mass percent). At 15 MPa, order of curves from higher to lower density: 52.9; 42.6; 67.3; 27.7 % CO2; pure EA; pure CO2. ... 74
Figure V.21 Pressure dependence of density of EA+CO2 mixtures at 300 K (compositions in mass percent). At 15 MPa, order of curves from higher to lower density: 52.9; 42.6; 27.7; 67.3 % CO2; pure CO2. ... 74
Figure V.22 Pressure dependence of density of EA+CO2 mixtures at 320 K (compositions in mass percent). At 20 MPa, order of curves from higher to lower density: 52.9; 42.6; 27.7; 67.3 % CO2; pure EA; pure CO2. ... 75
Figure V.23 Pressure dependence of density of EA+CO2 mixtures at 340 K (compositions in mass percent). At 25 MPa, order of curves from higher to lower density: 42.6; 27.7 % CO2; pure EA; 67.3 % CO2; pure CO2. ... 75
Figure V.24 Comparisons of density of EA+CO2 mixtures at 313 K with literature data from Smith et al., (1998) (open symbols). At 15 MPa, order of curves from higher to lower density: 42.6; 27.7; 67.3 % CO2. ... 76
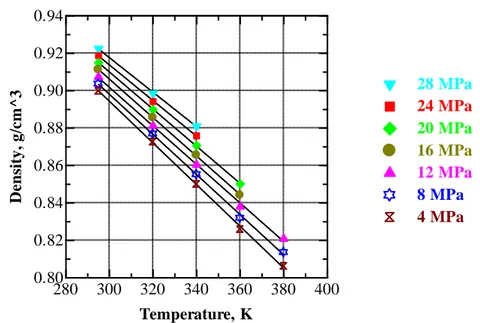
Figure V.25 Temperature dependence of the density of EA+CO2 mixture containing 27.7 wt % CO2 at selected pressures. ... 77
Figure V.26 Temperature dependence of the density of EA+CO2 mixture containing 42.6 wt % CO2 at selected pressures. ... 77
Figure V.27 Temperature dependence of the density of EA+CO2 mixture containing 52.9 wt % CO2 at selected pressures. ... 78
Figure V.28 Temperature dependence of the density of EA+CO2 mixture containing 67.3 wt % CO2 at selected pressures. ... 78
Figure V.29 Pressure dependence of the isothermal compressibility of
EA+CO2 mixture containing 27.7 wt % CO2 at selected temperatures. ... 80
Figure V.30 Temperature dependence of the isobaric expansivity of EA+CO2 mixture containing 27.7 wt % CO2 at selected pressures. ... 81
Figure V.31 Pressure dependence of the thermal pressure coefficient of EA+CO2 mixture containing 27.7 wt % CO2 at selected temperatures. ... 81
Figure V.32(a-c) Pressure dependence of the isothermal compressibility of EA+CO2 mixtures containing (a) 42.6, (b) 52.9, (c) 67.3 wt % CO2 at selected temperatures. ... 82
Figure V.33(a-c) Temperature dependence of the isobaric expansivity of EA+CO2 mixtures containing (a) 42.6, (b) 52.9, (c) 67.3 wt % CO2 at selected pressures. ... 83
Figure V.34(a-c) Pressure dependence of the thermal pressure coefficient of EA+CO2 mixtures containing (a) 42.6, (b) 52.9, (c) 67.3 wt % CO2 at selected temperatures. ... 84
Figure V.35(a-c) Compositional dependence of the (a) isothermal compressibility, (b) isobaric expansivity and (c) thermal pressure coefficient of pure CO2, pure ethyl acetate and EA+CO2 mixtures containing 27.7, 42.6, 52.9, 67.3 wt % CO2 at selected temperatures. ... 85
Figure V.36 Excess volume in EA+CO2 mixtures at 295 K. ... 87
Figure V.37 Excess volume in EA+CO2 mixtures at 320 K. ... 87
Figure V.38 Excess volume in EA+CO2 mixtures at 340 K. ... 88
Figure V.39 Excess volume in EA+CO2 mixtures at 16 MPa. ... 88
Figure V.40 Excess volume in EA+CO2 mixtures at 20 MPa. ... 89
Figure V.41 Excess volume in EA+CO2 mixtures at 28 MPa. ... 89
Figure V.42 Effect of the gas density upon flooding for different L/G ratios (dashed line: boundary line between proper process conditions and flooding). ... 91
Figure V.43 Flooding velocities (Gf) as a function of the liquid/gas ratio (L/G) for different CO2 densities: (■) P = 100 bar, T = 57°C, ρ = 0.31 g/cm 3 and (▼) P = 100 bar, T = 44°C, ρ = 0.52 g/cm3. ... 92
Figure V.44 “Generalized Pressure Drop Correlation” (GDPC) (L = liquid mass flow rate, Kg/s; G = gas mass flow rate, Kg/s; ρl = density of the absorbing liquid (Kg/m3); ρg = density of the gas stream (Kg/m 3 ); G' = mass flow rate of gas per unit cross sectional area of column, Kg/m2·s; gc = gravitational constant, m/s2; F = packing factor, m-1; ϕ = ratio of specific gravity of the scrubbing liquid to that of water; μl = viscosity the of liquid, N·s/m2). ... 93
Figure V.45 “Brunner correlation” (uG = superficial velocity of gas phase, m/s; uL = superficial velocity of liquid phase, m/s; ρG = density of the supercritical phase, Kg/m3; ρL = density of the liquid phase, Kg/m 3; ε = fractional void volume of the packing; g = gravitational acceleration, m/s2; dH = hydraulic diameter, m). ... 94
Figure V.46 “Random packing correlation” (RPC) (L = liquid flow rates,
lb/h·ft2; G = gas flow rate, lb/h·ft2; aP/ε = packing factor ft -1
, µL = liquid viscosity, cP; ρG = density of the supercritical phase, lb/ft
3; ρ
L = density of the liquid phase, lb/ft3; g = gravitational acceleration, ft/h2). ... 95
Figure VI.1(a-b) Optical microscope images of two different emulsions: (a)
single o-w and (b) double w-o-w emulsions. ... 101
Figure VI.2(a-c) FE-SEM images of PLGA microparticles obtained using
SEE-C by processing single emulsions containing PLGA in concentrations of (a) 5% w/w, (b) 7.5% w/w and (c) 10% w/w. Operating conditions: 80 bar and 38°C, L/G ratio 0.1. ... 102
Figure VI.3 PSDs of PLGA particles produced from single (o-w) emulsions
containing 5% and 7.5% w/w of PLGA in the oily phase. The DSDs of the two emulsions processed by SEE-C are also reported (dashed curves), for comparison. ... 103
Figure VI.4 PSDs of PLGA particles produced from single and double
emulsions containing 10% w/w of PLGA in the oily phase. The DSDs of the two emulsions processed by SEE-C are also reported (dashed curves), for comparison. ... 104
Figure VI.5 FE-SEM image of PLGA broken microparticles obtained
processing an o-w emulsion (20:80) containing PLGA in concentration of 20% w/w in the oily phase. Operating conditions: 80 bar and 38°C, L/G ratio 0.1. ... 105
Figure VI.6 Particle Size Distributions (PSDs) of microspheres produced by
SEE-C and SE processes using a w-o-w emulsion containing a PLGA content in the oily phase of 10 % w/w. The Droplets Size Distribution (DSD) of the emulsion processed by the two technologies is also reported, for comparison. ... 106
Figure VI.7(a-b) FE-SEM images of PLGA microspheres produced by
SEE-C (left side) and by SE (right side) from a double emulsion containing a PLGA amount of 10% w/w. Operating conditions: 80 bar and 38°C, L/G ratio 0.1. ... 107
Figure VI.8 DSC traces of unprocessed and PLGA microparticles produced
by SEE-C. ... 109
Figure VI.9 X-ray profiles of unprocessed and PLGA microparticles
produced by SEE-C. ... 110
Figure VI.10(a-c) FE-SEM images (Mag = 50.00 KX) related to a
morphological study of PLGA microparticles degradation in water after (a) 14, (b) 28 and (c) 35 days, respectively. The particles have a diameter of almost 3 µm and were produced by SEE-C using a single (left side) and double w-o-w emulsions (right side). ... 111
Figure VII.1(a-d) Cumulative size distribution curves describing the
droplets in (a) single and (b) double emulsions obtained varying the PLGA concentration in the oily phase, and the related microspheres produced by SEE-C from (c) single and (d) double emulsions. ... 115
Figure VII.2(a-b) Cumulative size distributions of the droplets and of the
relative microspheres obtained from (a) single (o-w) emulsion containing 5% w/w of PLGA and 10% w/w of PX, and (b) double (w-o-w) emulsion containing 5% w/w of PLGA and 10% w/w of DS. ... 116
Figure VII.3(a-b) FE-SEM images of (a) PX/PLGA microspheres obtained
by SEE-C from a single (o-w) emulsion and (b) DS/PLGA microspheres obtained from a double (w-o-w) emulsion, both containing PLGA in concentration of 5% w/w. Operating conditions: 80 bar and 38°C, L/G ratio 0.1. ... 117
Figure VII.4(a-b) Comparison between PDSs of (a) PX/PLGA and (b)
DS/PLGA microspheres obtained by SEE-C, SEE and SE processes starting from the same single or double emulsion with a PLGA content in the oily phase of 5 % w/w. ... 119
Figure VII.5(a-b) FE-SEM images of DS/PLGA microspheres produced by
SEE-C (left side) and by SE (right side) from a double emulsion containing a PLGA amount of 2.5% w/w (DS is 10% w/w of PLGA). Operating conditions: 80 bar and 38°C, L/G ratio 0.1. ... 120
Figure VII.6 Comparison of X-ray patterns of untreated PX and PLGA
compared with PX/PLGA microspheres obtained by supercritical emulsion extraction (SEE or SEE-C) and SE technology. ... 123
Figure VII.7 Comparison of X-ray patterns of untreated DS and PLGA
compared with DS/PLGA microspheres obtained by supercritical emulsion extraction (SEE or SEE-C) and SE technology. ... 123
Figure VII.8(a-b) In vitro release profiles of (a) PX from PLGA
microspheres with a mean diameter of 3.1 µm and PX theoretical loading of 10% w/w, and of (b) DS from PLGA microspheres with a mean diameter of 1.0 µm and DS theoretical loading of 10% w/w. ... 125
Figure VIII.1 Optical microscope image of the droplets and FE-SEM image
of the microspheres produced by SEE-C process from a w1-o-w2 emulsion (w1: EtOH) containing 2.3% w/w of HA and 5% w/w of PLGA. ... 129
Figure VIII.2 Cumulative size distributions of the droplets and of the
corresponding microspheres obtained by SEE-C process from w1-o-w2 emulsions prepared using EtOH as solvent in the internal water phase and varying the PLGA content in the oily phase from 5% to 10% w/w. The drug loading was fixed at 4.1% w/w. ... 130
Figure VIII.3 Optical microscope image of the droplets and FE-SEM image
of the microspheres produced by SEE-C process from a w1-o-w2 emulsion (w1: DMSO) prepared with 9% w/w of HA and 10% w/w of PLGA. ... 131
Figure VIII.4 FE-SEM image of HA/PLGA microspheres prepared by
SEE-C from a s-o-w suspension emulsion containing 4.5% w/w of HA and 10% w/w of PLGA. ... 132
Figure VIII.5 Optical microscope image of the droplets and FE-SEM image
emulsion loaded with 4.5% w/w of micronized HA and 10% w/w of PLGA.
... 134 Figure VIII.6 Example of DSC traces of untreated PLGA, HA and SEE-C
microspheres prepared from a s-o-w suspension emulsion containing HA loading of 9% w/w and PLGA content of 10 % w/w. ... 135
Figure VIII.7 Comparison between the release profiles of HA from PLGA
microspheres (produced from w1-o-w2 emulsions, w1: DMSO) with the same mean diameter (3 µm) and charged with different effective HA loadings of 1.4% and 3.3% w/w. ... 138
Figure VIII.8 Comparison between the release profiles of HA from PLGA
microspheres (produced from w1-o-w2 emulsion with w1: EtOH) with different mean sizes of 1 µm and 2 µm and charged with the same effective HA loading of 2.1% w/w. ... 139
Figure VIII.9 Comparison between the release profiles of HA from PLGA
microspheres with the same mean sizes of 3 µm and produced from s-o-w suspension emulsions using micronized and not micronized HA. ... 140
Figure IX.1(a-c) Optical microscope images of the droplets and FE-SEM
images of the microspheres produced from w1-o-w2 emulsions prepared at different stirring rates and treated by SEE-C. ... 143
Figure IX.2(a-c). Size distribution curves of the droplets and of the relative
microspheres obtained from w1-o-w2 emulsions prepared at different stirring rates and treated by SEE-C. ... 144
Figure IX.3 PSDs of Insulin-loaded PLGA microspheres produced from
SC-CO2 extraction of w1-o-w2 emulsions, decreasing the stirring rate from 2800 to 1000 rpm. ... 145
Figure IX.4(a-b) Comparison between the release profiles of Insulin from
microspheres suspended in (a) PBS and (b) DMEM, with different mean diameters (MD) and charged with the same loading of 0.3% w/w. ... 149
Figure IX.5(a-b) Comparison between the release profiles of Insulin from
microspheres suspended in (a) PBS and (b) DMEM, with different loadings and the same mean size of 3 µm. ... 150
INDEX OF TABLES
Table IV.1 PLGA-based microparticles available in the market. ... 37 Table IV.2 Emulsions composition and conditions used. ... 44 Table V.1 Density (g/cm3)-Pressure (MPa) and Density-Temperature (K) correlations for CO2. ... 60
Table V.2 Comparison of CO2 densities with literature values from NIST data base. ... 60
Table V.3 Density (g/cm3)-Pressure (MPa) and Density-Temperature (K) correlations for ethyl acetate. ... 65
Table V.4 Comparison of EA density values at 20 MPa with literature
(Gardas et al., 2007). ... 67
Table V.5 Density (g/cm3)-Pressure (MPa) correlations for EA+CO2 mixtures. ... 73
Table V.6 Density (g/cm3)-Temperature (K) correlations for EA+CO2 mixtures. ... 79
Table V.7 Evaluation of the Gf conditions varying the L/G ratio between 0.1 and 0.4 at fixed T = 38°C and P = 80 bar (ρ = 0.31 g/cm3
) using the correlations previously discussed. ... 96
Table V.8 Evaluation of the flooding conditions varying the density at fixed
L/G = 0.1, using the correlations previously discussed. ... 96
Table V.9 Liquid and SC-CO2 flow rates used at different values of L/G. .. 97
Table VI.1 Laser scattering size distribution data of droplets (DSD) and of
microparticles (PSD) produced at different PLGA concentrations in the oily phase using SEE-C of single (o-w) and double (w-o-w) emulsions. Legend: MS = mean size; SD = standard deviation; CV = coefficient of variation; SF = shrinking factor. ... 100
Table VI.2 Laser scattering size distribution data of droplets (DSD) and of
microspheres (PSD) produced using SEE-C and SE processes from a w-o-w emulsion containing 10% w/w of PLGA. Legend: MS = mean size; SD = standard deviation; CV = coefficient of variation; SF = shrinking factor. 107
Table VII.1 o-w emulsion: laser scattering size distribution data of droplets
(DSD) and of microspheres (PSD) containing different PLGA concentrations in the oily phase and produced using standard SEE layout, SEE-C, and SE
process. Legend: MS = mean size; SD = standard deviation; CV = coefficient of variation. ... 118
Table VII.2 w-o-w emulsion: laser scattering size distribution data of
droplets (DSD) and of microspheres (PSD) containing different PLGA concentrations in the oily phase and produced using standard SEE layout, SEE-C, and SE process. Legend: MS = mean size; SD = standard deviation; CV = coefficient of variation. ... 118
Table VII.3 Theoretical and measured drug loading in the microspheres
recovered using SEE-C, SEE and SE processes. ... 122
Table VIII.1 Laser scattering size distribution data of droplets (DSD) and
of microspheres (PSD) produced from w1-o-w2 emulsions (1:19:80 w/w/w, w1: EtOH) at different HA contents or PLGA concentrations, using SEE-C process. Legend: MS = mean size; SD = standard deviation; CV = coefficient of variation. ... 128
Table VIII.2 Laser scattering size distribution data of droplets (DSD) and
of particles (PSD) produced from w1-o-w2 emulsions (1:19:80 w/w/w, w1: DMSO) at different HA concentrations of 4.5% and 9% w/w, using SEE-C process; PLGA concentration was fixed at 10% w/w. Legend: MS = mean size; SD = standard deviation; CV = coefficient of variation. ... 131
Table VIII.3 Laser scattering size distribution data of droplets (DSD) and
of microspheres (PSD) produced from s-o-w suspension emulsions (20:80 w/w) at different HA concentrations of 4.5% and 9% w/w; PLGA concentration was fixed at 10% w/w. Legend: MS = mean size; SD = standard deviation; CV = coefficient of variation. ... 133
Table VIII.4 Theoretical and experimental HA loading in the microspheres
recovered using SEE-C technology. ... 136
Table IX.1 Laser scattering size distribution data of droplets (DSD) and of
microspheres (PSD) produced using SEE-C from w1-o-w2 emulsions prepared at different stirring rates. Legend: MS = mean size; SD = standard deviation; SF = shrinking factor. ... 146
Table IX.2 Theoretical and measured Insulin loading in the microspheres
ABSTRACT
Controlled release systems for therapeutic drugs have received extensive attention in recent years, due to their great clinical potential. Biodegradable microspheres are well-recognized systems to control the release rate of a drug out of a pharmaceutical dosage form; they are able to protect these agents against rapid degradation and clearance and release them in the body with a desired controlled rate and amount. Particularly, biopolymer microspheres are attracting increasing attention as drug carriers for injectable controlled release formulations.
Biopolymer microspheres for controlled drug delivery can be conventionally prepared by solvent evaporation/extraction of emulsions, but this technique shows many drawbacks (high temperature, long processing times, large polidispersity, high residual solvents, lower encapsulation efficiency). To overcome the limits of the traditional process, in recent years, Supercritical Emulsion Extraction (SEE) has been proposed for the production of drug/polymer microspheres with controlled size and distribution, starting from oil-in-water (o-w) and water-in-oil-in-water (w-o-w) emulsions. This process uses supercritical carbon dioxide (SC-CO2) to
extract the “oil” phase of emulsions, leading to near solvent-free microparticles. SEE offers the advantage of being a one-step process and is superior to other conventional techniques for the better particle size control, higher product purity and shorter processing times; but, as traditional processes, it shows problems related to batch-to-batch reproducibility and reduction of the process yield, due to the intrinsically discontinuous operation.
In the present work, a novel SEE configuration is proposed in a continuous operation layout (Continuous Supercritical Emulsion Extraction, SEE-C) using a countercurrent packed tower, for the production of controlled-size biopolymer microparticles in a robust and reproducible mode. Particularly, the purpose of this thesis is the optimization and characterization of the SEE-C process to investigate its capabilities and performances in the production of poly-lactic-co-glycolic acid (PLGA) microparticles with an engineered size and distribution and charged with different active principles (APs).
Before to investigate the possibility to produce AP/PLGA microspheres, an optimization of the process has been performed. Indeed, the thermodynamics of the selected system (ethyl acetate+CO2) has been
studied, together with the analysis of the process operating parameters. Moreover, a fluidodynamic characterization of the packed tower has been carried out to identify the best condition of operation, below the flooding point. The capacity limits for the packing material have been evaluated and, then, directly measured in terms of flooding point at different operating conditions.
Afterwards, firstly blank (drug-free) PLGA microparticles have been successfully produced, starting from single and double emulsions. Secondly, anti-inflammatory drugs (such as Piroxicam and Diclofenac Sodium), corticosteroids (such as Hydrocortisone acetate) and proteins (such as Insulin) have been chosen as model compounds to be entrapped within PLGA microspheres.
All the emulsions produced were stable with non-coalescing droplets. The corresponding microspheres obtained were spherical in shape and well-defined with narrow size distributions, due to the short processing time that prevents aggregation phenomena typically occurring during conventional solvent evaporation process.
The influence of some emulsion formulation parameters (such as polymer concentration and emulsion stirring rate) on particle size has been investigated, showing that the droplet formation step determines size and size distribution of the resulting microspheres; particularly, a significant increase in particle size with the increase of polymer concentration or the decrease of emulsion stirring rate has been observed. Moreover, the effect of kind and formulation of emulsion on the microsphere characteristics has also been investigated, demonstrating that the choice of the encapsulation approach and the emulsion composition have a considerable influence on the attainable drug encapsulation efficiency.
The produced microspheres have been characterized by X-ray, DSC, HPLC and UV-vis analysis. DSC and X-ray analyses confirmed that the microspheres were formed by an AP/PLGA solid solution and the active principle was entrapped in an amorphous state into the polymeric matrix. HPLC analysis revealed that good encapsulation efficiencies have been obtained in the products obtained. Release studies showed uniform drug concentration profiles, confirming a good dispersion of the drug into the polymer particles. The obtained AP/PLGA microspheres can degrade and release the encapsulated active principle slowly with a specific release profile. Active principle loading, particle size and emulsion kind revealed to be the controlling parameters for drug release. A study of PLGA microparticles degradation has also been carried out to monitor any morphological difference in time of the biodegradable devices produced by SEE-C.
Moreover, a comparative study between the characteristics of the PLGA microspheres obtained by SEE-C and the ones produced by the corresponding batch operating mode process (SEE) and conventional evaporation technology (SE) has been performed. PLGA microparticles produced by SEE-C showed a mean particle size always smaller than that associated with particles produced by SEE and SE; physico-chemical properties showed no morphological and structural differences between the processes. Compared with conventional technologies for the preparation of drug delivery systems, e.g. solvent evaporation emulsion techniques, the novel process is environmentally superior and suitable for scaling up to industrial dimensions. Moreover, the higher degree of control, as indicated by the high reproducibility, makes validation of the process very simple.
In conclusion, the SEE-C process has shown to be an attractive way of incorporating active principles into biodegradable microparticles for controlled release formulations. Greater product uniformity, higher throughput with smaller plant volumes and elimination of batch-to-batch repeatability problems are the significant advantages observed.
INTRODUCTION
In recent years, the pharmaceutical industry has focused considerable attention on the development and optimization of formulations that can release an active principle in the body with a desired controlled rate and amount. Biodegradable polymer microspheres are the most promising form for controlled release devices development, especially if produced with a narrow particle size distribution. They can also be used for site specific controlled delivery of small molecular weight drugs and proteins in a large variety of applications such as chemotherapy, cardiovascular disease, hormone therapy, therapeutic protein delivery and vaccine development (Burgess and Hickey, 1994; Cohen et al., 1991; Cao and Schoichet, 1999).
The use of biodegradable polymers as drug carriers has long been of interest in controlled release technology due to the ability of these polymers to be reabsorbed by the body. The field of biodegradable polymers is progressing rapidly, so that researchers now have at their disposal a substantial number of degradable polymers with range of degradation rates (Vert et al., 1993). The most widely used and studied class of biodegradable polymers is the polyesters, including poly-lactic acid (PLA) and poly-lactic-co-glycolic acid (PLGA). Microspheres formulated with these polymers have shown wide applicability for oral (Chacón et al., 1996), parenteral (Uchida et al., 1997a; Soriano et al., 1996), respiratory (Emami et al., 2009) and topical (Rolland et al., 1993) administration.
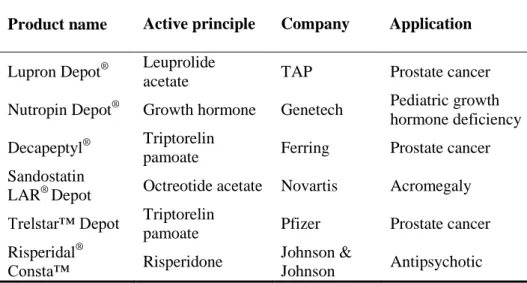
Throughout the past few years, some products based on active principle-loaded biodegradable microspheres have reached the pharmaceutical market place. Well-known examples are Lupron Depot® (Abbott Laboratories), Trelstar® Depot (Watson Pharmaceuticals), and Risperdal® ConstaTM (Ortho-McNeil-Janssen Pharmaceuticals). These types of injectable depot formulations (intramuscular, IM, or subcutaneous, SC) can provide sustained and controlled delivery of the active substance over a period of weeks. Some of the advantages of these formulations include: decrease in the amount of residual active principle concentrations due to lower dose, targeting of active principles to the affected area in the body, preservation of the efficacy of unstable active principles, reduction of the need for patient follow-up care, and also increase of patient comfort and compliance (Langer, 1998; Bandi et
al., 2004). Therefore, from the perspective of the pharmaceutical companies, microsphere-based depot formulations of existing compounds offer an attractive tool in life cycle management, but most importantly, offer significant value to patients. Although microsphere-based drug delivery is attractive from both market and patient perspective, developers of microsphere formulations have to face many challenges in achieving the desired product performance and process efficiency. Many of these challenges are related to the lack of control over particle size and uniformity of conventional microsphere manufacturing methods. Indeed, conventional methods for producing microspheres, such as solvent evaporation/extraction of emulsions, do not allow for total control of microsphere size and uniformity. Typically, wide particle size distributions with standard deviations of the mean diameter over 50% are achieved. Moreover, conventional processes often show long processing times and toxic solvent residues may remain in the final formulation because the organic solvents used to dissolve polymers are difficult to remove. However, the international regulations for the use of solvents in pharmaceutical industries require controlled use of organic solvents and radical reduction of conventional solvents used in pharmaceutical processes. To obtain narrower size distributions, expensive classification steps with high losses of active compound in the unwanted size ranges are required, as well as further operations are necessary to reduce solvent residue values below safety limits. Given the fact that the current manufacturing processes have difficulties in predictably producing solvent-free microparticles with an engineered size and distribution, a technology that can offer complete control over size distribution and very reduced solvent residues within microspheres is of great industrial value. There are a number of techniques in development designed to overcome issues regarding toxicity, size and uniformity. Among them, a supercritical fluid (SCF) based technique can offer the best and most straightforward opportunity to overcome these challenges. The most common supercritical fluid used is the carbon dioxide (SC-CO2) because it is
chemically stable, nonflammable, non toxic, inexpensive, available in high quantity and purity and with critical properties easy to be reached.
SCFs exhibit gas-like (high diffusivity, low viscosity, no surface tension) and liquid-like (high density and high solvent strength) properties. Mild operating conditions and solventless or organic solvent reduced operations are relevant advantages. They also offer several degrees of freedom with respect to process setup and operating conditions, which may be exploited to tune size and shape of product particles (Fusaro et al., 2004; Muhrer et al., 2006). Supercritical fluid technology allows to access domains of miscible as well as of immiscible conditions for the same solvent-SCF system, i.e. by simply changing the operating pressure and temperature. In addition, lower viscosity and higher diffusivity of SCF with respect to the liquid solvent can improve mass transfer, which is often a limiting factor for the extraction
processes. Due to these favorable properties, supercritical fluids are currently proposed in a wide range of extraction applications (Reverchon and De Marco, 2006), microparticle formation (Della Porta and Reverchon, 2008; Della Porta et al., 2006; Reverchon and Adami, 2006; Reverchon and Antonacci, 2007) and membrane drying technologies (Reverchon et al., 2006). For example, in the last 10 years, different supercritical fluid technologies have been proposed in literature to produce microparticles of PLGA and also of drug-PLGA composites, such as the Rapid Expansion of Supercritical Solutions (RESS), the Solution-Enhanced Dispersion by Supercritical Fluids (SEDS) and the Supercritical AntiSolvent (SAS) (Debenedetti, 1993; Della Porta and Reverchon, 2008a).
In RESS technology, SC-CO2 acts as solvent, solubilizing the compound to
be treated and producing microparticles by a rapid decompression of the supercritical solution and the subsequent sovrasaturation of the solubilized biopolymer. SAS technique uses SC-CO2 as phase-separating anti-solvent to
induce the biopolymer precipitation from its liquid solution. In the SEDS technology, the general principle is the same as for the SAS process: the precipitation of the polymer is due to the anti-solvent effect of SC-CO2. The
main problem reported for RESS technology is the very low solubility of almost all PLGA co-polymers in SC-CO2 that will prevent affordable
process yields or will require the use of co-solvent (Kongsombut et al., 2009). On the other hand, the solubility of SC-CO2 in the PLGA (even if
very low) is again the main problem for SAS or SEDS technologies, because it causes strong microparticles agglomeration resulting in products with irregular shapes or recovered with a low yield due to the strong tendency to form a film (Kang et al., 2008; Ginty et al., 2005; Ghaderi et al., 2000). It is worth mentioning that other authors (Young and Johnston, 1999; Pini et al., 2008) also reported a large CO2 uptake by sorption into PLGA co-polymers,
during the supercritical CO2 antisolvent processing of PLGA, resulting in a
significant decrease in PLGA glass transition temperature that will advantage the formation of strong intra-particle adhesion or continuous film structures.
Recently, the use of SC-CO2 for PLGA microparticles manufacture has
also been proposed starting from emulsions. Particularly, SC-CO2 has been
proposed to extract the „„oily‟‟ phase of single oil-in-water (o-w) and double water-in-oil-in-water (w-o-w) emulsions, leading to near solvent-free microparticles (Chattopadhyay et al., 2006; Della Porta and Reverchon, 2008b; Kluge et al., 2009a). The process, named Supercritical Emulsion Extraction (SEE), produces an aqueous suspension of microparticles after the supercritical extraction of the organic solvent contained in the emulsion. It is described as faster and selective compared to the conventional techniques, and capable of affecting the size distribution of the produced microparticles, since the fast extraction rate results in a narrower particle size distribution because the droplets aggregation is minimized. One of the
major limitations of SEE technology, shared with traditional evaporation/extraction processes, is the intrinsically discontinuous operation. Indeed, emulsions must be treated batch, with problems of batch-to-batch variability and reduction of the process yield (Della Porta and Reverchon, 2008b; Kluge et al., 2009).
For this reason, in the present work, Supercritical Emulsion Extraction process is proposed in a Continuous operating mode (SEE-C) (Reverchon and Della Porta, 2007) for the production of biopolymer microspheres with different size and distribution, in a robust and reproducible mode. Particularly, the aim of the PhD research project is to optimize and characterize the SEE-C process to investigate its capabilities and performances in the production of controlled-size active principle/PLGA microspheres for controlled release formulations, starting from single and double emulsion systems. Anti-inflammatory drugs, corticosteroids and proteins have been selected as model active compounds to be entrapped within microspheres.
SEE-C process arrangement is obtained using a high pressure packed column operating in countercurrent flow. Countercurrent extraction is expected to achieve a multistage treatment that should reduce the amount of solvent necessary and increase throughput. This manufacturing technique should provide not only particles having predictable and controllable physical properties such as size distribution, composition and structure, but, it must also conform to the rigorous requirements of product consistency, purity and process scalability.
CHAPTER I
State of the art
In this chapter, the concepts and the parameters involved in the microencapsulation of pharmaceutical agents for controlled release formulations are described. In addition, an in-depth discussion on the emulsions and on the conventional and innovative microencapsulation processes (solvent evaporation/extraction and supercritical extraction emulsions, respectively) for the preparation of microencapsulated drug formulations starting from emulsions is provided.
I.1 Microencapsulation technology in controlled release
formulations
Microencapsulation describes a process of incorporation of micron-sized (very tiny) particles of solids or droplets of liquids or gasses in an inert polymer matrix, which in turn isolates and protects them from the external environment. The inertness is related to the reactivity of the polymer with the entrapped substance. Microencapsulation provides the possibility of combining the properties of different types of material (e.g., inorganic and organic), a process which is difficult to achieve using other techniques.
Microencapsulation technology and its applications have advanced over the last several decades. This technology is used in pharmaceutical, biomedical, agricultural, food, textile, consumer products, cosmetic, veterinary, medicine, industrial chemicals, biotechnology, sensor industries Some applications of microencapsulation are presented in Figure I.1:
Industrial chemicals Agricultural Food additives Cosmetics Nutraceuticals Pharmaceuticals Adhesives MICROENCAPSULATION Sealants Flavors and essences Pesticides and Herbicides
Figure I.1 Schematic representation of microencapsulation applications.
The pharmaceutical industry has long used microencapsulation for the preparation of particles containing active principles. The reasons for microencapsulation in the pharmaceutical industries are countless. Microencapsulation is often used to provide a protection for a drug from the reactive surroundings and to prevent drug degradation from light or exposure to oxygen. Furthermore, microencapsulation can be used to improve the formulation characteristics such as taste, stability and wettability. Microencapsulated formulations can also be used to extend the dosage time from a repeated to single administration and to provide controlled release of drugs in a desired part of the body (Tandya et al., 2007).
A large variety of bioactive compounds with different physical and chemical properties have been formulated into polymeric systems, including anti-cancer drugs (Boisdron-Celle et al., 1995), narcotic agents (Mason et al., 1976), local anesthetics (Chung et al., 2001) as well as steroids (Cowsar et al., 1985), therapeutic peptides (Jeyanthi et al., 1997) and proteins (Meinel et al., 2001), DNA (Hsu et al., 1999), viruses (Sturesson et al., 1999) and bacteria-derived compounds (Ren et al., 2002).
Microencapsulation has been widely used in the design of controlled release dosage forms for the past few decades, since it can readily be adapted for various administration methods. Indeed, there have been significant developments in controlled release administration in the last three decades, from primitive delayed-release dosage forms in the 1960s to highly sophisticated self-regulated delivery systems in the 1990s (Park, 1997). These advances have produced many clinically useful controlled release dosage forms and provided better shelf-life for many existing drugs.
Controlled release systems can be described as formulations intended to provide temporal or spatial control of drug release in the body. The term “control” includes phenomena such as protection and masking, reduced of dissolution rate, facilitation of handling and spatial targeting of the active principle to the affected area in the body.
Conventional drug administration may provide an immediate release of drug concentration in the blood followed by a reduction of drug concentration, as shown in Figure I.2(a); whereas, controlled release formulations, illustrated in Figure I.2(b), can circumvent problems related to the conventional formulations by enhancing the durability and effectiveness of the drug in the body, because they provide a constant drug concentration in the body at some optimum level over the duration of therapy. As a consequence, these formulations have outstanding advantages compared to conventional pharmaceutical dosage forms: increased patient compliance and acceptance by reducing the frequency of administration; increased therapeutic benefit by minimizing the drug blood level fluctuations and potentially lowering the total administered amount of drug by reducing peaks and valleys; drug targeting to specific locations resulting in a higher efficiency; protection of labile compounds before and after administration and prior to appearance at the site of action (Berkland et al., 2002; Freiberg et al., 2004; Hickey et al., 2002a; Kim et al., 2002; King et al., 2000; Meinel et al., 2001). Although controlled release formulations are invariably more expensive than conventional formulations, the overall cost of treatment may be lower due to one or more therapeutic advantages, fewer side-effects and less time required of health care personnel to dispense and administer drugs and monitor patients. However, controlled release delivery systems may present some disadvantages, such as the loss of flexibility in adjusting the drug dose and/or dosage regimen and an increased risk of sudden and total drug release due to technological failure of the dosage unit.
(a)
MCE
MTC
Dose Dose Dose
D ru g le v e l
Time after drug administration (b) MTC MCE Dose
Time after drug administration D ru g le v e l
Figure I.2(a-b) Comparison between (a) traditional dosing and (b)
controlled delivery dosing (MEC = minimum effective concentration, MTC = minimum toxic concentration).
Controlled release formulations are commonly prepared with the use of microparticles of drug-polymer composites, either as microspheres (or matrix system) or microcapsules (or core-and-shell system), both schematically illustrated in Figure I.3(a-b). The former are polymer microparticles in which the active agent is uniformly dispersed; the latter are structured microparticles composed by a core (the intrinsic part) of the active
substance surrounded by a polymer shell (the extrinsic part). Typically, the lowest particle size is 1 μm and the largest size is 1 mm.
(a) Active principle Polymer (b) Active principle Polymer
Figure I.3(a-b) Classification of controlled release systems: (a) microsphere
and (b) microcapsule.
Biopolymer microspheres are the best devices for locally injectable controlled release formulations, providing a number of advantages over conventional parenteral formulations.
Investigations about drug incorporation and release are an important tool in the design and evaluation of a potential drug-carrier system (zur Mühlen et al., 1998). Biodegradable polymers have been successfully employed as drug carriers to design controlled drug delivery systems. In general, when biodegradable and bioerodible polymers are used in controlled release formulations, the polymers are degraded or eroded to non-toxic materials by body fluids over time. Thus, the removal of polymeric material from the body after the drug release is unnecessary.
Controlled drug release from biodegradable matrices is obtained by different mechanisms: polymer swelling, diffusion of drug through the polymer matrix, polymer degradation or a combination of these mechanisms (Washington, 1996). The design of a controlled release system is a complicated process due to the interdependency of several factors: particle size and surface morphology, as well as, drug and polymer physical chemistry are key factors governing release kinetics. Particularly, sphere size and distribution will determine the surface area/volume ratio and, thereby, the amount of surface available for drug release. Monodisperse microspheres may exhibit the most uniform drug release (Berkland et al., 2002, 2003). It was also observed that there is an ideal sphere size which provides a desired release rate; but, since the rate of drug release from microspheres dictates
their therapeutic action, sphere size and therapeutic action are related. Spheres that are „„too small‟‟ exhibit poor sustained release efficiency, they also may migrate from the site of injection producing undesirable drug release; whereas, spheres that are „„too large‟‟ may not easily pass through a syringe needle. Thus, the typically polydisperse samples generated by conventional fabrication techniques must be filtered or sieved to isolate particles within the desired size range. Precise size distributions may also allow the preparation of advanced delivery systems formulation that are not possible using polydisperse microspheres; for example, uniform microspheres approximately of 1-5 µm in diameter would be ideal for passive targeting of specific antigen-presenting cells (APCs) such as macrophages and dendritic cells (Evora et al., 1998). Similarly, microspheres of 10-20 µm in diameter could be used to target the tortuous capillary bed of tumor tissues by chemo-embolization (Dass and Burton, 1999).
I.2 Emulsions
Emulsions are mixtures consisting of at least two completely o partially immiscible liquid phases, one of which (i.e. the dispersed phase, oil phase) is dispersed as droplets of microscopic or ultramicroscopic size in the other liquid phase (i.e., the continuous phase, aqueous phase). Depending upon the nature of the dispersed phase, there are different kinds of emulsions. For example, a solution of hydrophobic active principle and polymer in an organic solvent (oil phase) is emulsified in an aqueous solution containing an emulsifying agent (water phase) to produce single oil-in-water (o-w) emulsion. This method can be successfully employed to encapsulate poorly water soluble active principles, but it is not suitable for the encapsulation of high hydrophilic active principles. There are two main reasons: 1) the hydrophilic active principle may not be dissolved in the organic solvent; 2) the active principle will diffuse into the continuous phase during emulsion, leading to a high loss of active principle. Therefore, depending on the solubility of active principle in water and encapsulating polymer, the emulsion kind can be varied from water-in-oil-in-water (w-o-w for encapsulation of water-soluble drug in water-insoluble polymer) or water-in-oil-in-oil (w-o-o for encapsulation of water-soluble drug in water-insoluble polymer) to water-in-oil (w-o for encapsulation of water-soluble drug in water-soluble polymer). Some examples of different kinds of emulsions are reported in a schematic representation in Figure I.4:
oil-in-water (o-w) water-in-oil (w-o) water-in-oil-in-water (w-o-w)
Figure I.4 Schematic representation of oil-in-water (o-w), water-in-oil (w-o)
and water-in-oil-in-water (w-o-w) emulsions.
From a thermodynamic point of view, the emulsions are metastable systems which means they are prepared using an excess energy (mechanical in most cases, such as shaking, stirring, homogenizing or spraying). To achieve a thermodynamic equilibrium between the solvent in the emulsion droplets and the aqueous phase, the addition of an emulsifying agent, such as a surfactant, to the dispersed phase is required.
Surfactants are amphiphilic molecules which consist of a hydrophilic “head” group and a hydrophobic “tail” (Figure I.5). This means one part of the molecule has more affinity to polar solutes, such as water (hydrophilic), and the other part has more affinity to non-polar solutes, such as hydrocarbons (hydrophobic). Therefore, a surfactant molecule contains both a water insoluble (or oil soluble) component and a water soluble component. Due to their amphiphilic nature, surfactant molecules have a high affinity towards surfaces and interfaces, thereby the term “surfactant” which is an abbreviation for “surface active agent”.
hydrophilic head hydrophobic tail
Figure I.5 Schematization of surfactants.
Surfactant molecules will diffuse in water and adsorb at the interface between oil and water. As shown in Figure I.6, the insoluble hydrophobic group may extend out of the bulk water phase, into the oil phase, while the water soluble head group remains in the water phase. This alignment of surfactant molecules at the surface modifies the surface properties of water