Parte A
. Supporto alla progettazione del
combustibile nucleare per il reattore LFR
–
Contributo ENEA
………5
Parte B
. Supporto alla progettazione del
combustibile nucleare per il reattore LFR
Abstract
Among the parameters that governs the myriad of processes that occurs during irradiation of fuels rods, the fuel temperature is by far the most important one. The correct prediction of the fuel temperature profile is the basis for the simulation of integral fuel rods by means of fuel performance codes. It is therefore of critical importance to any computer code used for simulation of integral fuel rod behavior to be able to predict the thermal conductivity of the fuel correctly since it directly affects the temperature.
The present activity is conducted in the framework of the PELGRIMM EC Project and deals with the assessment of MOX fuel conductivity correlations used in TRANSURANUS code and comparing them to open literature correlations and experimental data then verifying the code against selected integral fuel rod experiments done for both thermal and fast reactors. In order to assess the thermal conductivity correlations of MOX fuel into an integral simulation, other phenomena that would affect the prediction of temperature have been investigated as well in order to capture the integral behavior of MOX for thermal and fast reactor. This step helped in assessing the ability of thermal conductivity correlations to predict fuel temperature while excluding the effects of other phenomena meanwhile giving a general information about the ability of different models to predict the phenomenon they predict.
It was shown during this work that TU is able to predict temperature, hence the thermal conductivity of thermal reactor MOX with high accuracy. On the other hand, the work revealed a potential field of improvement to predict the thermal conductivity of FR grade MOX, especially if not of stoichiometric grade and if in fresh conditions. However, the code seems to be on the conservative size when modeling FR MOX. A first step in this improvement was taken in this work and targeted the modification of the high temperature thermal conductivity term in order to be able to obtain a better, less conservative prediction of the melting of FR fuel rods early in life in the reactor core.
LIST OF CONTENTS
A
BSTRACT... 5
A
BBREVIATIONS... 11
L
IST OF FIGURES... 13
L
IST OF TABLES... 17
1
I
NTRODUCTION... 19
1.1
Objective of the activity ... 19
2
T
HEORETICAL BACKGROUND... 21
2.1
Thermal conductivity of ceramic fuel ... 21
2.2
Effect of temperature ... 22
2.3
Effect of stoichiometry ... 23
2.4
Effect of burn-up ... 24
2.5
Effect of fuel porosity ... 25
2.6
Effect of Plutonium content ... 26
2.7
Summary of parameters affecting thermal conductivity... 26
3
MOX
FUEL CONDUCTIVITY CORRELATIONS... 27
3.1
TRANSURANUS correlations ... 27
3.1.1 Correlation by Van Uffelen and Schubert ... 27
3.1.2 Correlation by Carbajo ... 28
3.1.3 Correlation by Lanning and Beyer ... 29
3.1.4 Correlation by Wiesenack. ... 30
3.2
Open Literature correlations ... 31
3.2.1 Martin review 1982 ... 31
3.2.2 FTHCON subscode-MATPRO ... 32
3.2.3 The COMETHE formulation-1982 ... 33
3.2.4 Baron Hervè 1995 Model ... 34
3.3
Experimental data and correlations ... 34
4
TRANSURANUS
CODE... 43
5
A
NALYSIS OFLWR
MOX:
IFA-597
EXPERIMENT... 45
5.1
Description of the experiment ... 45
5.1.1 Background and objective of the experiment ... 45
5.1.2 Halden Boiling Water Reactor (HBWR) ... 45
5.1.3 Design of the rig and rods ... 48
5.1.4 Linear Heat rating (LHR) ... 49
5.2
Modelling IFA597.4/.5 with TU ... 50
5.2.1 Development of TU input file ... 50
5.2.2 Boundary conditions ... 52
5.2.3 Burn-up investigation ... 53
5.3
Reference analysis of IFA597.4/.5 ... 54
5.3.1 Fuel temperature ... 54
5.3.2 FGR and pin pressurization ... 54
5.4
Sensitivity analysis ... 58
5.4.1 Effect of linear heat rating uncertainty ... 60
5.4.2 Effect of thermal conductivity correlations ... 64
5.4.3 Relocation models analysis ... 66
5.4.4 Swelling correlations ... 68
5.4.5 FGR models ... 69
5.4.6 Gap conductance models ... 71
5.4.7 Other parameters ... 72
5.5
Radial analysis ... 73
5.5.1 IFA597.4 Radial analysis (5 MWD/KgU) ... 74
5.5.2 IFA597.5 Radial analysis (24 MWD/KgHM) ... 76
6
A
NALYSIS OFFR
MOX:
HEDL
P-19
EXPERIMENT... 79
6.1
Description of the experiment ... 79
6.1.1 Background and objective of the experiment ... 79
6.1.2 Experimental Breeder Reactor #2 (EBR-II) ... 82
6.2
Modelling HEDL P-19 with TU ... 83
6.2.1 Development of TU input file ... 83
6.2.2 Boundary conditions ... 85
6.3
Reference analysis of HEDL P-19 rods ... 87
6.3.1 Temperature prediction ... 87
6.3.2 Gap width ... 87
6.3.3 Central void ... 87
6.3.4 Columnar grains ... 88
6.3.6 Melting elevation ... 88
6.4
Sensitivity analysis ... 96
6.4.1 Thermal conductivity correlations ... 98
6.4.2 Relocation models analysis ... 100
6.4.3 Solidus-Liquidus melting models... 101
6.4.4 Fuel restructuring models ... 102
6.4.5 Initial gap width ... 102
6.5
Radial analysis ... 104
7
R
EVIEW OF THERMAL CONDUCTIVITY CORRELATIONS... 108
8
C
ONCLUSION... 115
Abbreviations
ANL Argon National Laboratory at.% Atomic percentage
BOL Beginning Of Life
BU BurnUp
BWR Boiling Water Reactor
Cs Cesium
EBR-II Experimental Breeder Reactor #2
El Electronic
EOL End Of Life
FBR Fast Breeder Reactor FD Dissolved Fission products FFTF Fast Flux Test Facility FGR Fission Gas Release
FP Precipitated Fission products FR Radiation Factor/ Fast Reactor Gd2O3 Gadolinia
HBWR Heavy Boiling Water Reactor
HEDL Hanvord Engineering Development Laboratory HPG Halden Project Group
HRP Halden Reactor Project IFA Instrumental Fuel Assembly
ITU Institute for TransUranium elements
Kr Krypton
Latt Lattice
LHR Linear Heat Rate
LMFBR Liquid Metal Fast Breeder Reactor LWR Light Water Reactor
MA Minor Actinides
MIMAS Micronized MAster blend
MOX Mixed Oxide fuel
Nd Neodymium
OL Open Literature
O/M Oxygen to Metal ratio
P Porosity
PCMI Pellet Cladding Mechanical Interaction PuO2 Plutonium dioxide
PWR Pressurized Water Reactor
Rad Radiation
RADAR RAting Depressing Analysis routine TD Theoretical Density
TU TRANSURANUS
UO2 Uranium dioxide
wt.% Weight percentage
Xe Xenon
List of figures
Figure 2-1 (U-Pu)y-Ox fuel total thermal conductivity along with its different constituting
components. ... 23
Figure 2-2 (U-Pu)y-Ox conductivity: effect of deviation from stoichiometry on the thermal conductivity. ... 24
Figure 2-3 (U-Pu)y-Ox conductivity: effect of burn-up on the thermal conductivity. ... 25
Figure 3-1 MOX thermal conductivity: comparison between correlations and experimental data for 100%TD, O/M=2, PU=20 wt.%. ... 36
Figure 3-2 MOX thermal conductivity: comparison between correlations and experimental data for 95%TD, O/M=2, PU=20 wt.%. ... 37
Figure 3-3 MOX thermal conductivity: comparison between Wiesenack correlation and experimental data for 95%TD, O/M=2, PU=20 wt.%. ... 37
Figure 3-4 MOX thermal conductivity: comparison between correlations and experimental data for 95%TD, O/M=1.98, PU=20 wt.%. ... 38
Figure 3-5 MOX thermal conductivity: comparison between correlations and experimental data for 95%TD, O/M=1.93, PU=20 wt.%. ... 39
Figure 3-6 MOX thermal conductivity: comparison between correlations and experimental data for 95%TD, O/M=2, PU=6 wt.%. ... 40
Figure 5-1 HBWR, schematic diagram and main operation parameters. [21] ... 47
Figure 5-2 HBWR, plan view of the reactor top lid and main parameters.[21] ... 47
Figure 5-3 IFA-597 experiment, schematic radial view of the test rig. [2] ... 49
Figure 5-4 Linear heat rating of solid and hollow rods. ... 50
Figure 5-5 Simulation of IFA-597, preliminary results: burn-up analysis. ... 53
Figure 5-6 Simulation of IFA-597, reference results: fuel temperature evolution in rod 10. ... 55
Figure 5-7 Simulation of IFA-597, reference results: fuel temperature evolution in rod 11. ... 56
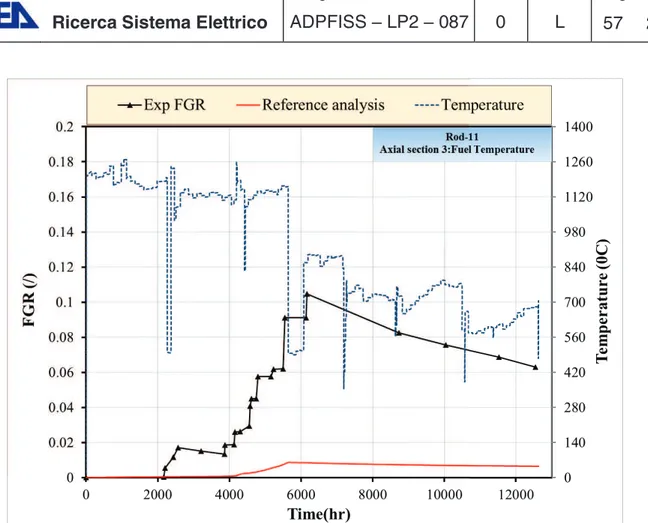
Figure 5-8 Simulation of IFA-597, reference results: FGR evolution in rod 10. ... 56
Figure 5-9 Simulation of IFA-597, reference results: FGR evolution in rod 11. ... 57
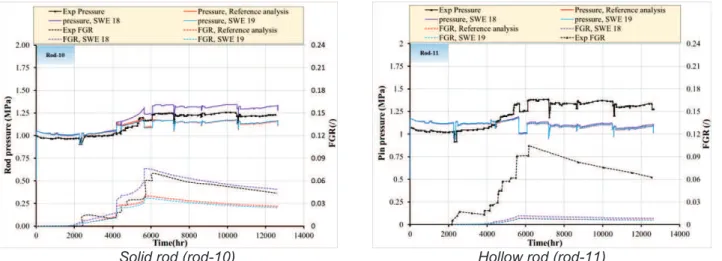
Figure 5-10 Simulation of IFA-597, reference results: pin pressure evolution in rod 10. ... 57
Figure 5-11 Simulation of IFA-597, reference results: pin pressure evolution in rod 11. ... 58
Figure 5-12 Simulation of IFA-597, sensitivity analysis on LHR, fuel temperature. ... 62
Figure 5-13 Simulation of IFA-597, sensitivity analysis on LHR, FGR. ... 62
Figure 5-14 Simulation of IFA-597, sensitivity analysis on LHR, rod pressure. ... 62
Figure 5-15 Simulation of IFA-597, sensitivity analysis on LHR, variation on fuel centreline prediction of rod-10. ... 63
Figure 5-16 Simulation of IFA-597, sensitivity analysis on LHR, variation on rod pressure prediction of rod-10. ... 63
Figure 5-17 Simulation of IFA-597, sensitivity analysis on fuel conductivity correlations, temperature prediction. ... 65
Figure 5-18 Simulation of IFA-597, sensitivity analysis on fuel conductivity correlations, rod
pressure and FGR prediction. ... 65
Figure 5-19 Simulation of IFA-597, sensitivity analysis on relocation models, temperature prediction. ... 67
Figure 5-20 Simulation of IFA-597, sensitivity analysis on relocation models, Pressure & FGR prediction. ... 67
Figure 5-21 Simulation of IFA-597, sensitivity analysis on swelling correlations, temperature prediction. ... 69
Figure 5-22 Simulation of IFA-597, sensitivity analysis on swelling correlations, rod pressure and FGR prediction. ... 69
Figure 5-23 Simulation of IFA-597, sensitivity analysis on FGR: Intra-granular model coupled with inter-granular model IGRBDM=3, temperature and FGR predictions. ... 70
Figure 5-24 Simulation of IFA-597, sensitivity analysis on FGR: Inter-granular models coupled with intra-granular model FGRMOD=6, temperature and FGR predictions. ... 71
Figure 5-25 Simulation of IFA-597, sensitivity analysis on gap conductance, temperature prediction. ... 72
Figure 5-26 IFA-597, temperature radial profile at 5MWd/kgHM as function of the conductivity correlation adopted... 75
Figure 5-27 IFA-597 at 5 MWd/kgHM, thermal conductivity profiles when applied to rod-10, comparison with open literature correlations and experimental data. ... 75
Figure 5-28 IFA-597 at 5MWd/kgHM, thermal conductivity profiles when applied to rod-11, comparison with open literature correlations and experimental data. ... 76
Figure 5-29 IFA-597, temperature radial profile at 24MWd/kgHM as function of the conductivity correlation adopted. ... 77
Figure 5-30 IFA-597 at 24 MWd/kgHM, thermal conductivity profiles when applied to rod-10, comparison with open literature correlations and experimental data. ... 77
Figure 5-31 IFA-597 at 24 MWd/kgHM, thermal conductivity profiles when applied to rod-11, comparison with open literature correlations and experimental data. ... 78
Figure 6-1 HEDL P-19, pin power axial profile.[3] ... 81
Figure 6-2 HEDL P-19, EBR-II power history during the experiment.[3] ... 81
Figure 6-3 Schematic diagram of EBR-II plant. [29] ... 83
Figure 6-4 Simulation of HEDL P-19, rod P19-2, LHR at 17 axial elevations. ... 86
Figure 6-5 Simulation of HEDL P-19, rod P19-2, coolant temperature at 17 axial elevations. ... 86
Figure 6-6 Simulation of HEDL P-19, rod P19-2, centreline temperature. ... 89
Figure 6-7 Simulation of HEDL P-19, rod P19-5, reference analysis, centreline temperature. ... 89
Figure 6-8 Simulation of HEDL P-19, rod P19-2, reference analysis, radial temperature profile at the end of the ramp. ... 90
Figure 6-9 Simulation of HEDL P-19, rod P19-5, reference analysis, radial temperature profile at the end of the ramp. ... 90
Figure 6-10 Simulation of HEDL P-19, rod P19-2, reference analysis, prediction of gap width at the end of the experiment. ... 91
Figure 6-11 Simulation of HEDL P-19, rod P19-5, reference analysis, prediction of gap width at the end of the experiment. ... 91 Figure 6-12 Simulation of HEDL P-19, rod P19-2, reference analysis, prediction of the central
void at the end of the experiment. ... 92 Figure 6-13 Simulation of HEDL P-19, rod P19-5, reference analysis, prediction of the central
void at the end of the experiment. ... 92 Figure 6-14 Simulation of HEDL P-19, rod P19-2, reference analysis, prediction of the
columnar grain radii at the end of the experiment. ... 93 Figure 6-15 Simulation of HEDL P-19, rod P19-5, reference analysis, prediction of the
columnar grain radii at the end of the experiment. ... 93 Figure 6-16 Simulation of HEDL P-19, rod P19-2, reference analysis, prediction of the melting
radius. ... 94 Figure 6-17 Simulation of HEDL P-19, rod P19-5, reference analysis, prediction of the melting
radius. ... 94 Figure 6-18 Simulation of HEDL P-19, rod P19-2, reference analysis, prediction of melting
height. ... 95 Figure 6-19 Simulation of HEDL P-19, rod P19-5, reference analysis, prediction of melting
height. ... 95 Figure 6-20 Simulation of HEDL-P19, sensitivity analysis on thermal conductivity correlations,
prediction of melting height. ... 98 Figure 6-21 Simulation of HEDL-P19, sensitivity analysis on thermal conductivity correlations,
prediction of gap width at the end of the experiment. ... 99 Figure 6-22 Simulation of HEDL-P19, sensitivity analysis on thermal conductivity correlations,
prediction of central void at the end of the experiment. ... 99 Figure 6-23 Simulation of HEDL-P19, sensitivity analysis on thermal conductivity correlations,
prediction of columnar grain radius at the end of the experiment. ... 99 Figure 6-24 Simulation of HEDL-P19, sensitivity analysis on thermal conductivity correlations,
prediction of melting radii. ... 100 Figure 6-25 Simulation of HEDL-P19, sensitivity analysis on relocation models, prediction of
gap width at the end of the experiment. ... 100 Figure 6-26 Simulation of HEDL-P19, sensitivity analysis on relocation models, prediction of
melting height. ... 101 Figure 6-27 Simulation of HEDL-P19, sensitivity analysis on melting models, prediction of
central void at the end of the experiment. ... 101 Figure 6-28 Simulation of HEDL-P19, sensitivity analysis on melting models, prediction of
melting height. ... 102 Figure 6-29 Simulation of HEDL-P19, sensitivity analysis on restructuring models, columnar
grain radii prediction... 102 Figure 6-30 Simulation of HEDL-P19, sensitivity analysis on initial gap size, prediction of
melting height. ... 103 Figure 6-31 Simulation of HEDL-P19, sensitivity analysis on, prediction of gap width at the end
of the experiment. ... 103 Figure 6-32 Radial profile of thermal conductivity for rod P-19-2. ... 106
Figure 6-33 Radial profile of thermal conductivity for rod P-19-5. ... 107 Figure 7-1 lattice and electronic conductivities comparison. ... 111 Figure 7-2 Rod P-19-2, Comparison between the melting heights and fraction according to the
original and modified correlations. ... 111 Figure 7-3 Rod P-19-2, Comparison between the predicted gap width at the end of the
experiment by the original and modified correlations. ... 112 Figure 7-4 Rod P-19-2, Prediction of centreline temperature by the original and modified
correlations. ... 112 Figure 7-5 Rod P-19-5, Comparison between the melting heights and fraction according to the
original and modified correlations. ... 113 Figure 7-6 Rod P-19-2, Comparison between the predicted gap width at the end of the
experiment by the original and modified correlations. ... 113 Figure 7-7 Rod P-19-5, Prediction of centreline temperature by the original and modified
correlations. ... 114 Figure 7-8 Radial comparison of thermal conductivity for rod P-19-2 predicted by the original
List of tables
Table 2-1 Factors affecting thermal conductivity of MOX fuel. ... 26
Table.3-1 Summary of thermal conductivity correlations for MOX. ... 35
Table.3-2 List of experimental data on MOX used for comparison with correlations. ... 35
Table 5-1 HBWR, summary of the driver fuel main data. ... 46
Table 5-2 IFA-597 experiment, rod characteristics. ... 48
Table 5-3 IFA-597 experiment, summary of models and correlations that might affect the prediction of thermal conductivity of the rods. ... 51
Table 5-4 IFA-597 experiment, local heat rate measurement positions. ... 53
Table 5-5 Simulation of IFA-597, list of correlations, models and design parameters considered in the sensitivity studies. ... 60
Table 5-6 IFA-597, summary of radial analysis main data. ... 74
Table 6-1 HEDL P-19, design data. [3] ... 80
Table 6-2 HEDL P-19, axial extension of fuel melting at the end of the experiment. [3] ... 80
Table 6-3 HEDL P-19, measurements of central void, columnar grain radius and TD at pellet center at the end of the experiment. [3] ... 80
Table 6-4 Simulation of HEDL P-19, summary of models and correlations that might affect the prediction of thermal conductivity of the rods. ... 84
Table 6-5 Simulation of HEDL P-19, axial discretization of the fuel rods. ... 85
Table 6-6 Simulation of HEDL-P19, list of correlations, models and design parameters considered in the sensitivity studies. ... 97
1 Introduction
1.1 Objective of the activity
The development of mixed oxide fuel (MOX) is a strategic option for current and new generation of nuclear reactors. Therefore, it is important to confirm that it can be implemented safely within a reactor system and that its characteristics fits with the type of reactor it will be used in. One of the issues to be investigated, is the assessment of the thermal performance of MOX during irradiation in order to ensure that the fuel element can endure the heat conditions of the reactor core in normal operation and have a safe margin within transient conditions during its in reactor life. Among the parameters that governs the myriad of processes that occurs during irradiation of fuels rods, the fuel temperature, is by far the most important one (i.e. it dominates the FGR and swelling mechanisms)[1]. The correct prediction of the fuel temperature profile is therefore the basis for the simulation of integral fuel rods by means of fuel performance codes. The objective of this work is to assess the ability of a computer code TRANSURANUS (TU) to predict the performance of MOX fuel rods within thermal and fast reactors with main focus drawn on thermal conductivity. Thorough investigation is given to the thermal conductivity prediction since it is the direct parameter used in determining the temperature profile and the prediction of melting in the investigated fuel rods. Various phenomena occurring in MOX fuel (Densification, Swelling, Relocation, etc.) during irradiation were investigated to assess the integral capability of the code to model the thermal performance of the rods.
The study involves the analysis of four MOX rods. Two of them were irradiated in Halden heavy Boiling Water Reactor (HBWR) within IFA-597 experiment. The other two were irradiated in Experimental Breeder Reactor #2 (EBR-II) for Hanford Engineering Development Laboratory HEDL P-19 experiment.
IFA-597.4/.5/.6 experiment was done within the framework of the Halden Reactor Project (HRP) to investigate the thermal performance and FGR characteristics of MOX fuel. The main objective was to gather in-pile measurements of two MOX rods (Solid and hollow) that can be used for further analysis and give more insight about the behavior of MOX within thermal, water cooled reactors. Another objective was the investigation of the difference between the behavior of MOX in solid rods and the hollow rods.[2]
HEDL P-19 experiment took place in 1971 in EBR-II reactor to investigate the effect of initial fuel-to-cladding diametral gap sizes on the linear-heat-rate needed to cause incipient fuel melting (power-to-melt), Q'm, at beginning-of-life. Six-teen fresh MOX
fueled rods representative of the Fast Flux Test Facility (FFTF) driver fuel were irradiated in this test. The results can also be projected on FBR fuel as well. The rods were subjected to power ramps at a specific designed linear power to induce melting.
Some of the rods experienced melting and some did not. In this work, two rods P-19-2 (experienced melting) and P-19-5 (did not experience melting) were investigated.[3]
2 Theoretical background
2.1 Thermal conductivity of ceramic fuel
Thermal conductivity is a property representing the ability of a solid material to transfer heat. There are three phenomena considered when modelling thermal conductivity. Lattice vibrations, Radiation Heat Transfer and electronic conductivity [4]. Lattice vibration thermal conductivity (klatt) is modelled by assuming the solid to be an ideal gas consisting of phonons. Phonons are quasi particles representing the wave nature of the vibrating solid in the lattice. They tend to collide with each other and with defects in the crystal with a certain mean free path. They transport their energy as they translate in the medium from the hot side to the cold one. Thermal conductivity depends on the amount of energy a phonon can carry and the mean free path of the phonon[5]. Phonon’s mean free path should be inversely proportional to the temperature. Due to the presence of point defects in the crystal solid that acts as a barrier to phonon’s mobility, the mean free path cannot keep monotonically increasing as the temperatures gets lower[5]. This requires that the mean free path is inversely proportional to temperature plus an extra constant term representing phonon scattering with defects. Being proportional to the mean free path of the phonon, klatt would be written as:
Eq. 2-1
Where A, and B are constants, and T is the temperature in (K).
Heat is conducted as well with radiation on the form of electromagnetic waves. Energy is transported due to the movement of charged particles (protons and electrons) which emit some of their energy on the form of electromagnetic radiation[5][6]. Radiation term of thermal conductivity (Krad) is written on the form of a constant times the cube of temperature:
Eq. 2-2
At temperatures high enough, energy is sufficient to generate an amount of electron-hole pairs that contribute to thermal conductivity (Kel)[7].
Eq. 2-3
Where:
= Boltzmann constant, 1.38x10 (J/K) = electron charge, 1.6x10⁻¹⁹ (Coul)
= electron/hole contribution to electrical conductivity ( ) ( )
= energy gap between conduction and valence bands (J)
The first term on the right hand side of Eq. 2-3 is the conductivity effect of holes and electrons separately. The second term represents the ambipolar effect, which is the release of the kinetic energy of both the electron and the hole when they recombine together plus the release of their generation energy at areas of lower temperature leading to the transfer of heat electronically.
This equation can be simplified using some experimental data and assumptions to be written on the form:[4]
Eq. 2-4
Where D, E and n are constants. It should be noted that n differs from one model to another.
These physical principles of heat conduction and their equation forms are generally taken into account in the models even if they can be implemented in different ways. In general, all the thermal conductivity models implemented in fuel pin mechanic codes take the lattice vibration term into account and most of them will include one of the other two principle. Few models take all three principles into account.
2.2 Effect of temperature
Thermal conductivity of UOx and MOX is a property that depends on temperature. It has been noted experimentally that the thermal conductivity decreases with temperature until a minimum is reached in the range between (1500 to 2000) K as shown in Figure 2-1. This decrease is due to the lattice vibration term, which is inversely proportional to the temperature. At temperatures above the plateau range, the thermal conductivity begins to rise again due to the radiation and electronic term. Radiation heat conduction takes place above the plateau temperature even though it is not that much significant[5]. Electronic term of the thermal conductivity is the second term that is responsible for the increase of thermal conductivity.
As usual, the lattice vibration is implemented including other factors that affect the heat conductivity other than temperature (e.g. burn-up rate, deviation from stoichiometry, etc). Some models, take the radiation conduction term into consideration to explain the increase of thermal conductivity at higher temperatures, while others relate that increase to the electronic conduction term.
Figure 2-1 (U-Pu)y-Ox fuel total thermal conductivity along with its different
constituting components.
2.3 Effect of stoichiometry
The theoretical oxygen to metal ratio (O/M) between Uranium or Plutonium oxide (U-Pu)O2 is two. Deviation from this value is generally adopted by design and is induced in the nuclear fuel as effect of irradiation. The deviation can lead to hyper (>2) or hypo (<2) stoichiometric state of the fuel[8].
The effect of deviation from stoichiometry is generally modeled by assuming that this deviation causes more defects in the lattice. This perturbation is included in the constant A in Eq. 2-1 which represents the phonon-defect interaction in the lattice and determined originally for stoichiometric fuel conditions.
The modification of Eq. 2-1 due to deviation from stoichiometry can be written as:
Eq. 2-5
Where is the constant A for stoichiometric fuel and C is a constant multiplied by which is the deviation form stoichiometry (O/M-2). Therefore, the higher the deviation from stoichiometry, the lower the thermal conductivity becomes (Figure 2-2). Deviation from stoichiometry also affects the behavior of thermal conductivity with temperature. In facts, as the fuel deviates from stoichiometry the lower the temperature at which the thermal conductivity reaches its minimum. It can be noticed as well that the effect of deviation from stoichiometry is important at lower temperatures while at higher temperature where the ambipolar term is more important, the effect of deviation from stoichiometry is less significant.
Figure 2-2 (U-Pu)y-Ox conductivity: effect of deviation from stoichiometry on the
thermal conductivity.
2.4 Effect of burn-up
The irradiation process that takes place in a nuclear reactor leads to various changes in the properties of the fuel pellet. Defects in the lattice, porosity increase, deviation from stoichiometry and fuel cracking with irradiation leads to degradation of the thermal conductivity. This effect is important in fast reactors (FR) since burn-up can reach to more than 10% of the original weight content of the uranium and plutonium[8]. Solid fission products have different effects on thermal conductivity. In general, those that are dissolved tend to decrease the thermal conductivity, while those that are precipitated tends to increase it. Fission gases results in thermal conductivity degradation. The integral effect is however a degradation of conductivity with increasing burn-ups.
It is noticed as well that the higher the burn-up, the lower the rate of change of thermal conductivity with temperature Figure 2-3. Also as the burn-up increases, the lower the temperature for which the thermal conductivity reaches its minimum becomes before it increases again. At burn-up of 100
ty
, the thermal conductivity is slightly changing with temperature until the temperature is above 1500 K where the effect of the ambipolar term of thermal conductivity starts to rise. This behavior is explained by the increase of the defects in the solid due to irradiation. As a consequence of this, the phonon-defect interaction in the fuel dominates with respect to the temperature dependent phonon-phonon interaction term.
Figure 2-3 (U-Pu)y-Ox conductivity: effect of burn-up on the thermal conductivity.
2.5 Effect of fuel porosity
The presence of voids in the solid fuel pin leads to degradation of its thermal conductivity. A poreless fuel is required to obtain the maximum thermal conductivity. On the other side, the presence of pores in the fuel pin is important to accommodate the release of fission gases that are formed during irradiation. Fission gases can cause internal pressure of the fuel pin to increase leading to deformation and swelling of the fuel. This effect is more important for fast reactors than thermal reactors because the higher power density leads to more generation of fission gases [8].
The porosity (P) is defined as the volume of the pores inside the fuel divided by the total volume of the fuel this can be written as:
Eq. 2-6
Where is the smeared density of the fuel, and is the theoretical density of the fuel’s material without pores. The effect of porosity on thermal conductivity is considered by using a correction factor of the thermal conductivity. This factor has many formulations but the most used are the modified Loeb formula:
or the Maxwell-Eucken formula:
Eq. 2-8
Where is the thermal conductivity of the poreless fuel, α and β are constants. Theoretically, the values of α is 1 and β is 0.5. Experimentally, the noticed values of these factors are higher than what the theory predicts. This is due to the fact that the pores are not randomly distributed in the lattice[9]. The wide range of values used for the constants α and β shows that they are in fact variables that depend on the pore shape. The values assigned to them represents an average of the porosity effect.
2.6 Effect of Plutonium content
The effect of Plutonium on the constants A and B in the lattice vibration thermal conductivity term has been carefully studied. Evidence does not show any systematic trend for the variation of the constant A, while it shows a systematic increase of the constant B in Eq. 2-1. Overall the effect of increasing Plutonium’s content in the fuel is a decrease of the thermal conductivity of MOX fuel[5]. This decrease reaches up to 15% for a plutonium content of around 25 wt.%.
2.7 Summary of parameters affecting thermal conductivity
Table 2-1 summarizes the main factors affecting thermal conductivity of MOX fuel and the type of effect they have. The weight of the effect of each factor varies between different models as illustrated in later sections in the report for a variety of models.
Factor Effect
Temperature The main factor that is included in all the models and correlations.
Thermal conductivity decreases with Temperature upto (1500-1800 K) due to phonon-phonon interaction then increases again due to radiation and electronic conduction.
Deviation from
stoichiometry
Decrease or increase of stoichiometry (2±X) leads to a decrease in thermal conductivity.
Burnup Thermal conductivity degrades with burnup
Porosity The more decrease of the smeared density of the fuel from the theoretical density value, the lower the thermal conductivity becomes.
Plutonium content Increase the plutonium content of the fuel results in a degradation of the thermal conductivity of the fuel.
3 MOX fuel conductivity correlations
In this section, the Thermal conductivity correlations adopted in TRANSURANUS code to simulate MOX fuel conductivity[11], pen literature correlations and experimental data are from various open literature sources are compared with each other. More details about the studied correlations can be found in reference
3.1 TRANSURANUS correlations
3.1.1 Correlation by Van Uffelen and Schubert
This correlation is the standard recommended correlation by TU code. It is based on the data obtained experimentally by Duriez et.al where the laser flash technique was used to measure the thermal diffusivity of MOX fuel. The Pu content of the fuel was between 3-15wt.%, O/M ratio between 1.95 and 2.0 and in the temperature range between 700-2300K. The thermal conductivity was modeled by using values of the heat capacity calculated from Kopp’s law[10]. The ambipolar electronic thermal conductivity term is based on the work of Ronchi et.al in which they measured the thermal diffusivity and the heat capacity of UO2 for a temperature range between 500 and 1900°C using an advanced laser-flash technique that gave better results than conventional laser flash methods at high temperatures[15]. The correlation gives the thermal conductivity of MOX as a function of temperature and burn-up:
Eq. 3-1 Where a=0.0308 a1 =5.498x10⁻³ b=2.515 x10⁻⁴ b1= -2.498 x10⁻⁶ c= 4.715x x109 d=16361
T is in K and = min(1923,T), bu is the local burn-up in
The porosity effect can be taken into account using the following correction formula:
Eq. 3-2
This correlation has been assessed assuming different conditions. Due to the lattice vibration term, the correlation predicts a decrease of thermal conductivity for 0 fuel with temperature until it reaches a minimum around 2000 K and then begins to rise again due to the electronic heat conduction. The effect of burnup on the thermal conductivity is more important at lower temperature. At 800 K the thermal
conductivity decreased by 60% of its original value for un-irradiated fuel when the burnup reached 100
by
. For 2000 K, the thermal conductivity for the same range of burnup decreases only by 10%.
3.1.2 Correlation by Carbajo
This correlation is based on the work of Carbajo et.al. that takes basis for best value estimation of data available from open literature available recommendations given in other works. The physically based correlation by Lucuta et.al was recommended. It gives the thermal conductivity as a function of temperature, burn-up, and deviation from stoichiometry along with a porosity correction. The correlation takes the fuel irradiation into account as well as the effect of dissolved and precipitated solid fission fragments as a separate function from the un-irradiated fully dense fuel element[16]. The thermal conductivity for a 100%TD MOX fuel is given by
Eq. 3-3
Where
=0.035, =2.85, =0.286, b1= -0.715, c= 6400 and d=16.35 X is the deviation from stoichiometry,
= and T is the temperature in [K]
The factor FD represnts the negative effect of dissolved fission fragments on the thermal conductivity and is defined as:
Eq. 3-4
For >0 and
Eq.3-5
where
Eq.3-6
is the burnup in at.%
The factor FP represents the increase in thermal conductivity due to the precipitaed solid fission products:
The factor FR accounts for radiation effects. It is important below 900 K and reaches near unity rapidly above 900K and does not play a significant role above that temperautre.
Eq.3-8
The porosity effect is modelled using the Maxwell-Euckman correction formula
Eq.3-9 The correlation predicts a decrease of thermal conductivity with temperature due to lattice vibration until it reaches a minimum around 2000 K. Then, it begins to rise again due to the electronic heat conduction. It can be noticed as well the decrease of thermal conductivity with burnup. The effect of burnup on the thermal conductivity is more important at lower temperature. At 800 K, the thermal conductivity decreased by 40% of its original value for un-irradiated fuel when the burnup reached 10 at.%. For 2000 K, the thermal conductivity for the same range of burnup decreases by 15%.
It can be noticed that the lower the temperature, the higher the degradation of thermal conductivity with deviation from stoichiometry. For 800 K the thermal conductivity decreases by 30% for a deviation from stoichiometry of 0.05. At 2000 K for the same range of deviations, the decrease of thermal conductivity is around 8% and decreases more as the temperature goes higher.
3.1.3 Correlation by Lanning and Beyer
This correlation gives the thermal conductivity for 95%TD MOX according to Lanning and Beyer. The correlation is based on the work of Duriez et al.[10] It gives the thermal conductivity as a function of temperature, burnup and deviation from stoichiometry included in the lattice vibration term and another term for ambipolar thermal conductivity that is a function of temperature only.
The thermal conductivity for MOX 95%TD is given by:
Eq.3-10
Where:
T is in K and the burnup is in .
A porosity correction term according to Lucuta applies to obtain the thermal conductivity at different real densities. The porosity correction is on the form of Maxwell-Euckman formula:
Eq.3-11 The correlation predicts decrease of thermal conductivity with temperature until it reaches a minimum between 1850 and 1900 K then begins to rise again due to the electronic heat conduction. for a 95%TD of the fuel at different burnups. The effect of burnup on the thermal conductivity is more important at lower temperature The degradation of conductivity in the order of 40% at 800K (in the range 0 – 100MWd/kgHM). At 2000 K, the thermal conductivity for the same range of burnup decreases by 18%.
The more hypostoichiometric the fuel is, the higher the decrease of the thermal conductivity becomes. For a change of O/M from 2 to 1.95, the decrease in thermal conductivity can reach upto 30% at 800 K. This effect gets lower as the temperature goes high. At 2000 K and the reduction in thermal conductivity on the same range of change of O/M ratio is about 8%.
3.1.4 Correlation by Wiesenack.
Correlation 34 is the original Wiesenack’s correlation that is developed for UO2 fuel. In order to apply it for MOX, the correlation is multiplied by a correction factor of 0.92. The original correlation gives the thermal conductivity of MOX as a function of temperature and burnup on the form:
Eq.3-12
Where:
0.00188
There is no specific equation for porosity correction given for this model so the original MATPRO-11 porosity correction is used:
Eq.3-13
Where P is the porosity and
The correlation predicts a decrease of thermal conductivity with temperature until it reaches a minimum between 1700 and 1900 K. For un-irradiated fuel, the minimum of thermal conductivity is reached at 1900. The correlation indicates that as the burnup of the fuel increases, that minimum in thermal conductivity is reached at a lower temperature. The minimum in thermal conductivity at burnup of 100 is reached at a temperature range between 1500 to 1600.
The effect of burnup on the thermal conductivity is higher at lower temperature. At 800 K the thermal conductivity decreased by 55% of its original value for un-irradiated fuel when the burnup reached 100 . For 2000 K, the thermal conductivity for the same range of burnup decreases by 25%. The burn-up at temperatures higher than 2000K seems to have a constant effect. The amount of thermal conductivity decrease is the same regardless of the initial level of thermal conductivity.
3.2 Open Literature correlations
Several open literature correlations are described along with the variables that are considered.
3.2.1 Martin review 1982
In this work, Martin did a re-appraisal of four thermal conductivity correlations by (Washington, Aniscough, Killeen and Brandt) and chose one of them to do some amendments on. The correlation chosen was that based on Washington’s review in 1973. Even though the correlation by Killeen was the most physically based correlation for stoichiometric fuel, That of Washington was selected since there were no theoretical knowledge to apply the first one to non-stoichiometric fuel. The two correlations are close to each other at low and high temperature range, and even in the intermediate one, the deviation of Washington’s correlation from that of Killeen should not cause great errors[9]. The data available were reappraised and the few new data that appeared since the work of Washington were added to the review. The correlation seemed to be giving satisfactory results for UO2 and MOX as a function of temperature and O/M ratio.
The amended correlation can be written for hypostoichiometric MOX as:
The original correlations were tailored for UO2 and were adapted to MOX by assuming a correction factor of 0.95. The new correlation neglected the effect of irradiation in the temperature range of (500-2800 0C) and the effect of plutonium content. It took the O/M ratio into account in the lattice vibration term. The porosity correction was based on a modified Loeb formula for porosity level between (0< P <0.1) and based on Maxwell-Euckman formula in the range of (0.1< P <0.2).
The effect of deviation from stoichiometry is a degradation of the thermal conductivity. This effect is predicted from this correlation to be from 42% (at temperature of 800 K) to a value of 18% (at 2000K, it decreases with temperature) for a stoichiometry change between (2 and 1.95). The effect of stoichiometry keeps decreasing with temperature but it can be considered important on the whole range of normal operation of a thermal and fast reactor fueled with MOX.
3.2.2 FTHCON subscode-MATPRO
The correlation used by the FTHCON subroutine determines the thermal conductivity of un-cracked UO2 and MOX fuels as a function of temperature, O/M ratio and plutonium content of a solid fuel. It uses a porosity correction based on the Maxwell-Eucken relation. The burnup is used only to calculate the melting temperature of the fuel. Interpolation is used to remedy the discontinuity of the slope in the temperature range between (1364-2300 K) [7].
The correlation is on the following form:
Eq.3-15
Where:
K = Thermal conductivity (W/m.K) D = fractional theoretical density
= Phonon contribution to the specific heat at constant vlume (J/kg.K). MATPRO correlation for specific heat is used to calculate this factor.
= Linear strain caused by thermal expansion for temperatures above 300 K. MATPRO correlation for linear strain is used to calculate this factor for uranium and plutonium then the value is weighted according to the percentage of Plutonium in the fuel.
A =represents the point defect contribution to the phonon’s mfp. = 0.339 + 12.6X where X is the absolute value of the deviation from stoichiometry
B= a factor representing the phonon-phonon scattering contribution to the thermal conductivity. = 0.06867(1 + 0.6238 PU) where PU is the weight fraction of the plutonium content of the fuel.
= Fuel temperature if <1364.
For temperature higher than 1834 then
For intermediate range (1364<T<1834), linear interpolation is used to obtain the value of
= Fuel temperature if T<1800 2050 if T> 2300
Between (1800<T<2300) Linear interpolation is used to obtain the value of Even though the deviation from stoichiometry is included in the model as a parameter determining thermal conductivity, it is slightly sensible with respect to deviation from stoichiometry (compared to the other models). The maximum change of thermal conductivity at temperature of 500 K is less than 2% and decreases more with temperature to reach less than 0.3% at 3000 K.
The correlation predicts a change of thermal conductivity between (12 to 9)% with the plutonium content (0 to 30 wt.%) between 500K and 2250 K respectively. This shows a rate of decrease of (0.4 to 0.3%) for every unit wt.% increase in Plutonium content. The results shows that the thermal conductivity is more dependent on Plutonium content than on deviation from stoichiometry.
3.2.3 The COMETHE formulation-1982
This formula is used for UO2 and MOX fuels. It gives thermal conductivity of 95%TD fuel. A porosity correction is used to give the thermal conductivity at different porosities. It was enhanced to take the plutonium weight percentage into account based on the data from Gibby, Van Crynest and Weilbacher[17]. The formula is written as follows:
Eq.3-16
Where:
is given in (W/cm.K) T = temperature (K)
X = absolute value of deviation from stoichiometry q= Plutonium content = 40.05 = 129.4 = 16020 = 0.8 C = 0.6416x10⁻¹²
The model predicts a decrease in thermal conductivity at lower temperature of about 0.5% for every 1wt.% increase in the Plutonium content for stoichiometric fuel. The rate of decrease slightly decreases above 2000 K. The decrease of thermal conductivity with hypostoichiometry can reach up to 42% decrease in thermal conductivity at lower temperatures (800 K). This effect decreases with temperature to reach around 18% decrease with stoichiometric decrease from 2 to 1.95 at 2000 K.
For the whole range of temperatures of interest, the change of thermal conductivity with deviation from stoichiometry is higher than that due to increase of plutonium content of the fuel.
3.2.4 Baron Hervè 1995 Model
The model is a modification of the same model that originated in 1994. The modification concerns the high temperature term. It included originally a term relating high temperature conductivity to radiation. The modification substituted this term by another one that considers electronic thermal conductivity instead. This was done based on the work be Delette and Charles[17]. The model takes the temperature, deviation from stoichiometry, plutonium and Gadolinium content as variables. In order to apply this model to MOX fuel, the Gadolinium content should be set to zero in Eq.3-17. Eq.3-17 Where: =Boltzmann constant (1.38.10-23 J/K) W= (1.41*1.6)*10-19 J =4.4819.10-2(m.K/W), =4, =0.611 (m.K/W), =11.081(m.K/W) = 2.4544.10-4(m/W) , =0.8, =9.603.10-4(m/W), =-1.768.10-2(m/W) C=5.516.109(W.K/m) D=-4.302.1010(W.K/m) T is temperature in K up to 2600 K,
x is the absolute value of deviation from stoichiometry,
q is the plutonium weight content, and g is the Gadolinium weight content.
The model predicts the same effect of Plutonium as in the COMETHE formulation. Similar to the COMETHE formulation, the decrease of thermal conductivity with hypostoichiometry can reach up to 42% decrease in thermal conductivity at lower temperatures (800 K). This effect decreases with temperature to reach around 18% decrease with O/M ratio decrease from 2 to 1.95 (2000 K). For the whole range of temperatures of interest, the change of thermal conductivity with deviation from stoichiometry is higher than that due to the increase of plutonium content of the fuel.
3.3 Experimental data and correlations
The correlations presented in the previous sections are compared with experimental data from a variety of sources.[10][18][19]
The comparison is done at different states of the modeling parameters used in the different correlations to be able to understand how sensitive the models are to those parametric changes and how much do they agree with the experimental data at the different levels of the modeling parameters. All the comparisons with experimental data are done at zero burn-up since there were no other data possessed at higher burn-up values. In order to distinguish the TRANSURANUS models from the open
literature correlations, the figures mentioned hereafter are plotted with this logic: solid lines will represent TU correlations while the open literature correlations are in dotted lines.
Table.3-1 summarizes the difference between all the studied models in terms of the parameters they take into account. Table.3-2 summarizes the data sources used in each subsection and their details.
Name of the correlation Temperature Deviation from stoichiometry Burn up Plutonium
content Porosity Source
Van Uffelen and Schubert Standard TU Carbajo TU Lanning and Beyer TU Wiesenack TU Martin OL Matpro OL COMETHE OL Baron Hervè OL
Table.3-1 Summary of thermal conductivity correlations for MOX.
Data source Year Temperature range
Number of
points Levels of parameters
Van Crynest 1968 813-2188 22
100% TD, O/M=2, Pu= 20 wt.%
Fukushima 1983 826-1817 29
Hetzler 1987 1066-2143 20
Van crynest &
Weilbacher N/A 813-2175 26 95%TD, O/M=2, Pu= 20
wt.% Gibby 1969 825-1882 46 Schemidt 900-16445 9 Gibby 1969 917-2244 13 95%TD, O/M=1.98, Pu= 20 wt.% Weilbacher 1972 893-2685 9 Bonnoret 1988 1163-2291 20 Gibby 1969 770-1423 13 95%TD, O/M=1.93, Pu= 20 wt.% Schemidt N/A 1110-2054 9
Van crynest &
Weilbacher N/A
785-2026
6
Weibacher 1972 778-2370 8
Duriez 2000 817-2089 32 96%TD, O/M=2, Pu= 6
wt.% Industrial MIMAS
Sample N/A 812-2083 43
1-Comparison at 100% TD, O/M=2, Pu= 20 wt.%
The correlations are compared with experimental data from three sources, Figure
3-1. It can be noticed that the data from Van crynst and Hetzler have a large spread that almost covers the whole range of variation between the studied correlations. The data from Fukushima are more precise and it can be seen that Martin’s correlation matches it in a quite good manner but in general, no decision with sufficient accuracy can be made from these data.
Figure 3-1 MOX thermal conductivity: comparison between correlations and experimental data for 100%TD, O/M=2, PU=20 wt.%.
2- Comparison at 95%TD, O/M=2, Pu= 20 wt.%
The correlations are compared with experimental data from three sources in Figure
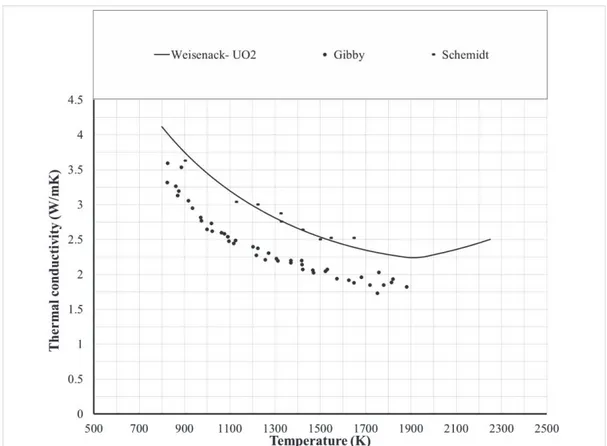
3-2. The data from Van Crynest and Weilbacher have a large spread and spans the whole range of experimental data. A conclusion cannot be made base on their uncertainty. The data from Schemidt and Gibby are more accurate but are in opposite directions from each other’s. While Schemidt’s data are higher than all the studied correlations, Gibby’s data are lower than all of them. There is a preference given to Gibby’s data for two reasons: the first is the larger number of data points and the wider range of temperature covered. The second comes from the fact that Wiesenack’s correlation was designed for UO2 fuel then multiplied by a factor of 0.92 to fit it to MOX. The data from Schemidt then would predict a thermal conductivity of MOX that is equal to or even higher than UO2 (Figure 3-3) which contradicts the fact that the conductivity of MOX is lower than that of UO2.
Figure 3-2 MOX thermal conductivity: comparison between correlations and experimental data for 95%TD, O/M=2, PU=20 wt.%.
Figure 3-3 MOX thermal conductivity: comparison between Wiesenack correlation and experimental data for 95%TD, O/M=2, PU=20 wt.%.
3-Comparison at 95%TD, O/M=1.98, Pu= 20 wt.%
The correlations are compared with experimental data from three sources Figure 3-4. The included data are more precise than the previous cases and it can be noticed that the Baron-Hervè correlation has a good match with the data from Weilbacher and Gibby. Other correlations have a good match with the data from Bonnoret and weibacher data at higher temperatures. The TU correlations that do not take deviation from stoichiometry into account and Matpro correlation are higher than all the experimental data except for Van Uffelen and Schubert that matches the experimental data above 2000 K.
Figure 3-4 MOX thermal conductivity: comparison between correlations and experimental data for 95%TD, O/M=1.98, PU=20 wt.%.
4-Comparison at 95%TD, O/M=1.93, Pu= 20 wt.%
This is an extreme case and is reported here for clarifying the dependence of thermal conductivity on O/M ratio. A large deviation from stoichiometry leads to a drastic decrease in thermal conductivity as shown in Figure 3-5. It is clear that the correlations that do not take deviation from stoichiometry into account will fail to match the thermal conductivity measurements experimentally. The rest of the correlations that takes deviation from stoichiometry into account will generate a better prediction of the thermal conductivity. It is therefore visible that deviation from stoichiometry is an important factor that should be taken into account in any thermal conductivity correlation that aims to simulate non-stoichiometric fuel.
Figure 3-5 MOX thermal conductivity: comparison between correlations and experimental data for 95%TD, O/M=1.93, PU=20 wt.%.
5-Comparison at 95%TD, O/M=2, Pu= 6 wt.%
A comparison is made between the correlations and experimental data from Duriez and an industrial sample prepared used the MIMAS process (Micronized MAster blend). The process aims to producing soluble fuel that would be reprocessed to a final product that fulfills the requirements for LWR MOX fuel.[20] It can be seen (Figure
3-6) that TU thermal conductivity correlations fits well both the laboratory prepared sample of Duriez and the sample from industry. This gives an evidence of the ability of these correlations to predict the behavior of stoichiometric LWR MOX with low plutonium content. Open literature correlations seems to over-predict the thermal conductivity at lower plutonium contents except for Baron-Hervè correlation that is comparable to the samples data.
Figure 3-6 MOX thermal conductivity: comparison between correlations and experimental data for 95%TD, O/M=2, PU=6 wt.%.
3.4 Conclusive remarks
Thermal conductivity of MOX fuel is one the parameters that govern the prediction of fuel temperature whose prediction is of great relevance to any integral fuel pin simulation. There are three mechanisms of heat conduction relevant to MOX; Lattice, Radiation and electronic conduction. Correlations used to predict thermal conductivity always consider Lattice conduction and combine it with one of the two other mechanisms to predict the conduction at higher temperatures.
There are several parameters that governs the thermal conductivity. The main parameter is the temperature that is included in all the correlations. In particular, thermal conductivity decreases with increasing the temperature up to (1500-1800 K) then starts to increase again due to enhancement of conduction due to radiation or electronic conduction phenomena.
Other parameters such as (Burnup, deviation from stoichiometry, Pu content) may or may not be included in a correlation and they vary in their importance. Therefore, it is important to investigate how critical is it not to include a certain parameter and how the correlations with different parameters deviate from each other’s:
· Porosity obviously degrades the thermal conductivity
· Thermal conductivity always decreases with deviation from stoichiometry · Thermal conductivity degrades with burnup.
It is important to note that thermal conductivity is more sensitive to all the investigated parameters at lower temperatures. As the temperature increases, the degradation of thermal conductivity is less sensitive to the variation of the studied parameters.
TU code includes four correlations that are used to predict the MOX fuel conductivity. They all account for temperature, porosity and burn-up as parameters. Two of them include deviation from stoichiometry. The correlations of TU do not include Plutonium content.
Four other open literature correlations were investigated and compared with the ones from TU. They do not include burnup as a factor but they include the plutonium content parameter. All of the open literature correlations include the deviation from stoichiometry, porosity and temperature as factors.
Comparing the correlations from both sources together gives some inferences related their sensitivity to various parameters. At stoichiometric conditions the correlations deviate from each other, especially in the low temperature zone. This is due to the different data on which the correlations are based and the different parameters and their weighted effect in total.
As the deviation from stoichiometry increases, the variation increases between the two TU correlations that do not include deviation from stoichiometry and all the other correlations. The thermal conductivity is much less sensitivity to variation in Pu content.
In order to confirm the results of the comparison between the correlations, experimental data were collected at different levels for each of the parameters. The role of experimental data is to judge which correlation predicts the variability with a certain parameter accurately. This was done for all the parameters except for burn-up due to non-possession of thermal conductivity data for MOX fuel at higher burn-up than zero.
The comparison confirmed the importance of deviation from stoichiometry. The correlations that do not include it will introduce a significant error if used for hypostoichiometric fuel. To sum up, A thermal conductivity correlation should include Burnup and deviation from stoichiometry which are important parameters to be included. Pu content is not that significant and could be neglected without critical errors. Porosity is taken into account as a correction factor with many formulas. Thermal conductivity at higher temperature is preferred to be modelled by electronic conduction mechanism but there is not enough data to prove it experimentally.
4 TRANSURANUS code
TRANSURANUS is a code developed by the institute of Transuranium elements to be used for the thermal and mechanical analysis of nuclear fuel rods.[11][13] The code includes a lot of physical models and numerical algorithms to predict the thermal and mechanical properties of the fuel rods and their effects on each other. In the next subsections, some details related to thermal, mechanical, and burn-up modelling by the code are extracted from the code’s manual for illustration purpose.[11] The code is a quasi 2D model which relays basically on the concept of superposition of 1D radial and axial analysis. The physical phenomena modelled are covered by many available models for different materials used in fuel, cladding and structure material of the rod that are valid over the various operation conditions of the rods and different time range of the states in which the rod exists from milliseconds to years. The code can be used for both deterministic and probabilistic analysis.
The choice of the desired models of the different materials is fee to the code by the usage of an input file that dictates to the code the kind of analysis to be done (Deterministic or probabilistic), The reactor type, fuel and cladding types and the details of their construction parameters on the macro and micro scales. It also informs the code whether structure materials are modelled or not, the numerical algorithms to be used and the time steps and the boundary conditions of the modelled situation etc. The results of the analysis are then stored in output subroutines that can be summoned both numerically and visually using a plotting tool as a function of time for discrete axial locations in the rod or as integral values, a function of axial position of the rod, or as a function of radius at different axial positions.
The capabilities of the TRANSURANUS code can be summarised as follows:
· Analysis of all fuel rod types under normal, off-normal and accident conditions (deterministic and probabilistic) is in principle possible.
· Consistent steady-state and transient analysis.
· Clearly defined mechanical-mathematical framework into which physical models can easily be incorporated.
· Fast and reliable.
· Database, models and code extensively verified.
· Applied by different groups and different licensing authorities. More details are available in Refs. [11][13]
5 Analysis of LWR MOX: IFA-597 experiment
5.1 Description of the experiment
5.1.1 Background and objective of the experiment
Within the scope of the current work, it is important to give a brief description of IFA-597.4/.5/.6/.7. There were different stages of irradiation that were done in Halden reactor between July 1997 to January 2002. The experiment involved the irradiation of two MOX rods. One is a solid rod with four annular pellets on top to allow the accommodation of fuel center thermocouples. The other rod was a complete hollow pellets rod. Along with the thermocouples used to measure the centerline temperature, pressure bellows transducers were instrumented to provide data of the pressure along the time span of the experiment.[2]
The main purpose of IFA-597.4/.6 was to study the thermal behavior of MOX including fission gas release mechanisms (FGR) when subjected to normal operation. This was done in a single cluster rig that contained both rods. Subjecting them to the same conditions allowed the investigation of the different behavior of FGR of both kinds of rods. Deliberate power uprating was done in order to cause opening in the interlinkage at the grain boundaries of the fuel lattice. That would lead to significant gas release through these interlinked tunnels. This was done at 10 MWD/KgMOX for IFA-597.4 and at 22.27 MWD/KgMOX for IFA-597.6.
In IFA-597./5./7, the objective was to accumulate Fission gases in the matrix; Hence FGR was to be avoided. In order to avoid FGR, The rig was shifted outwards in the core to reduce the power. Several UO2 rods that were irradiated up to 13 MWD/KgUO2 in IFA-597.1 were added to the rig along with the MOX rods. Four UO2 rods were added in IFA-597.5. Three rods were used in IFA-597.7 to restrict FGRs. During IFA.-597.5/.7 the power level was maintained low in the MOX rods and no significant FGR was noticed.
Since the FGR during IFA-597./6 was higher than expected and could not be explained, IFA-597.7 was decided to be unloaded. The experiment stopped in January 2002. The focus in this report is on IFA-495.4./5 because of the unexpected behavior in IFA-597.6 and the termination of IFA-597.7
5.1.2 Halden Boiling Water Reactor (HBWR)
HBWR is a reactor located in Halden in the south of Norway near its borders with Sweden.[21] The reactor is a natural circulation heavy boiling water reactor. The maximum power of the reactor is 25 MW (thermal). Water temperature is 240°C pressurized to 33.3 bar. The reactor vessel primary circuit system dwells inside a rock cavern that is 30-60 m thick with a net volume of 4500 m3. The reactor pressure vessel is made of carbon steel and is cylindrically shaped. The round shaped bottom and the cylindrical portion are cladded with stainless steel. A schematic diagram of the reactor, pressure vessel and operation data can be seen in Figure 5-1.
The reactor facilities have then been subjected to a huge development until it became one of the most versatile in the world. Through these developments, around 300 in-pile experiment took place on different levels of complexities and purposes. The facility has high pressure loops with light water provided for testing under prototypic BWR and PWR conditions. In order to provide experimental variation of void fraction in the assemblies an external sub cooler loop is installed. The central location of the core is occupied by the emergency core cooling tubes.[23]
The source of the fuel charge is test fuel from participant organizations in member countries of the reactor project and a driver fuel assemblies used for providing reactivity needed for operation purpose. The core consist of 110-120 fuel assemblies. The test fuel is located in an open hexagonal lattice of a pitch 130 mm (Figure 5-2). The maximum height of the fuel section is 1710 mm. Currently, driver fuel assemblies consist of eight to nine fuel rods with 6% enrichment. The standards and specifications and main parameters of the facility are included in Table 5-1
Assembly Unit Quantity
Shroud material -- Zr-2
Shroud ID mm 71
Shroud thickness mm 1
Number of rods per assembly
-- 8
Pitch circle diameter mm 50
Length from lowest pellet in lower rod to highest pellet in upper rod
mm 810
Fuel material -- UO2
Fuel enrichment % 6
Pellet density g/cm3 10.52
Pellet OD mm 10.49
Pellet height mm 8.6-10.8
Length of natural fuel per rod
mm 12
Active length mm 748-811
Cladding material -- Zr-2, Zr-4
Cladding ID mm 10.67
Cladding wall thickness mm 0.8
Nominal gap mm 0.16-0.18
Figure 5-1 HBWR, schematic diagram and main operation parameters. [21]
![Figure 5-2 HBWR, plan view of the reactor top lid and main parameters. [21]](https://thumb-eu.123doks.com/thumbv2/123dokorg/5614400.68285/47.892.126.775.776.1072/figure-hbwr-plan-view-reactor-lid-main-parameters.webp)
![Figure 5-3 IFA-597 experiment, schematic radial view of the test rig. [2] 5.1.4 Linear Heat rating (LHR)](https://thumb-eu.123doks.com/thumbv2/123dokorg/5614400.68285/49.892.210.671.117.381/figure-ifa-experiment-schematic-radial-linear-heat-rating.webp)