RESEARCH
Genome-wide methylation analysis
demonstrates that 5-aza-2-deoxycytidine
treatment does not cause random DNA
demethylation in fragile X syndrome cells
Elisabetta Tabolacci
1†, Giorgia Mancano
1†, Stella Lanni
1, Federica Palumbo
1, Martina Goracci
1, Fabrizio Ferrè
2,
Manuela Helmer‑Citterich
2and Giovanni Neri
1*Abstract
Background: Fragile X syndrome (FXS) is caused by CGG expansion over 200 repeats at the 5′ UTR of the FMR1 gene and subsequent DNA methylation of both the expanded sequence and the CpGs of the promoter region. This epigenetic change causes transcriptional silencing of the gene. We have previously demonstrated that 5‑aza‑2‑deox‑ ycytidine (5‑azadC) treatment of FXS lymphoblastoid cell lines reactivates the FMR1 gene, concomitant with CpG sites demethylation, increased acetylation of histones H3 and H4 and methylation of lysine 4 on histone 3.
Results: In order to check the specificity of the 5‑azadC‑induced DNA demethylation, now we performed bisulphite sequencing of the entire methylation boundary upstream the FMR1 promoter region, which is preserved in control wild‑type cells. We did not observe any modification of the methylation boundary after treatment. Furthermore, methylation analysis by MS‑MLPA of PWS/AS and BWS/SRS loci demonstrated that 5‑azadC treatment has no dem‑ ethylating effect on these regions. Genome‑wide methylation analysis through Infinium 450K (Illumina) showed no significant enrichment of specific GO terms in differentially methylated regions after 5‑azadC treatment. We also observed that reactivation of FMR1 transcription lasts up to a month after a 7‑day treatment and that maximum levels of transcription are reached at 10–15 days after last administration of 5‑azadC.
Conclusions: Taken together, these data demonstrate that the demethylating effect of 5‑azadC on genomic DNA is not random, but rather restricted to specific regions, if not exclusively to the FMR1 promoter. Moreover, we showed that 5‑azadC has a long‑lasting reactivating effect on the mutant FMR1 gene.
Keywords: Fragile X syndrome, FMR1 gene, Epigenetic modifications, DNA methylation, In vitro pharmacological demethylation, Whole methylation analysis, 5‑aza‑2‑deoxycytidine
© 2016 Tabolacci et al. This article is distributed under the terms of the Creative Commons Attribution 4.0 International License (http://creativecommons.org/licenses/by/4.0/), which permits unrestricted use, distribution, and reproduction in any medium, provided you give appropriate credit to the original author(s) and the source, provide a link to the Creative Commons license, and indicate if changes were made. The Creative Commons Public Domain Dedication waiver (http://creativecommons.org/ publicdomain/zero/1.0/) applies to the data made available in this article, unless otherwise stated.
Background
Fragile X syndrome (FXS; OMIM #300624), the most common cause of inherited intellectual disability, is caused by the absence of FMRP (fragile X mental retar-dation protein). This loss of function mutation causes
dendritic spine dysgenesis [1]. FXS is almost invari-ably due to a dynamic mutation, i.e. a large expansion (full mutation, FM) of an unstable CGG repeat in the 5′-untranslated region (5′-UTR) of the FMR1 gene. The CGG expansion is followed by DNA methylation of the 5′-UTR of the gene, which causes FMR1 transcriptional inactivation and absence of the FMRP protein [2–4]. Despite the knowledge of the epigenetic characteristics of the expanded FMR1 gene, the molecular mechanisms underlying its silencing are not currently known in detail. The DNA methylation likely represents the main
Open Access
*Correspondence: [email protected]
†Elisabetta Tabolacci and Giorgia Mancano have contributed equally to the manuscript
1 Istituto di Medicina Genomica, Università Cattolica del Sacro Cuore, Largo F. Vito 1, 00168 Rome, Italy
epigenetic mark that switches off the expanded gene. The existence of rare individuals of normal intelligence carriers of unmethylated full mutation (UFM) supports both the crucial role of DNA methylation in silencing the expanded FMR1 gene and the possibility of transcrip-tion of an expanded allele (over 200 CGGs) [5]. Cell lines derived from these individuals might reflect the status of FXS cells before epigenetic silencing, which is thought to occur at about 11 weeks of gestation [6]. Indeed, the epigenetic characterization of their FMR1 locus showed histone H3 and H4 hyperacetylation, lysine 4 of histone 3 (H3K4) methylation, lysine 9 of histone 3 (H3K9) hypo-methylation, lysine 27 of histone 3 (H3K27) dimethyla-tion and lack of DNA methyladimethyla-tion [7, 8]. This epigenetic status is compatible with an euchromatic conforma-tion of the FMR1 locus, allowing transcripconforma-tion. A simi-lar epigenetic status can be induced by treatment of FXS cells with the DNA demethylating agent 5-aza-2-deoxy-cytidine (5-azadC), which also causes histone changes (H3 and H4 hyperacetylation, H3K4 methylation) that actually precede DNA demethylation [9–11]. In accord-ance with these results, silencing of FMR1 in human embryonic stem cells seems to begin from histone modi-fications prior to DNA methylation [12]. Urbach and col-leagues showed that FMR1 locus in induced pluripotent stem (iPS) cells derived from FXS individuals is hyper-methylated, thus suggesting that its methylation, once established, is stable and not revertible through repro-gramming techniques [13]. Recently, iPS cells derived from fibroblasts of an UFM individual were found to be methylated after reprogramming, possibly as conse-quence of in vitro manipulation [14]. The DNA methyla-tion is not widespread, but localized only at the FMR1 locus in FXS lymphocytes and iPS cells [15]. Naumann et al. demonstrated the presence of a DNA methylation boundary, 650–800 nucleotides upstream of the CGG repeat [16]. This boundary separates, in normal cells, a hypermethylated upstream region from the unmethyl-ated FMR1 promoter, protecting it from the spreading of DNA methylation and apparently lost in FXS individu-als, but not in UFM cell lines [17, 18]. The methylation boundary is thought to have a role in chromatin remod-elling of the FMR1 locus by recruiting a number of pro-teins [16], such as CTCF (CCCTC-binding factor), the first insulator protein found in mammals [19]. Its role in regulating the FMR1 gene expression was recently defined, suggesting a complex mechanism via chromatin loop formation [17]. CTCF does not bind to methylated FM alleles, and binding is not restored by pharmaco-logical demethylation with 5-azadC. This result might be explained by failure of drug-induced DNA demethyla-tion to reverse all modificademethyla-tions that occur during gene silencing. As observed on MLH1 and p16 gene, 5-azadC
treatment did not completely restore normal histone code and post-translational modifications of DNA bind-ing proteins to reestablish long-term expression [20, 21]. We previously observed that transcriptionally reactivated FXS cell lines restored epigenetic changes consistent with an euchromatic status, without fully reaching the euchro-matic configuration typical of normal control cell lines [11]. We demonstrated that 5-azadC-induced demethyla-tion is partial and transient. After 4 weeks from 5-azadC withdrawal, the FMR1 promoter resumed its methylated status [10]. We also showed that inhibitors of histone deacetylases potentiate the effect of 5-azadC, without allowing a substantial reactivation of the gene [22]. These experiments suggest that DNA methylation is dominant over histone modifications in determining the transcrip-tional inactivation of the mutant FMR1 gene. This con-clusion was confirmed by further experiments, studying the modest reactivating effect of valproic acid (VPA), which acts as inhibitor of histone deacetylases without DNA demethylation [23].
In this report, we describe treatments with 5-azadC of WT and FXS lymphoblastoid cell lines to improve our knowledge of the molecular mechanisms through which this compound induces DNA demethylation and FMR1 transcriptional reactivation. Specifically, the main aim was to evaluate the possible diffusion of demethylation effect to other loci, different from FMR1. Additionally, we analysed the reactivating effect over an extended period of time. Our present findings may have implications for the possible use of 5-azadC as a FMR1 reactivating drug in vivo.
Results
Duration of the FMR1 reactivating effect of 5‑azadC
This study aims also at clarifying the duration of 5-azadC effect by measuring the level of reactivation of FMR1 at different time points throughout 1 month after discon-tinuation of the treatment.
The transcriptional reactivation levels of FMR1 and the translational expression of FMRP in 5-azadC-treated cell lines are illustrated in Fig. 1. Two independ-ent treatmindepend-ents of FXS1 cell line (around 250 CGGs) induced a reactivation of the FMR1 transcriptional activity around 30 % with respect to normal control at T1, with a maximum level at T2, T3 and T4 followed by a progressive decrease (Fig. 1a). Two independ-ent treatmindepend-ents on FXS2 cell line (around 450 CGGs) resulted in a reactivation level slightly lower 20 % at T1, with a maximum average reactivation of 40 % at T3, compared with the untreated WT. Afterwards, there was a decrease in transcript, which became undetecta-ble at T7 (Fig. 1b). A slight increase in FMR1 gene tran-scriptional activity was observed in 5-azadC-treated
WT1 cells, which persisted until 22–25 days after end-ing the treatment (Fig. 1c). The same trend of transcrip-tional activity was observed for WT2 cell line (data not shown).
In order to determine whether the newly detected transcriptional activity was paralleled by restoration of the translation, Western blot analysis was performed
on protein lysates. We observed a slight restoration of the FMRP expression in FXS1 and FXS2 after 7 days of 5-azadC treatment (T1), while it was no longer detecta-ble after 29 days (T7) (Fig. 1d). This pattern overlaps with that of transcription observed by qRT-PCR. This is the first report of a partial FMRP expression in a FXS cell line after treatment with 5-azadC through Western blot.
Fig. 1 Transcriptional and translational data after 5‑azadC treatment. The upper panel reports the scheme of 5‑azadC treatment with the relative
time points. Relative quantification of FMR1‑mRNA by RT‑PCR after two independent treatments (n = 2) with 5‑azadC of FXS1 (a) and FXS2 (b) cell lines showed increased FMR1‑mRNA expression at T2–T3, decreasing at T6 and T7. The reactivation pattern in WT1 cell line was substantially unmodified after 5‑azadC treatment (c). The transcriptional reactivation levels are expressed in percentage of the untreated WT cell line, arbitrarily set at 100 %. Western blot with antibody against FMRP and GAPDH on FXS1 and FXS2 cell extracts showed that after 7‑day treatment with 5‑azadC (T1) the expression of FMRP was restored and disappeared after 22 days (T7) from the end of the treatment. After 5‑azadC treatment FMRP levels did not reach those of untreated WT
To study whether the persistent reactivating effect induced by 5-azadC is associated with post-translational histone modifications at the FMR1 locus, we performed chromatin immunoprecipitation (ChIP) assays followed by quantification of immunoprecipitated DNA (IP-DNA) at different time points. Methylation levels of euchro-matic (H3K4me2 and H3K27me2) and heterochroeuchro-matic (H3K9me2 and H3K27me3) markers of both untreated and treated FXS2 cell line are shown in Fig. 2. The meth-ylation level of H3K4me2 is significantly increased at T1, followed by gradual decrease at T6, both in the pro-moter and in exon 1 (Fig. 2a, b). The methylation profile of dimethylated H3K27 is similar to that of H3K4me2 at both time points, except for exon 1 region at T6 which persists elevated (Fig. 2c, d). Even if statistically not sig-nificant (untreated vs treated, p > 0.1), the difference is in the expected direction. Overall, both euchromatic mark-ers show a trend that is concordant with the observed transcriptional activity of the gene. The methylation levels of H3K9me2 were substantially stable (Fig. 2e, f). The observed differences were not statistically signifi-cant (p > 0.1) at both time points and regions. Despite the lack of statistical significance, the trimethylation level of H3K27 (H3K27me3) in the promoter region was in accordance with the transcriptional activity of FMR1, being slightly lower at T1 than at T6 in the promoter region (Fig. 2g). Unexpectedly, we observed a substantial (p < 0.1) opposite trend in exon 1 (Fig. 2h).
Evaluation of the 5‑azadC demethylating effect
The study of genomic DNA methylation after 5-azadC treatment was performed by bisulphite sequencing, MS-MLPA of imprinted loci and whole-genome methylation analysis in order to study methylation at different levels, for specific loci and genome wide.
Bisulphite sequencing of the methylation boundary
The demethylating effect of 5-azadC on the genomic regions including part of the CpG island of the FMR1 promoter (cytosine 45 through 54) and of the methyla-tion boundary [16] was assessed through bisulphite DNA transformation of treated and untreated WT and FXS cell lines. As expected, we observed the presence of the meth-ylation boundary in the untreated WT1 cell line clones, which is lost in the untreated FXS1 cell line (Fig. 3a, b,
upper panels), as already described by Naumann et al. [16]. After the treatment with 5-azadC, the methylation profile of WT1 did not substantially change, despite the presence of 3 out of 21 clones unmethylated (Fig. 3a, bot-tom panel). In the FXS1 cell line, the 5-azadC treatment changed radically the methylation profile of this region: the promoter region became demethylated, as previously demonstrated by Pietrobono et al. [10], while the region upstream the methylation boundary was not affected, preserving its methylated status (Fig. 3b, bottom panel).
FXS2 behaved essentially in the same way (Additional file 1: Figure S1), even though the demethylation effect of the 5-azadC treatment was lower than that observed for the FXS1 cell line, according to the lower levels of FMR1 transcriptional reactivation and to the CGG expansion of around 450 triplets (Fig. 1b).
MS‑MLPA of imprinted loci
To further evaluate the methylation status of the FMR1 locus, as well as of imprinted loci at chromosomes 15 and 11, MS-MLPA was performed in both untreated and 5-azadC-treated cell lines, according to the scheme reported in Fig. 1 (top panel). In particular, MS-MLPA is a semi-quantitative method for methylation profiling, which briefly consists in hybridization of loci-specific probes to the denatured genomic DNA and then diges-tion with a methyladiges-tion-sensitive endonuclease.
The first locus analysed was FMR1 (Additional file 2: Table S1). The methylation profile of the untreated and treated (T1, T3 and T8) WT1 and WT2 cell lines dem-onstrated the absence of methylation in exon 1, while the other exons retained their methylation status. No sub-stantial changes were observed in the methylation profile after 5-azadC treatment, except for exon 7, which became partially demethylated, at least at T1 and T3. The FXS1 untreated sample had a high methylation level, which was reduced by 5-azadC treatment at T1 and T3, both in exon 1 and exon 7. The methylation level was restored to its normal level at T8. FXS2 cell line behaved in the same way, even though the level of DNA demethylation in exon 1 at T1 was less marked.
In order to have a more comprehensive view of the effect of 5-azadC on other methylated loci, the PWS/ AS locus on chromosome 15 and the BWS/SRS locus on chromosome 11 were analysed by MS-MLPA in WT1, (See figure on next page.)
Fig. 2 ChIP analysis of euchromatic and heterochromatic markers at the FMR1 locus. Quantification of IP‑DNA by real‑time PCR after immuno‑
precipitation with antibodies against euchromatic markers (H3K4me2 and H3K27me2) in the promoter (a, c) and exon 1 (b, d) regions of FMR1, respectively, positively correlated with the level of transcriptional reactivation observed by quantitative RT‑PCR. Heterochromatic markers (H3K9me2 and H3K27me3) in the promoter (e, g) and exon 1 (f, h) regions of FMR1, respectively, proved to be relatively stable after treatment with 5‑azadC even though the trend was in accordance with the transcriptional data. These results refer to two separate ChIP assay performed on cells from two independent experiments on FXS2 cell line at T1 and T6 (n = 2). The statistical analysis was conducted using the Kruskal–Wallis nonparametric test (p < 0.1)
WT2, FXS1 and FXS2 cell lines. In all cell lines, we did not observe any substantial change in the methylation profile of either locus after the pharmacological treat-ment (Tables 1, 2).
Additionally, to rule out a possible effect of the dem-ethylating agent on the inactive (methylated) X chromo-some, we also treated three different female WT cell lines (WTA, WTB and WTC) with 5-azadC and subsequently analysed the methylation profile of FMR1 by MS-MLPA
(Table 3). The results of this analysis of the two imprinted loci PWS/AS and BWS/SRS are detailed in Additional file 3: Table S2 and Additional file 4: Table S3. Once again, the pharmacological treatment does not seem to affect the methylation levels in any of the analysed regions.
Whole‑genome methylation analysis
In order to investigate the demethylating effect of 5-azadC on global DNA, we performed a whole methylation study (See figure on previous page.)
Fig. 3 Bisulphite analysis of the FMR1 methylation boundary after 5‑azadC treatment. A scheme of the methylation boundary in the 5′ UTR of the FMR1 locus is reported in the upper part of the figure. Bisulphite sequencing of the methylation boundary including the CpG island of the FMR1
promoter region before (upper panel) and after treatment (bottom panel) with 5‑azadC for 7 days of WT1 revealed no substantial modification of the methylation profile (a), while an almost complete demethylation of the promoter region that does not affect the methylation boundary was observed in FXS1 after treatment (b). The methylation boundary is indicated by the arrow
Table 1 MS-MLPA analysis of the imprinted locus Prader–Willi/Angelman (PWS/AS) on chromosome 15 for WT, WT2, FXS1 and FXS2 before and after treatment with 5-azadC (1 µM) at three different time points (T1, T3 and T8)
Only methylation-sensitive probes are listed
Note that the asterisks indicate that the magnitude of the probe ratio exceed the set of arbitrary border values. The italic values represent levels of methylation lower than 30 %, while bold italic values represent those between 30 and 70 %
Probes WT1 UT ratio WT1 T1 ratio WT1 T3 ratio WT1 T8 ratio
15‑021.5 NDN 0.48 0.30≪ 0.25≪ 0.59 15‑022.9 SNRPN 0.56 0.43≪ 0.51 0.48 15‑022.9 SNRPN 0.57 0.35≪ 0.41 0.45 15‑022.9 SNRPN 0.58 0.31 ≪* 0.36 ≪* 0.5 15‑022.9 SNRPN 0.41 0.18 0.3 0.22 15‑023.2 UBE3A Exon 1 0 0 0 0
Probes WT2 UT ratio WT2 T1 ratio WT2 T3 ratio WT2 T8 ratio
15‑021.5 NDN 0.48 0.24≪ 0 0.37 15‑022.9 SNRPN 0.52 0.4 0.47 0.61 15‑022.9 SNRPN 0.52 0.39 0.44 0.55 15‑022.9 SNRPN 0.5 0.36≪ 0.47 0.57 15‑022.9 SNRPN 0.41 0.19≪ 0.26 0.32 15‑023.2 UBE3A exon 1 0 0 0 0
Probes FXS1 UT ratio FXS1 T1 ratio FXS1 T3 ratio FXS1 T8 ratio
15‑021.5 NDN 0.36 0.25≪ 0.28≪ 0.47 15‑022.9 SNRPN 0.53 0.35 0.44 0.54 15‑022.9 SNRPN 0.51 0.3 0.41 0.59 15‑022.9 SNRPN 0.55 0.33< 0.39 0.53 15‑022.9 SNRPN 0.4 0.14≪ 0.15≪ 0.25 15‑023.2 UBE3A exon 1 0.06 0.02 0.04 0.04
Probes FXS2 UT ratio FXS2 T1 ratio FXS2 T3 ratio FXS2 T8 ratio
15‑021.5 NDN 0.48 0.31≪ 0.26≪ 0.48 15‑022.9 SNRPN 0.48 0.37 0.5 0.34 15‑022.9 SNRPN 0.39 0.45 0.48 0.55 15‑022.9 SNRPN 0.2 0.41 0.42 0.43 15‑022.9 SNRPN 0.13 0.26 0.19 0.17 15‑023.2 UBE3A exon 1 0.06 0.14≪ 0 0
Table 2 MS-MLPA analysis of the imprinted locus Beckwith–Wiedemann/Silver–Russell (BWS/SRS) on chromosome 11 for WT1, WT2, FXS1 and FXS2 before and after treatment with 5-azadC [1 µM] at three different time points (T1, T3 and T8)
Only methylation-sensitive probes are listed
The italic values represent levels of methylation lower than 30 %, bold italic values represent those between 30 and 70 %, while underlined values represent those higher than 70 %
Probes WT1 UT ratio WT1 T1 ratio WT1 T3 ratio WT1 T8 ratio
11‑002.0 H19 0 0 0 0 11‑002.0 H19 0.49 0.24≪ 0.26≪ 0.51 11‑002.0 H19 0.54 0.37≪ 0.41≪ 0.57 11‑002.0 H19 0.49 0.28≪ 0.32≪ 0.55 11‑002.1 IGF2 0 0 0 0 11‑002.7 KCNQOT1 0.53 0.38 0.39 0.57 11‑002.7 KCNQOT1 0.46 0.28≪ 0.33≪ 0.51 11‑002.7 KCNQOT1 0.45 0.33 0.37 0.54 11‑002.7 KCNQOT1 0.41 0.3 0.37 0.58 11‑002.9 CDKN1c 0.17 0.18 0.2 0.15
Probes WT2 UT ratio WT2 T1 ratio WT2 T3 ratio WT2 T8 ratio
11‑002.0 H19 0.23 0 0 0 11‑002.0 H19 0.55 0.26≪ 0.26≪ 0.47 11‑002.0 H19 0.54 0.37≪ 0.35≪ 0.5 11‑002.0 H19 0.52 0.35 0.36 0.51 11‑002.1 IGF2 0 0 0 0 11‑002.7 KCNQOT1 0.48 0.41 0.29≪ 0.59 11‑002.7 KCNQOT1 0.44 0.33≪ 0.22≪ 0.52 11‑002.7 KCNQOT1 0.42 0.34 0.26≪ 0.5 11‑002.7 KCNQOT1 0.42 0.35 0.18≪ 0.56 11‑002.9 CDKN1c 0.13 0.15 0 0.15
Probes FXS1 UT ratio FXS1 T1 ratio FXS1 T3 ratio FXS1 T8 ratio
11‑002.0 H19 0.23 0.05 0.07 0.07 11‑002.0 H19 0.54 0.1≪ 0.09≪ 0.1 11‑002.0 H19 0.62 0.42≪ 0.47< 0.59 11‑002.0 H19 0.59 0.32≪ 0.45 0.49 11‑002.1 IGF2 0.02 0.03 0.02 0.02 11‑002.7 KCNQOT1 0.59 0.42 0.54 0.6 11‑002.7 KCNQOT1 0.59 0.33≪ 0.44 0.54 11‑002.7 KCNQOT1 0.51 0.42 0.53 0.5 11‑002.7 KCNQOT1 0.54 0.36 0.49 0.58 11‑002.9 CDKN1c 0.1 0.13 0.16 0.1
Probes FXS2 UT ratio FXS2 T1 ratio FXS2 T3 ratio FXS2 T8 ratio
11‑002.0 H19 0 0 0.19 0 11‑002.0 H19 0.26 0.22 0.23 0.29 11‑002.0 H19 0.67 0.37≪ 0.42≪ 0.47 11‑002.0 H19 0.71 0.47≪ 0.34≪ 0.77 11‑002.1 IGF2 0.19 0.14 0.11 0.18 11‑002.7 KCNQOT1 0.5 0.34 0.68 0.6 11‑002.7 KCNQOT1 0.4 0.42 0.44 0.42 11‑002.7 KCNQOT1 0.55 0.4 0.74 0.58 11‑002.7 KCNQOT1 0.5 0.47 0.44 0.92 11‑002.9 CDKN1c 0.25 0.28 0.3 0.35
(methylome) using Infinium Human Methylation 450 BeadChip array. The methylation degree of each CpG sites is defined by the β value and ranges between 0 (not meth-ylated) and 1 (methmeth-ylated). Each analysed sample shows two major peaks of CpG methylation value, i.e. for β = 0 and 0.8 < β < 1 (Additional file 5: Figure S2).
In order to exclude an ascertainment bias due to pos-sible differences in the baseline methylation levels of lymphoblastoid cell lines, we compared our data with data published by Alisch et al. [15], who examined genomic DNA methylation levels of peripheral blood and fibroblast-derived iPS cells of FXS patients using the Infinium Human Methylation 450 BeadChip array. The statistical analysis was performed using the Pearson cor-relation coefficient, which gives a value between +1 and −1 inclusive, where 1 is total positive correlation, 0 is no correlation and −1 is total negative correlation. In our case, the coefficient ranged from 0.6 to 0.85, showing a high positive correlation between the methylation levels of our cell lines (numbered from 1 to 9, as detailed in the “Methods” section) and the peripheral blood samples of Alisch et al. [15] (Additional file 6: Figure S3).
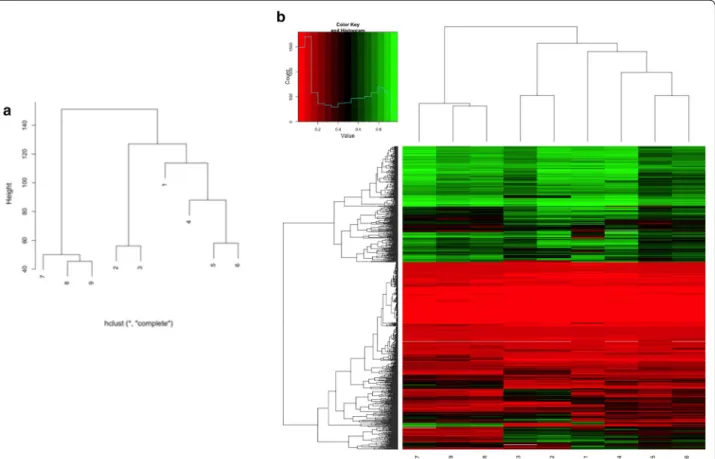
The clustering analysis of the nine samples shows the distance and similarity among different cell lines and within different samples of each cell line compared with the respective untreated one (Fig. 4a). As shown in Fig. 4b, after treatment with 5-azadC it is possible to observe changes in the methylation profile of each treated sample. However, these modifications are not sta-tistically significant (p > 0.05).
Significantly enriched Gene Ontology (GO) terms were summarized through the GO slim subsets in Fig. 5, and a schematic list of differentially methylated regions (DMRs) with the number of genes content is reported in Table 4. The comparison of the DMRs between untreated WT (WT1 and WT2) and FXS1 demonstrated an enrich-ment for a few specific GO terms (Fig. 5a). The compari-son between untreated WT (WT1 and WT2) and FXS2 (Fig. 5b) revealed a discrete enrichment of a few specific GO terms. Of note, the analysis of FXS1 and FXS2 cell lines showed no DMRs in the comparison between the two corresponding treated samples. The complete list of DMRs in the two comparisons illustrated in Fig. 5 with their chromosome position is reported in Additional file 7: Table S4 and Additional file 8: Table S5.
Discussion
Many efforts have been made in terms of possible phar-macological approaches to FXS, aiming either at mimick-ing FMRP functions or at restormimick-ing the transcriptionally active epigenetic profile of FMR1 [24].
In vitro studies directed at restoring FMR1 activity by reinstating its active epigenetic profile showed promising results [9–11, 23, 25], leading to a couple of pilot clinical trials [26, 27].
The major objection to use drugs like 5-azadC or HDAC inhibitors is that their action could be unspecific and genome wide, with unforeseeable damaging conse-quences, even though a microarray screening of 10,814 genes showed that a very limited set of genes are actually
Table 3 MS-MLPA analysis on the FMR1 locus before and after 7-day treatment with 5-azadC (T1) of three different nor-mal control fenor-male cell lines (WTA, B and C)
Only methylation-sensitive probes are listed
Note that the asterisks indicate that the magnitude of the probe ratio exceeds the set of arbitrary border values. The italic values represent levels of methylation lower than 30 %, bold italic values represent those between 30 and 70 %, while underlined values represent those higher than 70 %
Probes WTA UT ratio WTA T1 ratio WT B UT ratio WT B T1 ratio WTC UT ratio WTC T1 ratio
Prom 0.48 0.38 0.52 0.3≪ 0.52 0.37≪ Prom 0.47 0.25 0.42 0.32 0.53 0.25 Exon 1 0.33 0.26 0.27 0.3 0.39 0.28 Intron 1 0.56 0.36 0.52 0.19≪ 0.68 0.42 Intron 1 0.25 0.19 0.3 0.4 0.38 0.23 Intron 1 0.36 0.24 0.35 0.25 0.35 0.25 Intron 1 0.35 0.24 0.3 0.25 0.39 0.26 Exon 7 0.98 0.46 ≪* 0.98 0.6 ≪* 0.93 0.58 ≪* Exon 17 0.97 0.9 0.94 0.93 0.97 0.88 Exon 1 AFF2 0.52 0.45 0.54 0.43≪ 0.61 0.42≪ Exon 1 AFF2 0.49 0.37 0.42 0.33 0.42 0.33 Exon 1 AFF2 0.23 0.23 0.3 0.19≪ 0.34 0.24 Exon 1 AFF2 0.46 0.3 0.49 0.36 0.53 0.38 Exon 1 AFF2 0.27 0.17 0.22 0.14 0.38 0.23 Xp22 0.41 0.34 0.38 0 0 0
Fig. 4 Dendrogram and heat map of the methylation profile in the analysed samples. Dendrogram of the nine samples demonstrates a cluster‑
ing of samples 4–6 (FXS1 UT and the two different 5‑azadC treatments, respectively) and 7–9 (FXS2 UT and the two different 5‑azadC treatments, respectively), as expected (a). The distance between sample 1 (WT2 UT) and samples 2 and 3 (WT1 UT and WT1 T1, respectively) and the similar‑ ity between samples 2 and 3 can be explained by intrinsic difference and similarities between different cell lines. The closeness between sample 1 (WT2 UT) and 4 (FXS1 UT) confirms the observations by Alisch et al. [15]. Heat map of the methylation profile of randomly sampled loci of all analysed samples shows that samples from the same cell line type clustered together (b). It is possible to observe some changes in the methylation profile after treatment with 5‑azadC that do not reach statistical significance (p > 0.05)
transcriptionally upregulated by treatment with 5-azadC (51 genes) and/or with trichostatin A (23 genes) [28].
To shed more light on this debated question, we extended our previous studies on the epigenetics of the FMR1 pro-moter to other genomic regions and eventually to the entire genome. Although only H3K4me2 data reached statisti-cal significance (p < 0.01), the overall picture of ChIP assay results showed a consistency of the euchromatic mark-ers (H3K4me2 and H3K27me2) with the transcriptional data, while the heterochromatic markers (H3K9me and H3K27me3) did not change substantially during the tran-sition of the FMR1 gene from transcriptionally inactive to transcriptionally active. These last data confirm and extend previous findings, which showed that the methylation level of H3K9me2 is not substantially affected by treatment with 5-azadC and that, in UFM cell lines, the epigenetic profile of this marker was more similar to that of the FXS cells [11, 23].
To complete the evaluation of the epigenetic effects of 5-azadC, as well as concerns about its lack of specificity,
we used three different approaches to investigating the changes in DNA methylation at different levels: (1) site specific (bisulphite sequencing); (2) locus specific (MS-MLPA); (3) global (whole methylation analysis).
The bisulphite sequencing analysis of the methylation boundary [16] and of the promoter region of FMR1 dis-closed that while the promoter region of FXS cells under-went a substantial demethylation, as already observed [10], the methylation boundary was not affected by treatment with 5-azadC. This new finding suggests that 5-azadC does not act indiscriminately throughout genomic DNA and that constitutively methylated regions are somehow “protected” from its demethylating effect. To confirm the validity of this concept, we checked the methylation status of other genomic sites, specifically the two well-known imprinted loci PWS/AS and BWS/SRS, through MS-MLPA. The methylation profile of both loci remained substantially unchanged after 5-azadC treat-ment. MS-MLPA analysis of the FMR1 locus and of the
two imprinted loci analysed in three different WT female cell lines did not show any significant modification after the demethylating treatment. On the whole, these data strengthen the assumption that some genomic regions are indeed shielded from the demethylating action of 5-azadC. Finally, the whole methylation analysis showed that the methylation changes induced by 5-azadC did not affect significantly DMRs. A broad distribution of sev-eral GO terms or a discrete distribution of few of them was observed (Fig. 5; Table 4). More importantly, we observed a very strong positive correlation (p < 0.000001) between the methylation profiles of lymphoblastoid cell lines employed in this study and that of a set of different peripheral blood samples (and iPS cell lines) described by Alisch et al. [15]. These data argue against the possibility that the lack of methylation changes after treatment with 5-azadC may be interpreted as due to a different pattern
of DNA methylation in lymphoblastoid cell lines, pared with peripheral blood cells. In fact, different com-parative genome-wide DNA methylation studies between lymphocytes and their derived lymphoblasts demon-strated differences in methylation profile of both cell line types. The direction of these changes in DNA meth-ylation was often not consistent, i.e. hypermethmeth-ylation of some regions and hypomethylation of others in lympho-blasts with respect to lymphocytes. These DMRs seemed to reflect differences in methylation between B lympho-cytes and other subtypes of white blood cells, considering the monoclonal nature of lymphoblasts and their modi-fications throughout virus transformation and culturing procedure [29–31]. Nevertheless, another study showed a high correlation between lymphocytes and virus-trans-formed lymphoblasts from the same donor in terms of DNA methylation and transcription pattern [32]. In any case, the strong correlation we observed between lymph-oblastoid cell lines and peripheral blood cells supports the consistency and validity of our results.
To date, 5-azadC is the only compound known to induce a good transcriptional activity of the expanded and silenced FMR1 gene. Previous experiments with 5-azadC investigated the transcriptional activity of FMR1 after 7 days of administration, when the levels of FMR1 mRNA increased to 30–40 % of a WT cell line, and again at 30 days after the last dose administration, when complete absence of transcriptional activity, due to the
Fig. 5 Comparison between samples with respect to GO terms. In a is reported the comparison between WT1 and WT2 versus untreated FXS1.
Note the enrichment of DMRs for only three GO terms. There is a broad distribution of DMRs over several GO terms in the comparison between WT1 and WT2 versus FXS2, although it is possible to identify two major enriched ones (anatomical structure development and cellular nitrogen compound metabolic process) (b)
Table 4 List of differentially methylated sites (DMS), dif-ferentially methylated regions (DMRs) and genes content in the four comparisons
Comparison DMS DMR Genes
WT1 and WT2 versus FXS1 7343 40 32 WT1 and WT2 versus FXS2 33,950 365 300 FXS1 UT versus FXS1 T1 (n = 2) 1706 0 0 FXS2 UT versus FXS2 T1 (n = 2) 528 0 0
remethylation of the CpG island of the promoter region, was observed [10]. Now we have investigated the changes in FMR1 transcription level occurring between day 1 and day 30 after cessation of the treatment, in order to meas-ure its effective duration. Both FXS cell lines showed the expected transcriptional reactivation that, interest-ingly, persisted for about 10–15 days after the last dose of 5-azadC. The WT cell line did not show any significant changes in FMR1 transcriptional level after treatment. These results suggest that the effect of 5-azadC on FMR1 transcription is only temporary, but relatively long-last-ing, requiring only pulsed administrations, in order to keep reactivation of FMR1 in a steady state. One clear implication of this finding is the containment of possible damaging side effects of 5-azadC.
The administration of 5-azadC to FXS patients has not been tried so far. An obvious concern that arises when considering the clinical use of 5-azadC is its toxicity. In fact, while 5-azacytidine (5-azaC) and 5-azadC are gen-erally well tolerated in haematological malignancies [33], the effects of a long-term treatment on patients affected by genetic disorders are unknown. The results presented here suggest that use of 5-azadC in a hypothetical trial to treat FXS may not require daily administrations of the drug, thus limiting its possible undesirable side effects. The idea of treating a genetic disease with a demethylat-ing drug is not new. Besides haematological malignan-cies, 5-azadC has been used to treat patients with severe refractory β-thalassemias, with a reexpression of foetal haemoglobin [34]. Moreover, few in vitro treatments with 5-azadC of genetic syndromes have been reported. Yao et al. [35] have treated with 5-azadC three primary human BWS cell lines, two β2SP negative and one β2SP positive. The non-pleckstrin homology domain β-spectrin (β2SP) functions as a potent TGF-β signalling member adaptor and is epigenetically silenced by DNA methylation of its CpG island in many individuals with BWS without loss of imprinting at the IGF2 locus. Treatment with 5-azadC caused the reactivation of the β2SP expression in two neg-ative BWS cell lines correlating with a decrease in DNA methylation in both β2SP alleles [35].
A second obstacle to the therapeutic approach with 5-azadC is the apparent requirement of cell division in order for the treatment to be effective. Interestingly, at least two reports suggest that 5-azadC may require mini-mal or no incorporation into DNA to effectively reduce the activity of the maintenance DNA methyltransferase DNMT1 [36, 37]. Furthermore, Bar-Nur et al. [38] treated FXS-iPS cells and their derived neurons with 5-azaC and observed a robust FMR1 reactivation after treatment. Although it was a pilot study, these authors demonstrated that an epigenetic intervention in stable nervous cells is possible.
Conclusions
We show for the first time that 5-azadC seems to have a discreet level of specificity, with a long-lasting effect. In our view, these results call for future studies on FXS-iPS cells and their derived neurons, which we consider an obligate pre-clinical passage before 5-azadC can be tested in a clinical trial.
Methods
Cell lines and treatments
Lymphoblastoid cell lines were established through Epstein–Barr virus (EBV) immortalization of peripheral blood lymphocytes of two FXS individuals, two normal control males (WT) and three normal control females. Peripheral blood lymphocytes were obtained after a signed informed consent of each participant (or parents in the case of FXS patients). Ethics Committee at the Catholic University of Rome approved this study (prot. N. 9917/15 and prot.cm 10/15). All cell lines had been anonymously established in the Institute of Genomic Medicine at the Catholic University (Rome) and are referred to as follows:
• FXS1, fragile X syndrome cell line 1, around 250 CGG repeats;
• FXS2, fragile X syndrome cell line 2, around 450 CGG repeats;
• WT1, wild-type cell line 1, normal control male; • WT2, wild-type cell line 2, normal control male; • WT A, wild-type cell line A, normal control female; • WT B, wild-type cell line B, normal control female; • WT C, wild-type cell line C, normal control female. Cell cultures were grown in RPMI1640 medium (Sigma-Aldrich), supplemented with 10 % foetal bovine serum (FBS), 2.5 % penicillin/streptomycin and 2.5 % l-glutamine at 37 °C with 5 % CO2.
Prior to pharmacological treatment, cell viability was assessed through propidium iodide staining (Nucle-oCounter, Sartorius-Stedim). For each cell culture, we seeded 9 × 10⁷ cells/ml in a final volume of 130 ml per single flask. 5-AzadC (Sigma-Aldrich, A3656) was added to the cell cultures (final concentration 1 µM) for 7 con-secutive days. The day after the last dose administration, an aliquot of the cell suspension was harvested for RNA, DNA and protein extraction and for chromatin immuno-precipitation (ChIP) assays. In order to evaluate the long-lasting effect of the treatment, the remaining volume was subdivided into eight different flasks, and the cultures continued according to the scheme reported on the top panel of Fig. 1. For each WT cell line, one single treat-ment was performed, while two independent treattreat-ments were performed for each FXS cell line (n = 2).
Quantitative RT‑PCR
Total RNA was extracted by RNeasy mini kit (Qiagen, 74106). RNA concentration and purity were checked on 1.5 % agarose gel and by UV spectrophotometer. After-wards, 500 ng of total RNA was retro-transcribed into cDNA by MoMLV-RT (Invitrogen, USA) and 0.6 µg of random hexamers (Promega, C118A).
For a relative quantification of each transcript using ABI7900HT (Life technologies), the following pre-devel-oped TaqMan assays were used: FMR1 (Hs00233632_m1) and GAPDH (glyceraldehyde-3-phosphate dehydroge-nase) (Hs02758991_g1), the latter being constitutively expressed in every cell and thus used as endogenous control. The cycle parameters were: 2 min at 50 °C and 10 min at 95 °C, followed by 40 cycles with 15 s at 95 °C (denaturation) and 1 min at 60 °C (annealing/exten-sion). The relative quantification of FMR1 transcript versus GAPDH transcript was calculated as follows: 2− [ΔCt(FMR1)−ΔCt(GAPDH)] = 2−ΔΔCt, being ΔCt the difference [Ct(FMR1) − Ct(GAPDH)] and Ct the cycle at which the detected fluorescence overcomes the threshold.
Western blot
Proteins extracted from untreated and 5-azadC-treated FXS1 and FXS2 and WT1 lymphoblasts were resus-pended in Laemmli buffer, boiled, separated on 8 % polyacrylamide gel electrophoresis, transferred to Hybond-ECL membrane (GE Healthcare), immu-nostained and visualized after film exposure using the ECL Western blotting kit (GE Healthcare), according to the manufacturer. Primary antibodies were used at the following concentrations: 1:1000 anti-FMRP mouse poly-clonal antibody (Immunological Science) and 1:10,000 anti-GAPDH mouse antibody (Sigma-Aldrich).
Chromatin immunoprecipitation assay and quantification of IP‑DNA
To study the histone modifications at the FMR1 locus, chromatin immunoprecipitation (ChIP) assay was per-formed according to the manufacturer (Millipore). His-tone methylation analysis was performed using two different antibodies against dimethyl lysine 9 (H3K9me2, Millipore), dimethyl lysine 4 (H3K4me2, Millipore) and di- and trimethyl lysine 27 (H3K27me2 and H3K27me3, Millipore) on histone 3. In each ChIP assay, antibody against rabbit IgG (Thermo Scientific, 1862244) was employed and no template control was included. Immu-noprecipitated DNA (IP-DNA) was extracted by standard procedure (phenol/chloroform/isoamilic alcohol 25:24:1) and then quantified by real-time PCR (ABI7900HT, Life Technologies) using fluorescent probes and primers spe-cific for both FMR1 and GAPDH, as already published [8].
Standard curves for the two FMR1 and for the sin-gle GAPDH amplicons were constructed with five dif-ferent DNA dilutions of known concentration [X axis = log(X)] and the corresponding Ct values (Y axis). The unknown amount of IP-DNA of FMR1 and GAPDH [X axis = log(X)] was calculated from Ct values, through the standard curve plot [y = ax + b, that is Ct = ax + b, with x = log(X)].
All variables were analysed by means of descriptive sta-tistics (mean, median, standard deviation and standard error of mean). Data were analysed with nonparametric statistical Kruskal–Wallis test and with K sample test. The level of significance was set at p ≤ 0.01. Data analy-sis was performed using STATA Intercooled version 9.2 software (Stata Co.; College Station, Lakeway, TX, USA).
Bisulphite sequencing
Genomic DNA was isolated from treated and untreated cells by DNeasy Blood & Tissue kit (Qiagen, 69504). The DNA concentration was checked both by absorb-ance measurements at 260 nm and on agarose gel. Bisul-phite DNA transformation was performed as previously described [17]. Each transformed DNA was amplified in seven independent PCR reactions, then pooled and recovered from the agarose gel with the StrataPrep DNA Gel extraction kit (Stratagene, 400768). The purified PCR products were cloned with the StrataClone PCR cloning kit (Stratagene, 240205), according to the manufacturer’s instructions. After bacterial plating and overnight incu-bation at 37 °C, white colonies were picked and plasmid DNA was extracted. After a pre-screening of the clones with PCR using specific plasmid primers (T3 and T7), amplification products were sequenced in both direc-tions with BigDye Terminator version 3.1 Cycle Sequenc-ing kit (Life Technologies, 4336917) on a 3130 Genetic Analyzer (Life Technologies). The modified primers are those described by Naumann et al. [16].
MS‑MLPA analysis
Evaluation of DNA methylation through MS-MLPA was performed according to the manufacturer protocol (MRC Holland). In the MS-MLPA assay, the sequence targeted by specific probes contains a restriction site for the HhaI endonuclease, able to recognize the unmethylated GCGC sequence. Fragment separation was performed through capillary electrophoresis (ABI3130 Genetic Analyzer, Life Technologies), and the methylation status was established through Coffalyser DB software, comparing the signal of each probe (that is proportional to the amount of target DNA) in each sample after HhaI digestion with the signal of the same probe without digestion. At least three ref-erence samples (untreated WT) were used in all experi-ments to normalize the data obtained for each test probe
of each sample. Based on the methylation status of these reference samples, the Coffalyser DB software automati-cally determines the border allowing for statistical analy-sis. Reference samples were randomly distributed across the plate, to calculate the reproducibility of each probe in the reference sample population. No DNA controls were included. The genomic regions analysed in the cur-rent study are: FMR1-AFF2 locus in Xq27.3 (ME029B2), Prader–Willi/Angelman syndromes (PWS/AS) locus in 15q11 (ME028B2) and Beckwith–Wiedemann/Silver– Russell syndromes (BWS/SRS) locus in 11p15 (ME030C1).
Whole‑genome methylation analysis
Whole methylation study was performed through Infin-ium Human Methylation 450 BeadChip array in out-ser-vice (Integragen). This array detects cytosine methylation at CpG islands based on highly multiplexed genotyp-ing of bisulphite-converted genomic DNA. The level of methylation for the interrogated locus can be determined by calculating the ratio of the fluorescent signals from the methylated versus unmethylated sites. The raw data are analysed by the proprietary software, and the fluo-rescence intensity ratios between two bead types are cal-culated. A ratio value of 0 equals to non-methylation of the locus, a ratio of 1 equals to total methylation, a value of 0.5 means that one copy is methylated, and the other is not, in the diploid human genome (Human Methyla-tion 450 BeadChip Data Sheet; Illumina website). For the present study, nine samples were analysed and numbered from 1 to 9, respectively, as follows: untreated WT2, untreated WT1 and 7-day treatment of WT1 (WT1 T1), untreated FXS1 and two independent 7-day treatments (FXS1 T1) (n = 2), untreated FXS2 and two independent 7-day treatments (FXS2 T1) (n = 2). Differential meth-ylation was analysed using the minfi package [39]. Data were background-corrected and then subject to subset-quantile within array normalization (SWAN) [40]. Dif-ferentially methylated positions were identified using the minfi F test implementation and selected as those hav-ing p value < 0.01. Differentially methylated regions were identified using the lasso algorithm [41] implemented in the ChAMP package [42], by submitting to ChAMP the minfi F test output. A threshold of 0.05 was set for the adjusted p value. Genes associated with methylation sites found in significantly differentially methylated regions, as retrieved from the Illumina documentation, were anno-tated for functional enrichment by accessing the David web services [43] through the openpyxl Python library (https://openpyxl.readthedocs.org/en/latest/). Signifi-cantly enriched Gene Ontology terms were summarized through the Gene Ontology (GO) slim subsets.
In order to compare our data set from lymphoblastoid cell lines with those already published by Alisch et al. [15]
from lymphocytes and iPS cell lines, we used the Pearson correlation coefficient.
Abbreviations
5‑azadC: 5‑aza‑2‑deoxycytidine; PWS/AS: Prader–Willi/Angelman syndrome; BWS/SRS: Beckwith–Wiedemann/Silver–Russell syndrome; VPA: valproic acid. Authors’ contributions
ET, GM, SL and FF conceived and designed the experiments. GM, SL, FP, MG and FF performed the experiments. SL and FF analysed the data. ET, FF, MHC and GN contributed reagents/materials/analysis tools. ET, GM, FF and GN wrote the paper. All authors read and approved the final manuscript. Author details
1 Istituto di Medicina Genomica, Università Cattolica del Sacro Cuore, Largo F. Vito 1, 00168 Rome, Italy. 2 Department of Biology, Centre for Molecular Bioinformatics (CBM), University of Rome Tor Vergata, Rome, Italy. Acknowledgements
This work was supported by Telethon Grant (GGP10150), FRAXA Foundation and Italian Association for Fragile X syndrome to GN and by Telethon Grant (GGP15257A) to ET. We gratefully acknowledge Prof. Maurizio Genuardi and Dr. Eugenio Sangiorgi for their critical revision of the manuscript.
Competing interests
The authors declared that they have no competing interests. Additional files
Additional file 1: Figure S1. Bisulphite sequencing of the FMR1 methylation boundary after 5‑azadC treatment in FXS2 cell line. Partial demethylation after treatment with 5‑azadC is limited to the CpG island of the promoter region (middle panel), even after 8 days (T1) from 5‑azadC withdrawal (bottom panel). The arrow indicates the position of the meth‑ ylation boundary.
Additional file 2: Table S1. MS‑MLPA analysis of the FMR1/AFF2 locus before and after 5‑azadC treatment at three different time points (T1, T3 and T8) of two different normal control cell lines (WT1 and WT2), two different treatments of FXS1 and FXS2, respectively. Only methylation‑ sensitive probes are listed.
Additional file 3: Table S2. MS‑MLPA analysis of the PWS/AS locus on chromosome 15 before and after 7‑day treatment with 5‑azadC (T1) of three different normal control female cell lines (WTA, B and C). Only methylation‑sensitive probes are listed.
Additional file 4: Table S3. MS‑MLPA analysis of the BWS/SRS locus on chromosome 11 before and after 7‑day treatment with 5‑azadC (T1) of three different normal control female cell lines (WTA, B and C). Only methylation‑sensitive probes are listed.
Additional file 5: Figure S2. Distribution curve of beta values for each of nine different samples. Two main peaks, for beta = 0 and 0.8 < beta < 1, are visible; beta = 0 means absence of DNA methylation and beta = 1 means completely methylated DNA.
Additional file 6: Figure S3. Heat map of the Pearson correlation analysis. Heat map illustrating the Pearson correlation coefficient between the nine different lymphoblastoid cell lines used for this study (columns from 1 to 9) and the data set of peripheral blood and iPS cells published by Alisch et al. [2013] (rows). A high correlation has been demonstrated with values ranged from 0.6 and 0.85 between our lymphoblastoid cell lines and those already published. Statistical significance was reached (p < 0.000001).
Additional file 7: Table S4. List of DMRs and their chromosome position in the comparison between WT1 and WT2 versus FXS1.
Additional file 8: Table S5. List of DMRs and their chromosome position in the comparison between WT1 and WT2 versus FXS2.
Received: 11 December 2015 Accepted: 8 March 2016
References
1. Irwin SA, Galvez R, Greenough WT. Dendritic spine structural anomalies in fragile‑X mental retardation syndrome. Cereb Cortex. 2000;10:1038–44. 2. Verkerk AJ, Pieretti M, Sutcliffe JS, Fu YH, Kuhl DP, Pizzuti A, et al. Identifica‑
tion of a gene (FMR‑1) containing a CGG repeat coincident with a break‑ point cluster region exhibiting length variation in fragile X syndrome. Cell. 1991;65:905–14.
3. Oberlé I, Rousseau F, Heitz D, Kretz C, Devys D, Hanauer A, et al. Instability of a 550‑base pair DNA segment and abnormal methylation in fragile X syndrome. Science. 1991;252:1097–102.
4. Sutcliffe JS, Nelson DL, Zhang F, Pieretti M, Caskey CT, Saxe D, Warren ST. DNA methylation represses FMR‑1 transcription in fragile X syndrome. Hum Mol Genet. 1992;1:397–400.
5. Smeets HJ, Smits AP, Verheij CE, Theelen JP, Willemsen R, van de Burgt I, et al. Normal phenotype in two brothers with a full FMR1 mutation. Hum Mol Genet. 1995;4:2103–8.
6. Willemsen R, Bontekoe CJ, Severijnen LA, Oostra BA. Timing of the absence of FMR1 expression in full mutation chorionic villi. Hum Genet. 2002;110:601–5. 7. Pietrobono R, Tabolacci E, Zalfa F, Zito I, Terracciano A, Moscato U, et al.
Molecular dissection of the events leading to inactivation of the FMR1 gene. Hum Mol Genet. 2005;14:267–77.
8. Tabolacci E, Moscato U, Zalfa F, Bagni C, Chiurazzi P, Neri G. Epigenetic analysis reveals a euchromatic configuration in the FMR1 unmethylated full mutations. Eur J Hum Genet. 2008;16:1487–98.
9. Chiurazzi P, Pomponi MG, Willemsen R, Oostra BA, Neri G. In vitro reactiva‑ tion of the FMR1 gene involved in fragile X syndrome. Hum Mol Genet. 1998;7:109–13.
10. Pietrobono R, Pomponi MG, Tabolacci E, Oostra B, Chiurazzi P, Neri G. Quantitative analysis of DNA demethylation and transcriptional reactiva‑ tion of the FMR1 gene in fragile X cells treated with 5‑azadeoxycytidine. Nucleic Acids Res. 2002;30:3278–85.
11. Tabolacci E, Pietrobono R, Moscato U, Oostra BA, Chiurazzi P, Neri G. Differential epigenetic modifications in the FMR1 gene of the fragile X syndrome after reactivating pharmacological treatments. Eur J Hum Genet. 2005;13:641–8. 12. Eiges R, Urbach A, Malcov M, Frumkin T, Schwartz T, Amit A, et al. Devel‑
opmental study of fragile X syndrome using human embryonic stem cells derived from preimplantation genetically diagnosed embryos. Cell Stem Cell. 2007;1:568–77.
13. Urbach A, Bar‑Nur O, Daley GQ, Benvenisty N. Differential modeling of fragile X syndrome by human embryonic stem cells and induced pluripo‑ tent stem cells. Cell Stem Cell. 2010;6:407–11.
14. de Esch CE, Ghazvini M, Loos F, Schelling‑Kazaryan N, Widagdo W, Munshi ST, et al. Epigenetic characterization of the FMR1 promoter in induced pluripotent stem cells from human fibroblasts carrying an unmethylated full mutation. Stem Cell Rep. 2014;3:548–55.
15. Alisch RS, Wang T, Chopra P, Visootsak J, Conneely KN, Warren ST. Genome‑wide analysis validates aberrant methylation in fragile X syn‑ drome is specific to the FMR1 locus. BMC Med Genet. 2013;14:18. 16. Naumann A, Hochstein N, Weber S, Fanning E, Doerfler W. A distinct
DNA‑methylation boundary in the 5′‑upstream sequence of the FMR1 promoter binds nuclear proteins and is lost in fragile X syndrome. Am J Hum Genet. 2009;85:606–16.
17. Lanni S, Goracci M, Borrelli L, Mancano G, Chiurazzi P, Moscato U, et al. Role of CTCF protein in regulating FMR1 locus transcription. PLoS Genet. 2013;9:e1003601.
18. Naumann A, Kraus C, Hoogeveen A, Ramirez CM, Doerfler W. Stable DNA methylation boundaries and expanded trinucleotide repeats: role of DNA insertions. J Mol Biol. 2014;426:2554–66.
19. Phillips JE, Corces VG. CTCF: master weaver of the genome. Cell. 2009;137:1194–211.
20. McGarvey KM, Fahrner JA, Greene E, Martens J, Jenuwein T, Baylin SB. Silenced tumor suppressor genes reactivated by DNA demethylation do not return to a fully euchromatic chromatin state. Cancer Res. 2006;66:3541–9. 21. Witcher M, Emerson BM. Epigenetic silencing of the p16(INK4a) tumor
suppressor is associated with loss of CTCF binding and a chromatin boundary. Mol Cell. 2009;34:271–84.
22. Chiurazzi P, Pomponi MG, Pietrobono R, Bakker CE, Neri G, Oostra BA. Synergistic effect of histone hyperacetylation and DNA demethylation in the reactivation of the FMR1 gene. Hum Mol Genet. 1999;8:2317–23. 23. Tabolacci E, De Pascalis I, Accadia M, Terracciano A, Moscato U, Chiurazzi
P, et al. Modest reactivation of the mutant FMR1 gene by valproic acid is accompanied by histone modifications but not DNA demethylation. Pharmacogenet Genomics. 2008;18:738–41.
24. Schaefer TL, Davenport MH, Erickson CA. Emerging pharmaco‑ logic treatment options for fragile X syndrome. Appl Clin Genet. 2015;8:75–93.
25. Biacsi R, Kumari D, Usdin K. SIRT1 inhibition alleviates gene silencing in Fragile X mental retardation syndrome. PLoS Genet. 2008;4:e1000017. 26. Torrioli MG, Vernacotola S, Peruzzi L, Tabolacci E, Mila M, Militerni R, et al.
A double‑blind, parallel, multicenter comparison of L‑acetylcarnitine with placebo on the attention deficit hyperactivity disorder in fragile X syndrome boys. Am J Med Genet. 2008;146A:803–12.
27. Torrioli M, Vernacotola S, Setini C, Bevilacqua F, Martinelli D, Snape M, et al. Treatment with valproic acid ameliorates ADHD symptoms in fragile X syndrome boys. Am J Med Genet. 2010;152A:1420–7.
28. Suzuki H, Gabrielson E, Chen W, Anbazhagan R, van Engeland M, Weijen‑ berg MP, et al. A genomic screen for genes upregulated by demethyla‑ tion and histone deacetylase inhibition in human colorectal cancer. Nat Genet. 2002;1:141–9.
29. Grafodatskaya D, Choufani S, Ferreira JC, Butcher DT, Lou Y, Zhao C, et al. EBV transformation and cell culturing destabilizes DNA methylation in human lymphoblastoid cell lines. Genomics. 2010;95:73–83. 30. Sugawara H, Iwamoto K, Bundo M, Ueda J, Ishigooka J, Kato T. Compre‑
hensive DNA methylation analysis of human peripheral blood leukocytes and lymphoblastoid cell lines. Epigenetics. 2011;6:508–15.
31. Thompson TM, Sharfi D, Lee M, Yrigollen CM, Naumova OY, Grigorenko EL. Comparison of whole‑genome DNA methylation patterns in whole blood, saliva, and lymphoblastoid cell lines. Behav Genet. 2013;43:168–76. 32. Zhang Z, Liu J, Kaur M, Krantz ID. Characterization of DNA methylation
and its association with other biological systems in lymphoblastoid cell lines. Genomics. 2012;99:209–19.
33. Gnyszka A, Jastrzebski Z, Flis S. DNA methyltransferase inhibitors and their emerging role in epigenetic therapy of cancer. Anticancer Res. 2013;33:2989–96.
34. Lowrey CH, Nienhuis AW. Brief report: treatment with azacitidine of patients with end‑stage beta‑thalassemia. N Engl J Med. 1993;329:845–8. 35. Yao ZX, Jogunoori W, Choufani S, Rashid A, Blake T, Yao W, et al. Epigenetic
silencing of beta‑spectrin, a TGF‑beta signaling/scaffolding protein in a human cancer stem cell disorder: Beckwith–Wiedemann syndrome. J Biol Chem. 2010;285:36112–20.
36. Ghoshal K, Datta J, Majumder S, Bai S, Kutay H, Motiwala T, et al. 5‑Aza‑ deoxycytidine induces selective degradation of DNA methyltransferase 1 by a proteasomal pathway that requires the KEN box, bromo‑adjacent homology domain, and nuclear localization signal. Mol Cell Biol. 2005;25:4727–41.
37. Patel K, Dickson J, Din S, Macleod K, Jodrell D, Ramsahoye B. Targeting of 5‑aza‑2′‑deoxycytidine residues by chromatin‑associated DNMT1 induces proteasomal degradation of the free enzyme. Nucleic Acids Res. 2010;38:4313–24.
38. Bar‑Nur O, Caspi I, Benvenisty N. Molecular analysis of FMR1 reactivation in fragile‑X induced pluripotent stem cells and their neuronal derivatives. J Mol Cell Biol. 2012;4:180–3.
39. Aryee MJ, Jaffe AE, Corrada‑Bravo H, Ladd‑Acosta C, Feinberg AP, Hansen KD, et al. Minfi: a flexible and comprehensive Bioconductor package for the analysis of Infinium DNA methylation microarrays. Bioinformatics. 2014;30:1363–9.
40. Maksimovic J, Gordon L, Oshlack A. SWAN: subset‑quantile within array normalization for illumina infinium HumanMethylation450 BeadChips. Genome Biol. 2012;13:R44.
41. Butcher LM, Beck S. Probe Lasso: a novel method to rope in differentially methylated regions with 450K DNA methylation data. Methods. 2015;72:21–8. 42. Morris TJ, Butcher LM, Feber A, Teschendorff AE, Chakravarthy AR,
Wojdacz TK, et al. ChAMP: 450k chip analysis methylation pipeline. Bioin‑ formatics. 2014;30:428–30.
43. da Huang W, Sherman BT, Lempicki RA. Systematic and integrative analy‑ sis of large gene lists using DAVID bioinformatics resources. Nat Protoc. 2009;4:44–57.


![Table 2 MS-MLPA analysis of the imprinted locus Beckwith–Wiedemann/Silver–Russell (BWS/SRS) on chromosome 11 for WT1, WT2, FXS1 and FXS2 before and after treatment with 5-azadC [1 µM] at three different time points (T1, T3 and T8)](https://thumb-eu.123doks.com/thumbv2/123dokorg/8338288.132840/8.892.83.809.188.1032/analysis-imprinted-beckwith-wiedemann-russell-chromosome-treatment-different.webp)