Pulmonary adenocarcinomas presenting as ground-glass opacities on
multidetector CT: three-dimensional computer-assisted analysis of
growth pattern and doubling time
Andrea Borghesi
Davide Farina
Silvia Michelini
Matteo Ferrari
Diego Benetti
Simona Fisogni
Andrea Tironi
Roberto Maroldi
P
ulmonary adenocarcinoma is the most common type of lung cancer, and it may pres-ent as a focal ground-glass opacity (GGO) on thin-section computed tomography (CT) (1). Focal GGOs are classified as part-solid or pure according to the presence or ab-sence of a solid component within the lesion (1).A focal GGO is a complex diagnostic challenge because it may be the manifestation of a wide array of benign and malignant conditions, including inflammation, focal interstitial fibrosis, and neoplasm (2). Inflammation generally regresses in a short period of time (in weeks or a few months), either spontaneously or after proper therapy (2). Although benign, focal interstitial fibrosis may remain unchanged for a long time (2–5), while malignancies (most often pulmonary adenocarcinomas) tend to grow (6, 7).
Pulmonary adenocarcinomas exhibiting GGO are typically slow-growing lesions (8, 9), and their growth rates are difficult to characterize, particularly when size variations are solely as-sessed as changes in two-dimensional (2D) diameters measured on an axial scan. The major limitation of this method is the asymmetric growth of lesions in the longitudinal plane. The high intra- and interobserver variabilities are additional drawbacks of 2D measurements (10–12).
Therefore, three-dimensional (3D) measurements are the current method of choice in the assessment of the growth rate of pulmonary lesions by calculating volumetric changes and doubling time (DT) (13). Although the accuracy and reproducibility of volumetric analysis in solid lung nodules have been widely demonstrated in the literature (14, 15), the results in GGOs are less consistent (16). However, it has been reported that the reproducibility of com-puterized volumetric analysis is relatively high for GGOs ≥8 mm in diameter (17) and that CT
From the Department of Radiology (A.B. andrea. [email protected], D.F., S.M., M.F., R.M.), Thoracic Surgery Unit (D.B.), and Department of Pathology (S.F., A.T.), University and Spedali Civili of Brescia, Italy. Received 27 February 2016; revision requested 5 April 2016; last revision received 30 May 2016; accepted 8 June 2016.
Published online 28 September 2016. DOI 10.5152/dir.2016.16110
Diagn Interv Radiol 2016; 22:525–533 © Turkish Society of Radiology 2016
CHEST IMAGING
ORIGINAL AR TICLE
PURPOSE
We aimed to evaluate the growth pattern and doubling time (DT) of pulmonary adenocarci-nomas exhibiting ground-glass opacities (GGOs) on multidetector computed tomography (CT).
METHODS
The growth pattern and DT of 22 pulmonary adenocarcinomas exhibiting GGOs were retrospec-tively analyzed using three-dimensional semiautomatic software. Analysis of each lesion was based on calculations of volume and mass changes and their respective DTs throughout CT fol-low-up. Three-dimensional segmentation was performed by a single radiologist on each CT scan. The same observer and another radiologist independently repeated the segmentation at the baseline and the last CT scan to determine the variability of the measurements. The relationships among DTs, histopathology, and initial CT features of the lesions were also analyzed.
RESULTS
Pulmonary adenocarcinomas presenting as GGOs exhibited different growth patterns: some le-sions grew rapidly and some grew slowly, whereas others alternated between periods of growth, stability, or shrinkage. A significant increase in volume and mass that exceeded the coefficient of repeatability of interobserver variability was observed in 72.7% and 84.2% of GGOs, respectively. The volume-DTs and mass-DTs were heterogeneous throughout the follow-up CT scan (range, -4293 to 21928 and -3113 to 17020 days, respectively), and their intra- and interobserver variabil-ities were moderately high. The volume-DTs and mass-DTs were not correlated with the initial CT features of GGOs; however, they were significantly shorter in invasive adenocarcinomas (P = 0.002 and P = 0.001, respectively).
CONCLUSION
Pulmonary adenocarcinomas exhibiting GGOs show heterogeneous growth patterns with a trend toward a progressive increase in size. DTs may be useful for predicting tumor aggressiveness.
526
• November–December 2016 • Diagnostic and Interventional Radiology Borghesi et al. images reconstructed withhigh-spatial-fre-quency algorithms provide more accurate volumetric quantification of pulmonary nod-ules, including GGOs (16, 18).
In addition to volume, de Hoop et al. (19) developed a quantitative method to mea-sure the growth rate of GGOs on the basis of the concept of mass, calculated by multiply-ing the nodule volume by the mean nodule density (i.e., mean CT number+1000). In their experience, mass and not volume should be the preferred parameter for the evaluation of growth in GGOs.
Recently, Song et al. (20) demonstrated that volume-DTs and mass-DTs were signifi-cantly longer in pure and part-solid GGOs with a solid component of ≤5 mm than in part-solid GGOs with a solid component of >5 mm. Furthermore, Oda et al. (21) report-ed that volume-DT may be helpful in differ-entiating the histologic entities of GGOs.
Although the natural history and growth rate of the various lesions along the adeno-carcinoma spectrum have been previous-ly studied (6, 7, 22–25), to the best of our knowledge, there are no published studies in which the volume and mass changes of pul-monary adenocarcinomas with GGOs (and their respective DTs) have been investigated using 3D software for each CT performed throughout follow-up (not just the baseline and last CT scan). Therefore, this study aimed to explore the growth pattern and rate of a group of pulmonary adenocarcinomas ap-pearing as GGOs that were retrospectively analyzed with 3D commercial software to
further understand their natural volumetric behavior. We also evaluated the intra- and in-terobserver variabilities in volume, mass, and DT measurements as well as the relationship between DTs, histopathologic diagnosis, and initial CT features.
Methods
Patients and GGO lesion selection Through a search on the department RIS/ PACS between January 2004 and December 2014, all CT reports containing findings sug-gestive of persistent GGOs, i.e., focal ground-glass (or sub-solid) lesions unchanged or increased in size during a three-month or lon-ger follow-up, were retrieved; both part-solid and pure GGOs were considered.
The search identified a total of 271 pa-tients with one or more persistent GGOs. The study sample was selected according to the following inclusion criteria: a) GGO diameter (i.e., mean between the longest horizontal axis and its perpendicular di-ameter on the largest cross-sectional area of the lesion) of ≥8 mm; b) two or more multidetector CT scans performed with the same scanner and same acquisition/recon-struction protocol; c) thin-section 1 mm axial lung window images in DICOM format available; and d) histologic diagnosis made from surgical resection specimen accord-ing to the International Association for the Study of Lung Cancer, American Thoracic Society, and European Respiratory Society (IASLC/ATS/ERS) classification of lung ade-nocarcinoma (26).
Patients with interstitial pneumonia, a history of pulmonary aspergillosis, eosino-philic pneumonia, organizing pneumonia, or undergoing steroid or chemotherapy treatment were excluded.
Applying such criteria, a total of 22 pul-monary adenocarcinomas exhibiting GGOs were enrolled in the study, including 19 pa-tients (12 males, 7 females) aged 49–84 years (mean, 67.4±10.4 years); three patients had two GGOs. The smoking habits and onco-logic history of the 19 patients are listed in Table 1.
Image acquisition
Seventeen GGOs were scanned on a 16-detector CT scanner (Somatom Sensa-tion 16; Siemens) with the following pa-rameters: collimation, 16×0.75 mm; beam pitch, 1.0; rotation time, 0.5 s; tube voltage, 120 kVp; and tube current, 180 mAs. The remaining five GGOs were scanned using a 128-detector CT scanner (Somatom Defini-tion Flash; Siemens) with the following pa-rameters: collimation, 128×0.6 mm; beam pitch, 1.2; rotation time, 0.5 s; tube voltage, 120 kVp; and tube current, 110 mAs.
The acquisition, extending from the lung apex to lung base, was performed in inspi-ratory apnea without spirometric control of the lung volume. The volume was recon-structed as 1 mm thick sections, applying a sharp reconstruction algorithm and preset windowing, suited for lung parenchyma as-sessment.
Main points
•
Appropriate knowledge of growth patterns and rates of pulmonary adenocarcinomas presenting as ground-glass opacities (GGOs) is an important issue in the management of GGO lesions.•
Three-dimensional measurements are the current method of choice in the assessment of the growth rate of pulmonary nodules (including GGOs) by calculating volume and/or mass changes and their respective doubling times.•
Our three-dimensional analysis shows that pulmonary adenocarcinomas exhibiting GGOs have different patterns of growth: some lesions grow rapidly and some grow slowly, whereas others alternate between periods of growth, stability or shrinkage during follow-up.•
Volume and mass doubling times do not correlate with the initial CT features of the GGOs; however, they may provide information on GGO aggressiveness.Table 1. Characteristics of the study patients (n=19) Characteristics Age (years) 67.4±10.4 Gender Male 12 (63.2) Female 7 (36.8) Smoking habits Current smoker 10 (52.6) Former smoker 8 (42.1) Never smoked 1 (5.3) Oncologic history 10 (52.6) Lung cancer 6 (60)
Number of GGOs per patient
One 16 (84.2)
Two 3 (15.8)
Data are presented as number (%) or mean±standard deviation (SD). GGO, focal ground-glass opacity.
Computerized 3D analysis
The axial diameters, mean CT attenua-tion, volume and mass changes of GGOs, and their volume-DT and mass-DT were cal-culated by matching the baseline and each consecutive CT scan using 3D semiauto-matic software (SAT module, classic version; Terarecon, Inc. ), which allows for the manu-al delineation and correction of nodule con-tours (Fig. 1). When the segmentations of two follow-up CT scans are matched, their results are simultaneously displayed and analyzed by the 3D software (Fig. 2).
Segmentation processing and 3D analysis were assessed visually and considered success-ful when the GGO was completely outlined without any segmentation errors. A threshold attenuation value of −850 HU was used as the lower limit for GGO segmentation (27).
The diameter of each GGO at the baseline and at the last CT scan was determined by
calculating the average of two diameters generated by the software at the end of segmentation (Figs. 1 and 2).
The mass was calculated by multiplying the GGO volume by the mean nodule den-sity (i.e., mean CT number + 1000). Mass changes and mass-DT were calculated only in the GGOs in which CT scans had been ac-quired without contrast.
Prior to the 3D analysis, visual assessment of the presence or absence of a solid com-ponent within the GGO was performed at the baseline and at the last CT scan.
The 3D analysis and visual assessment of the solid component within GGOs were performed by a radiologist with 11 years of experience in thoracic imaging and five years of experience in using the software.
To assess variability of measurements, after an interval of at least six months, the same ob-server and another radiologist (with 15 years
of experience in CT imaging and three years of experience in using the software) inde-pendently repeated the volume, mass, and DT measurements at the baseline and at the last CT scan of the GGOs in which both scans were performed without contrast.
For each GGO, the minimum time interval required to detect a significant growth (i.e., exceeding the interobserver coefficient of repeatability for the volume and mass mea-surements) was also calculated.
The study was approved by the local ethics committee as a retrospective analysis. It did not alter the management of the patients, thus no specific consent was required. Howev-er, informed consent had been obtained at the follow-up steps for both the CT scanning and the treatment of personal data.
Statistical analysis
The data are presented as the number (%) or the mean ± standard deviation for normally distributed data or as the medi-an medi-and the interquartile rmedi-ange (IQR) for not normally distributed data.
Bland-Altman analysis was used to deter-mine the intra- and interobserver variability of the volume, mass, and DT measurements. For the intra- and interobserver variability, the relative differences in measurements were expressed as the percentage of the differences for each pair of measurements divided by the mean of two measurements (without log transformation). The limits for the percentage differences were presented as 95% confidence intervals. For interob-server variability, the first measurement of the first observer was used.
We used the percentage rather than the absolute differences, as proposed originally by Bland and Altman (28), because the differ-ences in measurements are not independent of the magnitude of the measurements. From the Bland-Altman analysis, we also obtained the coefficient of repeatability (CR) (28), which was calculated as 1.96 times the standard de-viation of the differences between the mea-surements and which is a measure of the 95% limit of agreement. In fact, the CR provides a value below which the differences between two repeated measurements would fall with a probability of 95%. Therefore, only differ-ences above the CR should be considered significant.
To compare the measurement variability, the intraobserver and interobserver coef-ficients of variation (CVs) for the volume, mass, and DTs were calculated for each GGO, and the Wilcoxon matched-pairs test was used to analyze the differences.
The Mann-Whitney U-test was used to compare the DTs of pure and part-solid Figure 1. Axial CT images show the semiautomatic segmentation process of a ground-glass opacity
(GGO). Step 1: select the lesion with a mouse click; an initial segmentation is automatically performed by the software. Step 2: choose a threshold CT attenuation value suited for GGOs (-850 HU as the lower limit in this study) and manually outline the lesion contours on all axial CT images. Step 3: check and correct any segmentation errors (arrow) with an editing tool. Step 4: the segmentation is completed, and the software automatically calculates the volume, diameters (i.e., the longest and widest perpendicular diameter on the largest cross-sectional area of the lesion), and 3D mean CT attenuation of the lesion.
GGOs (calculated by matching the baseline and the last CT scan) and to analyze differ-ences between the histologic subtypes. The Spearman correlation coefficient was applied to find correlations between the DT and CT features of GGOs (i.e., diameter, volume, mean CT attenuation, and mass) calculated on the baseline CT scan. For sta-tistical analyses of the relationship between DTs, histopathologic diagnosis, and initial CT features, we considered only GGOs with positive DT values (calculated by matching the baseline and last CT scan).
We applied these tests because the vol-ume, mass, and their respective DTs were not normally distributed.
Statistical analysis was performed with dedicated software (MedCalc Software). P values of <0.05 were considered statistically significant.
Results
All GGOs were histologically proven to be pulmonary adenocarcinomas: of 22 pul-monary adenocarcinomas three were
ade-nocarcinoma in situ (AIS, 13.6%), five were minimally invasive adenocarcinoma (MIA, 22.7%), and 14 were invasive adenocarcino-ma (IA, 63.6%).
Each GGO was scanned 2–6 times (mean, 3.5±1.3 times) before histologic diagnosis; 16 GGOs (72.7%) were monitored more than twice. In 19 GGOs (86.4%), all the CT studies (baseline and each follow-up CT scan) were acquired without contrast, and in 14 of 19 GGOs (73.7%), three or more fol-low-up CT scans were available.
The time interval between the baseline and last CT scan ranged from 126 to 1128 days (median, 573 days; IQR, 256–823 days). The time interval between two consecutive CT examinations ranged from 61 to 670 days (median, 181 days; IQR, 123–279.8 days).
At the baseline CT, seven lesions (31.8%) were classified as pure GGOs and 15 (68.2%) were classified as part-solid GGOs; two pure GGOs developed a solid component during the follow-up period (Table 2). The diameter of GGOs ranged from 8 to 62 mm (median, 16.5 mm; IQR, 12.9–31 mm) at baseline and from 12.5 to 63.7 mm (median, 20.8 mm; IQR, 14.4–34.7 mm) at the last CT scan (Table 2).
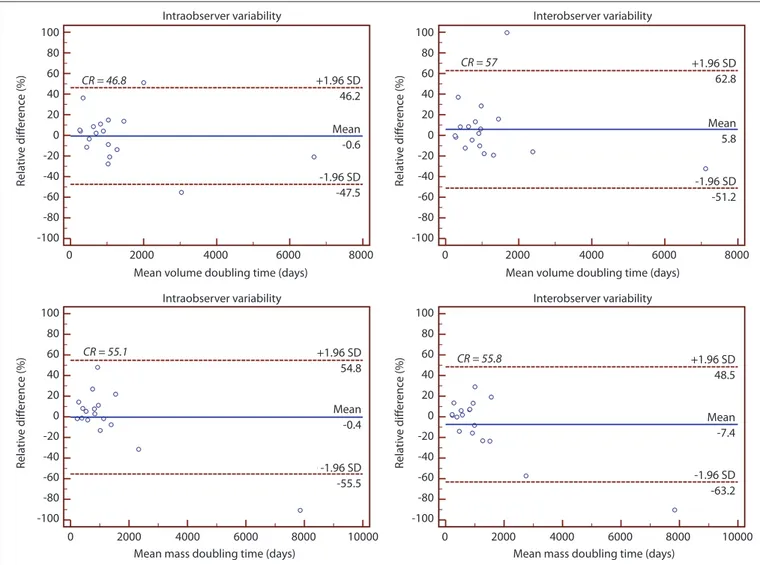
For volume measurements, intraobserv-er variability ranged from -19.3% to 14.3% (CR=16.8%) and interobserver variability ranged from -25.6% to 14.9% (CR=20.2%); for mass measurements, intraobserver variabili-ty ranged from -13.4% to 11.1% (CR=12.2%) and interobserver variability ranged from -20.4% to 12.4% (CR=16.4%) (Fig. 3). The in-traobserver CV for mass was significantly low-er than the CV for volume (median, 0.02; IQR, 0.01–0.04 vs. median, 0.03; IQR, 0.02–0.05; P = 0.006). Similarly, the interobserver CV for mass was significantly lower than the CV for volume (median, 0.02; IQR, 0.01–0.05 vs. me-dian, 0.03; IQR, 0.01–0.06; P = 0.020).
For volume-DT, the intra- and interob-server variability ranged from -47.5% to 46.2% (CR=46.8%) and from -51.2% to 62.8% (CR=57%), respectively; for mass-DT, the in-tra- and interobserver variability ranged from -55.5% to 54.8% (CR=55.1%) and from -63.2% to 48.5% (CR=55.8%), respectively (Fig. 4).
No significant difference was observed be-tween the intraobserver CV for the volume-DT and mass-DT (median, 0.09; IQR, 0.04-0.15 vs. median, 0.06; IQR, 0.02-0.16; P = 0.551). Simi-larly, no significant difference was observed between interobserver CV for the volume-DT and mass-DT (median, 0.09; IQR, 0.04-0.14 vs. median, 0.09; IQR, 0.04-0.16; P = 0.899).
Segmentation and 3D computerized anal-ysis were successfully performed in all cases. Based on the calculated volume and mass changes and their respective DTs on each follow-up CT scan, the 3D analysis of lesions Table 2. Characteristics of the 22 pulmonary adenocarcinomas showing GGOs at multidetector CT
Characteristic Baseline CT Last CT
GGO subtype
Pure 7 (31.8) 5 (22.7)
Part-solid 15 (68.2) 17 (77.3)
Diameter (mm) 16.5 (8–62) 20.8 (12.5–63.7)
GGOs with diameter <30 mm 16 (72.7) 13 (59)
Interval between baseline and last CT (days) 573 (126–1128) Volume*
Growing GGOs 16 (72.7)
Volume increment (%) 84 (22–333)
Doubling time (days) 728.5 (259–2196)
Time interval to detect the growth (days) 170 (39–560)
Data are presented as number (%) or median (range). CT, computed tomography; GGO, focal ground-glass opacity. *Changes from baseline to the last CT scan for growing lesions.
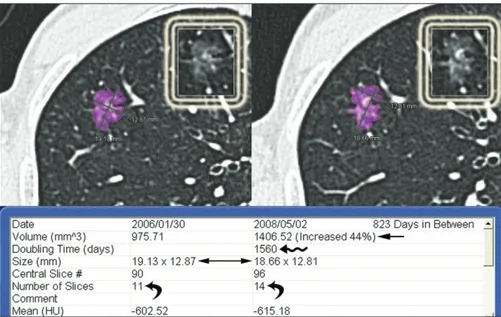
Figure 2. Example of the 3D analysis provided by the semiautomatic software in AIS presenting
as a pure GGO. Baseline (left) and last follow-up CT scan (right). The interval between the two CT examinations was 823 days. In this case, the software calculated a significant relative volume variation of 44% (arrow) of the lesion with a volume-doubling time of 1560 days (wavy arrow), even though the axial diameters were stable (double headed arrow). This discrepancy is due to asymmetric growth of the lesion, predominantly in the longitudinal plane, as confirmed by the increased number of slices displaying the lesion (curved arrows). The white boxes show the GGO without purple overlay at the baseline and last follow-up CT scan.
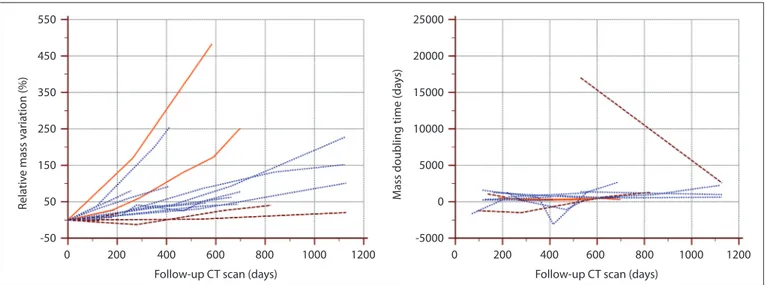
included in this study revealed that pulmo-nary adenocarcinomas presenting as GGOs exhibited different patterns of growth; some lesions grew rapidly and some grew slowly, whereas some alternated between periods of growth, stability or shrinkage (Figs. 5, 6). The volume-DTs and mass-DTs calculated on each follow-up CT scan ranged from -4293 to 21928 days and from -3113 to 17020 days, respectively (Figs. 5, 6).
A significant increase in volume that ex-ceeded the CR of interobserver variability (i.e., more than 20.2%) between the base-line and last CT scan was observed in 16 GGOs (72.7%; 3 pure and 13 part-solid). In this group exhibiting growth, includ-ing one AIS, two MIA, and 13 IA, the mean volume-DT ranged from 259 to 2196 days (median, 728.5 days; IQR, 460.5–952.5 days), and the minimum time interval to detect the growth ranged from 39 to 560 days (me-dian, 170 days; IQR, 101–256 days) (Table 2). In the remaining two part-solid GGOs (MIA
and IA at histology) and four pure GGOs (2 AIS and 2 MIA at histology), the 3D comput-erized analysis did not detect a significant change in volume after a mean time inter-val of 349±387.2 days. In this group, only one GGO (pure, AIS at histology) decreased in volume lower than the interobserver CR (2% after an interval of 126 days). The other five GGOs increased in volume by 4%–16% (volume-DT from 960 to 5968 days).
In the subgroup of 19 GGOs (6 pure and 13 part-solid) scanned without contrast, the mean CT attenuation of GGOs ranged from -602.5 to -144.4 HU (mean, -381.7±133.6 HU) at baseline and from -615.2 to -86.3 HU (mean, -332.4±160.7 HU) at the last CT scan (Table 3). For each lesion, changes in mean CT attenuation throughout the fol-low-up period are depicted in Fig. 7. In this subgroup, a significant increase in mass that exceeded the CR of interobserver vari-ability (i.e., more than 16.4%) between the baseline and last CT scan was observed in
16 GGOs (84.2%; 5 pure and 11 part-solid). In this group exhibiting growth, including one AIS, three MIA, and 12 IA, the mean mass-DT ranged from 226 to 4296 days (median, 844 days; IQR, 410.5–1063 days), and the minimum time interval to detect the growth ranged from 25 to 1008 days (median, 183.5 fays; IQR, 87.5–241.5 days). In the remaining two part-solid GGOs (MIA and IA at histology) and one pure GGO (AIS at histology), the 3D computerized analysis did not detect a significant change in mass after a mean time interval of 148.7±28.7 days. In this group, only one GGO (pure, AIS at histology) decreased in mass lower than the interobserver CR (2% after an interval of 126 days). The other two GGOs increased in mass by 7% and 9% with a mass-DT of 1963 and 1148 days, respectively.
No significant difference was observed be-tween the volume-DT of pure and part-solid GGOs, as classified on the baseline CT (P = 0.392); however, the volume-DT of IA was Figure 3. Bland-Altman plots show the intraobserver (left) and interobserver (right) variability of the volume (top) and mass measurements (bottom). The
solid line represents the mean of differences. The dashed lines represent the upper and lower limits of agreement. SD, standard deviation; CR, coefficient of repeatability. Intraobserver variability CR = 16.8 CR = 12.2 CR = 16.4 CR = 20.2 +1.96 SD +1.96 SD +1.96 SD Mean Mean +1.96 SD 14.3 11.1 12.4 -1.1 -4.0 -13.4 -20.4 -1.96 SD -1.96 SD 14.9 Mean Mean -2.5 -5.4 -19.3 -25.6 0 0 20 40 60 80 100 0 20 40 60 80 100 0 50 100 50 100 20 10 0 -10 -20 -30 -40 20 10 0 -10 -20 -30 -40 20 10 0 -10 -20 -30 -40 20 10 0 -10 -20 -30 -40 150 200 150 200 -1.96 SD -1.96 SD Rela tiv e diff er enc e (%) Rela tiv e diff er enc e (%) Rela tiv e diff er enc e (%) Rela tiv e diff er enc e (%) Intraobserver variability Mean volume (cm3)
Mean mass (g) Mean mass (g) Mean volume (cm3)
Interobserver variability
Figure 4. Bland-Altman plots show the intraobserver (left) and interobserver (right) variabilities of the volume- (top) and mass-doubling time (bottom)
measurements. The solid line represents the mean of differences. The dashed lines represent the upper and lower limits of agreement. SD, standard deviation; CR, coefficient of repeatability.
Intraobserver variability +1.96 SD +1.96 SD +1.96 SD -1.96 SD Mean -1.96 SD Mean +1.96 SD -1.96 SD Mean CR = 46.8 CR = 55.1 CR = 55.8 CR = 57 -1.96 SD Mean 46.2 54.8 48.5 -63.2 -7.4 -55.5 -0.4 62.8 -51.2 5.8 -47.5 -0.6 100 80 60 40 20 0 -20 -40 -60 -80 -100 100 80 60 40 20 0 -20 -40 -60 -80 -100 100 80 60 40 20 0 -20 -40 -60 -80 -100 100 80 60 40 20 0 -20 -40 -60 -80 -100 0 0 0 0 2000 2000 2000 2000 4000 4000 4000 4000 6000 6000 6000 6000 8000 8000 10000 8000 10000 8000 Rela tiv e diff er enc e (%) Rela tiv e diff er enc e (%) Rela tiv e diff er enc e (%) Rela tiv e diff er enc e (%) Intraobserver variability Mean volume doubling time (days)
Mean mass doubling time (days) Mean mass doubling time (days) Mean volume doubling time (days)
Interobserver variability
Interobserver variability
Figure 5. Growth pattern of the 22 pulmonary adenocarcinomas showing GGOs based on volumetric changes during the follow-up (an overall number of
77 consecutive CT examinations) (left). Volume-doubling time variations throughout the follow-up CT in the 16 GGOs scanned three times or more (right). Dashed lines, pure GGOs; dotted lines, part-solid GGOs; solid lines, pure GGOs that developed a solid component during follow-up.
Rela tiv e v olume v ar ia tion (%)
Volume doubling time (da
ys) 550 450 350 250 150 50 -50 25000 20000 15000 10000 5000 0 -5000
Follow-up CT scan (days)
0 200 400 600 800 1000 1200 0 200 400 600 800 1000 1200 Follow-up CT scan (days)
significantly shorter than that of AIS and MIA (median, 728.5 days; IQR, 418–917 days vs. median, 1560 days; IQR, 1195.8–2434.5 days; P = 0.002). No significant difference was observed between the mass-DT of pure and part-solid GGOs, as classified on the baseline CT (P = 0.853); however, the mass-DT of IA was
also significantly shorter than that of AIS and MIA (median, 657 days; IQR, 364–962 days vs. median, 1336 days; IQR, 1075–2357 days,
P = 0.001).
No correlation was found between vol-ume-DT or mass-DT and diameter (r=-0.016,
P = 0.946), volume (r=-0.096, P = 0.678),
mean CT attenuation (r=-0.366, P = 0.135), and mass (r=-0.150, P = 0.553) calculated on the baseline CT scans.
Discussion
Appropriate knowledge of growth patterns and rates of pulmonary adenocarcinomas manifesting as GGOs is an important issue in lung cancer screening and impacts guidelines for nodule management (29, 30). Many stud-ies on the natural history of GGOs are based on changes of the longest diameter mea-sured on 2D axial CT scan, and DTs have been calculated by applying the modified Schwartz formula (6, 7, 24, 25). In two recent studies, the majority of GGOs (73.7% and 85.4%, re-spectively) did not grow during a long-term follow-up of more than two years (24, 25).
However, some malignant lesions have asymmetric growth, resulting in minimal changes in the longest diameter but an in-crease in the overall volume (14). Therefore, only 3D computerized analysis should be considered sufficiently accurate for assess-ing the growth pattern and calculatassess-ing DTs in pulmonary lesions (13, 14).
This observation is clearly illustrated in one of our GGOs in which 3D analysis, per-formed by matching the baseline and 823-day follow-up CT scan, exhibited a relative volume variation of 44% without a signifi-cant change in the axial diameters (Fig. 2).
Initial studies on computerized volumet-ric analysis performed on chest phantoms demonstrated a significantly higher mea-surement inaccuracy in GGOs than in solid nodules (16). The segmentation of GGOs is hampered by the small density gap be-tween the lesion and surrounding normal parenchyma. In addition, volumetric anal-Figure 7. Changes in mean CT attenuation throughout the follow-up CT period (an overall number
of 68 consecutive CT examinations) in the 19 pulmonary adenocarcinomas exhibiting GGOs and scanned without contrast. Dashed lines, pure GGOs; dotted lines, part-solid GGOs; solid lines, pure GGOs that developed a solid component during the follow-up.
M ean C T a tt enua tion v ar ia tion (HU) 300 200 100 0 -100 -200
Follow-up CT scan (days)
0 200 400 600 800 1000 1200
Figure 6. Growth pattern of the 19 pulmonary adenocarcinomas showing GGOs scanned without contrast, based on mass changes during the follow-up
(an overall number of 68 consecutive CT examinations) (left). Mass-doubling time variations throughout the follow-up CT in the 14 GGOs scanned three times or more (right). Dashed lines, pure GGOs; dotted lines, part-solid GGOs; solid lines, pure GGOs that developed a solid component during follow-up.
Rela tiv e mass v ar ia tion (%) M
ass doubling time (da
ys) 550 450 350 250 150 50 -50 25000 20000 15000 10000 5000 0 -5000 Follow-up CT scan (days)
0 200 400 600 800 1000 1200 0 200 400 600 800 1000 1200 Follow-up CT scan (days)
ysis may be influenced by the 3D software utilized, size of the lesion, scanning and reconstruction protocols, and depth of the patient’s inspiration (14–16, 31).
However, relatively recent studies demonstrated that volumetric analysis may play a significant role in GGO monitoring (17, 18). Oda et al. (17) showed promising results on the accuracy and reproducibil-ity of volumetric analysis of GGOs ≥8 mm. Nonetheless, the intra- and interobserver variability were higher than those in studies on solid nodules (13). A newly developed method to assess the growth rate of GGOs is through the calculation of the mass; this parameter is considered advantageous for GGO monitoring because it combines volu-metric and densitovolu-metric evaluation and is subject to less variability than volume (19).
In our study, all GGOs were successfully segmented despite the difficulties reported in the literature (16). Our intra- and interob-server variability were greater than those reported by Kim et al. (32) using commer-cial semiautomatic software without man-ual editing and margin drawing. In their study, intraobserver volume and mass mea-surement variability for reader 1 ranged from -7.6% to 8.5% and from -8.1% to 8.7%, respectively, whereas interobserver volume and mass measurement variability ranged from -11.7% to 18.1% and from -17.5% to 11.8%, respectively. Such differences are likely to be related to the influence of man-ual correction used in our segmentations. However, in clinical practice, the variabili-ty of measurements after manual editing may be reduced because the baseline and follow-up CT scan are simultaneously dis-played by software (Fig. 2); therefore, differ-ences between the two segmentations may
be promptly identified and corrected. Our interobserver variability for volume and mass measurements was lower than that recently reported by Scholten et al. (33) using semiautomatic segmentation software with an editing tool. In their study, interobserver volume and mass measurement variabili-ty ranged from -64.4% to 72.1% and from -43.4% to 53.4%, respectively. Their results may be mainly affected by the algorithm selected for CT image reconstruction (mod-erately soft kernel) (16, 18) and the significant difference in experience of the two observers (greater than that in our study).
With regard to the CV comparison, Kim et al. (32) found no significant difference be-tween volume and mass measurement vari-ability. Conversely, our results demonstrate that mass measurements are subject to less variability than volume measurements, in line with previous data reported by de Hoop et al. (19) using in-house manual software; however, our intra- and interobserver CVs were lower than those reported by de Hoop et al. (19). This difference may be related to the type of 3D software used (semiautomat-ic vs. manual), the algorithm selected for CT image reconstruction (sharp vs. moderately soft kernel) (16, 18), and the size of GGOs an-alyzed (larger in our study) (17).
We also found that the intra- and interob-server variability in volume-DT and mass-DT measurements (not previously reported) were moderately high (Fig. 4), and there was no significant difference between their CVs.
To the best of our knowledge, this study is the first in which 3D analysis of growth pat-terns and the rates of a group of pulmonary adenocarcinomas presenting as GGOs was performed using commercial semiautomat-ic software while considering each CT
per-formed during follow-up (not just the base-line and last scan). This analysis allowed us to demonstrate that adenocarcinomas showing GGOs have different growth patterns and rates (Figs. 5, 6), which were not correlated with the majority of initial CT features, such as nodule consistency (pure or part-solid), diameter, volume, mean CT attenuation, and mass. In fact, some GGOs grew faster (time in-tervals to detect growth for volume and mass measurements of 39 and 25 days, respective-ly) and some grew more slowly (time inter-vals to detect growth for volume and mass measurements of 560 and 1008 days, respec-tively), whereas others alternated between periods of stability, growth, or shrinkage with or without a significant increase in size during follow-up. Furthermore, the volume-DTs and mass-DTs of some GGOs varied considerably throughout the follow-up period (Figs. 5, 6).
These different growth patterns and rates might be due to various factors: interscan differences (i.e., variable degrees of inspira-tory apnea, patient position, intraobserver variability), which might justify the variation of measurements in some cases (32, 34); al-veolar collapse or central fibrosis, which may account for the decrease in volume and mass (35); and molecular mutations switching the lesion toward a more aggressive type, which might explain the rapid growth.
In our study, the volume-DT of growing GGOs between the baseline and last CT scan ranged from 259 to 2196 days (median, 728.5 days; IQR, 460.5–952.5 days). This finding is in line with previous literature data (7, 25), al-though the observed volume-DT was longer than that reported by Oda et al. (21) (mean, 486.4±368.6 days; range, 89–1583 days) us-ing in-house semi-automated software. Such differences might be related to the different sample size and different study design, as we included only GGOs greater than or equal to 8 mm, and each lesion was examined during follow-up with the same scanner and same acquisition/reconstruction protocol.
Conversely, the volume-DTs and mass-DTs of growing GGOs in our study were shorter than those reported by Song et al. (20). We attribute this difference to the different pop-ulation (in their study, only patients without a history of previous malignancy were in-cluded) and the different sample size (only histologically confirmed GGOs greater than or equal to 8 mm were included in our study).
In contrast to the literature data (20, 21), we did not observe statistically significant differences between the DTs of part-solid GGOs and DTs of pure GGOs. With regard to mass-DT, the lack of a significant difference between pure and part-solid GGOs, as clas-sified on the baseline CT, can be explained because some part-solid lesions in our series Table 3. Characteristics of the 19 pulmonary adenocarcinomas showing GGOs at multidetector CT
without contrast
Characteristic Baseline CT Last CT
GGO subtype
Pure 6 (31.6) 4 (21.1)
Part-solid 13 (68.4) 15 (78.9)
Mean CT attenuation (HU) −381.7±133.6 −332.4±160.7
Interval between baseline and last CT (days) 584 (126-1128) Mass*
Growing GGOs 16 (84.2)
Mass increment (%) 78.5 (19–483)
Doubling time (days) 844 (226–4296)
Time interval to detect the growth (days) 183.5 (25–1008)
Data are presented as number (%), mean±standard deviation, or median (range). GGO, focal ground-glass opacity.
showed a reduction in mean CT attenuation during the follow-up (Fig. 7). This finding might be related to a difference in volumet-ric growth between the ground-glass and the solid component. In fact, if the growth of the ground-glass component in a part-solid GGO is greater than the growth of the solid component, it might reduce mean CT atten-uation. Furthermore, two of the fastest grow-ing lesions included in our study were pure at the baseline CT but developed a solid component during the follow-up (Figs. 5, 6).
Nevertheless, our study demonstrated that DT may provide information on GGO aggressiveness because the volume-DTs and mass-DTs of IA were significantly short-er than those of MIA and AIS.
In contrast to our data, Song et al. (20) found no significant difference in median volume-DT and mass-DT among AIS, MIA, and IA. We attribute this difference to the different patients and GGO selection.
This study had several limitations. First, it was performed retrospectively, and the time intervals between two consecutive follow-up CT scans were heterogeneous because no specific recommendations for the manage-ment of GGOs were available at the time of each CT examination and only thin-section CTs (1 mm thick) were selected. Second, only a small number of GGOs were included be-cause the inclusion criteria were quite strict. Third, the lesion size was not small (27.3% were greater than 3 cm at the baseline CT), although a larger size may have reduced the variability of the measurements. Fourth, only the resected GGOs histologically proven to be adenocarcinomas were analyzed; therefore, nonresected lesions were not represented in our data. Fifth, more than 50% of our patients had a history of malignancy; although this group has a risk factor for fast-growing GGOs, we believe that it more appropriately rep-resents daily clinical practice. Sixth, CT scans were performed without spirometric control of lung volume; however, respiratory gating is not easy to apply in clinical settings. Sev-enth, the 3D software used in our study did not have a dedicated vessel extraction func-tion; therefore, the small vessels located with-in GGO lesions were not excluded durwith-ing the segmentation process. However, the vessels contiguous to lesion contours were removed with the manual editing tool.
In conclusion, pulmonary adenocarcino-mas presenting as GGOs show heteroge-neous growth patterns with a trend toward a progressive increase in size over time. Despite their drawbacks, the calculation of volume-DT and mass-DT in GGOs may be useful for predicting tumor aggressiveness. Conflict of interest disclosure
The authors declared no conflicts of interest.
References
1. Kim H, Park CM, Koh JM, Lee SM, Goo JM. Pulmo-nary subsolid nodules: what radiologists need to know about the imaging features and manage-ment strategy. Diagn Interv Radiol 2014; 20:47–57. 2. Park CM, Goo JM, Lee HJ, Lee CH, Chun EJ, Im
JG. Nodular ground-glass opacity at thin-sec-tion CT: histologic correlathin-sec-tion and evaluathin-sec-tion of change at follow-up. Radiographics 2007; 27:391–408. [CrossRef]
3. Lee HJ, Goo JM, Lee CH, Yoo CG, Kim YT, Im JG. Nodular ground-glass opacities on thin-sec-tion CT: size change during follow-up and pathological results. Korean J Radiol 2007; 8:22–31. [CrossRef]
4. Kim HY, Shim YM, Lee KS, Han J, Yi CA, Kim YK. Per-sistent pulmonary nodular ground-glass opacity at thin-section CT: histopathologic comparisons. Radiology 2007; 245:267–275. [CrossRef] 5. Kim TJ, Goo JM, Lee KW, Park CM, Lee HJ.
Clin-ical, pathological and thin-section CT features of persistent multiple ground-glass opacity nodules: comparison with solitary ground-glass opacity nodule. Lung Cancer 2009; 64:171–178. [CrossRef]
6. Hasegawa M, Sone S, Takashima S, et al. Growth rate of small lung cancers detected on mass CT screen-ing. Br J Radiol 2000; 73:1252–1259. [CrossRef] 7. Saito H, Yamada K, Hamanaka N, et al. Initial
find-ings and progression of lung adenocarcinoma on serial computed tomography scans. J Com-put Assist Tomogr 2009; 33:42–48. [CrossRef] 8. Godoy MC, Naidich DP. Subsolid pulmonary
nodules and the spectrum of peripheral adeno-carcinomas of the lung: recommended interim guidelines for assessment and management. Radiology 2009; 253:606–622. [CrossRef] 9. Godoy MC, Sabloff B, Naidich DP. Subsolid
pul-monary nodules: imaging evaluation and stra-tegic management. Curr Opin Pulm Med 2012; 18:304–312. [CrossRef]
10. Revel MP, Bissery A, Bienvenu M, Aycard L, Lefort C, Frija G. Are two-dimensional CT measurements of small noncalcified pulmonary nodules reli-able? Radiology 2004; 231:453–458. [CrossRef] 11. Jennings SG, Winer-Muram HT, Tarver RD,
Far-ber MO. Lung tumor growth: assessment with CT—comparison of diameter and cross-sec-tional area with volume measurements. Radiol-ogy 2004; 231:866–871. [CrossRef]
12. Kakinuma R, Ashizawa K, Kuriyama K, et al. Measurement of focal ground-glass opacity diameters on CT images: interobserver agree-ment in regard to identifying increases in the size of ground-glass opacities. Acad Radiol 2012; 19:389–394. [CrossRef]
13. Wormanns D, Kohl G, Klotz E, et al. Volumetric measurements of pulmonary nodules at multi-row detector CT: in vivo reproducibility. Eur Ra-diol 2004; 14:86–92. [CrossRef]
14. Yankelevitz DF, Reeves AP, Kostis WJ, Zhao B, Hen-schke CI. Small pulmonary nodules: volumetrical-ly determined growth rates based on CT evalua-tion. Radiology 2000; 217:251–256. [CrossRef] 15. Kostis WJ, Yankelevitz DF, Reeves AP, Fluture SC,
Henschke CI. Small pulmonary nodules: repro-ducibility of three-dimensional volumetric mea-surement and estimation of time to follow-up CT. Radiology 2004; 231:446–452. [CrossRef] 16. Ko JP, Rusinek H, Jacobs EL, et al. Small
pul-monary nodules: volume measurement at chest CT— phantom study. Radiology 2003; 228:864–870. [CrossRef]
17. Oda S, Awai K, Murao K, et al. Computer-aid-ed volumetry of pulmonary nodules exhibit-ing ground-glass opacity at MDCT. AJR Am J Roentgenol 2010; 194:398–406. [CrossRef]
18. Park CM, Goo JM, Lee HJ, Kim KG, Kang MJ, Shin YH. Persistent pure ground-glass nodules in the lung: interscan variability of semiautomated vol-ume and attenuation measurements. AJR Am J Roentgenol 2010; 195:W408–414. [CrossRef] 19. de Hoop B, Gietema H, van de Vorst S,
Mur-phy K, van Klaveren RJ, Prokop M. Pulmonary ground-glass nodules: increase in mass as an early indicator of growth. Radiology 2010; 255:199–206. [CrossRef]
20. Song YS, Park CM, Park SJ, Lee SM, Jeon YK, Goo JM. Volume and mass doubling time of per-sistent pulmonary subsolid nodules detected in patients without known malignancy. Radiol-ogy 2014; 273:276–284. [CrossRef]
21. Oda S, Awai K, Murao K, et al. Volume-doubling time of pulmonary nodules with ground glass opacity at multidetector CT: Assessment with computer-aided three-dimensional volumetry. Acad Radiol 2011; 18:63–69. [CrossRef] 22. Hiramatsu M, Inagaki T, Inagaki T, et al. Pulmonary
ground-glass opacity (GGO) lesions-large size and a history of lung cancer are risk factors for growth. J Thorac Oncol 2008; 3:1245–1250. [CrossRef] 23. Kobayashi Y, Fukui T, Ito S, et al. How long should
small lung lesions of ground-glass opacity be fol-lowed? J Thorac Oncol 2013; 8:309–314. [CrossRef] 24. Lee SW, Leem CS, Kim TJ, et al. The long-term
course of ground-glass opacities detected on thin section computed tomography. Respir Med 2013; 107:904–910. [CrossRef]
25. Chang B, Hwang JH, Choi YH, et al. Natural his-tory of pure ground-glass opacity lung nodules detected by low-dose computed tomography. Chest 2013; 143:172–178. [CrossRef] 26. Travis WD, Brambilla E, Noguchi M, et al.
Inter-national association for the study of lung can-cer/american thoracic society/european respi-ratory society international multidisciplinary classification of lung adenocarcinoma. J Thorac Oncol 2011; 6:244–285. [CrossRef]
27. Scholten ET, Jacobs C, van Ginneken B, et al. Com-puter-aided segmentation and volumetry of arti-ficial ground-glass nodules at chest CT. AJR Am J Roentgenol 2013; 201:295–300. [CrossRef] 28. Bland JM, Altman DG. Statistical methods for
assess-ing agreement between two methods of clinical measurement. Lancet 1986; 1:307–310. [CrossRef] 29. Naidich DP, Bankier AA, MacMahon H, et al.
Recommendations for the management of subsolid pulmonary nodules detected at CT: a statement from the Fleischner Society. Radiol-ogy 2013; 266:304–317. [CrossRef]
30. Callister ME, Baldwin DR, Akram AR, et al. Brit-ish Thoracic Society guidelines for the investi-gation and management of pulmonary nod-ules. Thorax 2015; 70:ii1–ii54. [CrossRef] 31. Winer-Muram HT, Jennings SG, Meyer CA, et
al. Effect of varying CT section width on volu-metric measurement of lung tumors and appli-cation of compensatory equations. Radiology 2003; 229:184–194. [CrossRef]
32. Kim H, Park CM, Woo S, et al. Pure and part-sol-id pulmonary ground-glass nodules: measure-ment variability of volume and mass in nodules with a solid portion less than or equal to 5 mm. Radiology 2013; 269:585–593. [CrossRef] 33. Scholten ET, de Jong PA, Jacobs C, et al.
Inter-scan variation of semi-automated volumetry of subsolid pulmonary nodules. Eur Radiol 2015; 25:1040–1047. [CrossRef]
34. Petkovska I, Brown MS, Goldin JG, et al. The ef-fect of lung volume on nodule size on CT. Acad Radiol 2007; 14:476–485. [CrossRef]
35. Aoki T, Nakata H, Watanabe H, et al. Evolution of pe-ripheral lung adenocarcinomas: CT findings correlat-ed with histology and tumor doubling time. AJR Am J Roentgenol 2000; 174:763–768. [CrossRef]