The Rockefeller University Press $30.00 J. Gen. Physiol. Vol. 136 No. 3 325–338
www.jgp.org/cgi/doi/10.1085/jgp.201010454 325
I N T R O D U C T I O N
In mammalian skeletal muscle cells, 200 µmoles of Ca2+ per liter of myoplasm are rapidly released from the SR after an action potential to start the signaling process re-quired for muscle contraction (Pape et al., 1993; Baylor and Hollingworth, 2003). This amount constitutes 10–20% of the total Ca2+ that can be released from the storage organelle, which is estimated at between 0.7 and 5 mmoles per liter of myoplasm. More details and references for these measures can be found in a recent review (Royer and Ríos, 2009).
Ca2+ is released from the SR, an organelle that in fast-twitch mammalian muscle fibers occupies only 5.5% of the total cell volume (Eisenberg, 1984), or 13 times less volume than the accessible myoplasm. To account for
L. Royer and M. Sztretye contributed equally to this paper. Correspondence to Eduardo Ríos: erios@rush.edu
L. Royer’s present address is Institut Francois Magendie, INB, 33077 Bordeaux, France.
S. Pouvreau’s present address is Physiologie Intégrative Cellulaire et Moléculaire, Université Claude Bernard Lyon 1, 69622 Villeurbanne, France.
Abbreviations used in this paper: FDB, flexor digitorum brevis; NFRC, normalized flux rate of change; WT, wild type.
the total releasable amount, the total concentration of the ion in the SR at rest must therefore be between 9 and 65 mM.
The concentration of free Ca2+ inside the resting SR of skeletal muscle has been measured at 0.35 mM in the frog (Launikonis et al., 2005) or 0.31 mM in the mouse (Rudolf et al., 2006). Based on these figures, the buffering power of the SR, the ratio between total and free [Ca2+], must be between 26 and 200, which re-quires a buffer of large capacity inside the SR. To meet the requisite of fast delivery, the reservoir must not have a high Ca2+-binding affinity and should be far from saturated at the physiological [Ca2+]SR. These de-mands are ideally met by the protein calsequestrin, which since its discovery nearly 40 years ago is seen as the main provider of functional Ca2+-binding sites within the SR (MacLennan and Wong, 1971; Donoso et al., 1995; Murphy et al., 2009).
Paradoxical buffering of calcium by calsequestrin demonstrated
for the calcium store of skeletal muscle
Leandro Royer,1 Monika Sztretye,1 Carlo Manno,1 Sandrine Pouvreau,1 Jingsong Zhou,1 Bjorn C. Knollmann,2 Feliciano Protasi,3 Paul D. Allen,4 and Eduardo Ríos1
1Section of Cellular Signaling, Department of Molecular Biophysics and Physiology, Rush University, Chicago, IL 60612 2Department of Medicine and Pharmacology, Vanderbilt University, Nashville, TN 37240
3Centro Scienze dell’Invecchiamento, Università G. d’Annunzio, 66100 Chieti, Italy
4Department of Anesthesia, Perioperative and Pain Medicine, Brigham and Women’s Hospital, Harvard Medical School,
Boston, MA 02115
Contractile activation in striated muscles requires a Ca2+ reservoir of large capacity inside the sarcoplasmic
reticu-lum (SR), presumably the protein calsequestrin. The buffering power of calsequestrin in vitro has a paradoxical dependence on [Ca2+] that should be valuable for function. Here, we demonstrate that this dependence is present
in living cells. Ca2+ signals elicited by membrane depolarization under voltage clamp were compared in single
skel-etal fibers of wild-type (WT) and double (d) Casq-null mice, which lack both calsequestrin isoforms. In nulls, Ca2+
release started normally, but the store depleted much more rapidly than in the WT. This deficit was reflected in the evolution of SR evacuability, E, which is directly proportional to SR Ca2+ permeability and inversely to its Ca2+
buff-ering power, B. In WT mice E starts low and increases progressively as the SR is depleted. In dCasq-nulls, E started high and decreased upon Ca2+ depletion. An elevated E in nulls is consistent with the decrease in B expected upon
deletion of calsequestrin. The different value and time course of E in cells without calsequestrin indicate that the normal evolution of E reflects loss of B upon SR Ca2+ depletion. Decrement of B upon SR depletion was supported
further. When SR calcium was reduced by exposure to low extracellular [Ca2+], release kinetics in the WT became
similar to that in the dCasq-null. E became much higher, similar to that of null cells. These results indicate that calsequestrin not only stores Ca2+, but also varies its affinity in ways that progressively increase the ability of the store
to deliver Ca2+ as it becomes depleted, a novel feedback mechanism of potentially valuable functional implications.
The study revealed a surprisingly modest loss of Ca2+ storage capacity in null cells, which may reflect concurrent
changes, rather than detract from the physiological importance of calsequestrin.
© 2010 Royer et al. This article is distributed under the terms of an Attribution–Noncom-mercial–Share Alike–No Mirror Sites license for the first six months after the publication date (see http://www.rupress.org/terms). After six months it is available under a Creative Commons License (Attribution–Noncommercial–Share Alike 3.0 Unported license, as de-scribed at http://creativecommons.org/licenses/by-nc-sa/3.0/).
The Journal of General Physiology
on October 5, 2010
jgp.rupress.org
[ : ] [ ][ ] [ ] , Ca L Ca L Ca K T D = +
(
)
+ + 2 2 (3)an equation representing what we will refer to as “linear buffering.” Linear buffering is therefore characterized by a decreasing dependence of B and b on [Ca2+]SR.
The evidence that the SR has unique buffering proper-ties was reviewed recently (Royer and Ríos, 2009). It in-cludes the demonstration of nonlinear overall buffering by skeletal muscle SR (whereby B increases with [Ca2+]SR rather than decrease as expected; Pape et al., 2007) and paradoxical behavior of calsequestrin in solution (Park et al., 2003, 2004), whereby b not only increases, but also makes discrete jumps as [Ca2+] is raised. Another indica-tion of a special role is in the elaborate polymeric arrange-ment of calsequestrin molecules inside terminal cisternae (see, for instance, images by C. Franzini-Armstrong and S. Boncompagni in Fig. 1 of Royer and Ríos, 2009), which has led to speculations of a role as “calcium wires,” con-duits that deliver calcium to the lumenal mouth of the release channels (MacLennan and Reithmeier, 1998). Finally, the evidence includes surprising findings that re-main unexplained: the continuing decay of [Ca2+]SR after sparks terminate (Launikonis et al., 2006), a paradoxical increase in [Ca2+]SR imaged in frog fibers releasing Ca2+ (Launikonis et al., 2006) and an analogous rise in lume-nal [Ca2+] that precedes pharmacologically induced re-lease from SR vesicles (Ikemoto et al., 1989). All of these observations can loosely be understood assuming that calsequestrin engages in dynamic changes in its state of aggregation as [Ca2+]SR varies, and that these changes in turn alter the protein’s buffering power.
The present work was undertaken to determine the extent of the buffer role of calsequestrin in muscle, and search for the putative paradoxical [Ca2+]-dependent chan-ges in its buffering power. The strategy was to measure in single voltage-clamped cells of fast-twitch muscle Ca2+ release flux in conditions that lead to SR depletion, including prolonged depolarization (which changes SR content as it proceeds) and exposure to a Ca2+-free solu-tion (which changes the resting SR load). The changes induced by these operations were compared with the effects of the complete absence of calsequestrin, as ob-served in a mouse engineered to lack both calsequestrin 1 and 2 isoforms. We found that Ca2+ release in fibers de-void of calsequestrin is strikingly similar to that recorded in the wild type (WT) after SR depletion. Put another way, when the SR Ca2+ concentration is low, the SR works as if it had little or no calsequestrin.
M AT E R I A L S A N D M E T H O D S
Transgenic animals
Mice lacking both Casq1 and 2 were produced by breeding the Casq1-null (Paolini et al., 2007) and Casq2-null lines (Knollmann et al., 2006). The animals, raised at Charles River Laboratories, In addition to this reversible buffer role, there is
evi-dence in cardiac muscle of a function of calsequestrin as intra-SR Ca2+ “sensor,” mediating a two-way modula-tion by [Ca2+]SR considered essential for termination of Ca2+ release (Cheng and Lederer, 2008; Qin et al., 2008; Domeier et al., 2009). The interest in these effects is both fundamental and translational, as grave diseases affecting cardiac rhythm have been associated with defi-cits of termination of Ca2+ release and inheritable mu-tations of cardiac calsequestrin (Terentyev et al., 2003; Knollmann et al., 2006; Györke and Terentyev, 2008; Valle et al., 2008; Liu et al., 2009).
In contrast, a comparable calsequestrin function of control of RYRs has not been clearly demonstrated for skeletal muscle (for review see Ríos et al., 2006). Although Wang et al. (2006) found that lumenal-side Casq1 en-hanced the activity of RYR1 channels derived from C2C12 muscle myotubes silenced for both Casq isoforms, bilayer studies comparable to those that demonstrated modula-tion of cardiac RYRs (Qin et al., 2008) found no effect of either Casq isoform on RYR1 channels (Qin et al., 2009). Additionally, in isolated muscle cells large store depletion increases channel openness (Launikonis et al., 2006), an effect opposite that observed in the heart.
It is therefore unlikely that calsequestrin alters the gat-ing of release channels in skeletal muscle as it does in cardiac muscle. In contrast, the importance of calseques-trin 1 as buffer has found recent confirmation, both from the demonstration of smaller Ca2+ transients in the Casq1-null mouse (Paolini et al., 2007) and by a good correlation between calsequestrin content and maximal SR calcium content in rat muscles (Murphy et al., 2009).
The buffering function is especially interesting in skeletal muscle, not just because of a much greater SR content of total calcium and consequent need for buff-ering power, but because the buffer inside the skeletal muscle calcium store may have unique properties.
To establish basic nomenclature, we define “buffering power” of a Ca2+-binding molecule or an organelle like the SR as
B Ca
Ca
T
≡[ ] [ 2+], (1)
where [Ca2+] is the free concentration and [Ca]T is the total concentration bound to the molecule or inside the SR. Additionally the “differential” or “slope” buffering power is
b d Ca d Ca
T
≡ [ ] [ 2+]. (2)
For a simple 1:1, ligand L, B, and b become equal and reach their maximum precisely at [Ca2+] = 0, as can be seen trivially by differentiation of
on October 5, 2010
jgp.rupress.org
voltage was good, as judged by the homogeneity of Ca2+ transients, but large ionic currents precluded the measurement of intra-membranous charge movement.
Solutions
Tyrode’s solution contained (in mM): 140 NaCl, 5 KCl, 2.5 CaCl2, 2 MgCl2, and 10 HEPES; pH was set to 7.2 with NaOH and osmolal-ity to 320 mOsm with NaCl. External “reference” contained: 140 mM TEA-CH3SO3, 1 mM CaCl2, 3.5 mM MgCl2, 10 mM HEPES, 1 µM TTX (citrate), 1 mM 4-aminopyridine, 0.5 mM CdCl2, 0.3 mM LaCl3, and 25 µM N-benzyl-p-toluenesulfonamide (BTS; Sigma- Aldrich). External “0 Ca” contained: 140 mM TEA-CH3SO3, 0.01 mM CaCl2, 3.5 mM MgCl2, 10 mM HEPES, 1 µM TTX, 1 mM 4-amino-pyridine, and 25 µM BTS. In both external solutions, pH was ad-justed to 7.2 with TEA-OH and osmolality to 320 mOsm with TEA methanesulfonate. Internal (in pipette) solution contained: 110 mM
N-methylglucamine, 110 mM liter-glutamic acid, 10 mM EGTA,
10 mM Tris, 10 mM glucose, 5 mM sodium ATP, 10 mM PC Tris, 1 mM free Mg2+, and 100 nM free Ca2+; pH was set to 7.2 with NaOH and osmolality to 320 mOsm with NMG-glutamate.
Confocal imaging and determination of free [Ca2+]
Isolated cells were studied at room temperature in a plastic cham-ber with coverslip bottom and mounted on a confocal microscope (SP2 AOBS; Leica). Ca2+ transients under voltage clamp were de-rived from line scan images of the fluorescence of rhod-2, intro-duced through the pipette. Fluorescence of rhod-2 was imaged under excitation at 543 nm (“Ex”), collecting light of intensity, F, emitted between 562 and 666 nm (“Em”) at 0.13–0.24-µm pixel intervals and line frequency variable between one every 2.5 ms and one every 5 ms. All line scan images consist of 512 lines.
In all cases, the scanning was parallel to the fiber axis, no more than 10 µm above the bottom surface of the cell. Line scans of voltage-clamped fibers were normalized by the average F0 (x) of F(x,t) during times before the pulse. A line-averaged F(t)/F0 is cal-culated by averaging over the x coordinate in the entire x extent of the image. Average cytosolic [Ca2+] (t) is derived from F(t) as
[Ca ] ( ) [t Ca ] ( ) F t( ) ( )/ . F dF t dt k F cyto cyto OFF dye 2 2 0 0 0 + = + + (5)
This equation assumes that the dye is far from saturation by Ca2+, an assumption justified in our previous work with internal solutions containing 10 mM EGTA. [Ca2+]
cyto(0) is assumed equal to that in the pipette (0.1 µM). Cells exposed to 0 Ca are analyzed differently (see The calculation of Ca2+ release flux). The value of
kOFFrhod-2 was set as 100 s1 (as determined by Royer et al., 2008). Most cells from dCasq-null mice produced Ca2+ transients that were spatially homogeneous. In contrast, all three cells studied from one null mouse plus isolated cells from other null mice (for a total of seven or 21% of all cells studied) responded with tran-sients that were heterogeneous, seen in the line scan as segmental regions with different rates of rise, and in some places complete failure to mobilize Ca2+. A similar heterogeneity in release was observed in only 1 of more than 100 WT mice studied in our laboratory. The heterogeneous response could correspond to a comparative weakness in the mutant, which makes its cells more susceptible to damage by the enzymatic treatment. Alterna-tively, it might reflect some of the structural abnormalities of plasma and t-tubular membrane described in the Casq1-null mouse by Paolini et al. (2007). Two examples of heterogeneous transients are presented in Fig. S1 B, as these observations might be of interest in further studies of the null animals. Only cells with homogeneous transients were included in the images and analyses of this paper.
were shipped to the animal facility of Rush University at 4–8 wk of age.
Isolation of single fibers from adult mice
Protocols using mice were approved by the Institutional Animal Care and Use committee of Rush University, which found them consistent with their ethical standards. The present results were collected from 10 WT and 15 Casq-null mice. Young mice (6–10 wk) of weight, W, between 25 and 32 g, were euthanized by CO2 inha-lation. The flexor digitorum brevis (FDB) muscle was dissected in Tyrode’s solution, and then transferred to a microcentrifuge tube containing 1 ml of 0.2% collagenase in 0 Ca2+ Tyrode’s solution and incubated at 37°C in an orbital shaker at 50 rpm for a time equal to 10 min + W grams × 1 min/gram. After enzymatic diges-tion, the muscle was transferred to regular Tyrode’s solution and stored at 4°C. Single fibers were obtained by gently passing the FDB muscle through pipettes of different tip sizes.
Electrophysiology
The whole cell patch clamp technique was used to impose voltage control in single FDB mouse fibers. The method used was based on the implementation of Wang et al. (1999). Experiments were performed with an Axopatch 200 B amplifier (Axon Instruments) at room temperature. Data acquisition, pulse generation, and syn-chronization with confocal imaging were performed by a com-puter running custom software.
Pipettes were pulled from borosilicate glass capillaries (Harvard Apparatus) using a vertical micropipette puller (PC-10; Narishige). The pipettes were heat-polished under microscope observation to a tip diameter of 3–4 µm. The external solution (see Solutions) was based on tetraethylammonium methanesulfonate and con-tained inhibitors for the sodium (tetrodotoxin) and potassium channels (4-aminopyridine), and blockers of the L-type calcium channel (Cd2+ and La3+). The internal solution was based on
N-methylglucamine glutamate. The substitution of impermeant
ions for permeant ones and the presence of inhibitors and block-ers allowed a good voltage control of the muscle fiber, documented by Royer et al. (2008). In the set of experiments designed to de-plete the SR of Ca2+, fibers were immersed in a solution with 10 µM [Ca2+] and no calcium channel blockers.
Single muscle fibers were dissociated from FDB muscles and transferred to glass coverslip bottom Petri dishes as described above. Fibers were patched near their center and clamped at 80 mV. The series resistance was analogically compensated and had a typ-ical value of 2–3 M. The holding current ranged from 1 to 10 nA in different fibers and had a typical value of 2 nA. In 60% of the cells where Ca2+ transients were imaged under voltage clamp, a standard study of intramembranous charge movement was per-formed. Nonlinear capacitive and ionic currents were obtained by scaled subtraction of currents in control hyperpolarizing pulses to 100 mV, which were also used to evaluate Cm. Nonlinear or “intramembranous” capacitive currents, IQ(t), were obtained by subtracting from the asymmetric current a sloping baseline fitted starting 40 ms after the beginning or the end of the pulse for ON and OFF, respectively. Intramembranous charge trans-fers QON and QOFF were calculated as the time integral of IQ(t) during the respective transient, and are expressed normalized by Cm. QON versus Vm data were fitted with the Boltzmann function:
Q Q
e
ON= + −(Vm−Vt)K max ,
1 (4)
where Qmax is the maximum charge transfer, Vt is the midpoint (or transition) voltage, and K is the voltage change for e-fold in-crease at limiting low Vm (or steepness factor).
In the experiments designed to deplete the SR, no Ca2+ chan-nel blockers were present in the external solution. The control of
on October 5, 2010
jgp.rupress.org
where zero time is the start of the pulse. R(t) normally grows as-ymptotically to a maximum, R(), which defines the total amount of Ca2+ releasable by depolarization.
It should be kept in mind that the best-fit value of kuptake is correlated near proportionally to the assumed value of [EGTA] total, as is the scale of the resulting calculated flux. Therefore R•, Rnet
•
, and R() remain affected by an unknown scale factor. Evacuability as metric of SR properties
It has been long recognized that the concentration gradient driving release flux is variable, so that flux per se is not a good indicator of the state of the release channels. A better measure is the “depletion–corrected flux,” defined by Schneider et al. (1987) as R R Ca R t c SR • • ≡ − ( )0 ( ), (8)
where the initial SR calcium content, CaSR(0), was equated to
R().
Since its introduction, Rc •
has been used as a measure of SR channel permeability. Royer et al. (2008) demonstrated that
R P
B E
c •
=ϕ ≡ , (9)
where P is permeability, defined as flux per unit area and unit concentration gradient, is SR area to volume ratio, and B was defined in Eq. 1.
This equation implies that R•c does not reflect just channel permeability. Royer et al. (2008) named it evacuability, E, to The calculation of Ca2+ release flux
Ca2+ release flux R•(t) was derived from [Ca2+] (t) by a simplified version of the removal method (Melzer et al., 1984; Schuhmeier and Melzer, 2004; Royer et al., 2008). As explained before, in the presence of a high concentration of EGTA, the result of this calcu-lation depends only on the OFF rate constant of the dye and four other parameters. As discussed in detail in previous work, if the choice of parameter values results in a good fit, the kinetics of lease flux will be robustly determined, while the scale of the re-cords will remain dependent on parameter values. To make the scale of the results comparable across all fibers, we used the same values of all parameters, except kuptake, the rate constant of Ca2+ transport into the SR, which was set for optimal fit of the evolution of [Ca2+] (t). [Dye]
total and [EGTA]total were set to 0.7 of the con-centrations in the pipette (as first done by Ursu et al., 2005). When the experiments lasted more than 60 min, [Dye]total and [EGTA]total were set to 0.9 at this time and interpolated linearly. Other options for the time course of [EGTA]total, including exponential entry and a constant value, were tried alternatively, but the quantitative changes that resulted did not require modifying any qualitative conclusions. kON EGTA was 10 (µM s)1 and kOFF EGTA was 5 s1. Net flux and net amount released
Net fluxR•net( )t, positive if leaving the SR, is the difference be-tween release flux and uptake by the SR:
Rnett R t kuptake Ca cyto
• • +
= − ×
( ) ( ) [ 2 ] . (6)
The amount of Ca2+ released at time t is R t( )= tRnet( ) ,u du
•
∫
0 (7)Figure 1. Cytosolic [Ca2+] in different external solutions. Area-averaged ratio of fluorescence of indo-1 in patched cells immersed in reference external solution (red) or in 0 Ca (black) ver-sus time after breaking into the cell. The dashed curve in black is an exponential fit. The continu-ous black line marks the average for cells in 0 Ca and in cyan is Rmin, measured in situ, in cells ex-posed to a Ca2+-free solution, with membrane permeabilized by saponin. Individual cells are identified by different symbols. ID: red, 032910a, b, d; black, 0325a, c, d; black, 0330a, b, c.
TA B L E I
Properties of intramembranous charge movement in dCasq-null fibers
Qmax nC/µF K mV Vt mV n cells dCasq-null AVG 36.8 9.41 15.6 10 SEM 2.72 0.43 1.62 WT AVG 39.2 10.9 18.8 7 SEM 2.80 0.79 1.43
Entries are best-fit parameter values of the Boltzmann function (Eq. 1) fitted to QON versus Vm data. The last two rows correspond to seven fibers from FDB of reference mice studied by Royer et al. (2008). The differences between averages are not significant.
on October 5, 2010
jgp.rupress.org
stress that its value emerges from several properties that together determine the rate or ease with which the SR can be emptied.
Because CaSR is strictly unknown, E can only be approximated. In the present work, we use the normalized flux rate of change (NFRC), defined as NFRC d R dt Rnet ≡ − • • / , (10)
which satisfies the following equality:
NFRC P B R R d P B dt net = −
(
)
• • ϕ lnϕ . (11)As shown by Royer et al. (2008), the negative “error” term in Eq. 11 is small, provided that two conditions are met: Rnet
• must not be small, and E (and by extension the NFRC) cannot be vary-ing rapidly. Royer et al. (2008) showed with examples that these conditions exclude the first 5–10 ms of a depolarization-induced Ca2+ transient (when the NFRC is changing very rapidly) and are met during the following 200–250 ms. During this interval, the
NFRC is a good measure of E.
As defined, E is a generalization of the exponential rate con-stant of evacuation of the organelle. Thus, if the SR emptied with constant P and B, both its free and total [Ca] would decay expo-nentially, with rate constant E, and so would the flux. A non-expo-nential decay with a “shoulder,” characteristic of WT cells, results in an increasing E.
Cytosolic free [Ca2+] upon exposure to “0 Ca”
A set of experiments aimed at quantifying the effects of SR deple-tion on release flux and evacuability was performed. Depledeple-tion was achieved by exposing cells to 0 Ca external solution. Because the monitor used to image Ca2+ transients, rhod-2, is not ratiomet-ric, resting free cytosolic [Ca2+], [Ca2+]
cyto(0), had to be deter-mined to convert the monitor’s fluorescence to a [Ca2+] measure (Eq. 5). This was done for both conditions, reference and 0 Ca, in multiple cells using SEER of indo-1 (Launikonis et al., 2005) for a ratiometric measure of [Ca2+]
cyto. The results are shown in Fig. 1, where different symbols identify individual cells. In cells exposed to reference external solution (red), the cell-averaged ratio tended to a value that was taken to be equal to [Ca2+] in the pipette solution, 100 nM. For cells exposed to 0 Ca before patching (black), the ratio tended rapidly to a value corresponding on average to a concen-tration of 72 nM. 100 nM and 72 nm were used, respectively, for all experiments in reference and 0 Ca.
Statistical analysis
Differences of unpaired averages were analyzed, assuming normality of the distributions sampled and equality of standard deviations, by two-tailed Student’s t test, with significance threshold at P < 0.05. Online supplemental material
Fig. S1 illustrates heterogeneous Ca2+ transients observed in a group of cells. It is available at http://www.jgp.org/cgi/content/ full/jgp.201010454/DC1.
R E S U LT S
The six subsections that follow present the results of two distinct studies. The first is a comparison of the Ca2+ tran-sients in response to voltage clamp depolarization in FDB muscle fibers of two types of mice: a reference group
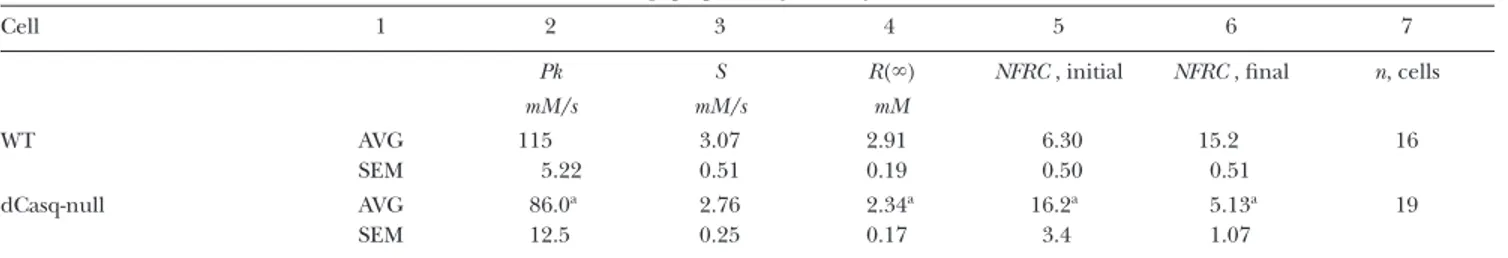
Figure 2. Ca2+ transient and release flux in dCasq-null cells. (A and B) Line scan images of fluorescence of rhod-2 normal-ized to baseline value F0 (x) in cells (WT or null) subjected to a large, long-lasting depolarization (top). In white is normalized fluorescence averaged over x: F(t)/F0. Note that in the WT, F goes through two stages of growth and plateaus after 200 ms. In the null example instead, F goes through a sharp peak and then rises steadily without quite reaching a plateau. (C) [Ca2+]
cyto(t), de-rived from F(t)/F0 records in A and B. (D) Release flux R t
•
( )
derived from [Ca2+]
cyto. Three levels of interest are indicated: Pk, the value at the early peak of the waveforms; QS, a level reached upon descent from the peak and sustained for a brief time in the WT; S, a truly steady level reached at 500 ms in the reference fiber, and, as best seen with the integrals, R(t) (Fig. 7 B), at later times in the dCasq-null. The absence of a QS stage and slow de-cay toward S was a consistent observation in the null; the excess in Pk was not. Averages of Pk and S are in Table II. Values of the removal model parameters used in the calculation of flux, which were identical for both cells, are given in Materials and methods. ID: A, 021408a_25; B, 020609b_3.
on October 5, 2010
jgp.rupress.org
WT case by F reaching a steady or slightly decaying max-imum. It is understood that at this point in time, Ca2+ release through RYRs becomes balanced by reseques-tration into the SR (see, for instance, Fig. 6 in Royer et al., 2008).
In the null cells the transient is different. It goes through an initial peak—never seen in the WT—from which it decays rapidly to then recover slowly. In indi-vidual null cells, the early peak of fluorescence could reach values greater than in most WT cells at a compa-rable time during the pulse, a difference that results from a greater initial peak of Ca2+ release flux, as de-scribed below. This early peak, however, was variable among cells, as reflected in the large standard error of the average (Table II). The recovery of the fluorescence level from the trough that follows the early peak was also variable (for further description of this stage, see Total releasable calcium in Casq-null cells).
The interpretation of the altered kinetics was helped by an analysis of the records in terms of Ca2+ release flux,R t•( ). The waveforms of flux are reliable kinetically, although their scale is strictly dependent on the values of the model parameters. In the interest of comparisons across platforms, we assumed values similar to those used in an earlier study (Ursu et al., 2005).
R t•( ) for images in A and B of Fig. 2 is illustrated in panel D. The calculation first derives the line-averaged Ca2+ transient ([Ca2+]cyto(t); Fig. 2 C) from the line- averaged fluorescence, taking into account the kinetic constants of the dye. The calculation reveals a sharp difference inR t•( ). As described by Royer et al. (2008), in the WT,R t•( )goes through an early peak (at a value
Pk), followed by decay to an intermediate level (QS),
and then a second fall to a sustained level, S. The decay after QS was described as a “shoulder.” In the null cell, R t•( )also goes through an initial peak, but then decays in one roughly exponential step, with no shoulder, to the final S.
(WT) and mice null for both calsequestrin isoforms. The second is an examination of the changes in Ca2+ tran-sients induced by exposure of cells to an extracellular sa-line without Ca2+.
The state of the membrane voltage sensor (DHPR) was first evaluated through the properties of their intra-membranous charge movement. The linear capacitance,
Cm, continuously measured in control currents elic-ited by voltages negative to the holding potential, was approximately constant during the experiments. Its average, 1.7 nF (SEM 0.22), was not significantly dif-ferent than the average in WT cells studied by Royer et al. (2008).
Table I lists parameter values for best fit of the Boltzmann function (Eq. 4) to charge transfer Q versus
Vm in the ON transients from 10 Casq-null cells. For comparison, the table includes the average parameter values of the WT fibers studied by Royer et al. (2008). There are no significant changes. In summary, the Casq- null cells did not differ substantially from the WT in ki-netics, amount, or voltage dependence of their t-tubule voltage sensor charge movement. This statement is valid for the null fibers studied here, selected by exclusion of 21% of cells through criteria described in Materials and methods.
The Ca2+ transient of dCasq-null cells
Fig. 2 (A and B) compares confocal line scans of the fluorescence of rhod-2 in a WT FDB cell and a repre-sentative cell from a dCasq-null mouse in response to a pulse to a fully activating voltage (+30 mV). The images illustrate consistent differences. In the WT, the fluores-cence increases in two stages to a sustained level. As demonstrated by Royer et al. (2008), a 0.4-s pulse is suf-ficient to cause release of a maximum amount of Ca2+ from the SR. In other words, no additional depletion will be caused by pulses of increased voltage or dura-tion. The completion of net release is revealed in the
TA B L E I I
Average properties of release flux
Cell 1 2 3 4 5 6 7
Pk S R() NFRC , initial NFRC , final n, cells
mM/s mM/s mM WT AVG SEM 115 5.22 3.07 0.51 2.91 0.19 6.30 0.50 15.2 0.51 16 dCasq-null AVG SEM 86.0a 12.5 2.76 0.25 2.34a 0.17 16.2a 3.4 5.13a 1.07 19 Two long duration pulses (one of 0.4 or 0.5 s, and the other of 1 s) to +30 mV were applied in every cell and the ensuing Ca2+ transients were imaged in line scan mode, respectively, at 2.5 or 5 ms per line. Column 2, peak flux, measured on the transient recorded at 2.5 ms/line and corrected for the blunting effect of low acquisition rate as described by Royer et al. (2008). Column 3, steady flux, reached at variable times into the 1-s pulse. Column 4, total amount of releasable calcium, defined as the asymptotic maximum of the time integral of net flux (compare with Fig. 7). Column 5, NFRC value reached immediately after the end of the initial peak of flux; for reference fibers, this was always the minimum value, while in null fibers it was usually the maximum. Column 6, NFRC value reached at the end of the interval where it is defined (250 ms); the NFRC value at this time was usually a maximum for reference fibers and a minimum for null fibers (compare with Fig. 3 B).
aThe value is significantly different from the corresponding value in the WT.
on October 5, 2010
jgp.rupress.org
Fluorescence transients and flux are illustrated in Fig. 4. Compared with the reference (in blue), F(t) in 0 Ca lacked the rise in two phases and resembled instead that of Casq-null cells, with features that included an early peak followed by decay and often a second slow in-crease. The corresponding flux records are in Fig. 4 B. In this and six other cells studied in the same way, the flux, which started with a peak similar to that in refer-ence, presented in the earliest records a lesser shoulder and evolved upon longer exposure to a seemingly expo-nential decay.
To better demonstrate the kinetic changes, the flux records of the cell in 0 Ca are shown again in Fig. 4 C, A similar evolution was observed in every image of
every null fiber studied. Averaged peak and steady val-ues are compared in Table II. Pk was 20% lower in null cells. S did not differ substantially.
SR evacuability was greatly altered in dCasq-null cells
E (Eq. 9) is proportional to P, the SR membrane
perme-ability to Ca2+, and inversely to B, the SR buffering power for Ca2+. Although E is strictly not knowable without di-rect measurements of SR Ca2+, it can be approximated by the NFRC (Eq. 10). Fig. 3 A plots the evolution of the
NFRC from the flux records in Fig. 2 D. In the WT
(blue), this index increases during the pulse, as ex-pected given the shoulder in the flux record (compare Materials and methods). In the Casq-null cell, in con-trast, the NFRC starts high and decays during the pulse. That these differences are reproducible is demon-strated in Fig. 3 B, displaying records obtained by aver-aging the NFRC from every available line scan in WT and null animals. Solid and dashed lines correspond to different image acquisition frequencies. A different representation of the same measures is in Table II, list-ing averages of the extreme values of NFRC. Both repre-sentations demonstrate the striking effect of the double Casq deletion.
As argued by Royer et al. (2008), the evolution of E in the WT may reflect an increase in P (hypothesis 1), a decrease in B (hypothesis 2), or both changes occurring together. Because in Casq-null cells, which lack the main buffer, E started much higher, the results are apparently more consistent with hypothesis 2. Alternatives will be considered in the Discussion.
The result prompts another inference: as can be seen in both Fig. 3 and Table II, the value of E attained when the SR has released most of the Ca2+ that it can release is similar to the initial value of E in the null cells. The Ca-depleted situation recreates in this sense the func-tional phenotype of the calsequestrin-lacking cells. As recalled in the Introduction, the buffering power of calsequestrin decreases with [Ca2+] in solution. If this property applied in vivo, B provided by calsequestrin should decrease as the SR depletes, thus explaining the rise in E. The decay of E upon release in the nulls is an unexpected additional phenomenon, taken up in the Discussion.
Ca2+ transients changed shape at low SR loads
If the increase in E during depolarizing pulses in the WT was due to loss of buffering power by calsequestrin in the lower [Ca2+] of a depleted SR, the increase should be reproducible upon depletion by other means. This hy-pothesis was tested by exposing WT muscle fibers to an external solution, 0 Ca, with only a small amount of Ca2+ left (to facilitate patching). As shown later, this exposure resulted in substantial reduction of releasable calcium after tens of minutes.
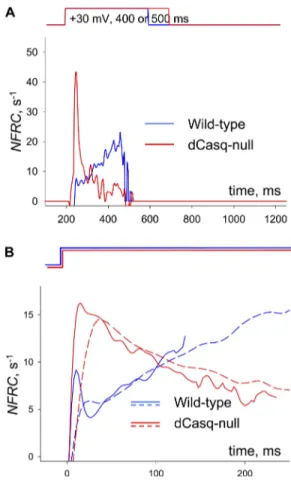
Figure 3. Evolution of evacuability in WT and dCasq-null cells. (A) The NFRC, an index approximately equal to E (see Materials and methods) calculated for the example images of Fig. 2. The
NFRC is ill-defined if Rnett
•
( ) is close to zero. We stop its calcula-tion when Rnett
•
( ) reaches a (low) threshold of 1 mM/s, which occurs by 300 ms in these examples. (B) Averages of NFRC(t) over all WT and null cells subjected to long duration pulses. Two acquisition frequencies were used to allow for different pulse du-rations in images of the same digital format. For averaging, the traces were grouped by frequency (solid, 2.5 ms/line; dashed, 5 ms/line) and aligned to the beginning of the pulse. Averaging was extended to the first time when Rnet
•
reached threshold in any individual record. Except at the beginning of the pulse, when
NFRC changes rapidly and is not a good measure of E (Materials
and methods), the properties of the averages do not depend on scanning frequency. The averages generally reproduce the evolu-tion of the individual examples in A.
on October 5, 2010
jgp.rupress.org
Evacuability increased at low SR loads
To test the working hypothesis 2—that the increase in E during Ca2+ release is due to a reduction in B—it was im-portant to evaluate the changes in E brought about by SR depletion in the WT. This evaluation is illustrated in Fig. 5 on images acquired at greater temporal resolution and smoothed and scaled to the same peak. Superimposed
for comparison isR•of the Casq-null cell image in Fig. 2. In this and other cells, as time in 0 Ca increased, release flux decreased in amplitude, lost its shoulder, and fea-tured a progressively faster decay, becoming similar in kinetics toR• of Casq-null cells.
Figure 4. Fluorescence and flux in WT cells exposed to 0 Ca. (A) Fluorescence transients in response to the depolarizing pulse shown. Traces in green, cyan, and red are for the same cell after increasing times of exposure to 0 Ca (keyed in B). The record in blue is from a different cell in reference solution. Note that the amplitude of transients progressively falls and their kinetics becomes increasingly similar to that of the dCasq-null in Fig. 2. (B) R t•( ), calculated from records in A, showing that in 0 Ca records lose the shoulder, characteristic of the WT in reference solution, becoming progressively similar to flux in dCasq-null cells. This is demonstrated in C, where the records in 0 Ca from B are scaled to match the peak of the R t•( ) from the dCasq-null example in Fig. 2. ID: WT in reference, 122206d_26; WT in 0 Ca, 052209b_9, 10, 11. For calculations of flux, [EGTA] in the 0 Ca example was assumed to enter the cell according to a saturating exponential of = 40 min.
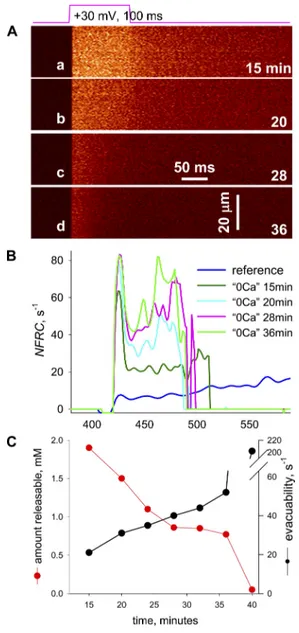
Figure 5. The evolution of evacuability in a cell exposed to 0 Ca. (A) Line scans of fluorescence in a WT cell exposed to 0 Ca. Times of exposure are given, in minutes, at the bottom right cor-ner of every panel. (B) NFRC for images in A. In blue is NFRC for a WT cell in reference solution (same as in Fig. 2). Images for the cell in 0 Ca were acquired at a higher frequency, hence the initial peak in NFRC, which is blunted in the reference record. Although
NFRC increases with time of exposure, the interval when it is
defined becomes shorter, a direct result of the increase in E. (C) Black symbols, evacuability, calculated for images in A and other images as an average of the NFRC in the first 20 ms after the ini-tial peak (the iniini-tial peak is excluded because a rapidly changing
NFRC ceases to be a good approximation of E). Red symbols, total
releasable amount of calcium, R(), plotted versus time of expo-sure to 0 Ca. Note the inverse dependence between evacuability and amount releasable. ID, 092409b. Reference is 021408a_25.
on October 5, 2010
jgp.rupress.org
would be expected to result in severe curtailment of
R(), the maximum amount of Ca2+ that can be released
by depolarization.
The calculation of R(), as the maximum reached as-ymptotically, upon a long-lasting, high voltage depolar-ization of the integral of Rnett
•
( ) is illustrated in Fig. 7. Rnet
•
is represented in Fig. 7 A for pulses of 1-s duration in a WT (blue) and a null cell (cyan). Also represented is Rnet
•
calculated for the null cell transient in Fig. 2 B (red). R•net evolves similarly toR
•
, but tends to zero after a variable time of depolarization. The corresponding running integrals of flux, R(t), are in Fig. 7 B.
For the WT cell in the figure, R(t) did not climb mono-tonically, but came down slightly after a maximum. (A reason for the slight decrease, which is also present in the raw fluorescence signal, may be a spatial heteroge-neity in control of membrane voltage, which results in greater activation near the pipette.) R() was taken to be that maximum. For the null cell represented by the curve in cyan, R(t) had not quite reached its maximum by the end of the 1-s pulse, and R() was calculated as the asymptote of the exponential fit to R(t) in the last 700 ms of the pulse. For the null cell represented by the curve in red, R() was not defined. The average R() in all cells where it was defined, listed in Table II, was reduced by 20% in the null fibers, a statistically signifi-cant difference.
The kinetic difference demonstrated in the figure is representative of most cells. In WT cells, R(t) always reached its steady value in 0.5 s or less, a time when
R(t) was still increasing in most null cells. 13 of 19
Casq-null cells featured such slow tendency to R(), which of course reflected a slower decay of Rnet
•
to zero (visible in Fig. 7 A).
In a qualitative sense, the kinetic difference does not depend on the assumptions needed to calculate R(t). summarized for multiple fibers in Fig. 6. Fig. 5 A shows
fluorescence changes in response to a high voltage pulse at increasing times in 0 Ca. Fig. 5 B plots NFRC for each re-cord. The average NFRC in reference solution is added for comparison (record in blue).
A quantitative summary of the experiment is in panel Fig. 5 C, plotting E (black) and releasable amount of cal-cium, R() (red), versus time of exposure to 0 Ca. E in-creased monotonically as the releasable amount dein-creased.
The inverse relationship between E and R() applied uniformly across times, loads, and experimental condi-tions. This is documented in Fig. 6, which summarizes 7 experiments in 0 Ca and 17 in reference external solu-tion, all in WT mice. The continuous line plots the hyper-bolic decay that fits best all points.
The conclusion from this section is that E increases monotonically as R() decreases. The change in E with SR content is thus consistent with the hypothesis that calse-questrin loses buffering power as it loses bound Ca2+. The changes in 0 Ca were, however, not identical to those ob-served in the dCasq-null muscles. The most interesting di-vergence was a progressive decrease in E during Ca2+ release in the null cells, corresponding to a slow creep upwards in [Ca2+]cyto during the depolarizing pulse. Some WT cells ex-hibited this evolution when exposed to 0 Ca, but many did not, showing instead an elevated E, constant or increasing during the time that E was measurable (e.g., Fig. 5 B). As argued below, this difference probably reflects changes during development in the null mice, which cannot be re-produced by an acute reduction of SR calcium content. Ad-ditional unspecified alterations brought about by the lack of extracellular Ca2+ could also explain this difference. Total releasable calcium in dCasq-null cells
Calsequestrin is believed to be the main buffer of Ca2+ inside the SR; therefore, elimination of calsequestrin
Figure 6. Evacuability is inversely related to re-leasable amount of calcium in the SR. Symbols plot the initial value of E, calculated by an average of NFRC as described in Fig. 5, versus the corre-sponding R(), calculated on the same or a con-temporaneous transient of adequate duration, for individual cells after varying times of expo-sure to 0 Ca. Colors identify individual cells. The blue circle and the large pink circle represent, respectively, the example WT cell of Fig. 2 and av-erage values for 17 cells in reference solution. The continuous line plots the function E = ab/(R+b), with a = 334 mM1s1 and b = 0.0615 mM.
on October 5, 2010
jgp.rupress.org
a complex decay path (demonstrated in Fig. 2 D). Re-lease starts with an initial peak, terminated by a first, abrupt phase of decay. In amphibian muscle, the work of Baylor and Hollingworth (1988), Schneider and Simon (1988), Jong et al. (1995), Pape et al. (1995), and Pizarro and Ríos (2004) ascribed this decay to inactiva-tion mediated by cytosolic Ca2+ (“CDI”). This phase is followed by a slower decay, which presents with a “shoul-der” that can be described more precisely as a change from negative to positive curvature in R t•( ).
Royer et al. (2008) also showed that this shoulder re-sulted mathematically in a rising value of E. The in-crease in E could reflect an inin-crease in P (expected, Indeed, the evolution of R(t) is roughly proportional to
that of F or [Ca2+]cyto because in the highly buffered inter-nal solution used here, the net amount of Ca2+ released is translated almost linearly to the final increases in [Ca2+] and fluorescence. The surprising conclusion is, therefore, that when channels are maximally activated by voltage, net release lasts for a longer time in Casq-null than WT cells. Release flux elicited by trains of pulses
One last aim was to explore the differences due to the absence of calsequestrin using a depolarization closer to the train of action potentials that activates Ca2+ re-lease in the living animal. In mouse FDB at body temper-ature, a typical action potential may have a full duration at half-maximum of 1 ms, whereas the train may have a duration of 1 s and a frequency of 30–120 Hz (unpub-lished data). To produce a series of resolved Ca2+ tran-sients at room temperature, we applied depolarizations at the low end of those frequencies (30 Hz) with the pattern illustrated in Fig. 8 A. Five fibers of each type, null and WT, were subjected to such trains.
The fluorescence transients of one WT and one null fiber are shown in Fig. 8. Ca2+ transients are in Fig. 8 C, and R• is in panel D. The comparison is completed in Fig. 8 E, showing the evolution of the amount released
R(t) in the successive depolarizations. The comparisons
in Fig. 8 recapitulate qualitatively every observation made using continuous depolarizations. The imaginary line tracing the peaks of R• features a shoulder for the WT and a faster, exponential-like decay for the null. The differ-ences are also present in the evolution of peak (and aver-age) fluorescence, namely a two-stage increase in the WT, which levels off in hundreds of ms, and an initial peak fol-lowed by a trough and a much slower creep upward in the null. The integrated amount released (Fig. 8 E) features similar differences. Although these evolutions take place at a slower pace than with continuous depolarizations, every kinetic aspect of the difference between WT and null seems to be reproduced qualitatively. This result shows that features of responses obtained with continu-ous depolarization can be extrapolated to the responses to more physiological trains, at least qualitatively.
D I S C U S S I O N
The present work was designed to continue the exami-nation of the processes that in mammalian muscle con-trol Ca2+ release from the SR. In particular, it sought answers to questions first raised by Royer et al. (2008) in their study of the response to activating pulses that cause substantial emptying of the SR.
The evolution of evacuability is associated with changes in SR Ca2+ buffering
Royer et al. (2008) showed that the flux of Ca2+ release activated by a long-lasting depolarization evolves along
Figure 7. Substantial releasable Ca2+ remains in dCasq-null cells. (A) Rnett
•
( ) calculated (Eq. 6) for a WT cell (blue) and a dCasq-null cell (cyan) subjected to a 1-s–long depolarization, and the dCasq-null cell of Fig. 2 (red). Rnett
•
( ) is similar to R t•( ) but tends to 0 during the pulse and becomes negative afterward. It there-fore shows similar kinetic differences between WT and null cells. (B) Net amount of Ca2+ released, R(t), calculated (by Eq. 7) for the fluxes in A. The records illustrate that null cells may release sub-stantial amounts of calcium (see Table II for averages). They also show that R(t) typically reaches its maximum, R(), much sooner in the WT. For the case represented by the cyan curve, R(t) did not quite reach maximum, and R() was calculated as the asymp-tote to the curve in black, an exponential fit to the last 700 ms of
R(t) during the pulse. R() could not be reliably established for
the release record represented in red. ID: WT, 101906b_31; nulls, 082108c_14 (cyan) and 020609b_3 (red).
on October 5, 2010
jgp.rupress.org
fourfold decrease in B, implying that calsequestrin pro-vided three fourths of the SR Ca2+ buffering at the time of the measurement. (This quantitative estimate would need revising if P changed in the null, for example, after alterations in [Ca2+]SR, or if the decrease in B asso-ciated with loss of calsequestrin were offset by “adapta-tions.” Both of these changes are plausible.)
A second insight stems from the observation that the initial value of E in the null is close to that reached in the WT by 250 ms into the pulse, when most of the releas-able Ca2+ is out of the SR (Fig. 3 B). This fact suggests that the decrease in B is due to a vanishing contribution of calsequestrin to SR buffering power. This of course implies that the protein inside the SR conserves the be-havior described by Park et al. (2003, 2004) for calse-questrin in solution, and, furthermore, that calsecalse-questrin contributes very little as a buffer when [Ca2+]SR is near its minimum.
We tested these inferences by quantifying the response of WT cells with SR depleted in a 0 Ca solution. 15–20 min after cells were placed in 0 Ca, E was already greater than in reference solution and continued to increase with time of exposure. Although the time dependence of the effect was variable in different cells, a roughly single-val-ued inverse functional dependence, plotted in Fig. 6, was found between E and releasable amount of SR cal-cium. The result upholds the hypothesis that the in-crease in evacuability during long-lasting Ca2+ release is because CDI should diminish together with SR load).
It could also result from a decrease in B, also expected, based on the behavior of calsequestrin in aqueous solu-tions of different [Ca2+] (Park et al., 2003, 2004). Con-sistent with this explanation, a reduction in buffering power of the SR with SR depletion was demonstrated by Pape et al. (2007), using tetramethyl-murexide to di-rectly monitor [Ca2+]SR.
The concentration dependence of Ca2+ –calseques-trin binding in aqueous solutions is remarkable for the apparent generation of additional binding sites as [Ca2+] increases. The buffering power, B, does not simply grow; interestingly, the “slope” buffering power (Eq. 2) undergoes discrete jumps, apparently associ-ated with successive stages of protein polymerization (Fig. 5 of Park et al., 2004). The present work explored whether this process, operating in reverse, could ex-plain the increase in E upon SR depletion. It found that the shoulder of flux and the associated changes in
E are absent in the cells of double Casq-null mice fully
devoid of calsequestrin.
The evaluation of E in null mice afforded two sepa-rate insights. First, we found that its value (at the time when it can be first equated to the NFRC index) was ele-vated fourfold. Assuming that the initial values of P did not change (as indicated by the inability of Casq1 to af-fect gating of RYR1, demonstrated by Qin et al., 2009, in bilayers), the observed change in E would require a
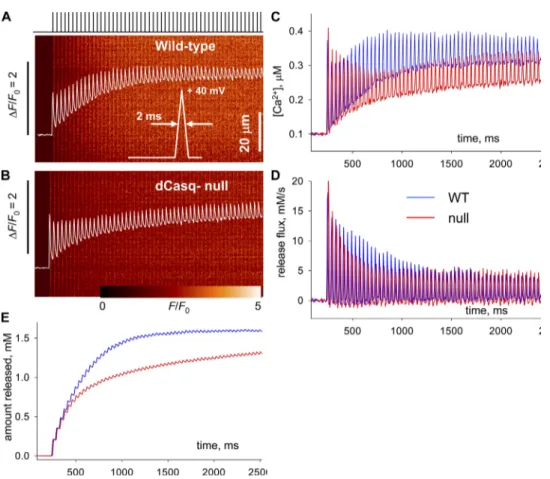
Figure 8. Transients and flux elicited by a pulse train. The fig-ure illustrates the kinetic analysis of Ca2+ flux for transients elicited by a train of depolarizing pulses (illustrated in A) to + 40 mV, at 30 Hz, lasting 2.5 s. (A and B) Fluorescence transients in WT and dCasq-null cells. (C and D) Corresponding evolution of [Ca2+]
cyto and Rnet •
. (E) Evolu-tion of amount released, R(t). The peaks of the increases in all magnitudes repeat the dif-ferences between WT and null illustrated in previous figures. Specifically, fluorescence and [Ca2+]
cyto(t) can be compared with the corresponding records in Fig. 2, R•net and R(t) with those in Fig. 7. ID: WT, 012809b_10; null, 020509b_8.
on October 5, 2010
jgp.rupress.org
during a depolarization, the null cells have access to a releasable reservoir that is absent in the WT. This differ-ence could reflect an actual pool of binding sites that is present only in the null. In this regard, the evidence is inconclusive. On the one hand, Paolini et al. (2007) found no compensatory changes in Ca2+-binding pro-teins reported for the Casq1-null. On the other, in both Casq1-null skeletal fibers and Casq2-null cardiac myo-cytes the junctional membrane area was increased. If these changes were present in the double null, the lipid membrane itself, or some SR-lumenal molecule as-sociated with it, could provide a greater storage com-partment. Alternatively, the newly available pool might consist of binding sites that remain saturated by Ca2+ in the WT but become “exposed” in the null, perhaps be-cause [Ca2+]SR decreases further during depolarization in these mice.
Perhaps concurrently, as proposed by Murphy et al. (2009), resting [Ca2+]SR could be increased in the null cells. The SR content of the predominantly fast-twitch cells of rat EDL is far from maximal (Lamb et al., 2001). This observation suggests that the “set point” of free [Ca2+]SR in the predominantly fast-twitch FDB may be well below saturation of calsequestrin in the WT and change in the null mice. A [Ca2+]SR that is higher at rest and decays farther in the nulls could put other buffers into play and explain that releasable calcium remains sizable in the absence of calsequestrin.
A second reason for the presence of large initial release flux in some of the null cells may be a greater number of RYRs, which were overexpressed significantly in Casq1-null cells, matching the increase in area of junctional SR (Paolini et al., 2007).
The study of Knollmann et al. (2006) noted an in-crease in the volume of the SR of Casq2-null cardiomyo-cytes and used it to justify in part the apparent lack of consequences of the ablation of calsequestrin for their ability to store and release calcium. This is not the case in Casq1-null skeletal muscle, where there is shrinkage of SR terminal cisternae and no change in total SR vol-ume (Paolini et al., 2007). Moreover, in mouse EDL, the volume of the SR is 5.5% of the cell volume (Eisenberg, 1984), and the SR content is sufficient to increase total calcium concentration in the cytosol to between 1 and 5 mM. Therefore, under the assumption that acces-sible cytosol is 70% of cell volume, total [Ca2+] in the SR must be 13–64 times greater than free [Ca2+]SR. Therefore, even doubling the SR volume would not measurably compensate for loss of buffering power in the null cells. Evidently, extrapolations are not war-ranted between the roles of calsequestrins and the “adaptive” features of the respective calsequestrin-nulls in skeletal and cardiac cells.
The promotion of SOCE, which is expected upon abla-tion of calsequestrin (Shin et al., 2003), is unlikely to con-tribute to the R() of null cells in the present experiments, due to a reduction in buffering power of calsequestrin
upon SR depletion. This increase in E implies in turn that SR emptying will accelerate as it proceeds.
In sum, there are two clear reasons for the increase in
E during depolarization: an increase in P and a decrease
in B. The latter appears prominent in light of the pre-sent results, as it alone justifies both the greater resting value of E in null cells and its failure to increase with SR depletion. In contrast, the change in P evaluated in frog muscle was minor overall (Pizarro and Ríos, 2004) or re-quired substantial depletion to become sizable (Pape and Carrier, 2002). An additional reason for the increase in P in the null would be the release of an allosteric in-hibition by calsequestrin, similar to the effects re-ported by the cardiac isoform acting on RYR2 (for review see Knollmann et al., 2006; Györke and Terentyev, 2008; Qin et al., 2008). Such action, however, appears unlikely given the failure of calsequestrin 1 and RYR1 to interact functionally in bilayers (Qin et al., 2009) as their car-diac homologues do.
Implications for the physiological role of calsequestrin The present results may seem contradictory in their functional implications. On the one hand, they reveal striking changes in the kinetics of Ca2+ transients and release flux upon ablation of calsequestrin (Figs. 2 and 4). These alterations, best summarized and quantified by the changes in E, reinforce the consensus that calse-questrin is a substantial Ca2+ storage device. Moreover, the unique buffering properties of calsequestrin re-vealed here are reasonably expected to have virtuous functional consequences.
On the other hand, the results indicate that Casq-null cells are missing only 20% of the releasable calcium, a figure at first sight inconsistent with a central role of the protein in calcium storage. The contractile phenotype of dCasq-null muscle is currently under study and ap-pears generally similar to that of Casq1-null muscle (un-published data). Therefore the impairments reported here can be compared and are generally consistent with the observations by Paolini et al. (2007) of moderate functional changes in Casq1-null muscle, which include a slowing of the twitch tension transient and a 30% re-duction in the calcium transient underlying a twitch. (The present estimate of the difference in releasable cal-cium, however, is notably smaller than the one offered by Paolini et al., 2007, for Casq1-null cells, who derived it from tension–time integrals in caffeine contractures. The discrepancy could be explained in part by the indi-rect nature of the tension–time estimate.)
For several reasons, however, the loss of releasable cal-cium in null animals is likely to underrate the contribu-tion of calsequestrin to the funccontribu-tional reservoir. Note first that net amount released reaches its asymptotic value at 300–500 ms in the WT, but continues to increase in the dCasq-null (Fig. 7 B). Evidently, at long times
on October 5, 2010
jgp.rupress.org
pattern, P increases to ensure continued flux in spite of the dwindling driving force, while B concurrently de-creases to sustain the free [Ca2+] in spite of the dimin-ished store. That the SR hastens its emptying when driven to depletion suggests that the actual response takes pre-cedence to the long-term stability of the store. This “self-immolating” feature seems consistent with the intense but sporadic exertion required of fast-twitch muscle.
We thank Robert Fitts, Marquette University, for helpful discus-sions on muscle control under physiological conditions.
This work is supported by grants from the National Institute of Arthritis and Musculoskeletal and Skin Diseases (AR049184 and AR032808 to E. Ríos, and AR044750 and AR43140 to P.D. Allen), the Heart and Lung Institute (HL88635 to B.C. Knollmann), the Muscular Dystrophy Association of America (to J. Zhou), and Italian Telethon Research Grant GGP08153 (to F. Protasi).
Richard L. Moss served as editor. Submitted: 16 April 2010 Accepted: 22 July 2010
R E F E R E N C E S
Baylor, S.M., and S. Hollingworth. 1988. Fura-2 calcium transients in frog skeletal muscle fibres. J. Physiol. 403:151–192.
Baylor, S.M., and S. Hollingworth. 2003. Sarcoplasmic reticulum calcium release compared in slow-twitch and fast-twitch fibres of mouse muscle. J. Physiol. 551:125–138. doi:10.1113/jphysiol .2003.041608
Cheng, H., and W.J. Lederer. 2008. Calcium sparks. Physiol. Rev. 88:1491–1545. doi:10.1152/physrev.00030.2007
Domeier, T.L., L.A. Blatter, and A.V. Zima. 2009. Alteration of sarco-plasmic reticulum Ca2+ release termination by ryanodine
recep-tor sensitization and in heart failure. J. Physiol. 587:5197–5209. doi:10.1113/jphysiol.2009.177576
Donoso, P., H. Prieto, and C. Hidalgo. 1995. Luminal calcium regulates calcium release in triads isolated from frog and rabbit skeletal muscle. Biophys. J. 68:507–515. doi:10.1016/ S0006-3495(95)80212-2
Eisenberg, B.R. 1984. Quantitative ultrastructure of muscle. In Handbook of Physiology; Skeletal Muscle. L.D. Peachey, editor. Lippincott Williams & Wilkins, Philadelphia. 73–112.
Györke, S., and D. Terentyev. 2008. Modulation of ryanodine recep-tor by luminal calcium and accessory proteins in health and cardiac disease. Cardiovasc. Res. 77:245–255. doi:10.1093/cvr/cvm038 Ikemoto, N., M. Ronjat, L.G. Mészáros, and M. Koshita. 1989.
Postulated role of calsequestrin in the regulation of calcium re-lease from sarcoplasmic reticulum. Biochemistry. 28:6764–6771. doi:10.1021/bi00442a033
Jiménez-Moreno, R., Z.M. Wang, M.L. Messi, and O. Delbono. 2010. Sarcoplasmic reticulum Ca2+ depletion in adult skeletal muscle
fibres measured with the biosensor D1ER. Pflugers Arch. 459:725– 735. doi:10.1007/s00424-009-0778-4
Jong, D.S., P.C. Pape, S.M. Baylor, and W.K. Chandler. 1995. Calcium inactivation of calcium release in frog cut muscle fibers that con-tain millimolar EGTA or Fura-2. J. Gen. Physiol. 106:337–388. doi:10.1085/jgp.106.2.337
Knollmann, B.C., N. Chopra, T. Hlaing, B. Akin, T. Yang, K. Ettensohn, B.E. Knollmann, K.D. Horton, N.J. Weissman, I. Holinstat, et al. 2006. Casq2 deletion causes sarcoplasmic re-ticulum volume increase, premature Ca2+ release, and
catechol-aminergic polymorphic ventricular tachycardia. J. Clin. Invest. 116:2510–2520.
as they were conducted in an external solution with 0.5 mM Cd, an ion that in smooth muscle inhibits this pathway by 50% at 10 µM (McElroy et al., 2008).
In summary, the mild reduction of releasable calcium found in null fibers does not reflect the difference in maximal Ca2+ storage capabilities. Several changes in the null could contribute to reducing the difference; the alterations could be structural, including greater area of the SR membrane, or functional, such as an in-crease in resting [Ca2+]SR and/or the degree of deple-tion achievable by depolarizadeple-tion. A better definideple-tion of these changes will require detailed quantification of re-leasable Ca2+ combined with direct measures of [Ca2+]SR in working muscle cells, a prospect made increasingly feasible by recent advances in the monitoring of SR [Ca2+] (Pape et al., 2007; Jiménez-Moreno et al., 2010 or Reggiani et al., 2010).
The present results include the use, illustrated in Fig. 8, of depolarizations copying a train of action potentials. The situation was still not physiological for multiple rea-sons, most importantly the presence of EGTA, a buffer that does not affect flux directly (e.g., Rengifo et al., 2002) but drastically modifies the Ca2+ transients. In spite of these limitations, the experiment is instructive, showing that every difference between the WT and the null ob-served under continuous depolarizations is qualitatively conserved under trains of pulses. Voltage clamping with a more physiological pipette solution should give valuable information on the roles of calsequestrin in physiological modes of muscle activity, including exercise that leads to fatigue.
More specifically, the experiment shows that the changes in storage capacity and kinetics featured by the dCasq-null cells result in fairly conserved Ca2+ tran-sients, especially during the sustained phase after the first few hundred ms of a pulse train. This may help ex-plain why Casq1-null mice maintain muscle function (Paolini et al., 2007) under conditions of sustained ac-tivity. The caveat raised in the previous paragraph ap-plies; however, the value of the observation is limited, as it relies on Ca2+ transients altered by a foreign buffer. Physiological implications of the changes in evacuability The key finding of the present study is that the overall buffering power of the SR decreases upon store deple-tion due to changes in the buffering power of calseques-trin. Together with indications that the permeability to Ca2+ of the SR membrane increases concomitantly, the observations fully explain the increase in E reported by Royer et al. (2008). Thus E is assured to increase during Ca2+ release from the SR by convergence of two disparate mechanisms, one affecting the channel and the other al-tering the SR buffer, hence changing the driving force for Ca2+ release. We suggest that this convergence could be of value for the physiologically contracting muscle. When the cell is driven to depletion by the stimulation
on October 5, 2010
jgp.rupress.org
![Figure 1. Cytosolic [Ca 2+ ] in different external solutions. Area-averaged ratio of fluorescence of indo-1 in patched cells immersed in reference external solution (red) or in 0 Ca (black) ver-sus time after breaking into the cell](https://thumb-eu.123doks.com/thumbv2/123dokorg/4952689.52618/4.918.90.541.93.376/cytosolic-different-external-solutions-averaged-fluorescence-reference-breaking.webp)