Università degli Studi di Ferrara
DOTTORATO DI RICERCA IN
BIOLOGIA EVOLUZIONISTICA E AMBIENTALE
CICLO XXIICOORDINATORE Prof. BARBUJANI GUIDO
EVOLUTION OF THE CIRCADIAN CLOCK IN EXTREME ENVIRONMENT: LESSONS FROM CAVEFISH
Settore Scientifico Disciplinare BIO/05
Dottorando Tutore
Dott. CAVALLARI NICOLA Prof. BERTOLUCCI CRISTIANO
_______________________________ ___________________________
(firma) (firma)
CONTENTS
Page
Abstract (English)………... 5
Abstract (Italiano)... 6
I.
INTRODUCTION………...
7
I.1 Organization of circadian clocks……… 8
I.1.1 Central and peripheral pacemakers in vertebrates………... 8
I.2 Molecular clockwork……… 10
I.2.1 Molecular clock mechanism in vertebrates………... 10
I.3 Output pathways………... 12
I.4 Zebrafish as a circadian clock animal model………... 12
I.4.1 The circadian clock in zebrafish………... 13
I.5 Light input pathways………... 14
I.5.1 Ocular and extraocular light input pathways in vertebrates………... 15
I.6 Cavefish as animal model system………... 17
I.6.1 Somalian cavefish………... 18
I.7
AIM………...
21II.
MATERIALS AND METHODS...
22
II.1 Animals………... 22
II.2 Cell lines... 22
II.3 Genomic DNA extraction... 23
II.4 RNA extraction and reverse transcription... 23
II.5 Cloning cavefish cDNA sequences... 24
II.6 Phylogenetic analysis... 25
II.7 LD experiment (adults and larvae)... 25
II.8 Feeding experiment in adult cavefish... 25
II.9 Gene expression analysis... 26
II.10 Cells, light-dark cycles... 27
II.11 Reporter and expression vectors... 27
II.12 Plasmid DNA extraction... 28
II.13 Transfection using Fugene HDTM transfection reagent (Roche Diagnostics). 29 II.14 In vivo luciferase assay LD……….. 29
II.14.1 Rescue of light induction on zfPer2 promoter-reporter in CF cells... 30
II.15 Induction of cycling Per1b promoter-reporter vector by Dexamethasone... 31
II.15.1 Phase Response Curve... 32
III.
RESULTS...
33
III.1 Cavefish clock genes cloning... 33
III.2 Quantitative analysis of daily expression of clock genes... 35
III.3 Cell line experiments... 38
III.4 Feeding entrainment in adult P. andruzzii... 40
III.5 Induction of rhythmic gene expression in cavefish cell lines... 42
III.5.1 Temperature compensation of the clock... 42
III.7 Mutations in genes involved in the light transduction pathway... 46
III.8 Opsins... 49
III.9 Rescue of light induction of the zfPer2 promoter... 50
IV.
DISCUSSION...
53
Abstract (English)
EVOLUTION OF THE CIRCADIAN CLOCK IN EXTREME ENVIRONMENT: LESSONS FROM CAVEFISH
Evolution has been strongly influenced by the daily cycles of temperature and light imposed by the rotation of the Earth. Fascinating demonstrations of this are seen in extreme environments such as caves where some animals have remained completely isolated from the day-night cycle for millions of years. Most of these species show convergent evolution, sharing a range of striking physical properties such as eye loss. One fundamental issue is whether “hypogean” species retain a functional circadian clock. This highly conserved, physiological timing mechanism allows organisms to anticipate daily environmental changes and is synchronized primarily by light. The Somalian cavefish, Phreatichthys andruzzii does possess a circadian clock that is entrained by a daily regular feeding time but strikingly, not by light. Under constant conditions the P. andruzzii clock oscillates with an extremely long period and also lacks normal temperature compensation. We document multiple mutations affecting a light-induced clock gene, Period2 as well as the genes encoding the extra-retinal photoreceptors Melanopsin (Opn4m2) and TMT-opsin. Remarkably, we show that ectopic expression of zebrafish homologs of these opsins rescues light induced clock gene expression in P. andruzzii cells. Thus, by studying this natural mutant we provide direct evidence for a peripheral light-sensing function of extra-retinal opsins in vertebrates. Furthermore, the properties of this cavefish illustrate that evolution in constant darkness leads not only to anatomical changes but also to loss of gene function linked with the detection and anticipation of the day-night cycle.
Keywords: circadian clock, cavefish, zebrafish, light pathway, clock mechanism, temperature
Abstract (Italiano)
EVOLUZIONE DELL’OROLOGIO CIRCADIANO NEI PESCI IPOGEI
L’evoluzione degli esseri viventi è sempre stata fortemente influenzata dai cicli giornalieri derivanti dalla rotazione della Terra introno al proprio asse, come l’alternanza luce-buio e le variazione di temperatura. Gli oscillatori circadiani sono dei meccanismi molecolari capaci di misurare lo scorrere del tempo e che permettono agli organismi di anticipare i cambiamenti ambientali sincronizzando svariati processi fisiologici al ciclo luce-buio giornaliero. Questo meccanismo si è ampiamente conservato ed è presente in pressoché tutte le specie studiate. Un modello particolarmente interessante per lo studio dell’evoluzione dell’orologio circadiano nei vertebrati è rappresentato da animali che si sono adattati ad ambienti estremi come quelli ipogei dove sono rimasti completamenti isolati dall’alternanza del giorno e della notte per milioni di anni. La maggior parte di queste specie è accomunata da un’evoluzione convergente, dove si evidenziano un’ampia gamma di adattamenti fisici comuni, come la perdita degli occhi e del pigmento. Ad oggi non è ancora completamente chiaro se le specie ipogee conservano un orologio endogeno circadiano funzionante. A questo scopo abbiamo investigato il sistema circadiano del pesce ipogeo della Somalia, Phreatichthys andruzzi. I nostri risultati hanno dimostrato che P. andruzzii possiede un orologio circadiano che non viene sincronizzato dall’alternanza luce-buio, ma da un regime giornaliero di alimentazione. In condizioni costanti l’orologio di P. andruzzii oscilla con un periodo estremamente lungo e manca della normale compensazione del periodo al variare della temperatura. Nel corso della nostra indagine molecolare abbiamo riscontrato molteplici mutazioni a carico di un gene orologio la cui espressione è indotta dalla luce, Period2, così come nei geni codificanti per i fotopigmenti extra-oculari Melanopsin (Opn4m2) e TMT-opsin. In particolare, abbiamo dimostrato che l’espressione ectopica delle opsine omologhe di zebrafish ristabilisce l’espressione indotta dalla luce del gene orologio Period2 nelle cellule di P. andruzzii.
Attraverso lo studio di questo mutante naturale abbiamo dimostrato che l’evoluzione in buio costante ha portato non solo a cambiamenti anatomici, ma anche alla perdita di funzione di geni circadiani collegati alla sincronizzazione ai cicli luce-buio giornalieri. Inoltre, abbiamo ottenuto per la prima volta in un vertebrato non-mammifero evidenze dirette della funzione circadiana di due opsine extra-oculari.
I. INTRODUCTION
Life and environment have always been in close relation, one influencing the other, along the evolution: alternating days and nights, the cycles of the tides, lunar phases and the seasons represented a considerable selective pressure on all living organisms. Extensive programming of biological activity, that meet and exploit the challenges and opportunities offered by the periodic nature of the environment, provide a valuable selective advantage for survival (Pittendrigh, 1993).
The ability to vary on a daily basis the behaviour is one of the most important adaptive phenomenons that developed during evolution. Many biochemical, physiological and behavioural functions show daily fluctuations; they have been observed at all levels of organization, from the behaviour of mammals (sleep-wake rhythm and locomotor activity) to the specific activity of enzymes (Brown & Schibler, 1999; Gachon et al., 2004).
The mechanisms developed in order to adapt and even anticipate the environmental stimuli are the circadian oscillators or clocks. The circadian clocks are endogenous, self-sustaining time-keeping systems (Pittendrigh, 1960). The oscillation or rhythm generated by the clock has a period length of approximately 24 hours, hence it is termed circadian (circa-diem; about a day) and it persists when the organism is placed under constant environmental conditions (aperiodic conditions). Pervasive features of endogenous circadian oscillators are: i) the capacity to synchronize (entrain) to environmental signals (zeitgeber, from German Zeit: “Time”; geben: “to give”) including light, temperature and food availability ensuring that it remains synchronized with the natural 24-hour cycle (Pittendrigh, 1993); ii) the temperature compensation (Tsuchiya et al., 2003), the period length remains constant over physiological temperature shifts.
All these characteristics of circadian rhythms are unique and have been highly conserved by living organisms during evolution.
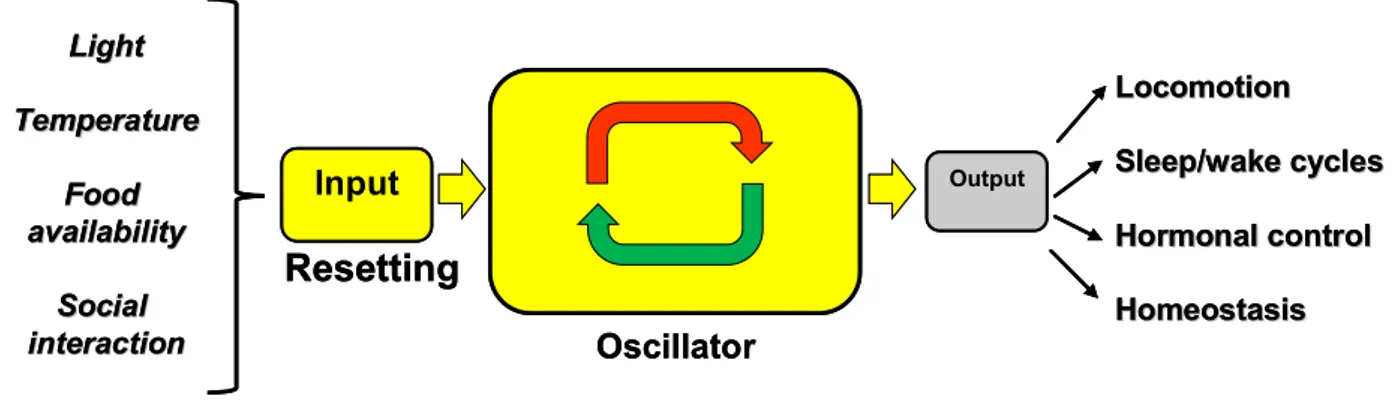
The circadian clock can be considered to be composed of three parts (Fig. 1) (Menaker et al., 1978):
1) The core oscillator that autonomously generates circadian rhythms.
2) The input pathways that detect zeitgebers and can entrain and reset the central oscillator. 3) The output pathways through which the circadian rhythm directs physiological and
Locomotion Locomotion Sleep/wake cycles Sleep/wake cycles Hormonal control Hormonal control Homeostasis Homeostasis Light Light Temperature Temperature Food Food availability availability Social Social interaction interaction Input Resetting Oscillator Output Locomotion Locomotion Sleep/wake cycles Sleep/wake cycles Hormonal control Hormonal control Homeostasis Homeostasis Light Light Temperature Temperature Food Food availability availability Social Social interaction interaction Input Resetting Oscillator Output
Fig. 1: Schematic presentation of biological timekeeping systems. The core oscillator autonomously generates circadian rhythm. Daily resetting by environmental signals, via the input pathway, ensures that it remains synchronized with the natural 24-hour cycle. The pacemaker then drives the expression of output involved in many aspect of physiology.
In the past 40 years a variety of model systems have been successfully developed to gain essential knowledge of the molecular and cellular basis of the circadian clock and its regulation (Harmer et al., 2001). Most significant progress has been made by forward genetic analysis in
Drosophila, Neurospora, cyanobacteria and more recently in vertebrate models, such as mouse
and zebrafish.
I.1 Organization of circadian clocks
Vertebrate circadian timing system comprised of a central pacemaker located in the brain and of peripheral oscillators in most body cells. It is now the challenge to understand how all these multiple clocks communicate with each other and remain synchronized at the whole animal level.
I.1.1 Central and peripheral pacemakers in vertebrates
In mammals, the suprachiasmatic nucleus (SCN) is a region in the anterior hypothalamus of the brain; it has been shown through lesion and transplantation experiments (Moore and Eichler, 1972; Ralph et al., 1990) to be the master circadian pacemaker. It is responsible for the
generation and regulation of rhythms in behaviour, hormonal secretion and various physiological functions (Klein, 1991). The SCN consists of around 20.000 neurons which differ in their pacemaking ability, response to environmental time cues, neuropeptide expression and the rhythms they control (Antle and Silver, 2005).
Two regions within the SCN could be clearly separated from each other: the dorsal shell and the ventral core. The neurons of the dorsal shell reach their daily peak in clock gene expression earlier than those from the ventral core (Yamaguchi et al., 2003). Studies in mice have revealed that the ventral SCN neurons play a major role in synchronizing the two SCN regions with each other (Yamaguchi et al., 2003). In vivo experiments have shown that the ventral core neurons were able to synchronize faster to shifted light-dark (LD) cycles than those from the dorsal shell (Albus et al., 2005). Candidate neurotransmitters for the synchronization of the SCN neurons could be VIP (Aton et al., 2005), GABA (Liu and Reppert, 2000) and also gap junctions (Colwell, 2000).
In the nervous system of vertebrates, peripheral pacemakers have been identified in the retina and in the pineal gland. In the retina the circadian clock controls the local synthesis of dopamine and melatonin (Tosini et al., 2008). In non-mammalian vertebrates is present an additional central circadian pacemaker in the pineal gland, that drives rhythms of melatonin release and responds directly to light signal entrainment in culture (Menaker et al., 1997; Takahashi et al., 1980).
Peripheral clocks are also present in various tissues of the mammalian systems, such as liver, kidney, heart, skeletal muscle and lung. Studies in peripheral tissues of transgenic rats explanted into culture showed circadian oscillation over several cycles, while the SCN continues to oscillate for at least 32 days in culture (Yamazaki et al., 2000). Moreover, peripheral organs show tissue specific differences in circadian period and phase, leading to the conclusion that peripheral tissues exhibit self-sustained, rather than driven circadian oscillations (Yoo et al., 2004).
Mammalian peripheral clocks are not directly entrained by light in contrast to the situation in
Drosophila and zebrafish (Whitmore et al., 1998). Therefore, mammalian peripheral clocks seem
to be synchronized with central clocks through a complex combination of different signals including metabolites and body temperature (Brown et al., 2002; Damiola et al., 2000; Schibler, 2007).
I.2 Molecular clockwork
Following the identification of circadian pacemaker structures, the next challenge was to identify the molecular basis of the clocks they contain.
Forward genetic analyses in a variety of model organisms, such as Drosophila, Neurospora, cyanobacteria, Arabidopsis and mouse, have led to the identification of several “clock genes”.
I.2.1 Molecular clock mechanism in vertebrates
At the molecular level the vertebrate circadian clock mechanism consists of interacting positive and negative transcriptional/translational feedback loops that operate in a cell-autonomous and self-sustained manner.
The bHLH-PAS transcription factors CLK and BMAL1 are essential positive elements in the vertebrate clock. The clk gene has been identified through forward genetic screens. The Clk mutant mice exhibit aberrant locomotor activity rhythms under constant darkness (DD) conditions (Vitaterna et al., 1994). Positional cloning then led to the characterization of the mClk locus (King et al., 1997). BMAL1 was identified because of its close interaction with CLK (Gekakis et al., 1998; Hogenesch et al., 1998) and its disruption in mice caused an immediate loss of locomotor activity rhythms under DD (Bunger et al., 2000).
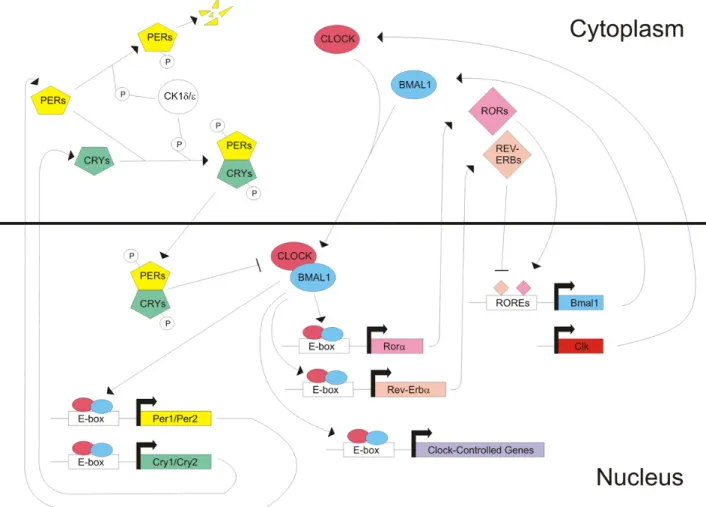
Heterodimers of CLK and BMAL1 activate transcription by binding to conserved elements (E-box, 5'-CACGTG-3') in the promoter regions of clock controlled genes (ccg), the three Period (mPer1, mPer2, mPer3) and two Cryptocrome (mCry1, mCry2) genes (Dunlap, 1999) which also encode for the regulatory elements of the negative limb of the clock mechanism. The binding of negative regulators such as PER and CRY to CLK-BMAL1 inhibit the activation of
ccg and their own transcription (Fig. 2), determinig the period and the amplitude of the
oscillation.
Mutations in only one of the mper genes results in no loss of circadian clock function, whereas double mutants of mPer1 and mPer2 do result in a complete loss of rhythmicity (Zheng et al., 2001). The same was observed in double mutant mCry1/mCry2 mice which lose their circadian rhythmicity in wheel running behaviour under DD conditions (Vitaterna et al., 1999; van der Horst et al., 1999).
An additional feedback loop involves the nuclear receptors Rev-erbα and Rorα. The expression of REV-ERBα is activated by CLK and BMAL1 and repressed by factors from the negative limb. REV-ERBα in turn represses expression of BMAL1 (Fig. 2). Furthermore, RORα competes with REV-ERBα for the binding of the same elements in the promoter region of BMAL1. Genes containing these REV-ERB/RORE elements in their promoter are repressed by REV-ERBα, whereas RORα activates their transcription. This REV-ERBα/RORα feedback loop interconnects the positive and negative limbs of the clock (Duez and Staels, 2008) and seems to add precision and stability to the core loops in the mammalian clock (Emery and Reppert, 2004). In case of Rev-erbα, heme group has recently been implicated as its ligand (Raghuram et al., 2007; Yin et al., 2007). This finding suggests that heme regulation of Rev-erbα might be a possible link between the control of metabolism and the mammalian clock (Raghuram et al., 2007).
Fig. 2: Molecular clock in mammals. The clock is composed of two interconnecting loop: In the core loop heterodimers of CLK and BMAL1, positive limb, activate transcription of Period, Cryptocrome and clock-controlled genes. Heterodimers of PER and CRY, negative limb, bind to CLK-BMAL1 inhibiting their own transcription. In the stabilizing loop CLK and BMAL1 induce the expression of REV-ERBα and RORα which subsequently regulate transcription of Bmal1.
I.3 Output pathways
Key components of the circadian timing system are the output pathways whereby the molecular clock machinery is linked with diverse aspects of physiology and behaviour. It is now clear that clock output pathways operate on the whole system level involving central pacemakers and on the cellular level where peripheral clock components are able to differentially regulate the expression of non-clock genes.
Most animals have circadian rhythms in behavioural processes such as locomotor activity, alertness and feeding as well as coupled physiological functions, e.g. hormonal rhythms and metabolic gene regulation.
In mammals the circadian rhythmicity of sleep-wake cycles and hormone production is linked to the functional integrity of the SCN. Thus, via indirect adrenergic innervations the SCN controls the nocturnal synthesis of melatonin in the mammalian pineal gland. In turn, circadian rhythms of circulating melatonin affect many aspects of physiology.
The conserved regulatory system of the cell cycle represents an important circadian clock output. Proper timing of this system is of highest importance for most organisms because it represents one strategy for avoiding the potentially damaging effect to UV exposure of sunlight upon key steps of the cell cycle such as S phase (Mori et al., 1996).
I.4 Zebrafish as a circadian clock animal model
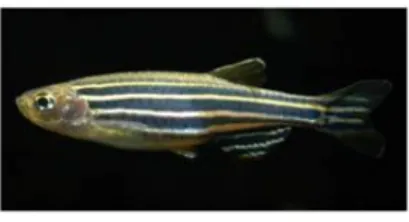
The zebrafish (Danio rerio) has been established as one of the most important models for studying vertebrate embryogenesis and early development. Thus, both, the easy access of early developmental stages and its proven utility in large scale forward genetic analysis have made it an attractive vertebrate to study the origin and function of the circadian clock.
Fig. 3: The zebrafish, Danio rerio, is a tropical freshwater fish belonging to the Cyprinidae family and is an important vertebrate model organism in scientific research.
In contrast to mammalian model organisms such as the mouse, zebrafish has several advantages to offer. For instance, its transparency allows the observation of individual cells during the earliest stages of development and embryogenesis. Peripheral clocks in zebrafish are directly light responsive and make it a powerful tool for studying light input to the vertebrate clock and peripheral clock regulation (Vallone et al., 2004; Whitmore et al., 2000). Furthermore, zebrafish cell lines which posses directly light entrainable circadian clock function have been successfully used to study light input pathways at the cellular and molecular levels (Vatine et al., 2009). Zebrafish represents an ideal genetic model to study the role of temperature as a clock zeitgeber, mainly because of its poikilothermic properties. Zebrafish primary cell lines contain both light and temperature entrainable clocks and therefore provide a unique opportunity to study crosstalk between the two zeitgebers (temperature and light) at the cell culture level (Vallone et al., 2004; Lahiri et al., 2005). Zebrafish cells remain viable for up to 2 months as confluent cultures
without sub-culturing and do not require a CO2 gassed humidified environment because of the
buffering properties of their preferred medium. Transfection protocols allow transient and stable introduction of clock and light regulated promoter-luciferase reporter constructs (Vallone et al., 2004). Following addition of luciferin to the culture medium, bioluminescence can then be monitored automatically in vivo under different light and temperature conditions over extended time courses.
I.4.1 The circadian clock in zebrafish
Zebrafish basic circadian clock cellular and molecular elements are very similar to those of mammals. However, there are some important differences. As in most of the non-mammalian vertebrates, the zebrafish pineal gland (the major site of synthesis of the hormone melatonin) is a photoreceptive organ which contains an intrinsic circadian oscillator. The pineal clock is directly light regulated and controls the nocturnal expression of melatonin. It is contrasts with the situation in the mammalian pineal where there is no directly light regulated clock and nocturnal melatonin synthesis is indirectly driven by the SCN pacemaker. The expression of the rate-limiting enzyme for melatonin synthesis, arylalkylamine-N-acetyltransferase (Aanat2), is both light and clock regulated in the zebrafish pineal (Ziv and Gothilf, 2006). Neuroanatomical studies of the adult zebrafish brain have revealed a structural counterpart of the SCN in the
hypothalamus. However, it remains an unanswered question whether this putative SCN shares a similar central pacemaker role with the mammalian SCN.
As in mammals, rhythmic clock gene expression in zebrafish is not restricted to classical pacemaker structures such as the pineal gland and retina but is also present in most other tissues. These oscillations continue even if the tissues are explanted in vitro. This demonstrates the existence of self-sustaining circadian oscillators in different organs and cell types which, unlike mammals, are entrained by direct exposure to light-dark cycles.
Documented clock output pathway targets of the zebrafish circadian clock are rhythmic locomotor activity in larvae and adult fish (Hurd and Cahill, 2002), rhythmic melatonin release (Kazimi and Cahill, 1999) and cell cycle timing (Dekens et al., 2003; Dickmeis et al, 2007). Clock genes have been isolated from zebrafish either by sequence homology with their mammalian counterparts or by two-hybrid screens for interacting partners of the CLK protein. So far three Clock (Clock1, 2, 3) (Kobayashi et al., 2000; Whitmore et al., 1998), three Bmal (Bmal1, 2, 3) (Kobayashi et al., 2000; Cermakian et al., 2000), four Period (Period 1a, 1b, 2, 3) (Delaunay et al., 2000; Delaunay et al., 2003; Vallone et al., 2004), six Cryptochrome genes (Cry1a, Cry1b, Cry2a, Cry2b, Cry3, Cry4) (Kobayashi et al., 2000) and one Rev-Erbα gene (Kakizawa et al., 2007) have been identified. Interestingly, the zebrafish genome contains far more copies of different clock genes than the mammalian genome. It has been proposed that a genome duplication event early in teleost evolution was a major determinant of this greater
number of clock genes (Postlethwait et al., 1998; Meyer and Schartl, 1999; Semon and Wolfe
2007).
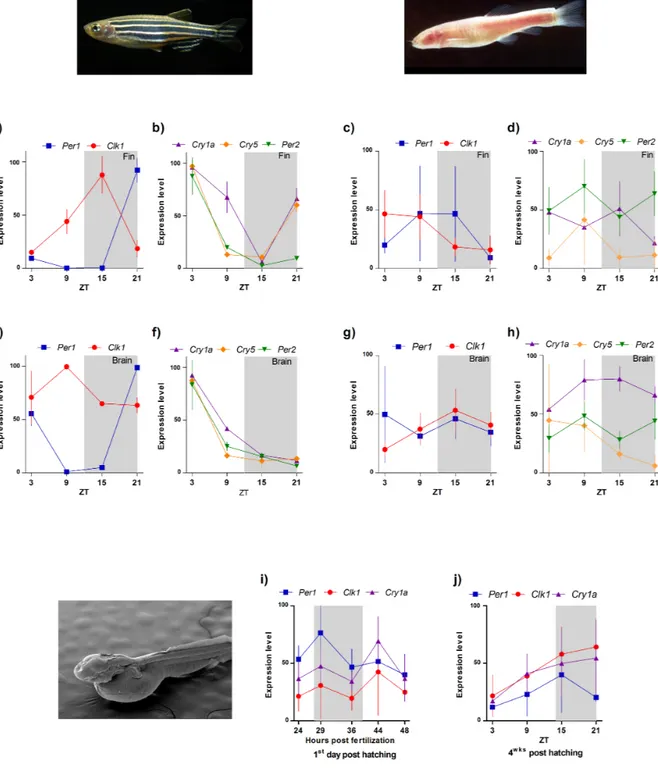
At the molecular level expression of zebrafish clock genes show peculiar behaviour. While in mammals the temporal expression of Clk is constant, in zebrafish it exhibits daily fluctuation (Whitmore et al., 1998) while Cry1a, Cry5 (6-4 photolyase) and Per2 are light induced (Hirayama et al., 2005; Kobayashi et al., 2000, Vatine et al. 2009). Moreover temperature cycles induce rhythmic expression of Cry2a, Cry3 and Per1b (Lahiri et al., 2005).
I.5 Light input pathways
Light is considered to be the most important zeitgeber. It represents in a very reliable way, the daily changes in photoperiod in most environments (Roenneberg and Foster, 1997). Other zeitgebers, such as temperature changes, feeding time (Damiola et al., 2000) and social
interactions (Levine et al., 2002) play also a significant role in many circadian systems but they still indirectly depend on the earth’s daily exposure to sunlight. The mechanism and the factors through which light entrains the clock have been extensively studied.
I.5.1 Ocular and extraocular light input pathways in vertebrates
In mammals, the retina has been shown to represent the only photoreceptive structure for the circadian clock (Foster, 1998). In the case of the rod and cone cells, which are localized in the outer layer of the retina, transgenic studies in mice have shown that these retinal cell types have no circadian photoreceptive role. In these studies the genetic ablation of rod and cone cells does not eliminate the photo-entrainment of the clock (Freedman et al., 1999; Lucas et al., 1999). However, the retinal ganglion cells localized in the inner retinal layer were sufficient to maintain this photoentrainement (Ebihara and Tsuji, 1980; Van Gelder et al., 2003). For that reason humans or mice which suffer blindness caused by degradation of the outer retinal layer are still able to synchronize their circadian clock by exposure to daily LD cycles (Ebihara and Tsuji, 1980; Czeisler, 1995).
Subsets of intrinsically photosensitive retinal ganglion cells (ipRGCs) that express the photopigment Melanopsin were identified to be the principal circadian photoreceptors (Berson et al., 2002; Hattar et al., 2002). However, gene knockout of Melanopsin only showed a slight reduction in the ability of the circadian clock to be entrained by light (Ruby et al., 2002; Hattar et al., 2002). The complete elimination of circadian photoreception was only achieved through the combined ablation of melanopsin, rod and cone cells (Lucas et al., 2003; Panda et al., 2003). Therefore, the rod and cone cells seem to play some supporting role in circadian photoreception depending upon the light intensity (Hattar et al., 2003).
Subsequently, the ipRGCs convey light information to the SCN. This signalling is thought to be achieved through both glutaminergic and the pituitary adenylate cyclase-activating peptide (PACAP) pathways via the retino hypothalamic tract (RHT) (Hattar et al., 2003; Hannibal, 2006). Perception of light leads to an induction of the immediate early genes c-Fos and c-Jun, as well as the clock genes Per1 and Per2 within the SCN (Kornhauser et al., 1996; Zylka et al., 1998). The MAPK signaling pathway (via CREB mediated transcription) seems to induce the transcription of these genes (Obrietan et al., 1998). Recent studies report that many light induced genes in the SCN posses evolutionary conserved CRE elements in their promoter regions, with
the strongest light inducible responses coming from the combination of CRE elements and associated TATA boxes (Porterfield et al., 2007).
Other candidate photoreceptor molecules include the blue-light photoreceptive cryptochromes, however whether they play an active role as photoreceptors in vertebrates is still open an open question.
In mammals, cryptochromes are expressed in both the outer and inner nuclear layer as well as the ganglion cell layer of the retina (Sancar, 2000). Cryptochrome knockout mice have a 20-fold less
c-Fos expression induced by light than WT mice (Selby et al., 2000). Moreover, mice lacking
both cryptochromes and retinaldehyde (component of the visual photopigments in the eye) no longer show phototransduction to the SCN (Thompson et al., 2004). However, these cryptochrome knockout mice are arrhythmic in constant darkness (DD) and therefore their actual involvement in photoentrainment is hard to test, suggesting their role primarily as a central clock component and not as a component of the light input pathway (van der Horst et al., 1999).
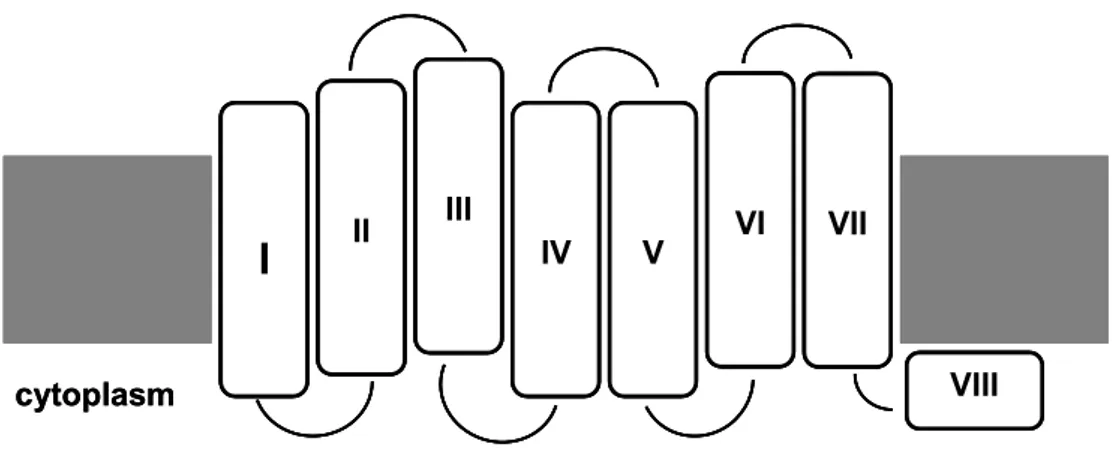
In non-mammalian vertebrates like birds, reptiles and fish, circadian photoreception occurs in several specialized photoreceptive organs which develop from the embryonic forebrain: For example the eyes, the pineal gland and deep brain photoreceptors. In the case of zebrafish, observations in cultured cells and tissues have revealed that clock gene expression rhythms can be entrained by direct exposure to LD cycles (Whitmore et al., 2000). This suggests that in zebrafish beside the “classical” identified photoreceptive organs there also exists a widespread photosensitivity of peripheral tissues. This has confirmed that the zebrafish represents an ideal system to study the circadian clock and particularly the light entrainment pathway. Good candidates for peripheral tissue circadian photoreceptors in zebrafish are cryptochromes (Cermakian et al., 2002) and opsins. Opsins belong to the G protein coupled receptor superfamily and they are characterized by a conserved seven transmembrane domain motif (Fig. 4). The mechanism of light perception is mediated by the binding of the opsin protein with a chromophore, a vitamin A-based retinaldehyde, through a lysine residue in the seventh transmembrane alpha helix (Bownds, 1967). The absorption of a single photon results in the photoisomerisation of the chromophore from the cis to an all-trans conformation. This change involves the opsin structure, causing the activation of the transduction cascade. When the opsin is bound to the trans form is then inactivated.
I
II III IV V VI VIII VII cytoplasmI
II III IV V VI VIII VIII
II III IV V VI VIII VII cytoplasmFig. 4: Schematic representation of the membrane spanning structure of a generic opsin protein. The seven transmembrane domains are labelled I - VII. The light perception is mediated by the binding of the opsin protein with retinaldehyde, a derivative of vitamin A, through a lysine residue in the seventh transmembrane alpha helix while the signal transduction occurs in the first three domain where is located a G protein binding site.
Over the last decade, several novel opsin groups have been identified in different organisms and especially in non-mammalian vertebrates. The function of many of these new opsins is still unknown. The classical opsins are expressed solely in the retina, whereas the new opsins, like
Exorhodopsin, Teleost Multiple Tissue (TMT) opsin and Melanopsin (Opn4m2) have a wide
range of expression patterns (Bellingham et al., 2002; Mano et al., 1999; Moutsaki et al., 2003).
I.6 Cavefish as animal model system
The study of subterranean species provides valuable and unique insight into how organisms evolve in response to an extreme environment.
An heterogeneous group of animals has adapted to life in constant darkness in the caves. Remarkably, all these different animals evolved convergent “regressive” phenotypes including many aspects of behaviour, such as negative phototaxis (a kind of taxis which occurs when a whole organism moves in response to a light stimulus in the opposite direction) and changes in anatomy, such as loss of the eyes and pigmentation, which appear to represent key adaptations to life in these environments. The mechanism of regressive evolution is still unclear and cave animals offer an opportunity to study convergent and parallel evolution of regressive traits that are driven by the same environmental cue (Jeffery, 2009). Due to differences in the time that
species have been isolated in subterranean habitats and in the precise ecological conditions, comparative studies involving subterranean species are particularly valuable.
Troglobitic (exclusively subterranean) fish evolved under conditions that contrast with those of their epigean (surface dwelling) ancestors mainly by the absence of daily cycles of light (and in many cases, also of temperature cycles). These species develop the same autapomorphic characters as the other cave-dwelling animals, such as loss of eyes and melanic pigmentation. The teleost Astyanax mexicanus is perhaps the most common studied cavefish. This species is characterized by an eyed surface-dwelling form (surface fish) and many blind cave forms (cavefish) (Fig. 5). This make A. mexicanus particularly valuable for studying evolution of eye degeneration. In the blind fish small eye primordia are formed during embryogenesis, which later arrest in development, degenerate and sink into the orbits. Eye degeneration is caused by apoptosis of the embryonic lens due to the increasing in hedgehog genes signalling and the consequent iperactivation of downstream genes (Yamamoto et al., 2004).
Fig. 5: The Mexican blind cavefish (Astyanax mexicanus) accompanied by two surface-dwelling morph (Niven, 2007).
I.6.1 Somalian cavefish
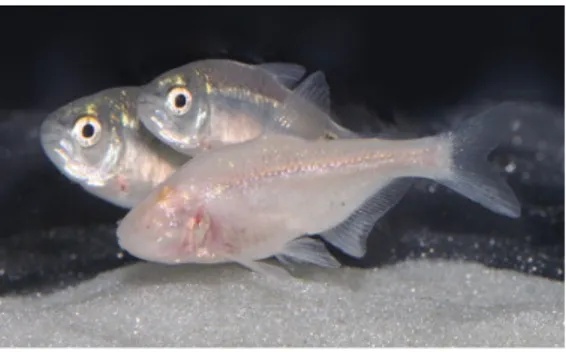
Phreatichthys andruzzii (Ercolini et al., 1982) is a phreaticolous fish from Somalia, a tropical
cyprinid that inhabits the subterranean waters under the central Somalian desert (Fig. 6). Its habitat consists of large phreatic layers that develop in Eocene horizontal limestone rock formations. The ontogenetic recapitulation of phylogenetic history suggests that troglobitic forms of P. andruzzii originated from normal-eyed ancestors, which lived in surface water when Somalia had a wetter climate. The change of climate in Somalia towards a very dry surface
XBud-Bud 04° 11’ 19’’N 46° 28’ 27’’E XBud-Bud 04° 11’ 19’’N 46° 28’ 27’’E
habitat probably forced P. andruzzii’s ancestors to adopt a subterranean life in the phreatic waters. The underground water can only be reached through sink holes or shallow wells.
The Somalian cavefish presents a more extreme specialized phenotype than the other more commonly studied American blind cavefish Astyanax spp. In fact, P. andruzzii shows more rapid eye degeneration with respect either to A. mexicanus (Yamamoto et al., 2004) or to other cave-dwelling vertebrates, such as Proteus anguinus (Durand, 1971) and Typhlotriton spelaeus (Besharse and Brandon, 1974). Furthermore, Astyanax’s populations show different degrees of eye degeneration, and in some cases still possess rudimental eyes.
Despite the degeneration of the eye, P. andruzzii still shows clear behavioral responses to light stimulation. Specifically, it shows a notable photic sensitivity in behavioural tests where it tends to avoid illuminated areas in preference for completely dark areas. The photophobic response is enhanced under blue light (wavelength of 480 nm), but it is also present under green (539 nm), orange (615 nm) and red (692 nm) light (Ercolini and Berti, 1975). Furthermore, the fish seem capable of perceiving not only the presence of light but are also able to discriminate between different wavelengths.
Fig. 6: Phreatichthys andruzzii (left) is a species of ray-finned fish in the Cyprinidae family, and the only species of the genus Phreatichthys. Ancestors of P.andruzzii entered the large phreatic layers of the Somalian desert, that developed in Eocene horizontal limestone formations, at the end of the Pliocene (1.4-2.6 million years ago) and became isolated with the extinction of epigean sister species as the result of extreme climatic changes. The Adult cavefish were collected in the wild, in the oasis of Bud-Bud in the centre of the Somalian desert during several expeditions to Africa (1960-1980).
Many studies have shown that circadian locomotor rhythmicity is regressed in troglobites, corroborating the hypothesis that daily cycles are mainly selected for by external factors such as photoperiod cycles (Lamprecht and Weber, 1992; Trajano et al., 2005).
Unlike the more famous Mexican cavefish Astyanax, P. andruzzii belongs to the cyprinid family and so is a close relative of the zebrafish (Danio rerio). This peculiarity allowed many of the tools, experimental approaches and informations that have been developed for zebrafish studies to be also applied to the Somalian cavefish.
Furthermore, the ease with which these fish can be raised in the laboratory as well as their high fecundity make them particularly attractive for studies using embryonic, larval or juvenile stages.
I.7 AIM
The evolution of the circadian clock has been intricately linked with the natural day-night cycle. To provide the first clues about the consequences of the absence of this canonical selective pressure on the conserved circadian oscillator, we applied a comparative analysis to take advantage both of the divergent evolution of the cavefish and of their common origin amongst surface-dwelling teleosts.
We chose to study a troglomorphic cave-dwelling fish that have been isolated for million of years in a totally dark environment, the Somalian cavefish Phreatichthys andruzzii.
For this purpose we established P. andruzzii as a model which by comparison with a normal sighted species such as the zebrafish (Danio rerio) can be used to investigate the molecular, cellular and anatomical adaptations to life in constant darkness.
The first aim was to identify cavefish clock genes homologues, in order to perform functional analysis of the mechanisms regulating the circadian timekeeping system. The emerging differences between P. andruzzi and D. rerio were invaluable to assign a function to cardinal circadian clock elements participating in light-dependent regulation. Furthermore, for the first time we developed specific primary cell lines from the Somalian cavefish to facilitate the molecular investigation of the directly light entrainable cellular clocks, an intrinsic property of teleost cells.
The present research also aimed to investigate the adaptations of extraocular photoreceptors during evolution in complete darkness. Isolation of non-visual opsin coding sequences and their physiological characterization will help to clarify the roles of these photopigments in the circadian photoentrainment system.
An increased understanding of the molecular processes underpinning circadian rhythmicity furnished by the present vertebrate models, provide valuable new insight into how the molecular mechanism of the clock is regulated by light. Furthermore, with a longer term perspective, the development of P. andruzzii as a cavefish model system will enable the detailed investigation of many other fascinating cavefish adaptations to life in constant darkness and so how light has shaped the evolution of living systems.
II. MATERIALS AND METHODS
II.1 Animals
Somalian cavefish (P. andruzzii) were collected from several sites around the locality of Bud-Bud (04°11’19”N–46°28’27”E) during the years 1968-1982. Fish were transferred alive to the laboratories of the University of Florence, Italy, where they have been bred repeatedly using standard methods (Chang, 1983b; Sokolowska et al., 1984). The fish were raised in aquaria (100 x 40 x 50 cm) containing 160 l of dechlorinated tap water and equipped with an adsorbing charcoal filter and aerator. They were maintained in darkness except during food administration and aquaria maintenance. Three to 6 times per week the fish were fed with frozen chironomid larvae. Water temperature was maintained constant at 29±1°C. The present study used both adult and larva raised in the Florence laboratory. Fertilized eggs were collected every 30 minutes and aliquots of 10 or 20 were transferred into 75cm2 tissue culture flasks (Falcon). Flasks were sealed
and submerged horizontally in a large volume, thermostatically controlled water bath (Tetraht, Tetra, Milano, Italy) to maintain a constant temperature of 29±1°C. Larvae were illuminated with a fluorescent light source (100 lux, full-spectrum cool fluorescent tubes, Osram, Germany). From the third/fourth day after hatching, larvae were fed once a day. RNA extracts were prepared from pools of 20 embryos or 10 larvae per time point. 14 years old adults, belonging to the offspring of wild stock collected in 1982 were used as a source of adult tissues for LD cycle and restricted feeding regime experiments. To analyse the effects of LD cycles on clock gene expression in vivo, adult fish were starved for 10 days prior to (and during) the sampling period. Dissections in dark conditions were performed under dim red light (<1 lux). Tissues and whole larvae were immediately frozen in dry ice to avoid RNA degradation.
II.2 Cell lines
CF-1, CF-2 and CF-3 cell lines were obtained from fin clips of different adult fish adapting the protocol from (Vallone et al., 2007). Fin clips were treated with trypsin and plated in 50mm cell culture dishes (Falkon) with Leibovitz’s L-15 medium (Gibco) supplemented with 20% fetal calf
serum (Biochrom KG), 100 units/ml penicillin, 100 µg/ml streptomycin and 50 µg/ml
gentamycin (Gibco BRL) and maintained in an atmospheric CO2 and non-humidified cell culture
incubator at 25°C. Once cells were confluent they were seeded in flasks (Falkon). These fibroblast-like cells grow optimally as an adherent monolayer culture on normal tissue culture-treated plastic substrates. Cells were typically passaged once every two weeks by first using trypsin to induce detachment from the substrate followed by dilution in culture medium at a ratio of 1:2 and then seeding in fresh culture flasks. Typically, cells proliferated and returned to confluence within two weeks of passaging and confluent cultures could be maintained for up to one month without significant loss of viability.
A subline derived from the zebrafish adult cell line AB9 (Kwok et al., 1998) was propagated at 25°C in L-15 (Leibovitz) medium (Gibco BRL) supplemented with 20% Fetal Calf Serum (Biochrom KG), 100 units/ml penicillin, 100 µg/ml streptomycin and 50 µg/ml gentamycin (Gibco BRL). Cells were typically passaged once every two weeks and diluted in culture medium at a ratio of 1:4 and then seeding in fresh culture flasks. Cells proliferated and returned to confluence within one week of passaging.
II.3 Genomic DNA extraction
Confluent flasks (Falkon) of CF and AB9 cells were treated with 500 μl of lysis Buffer (100 mM Tris-HCl pH 8; 200 mM NaCl; 5 mM EDTA pH 8.0; 0.2% SDS) with 2.5 μl of Proteinase K (20 mg/ml) after removing the culture medium and incubated 1 hours at 55°C.
Samples were centrifuged 15 min at 12.000xg, room temperature, and the supernatants were transferred in new tubes and extracted once with phenol-chloroform. The aqueous phase was incubated with RNase A 50 μg/ml for 30 min at 37°C and then precipitated with 300 μl isopropanol, by centrifugation for 15 min at 12.000xg at room temperature. Pellet was then washed with 700 μl 70% ethanol, air dried and resuspended in 50 μl DNase free water.
II.4 RNA extraction and reverse transcription
Total RNA was extracted from tissues, total larvae or confluent cell monolayers of P. andruzzii and from AB9 cell line by lysing in Trizol Reagent (Gibco, BRL). Addition of chloroform and
subsequent centrifugation lead to phase separation under conditions where RNA remained water-soluble and proteins or DNA were partitioned in the lower, organic phase or at its interface. Total RNA was subsequently isolated from the aqueous phase by isopropanol precipitation followed by centrifugation and then rinsing the pellet using 75% ethanol.
Zebrafish tissues RNA samples were kindly provided by Prof. Dr. Nicholas S. Foulkes (Universität Heidelberg und Institut für Toxikologie und Genetik Forschungszentrum Karlsruhe, Germany) .
A reverse transcription was performed with the total RNA to produce cDNA using Superscript III RT (Invitrogen), according to the manufacturer’s conditions.
II.5 Cloning cavefish cDNA sequences
To initially obtain partial cDNA sequences, single-stranded cDNA was synthesized using SuperScript III Reverse Transcriptase (Invitrogen, Milano, Italy). Cavefish genes were amplified by PCR using Taq DNA Polymerase (Invitrogen, Milano, Italy) with primers designed by Primer3 software on the basis of sequence of the Danio rerio (zebrafish) homologs. Bands of the predicted sizes were cloned into the pGEM-T Easy Vector (Promega, Madison, WI). The cavefish gene cDNA fragments were sequenced (QIAGEN GmbH) and compared with the GenBank database by using the BLAST algorithm. Additional cDNA sequences were subsequently obtained using a 5’-3’SMART RACE cDNA amplification kit (BD Bioscience-Clontech, Palo Alto, CA), and then coding sequences were deposited in Gen-Bank. Nucleotide coding sequences were converted into amino acid sequences by ExPASy Proteomics Server (http://www.expasy.org/tools/dna.html), and protein domains were predicted using SMART (http://smart.embl-heidelberg.de). By this approach, we cloned 13 clock genes and 3 opsins from
P. andruzzi: Per1, Per2, Per3, Cry1a, Cry1b, Cry2a, Cry2b, Cry3, Cry4, Cry5 Clk1, Clk2, Clk3, Opn4m2, TMT-opsin, Exo-rhodopsin based on their homology with zebrafish homologous genes
(Beta-actin GQ404475; Cryptochrome1a GQ404476; Cryptochrome1b GQ404477;
Cryptochrome2a GQ404478; Cryptochrome2b GQ404479; Cryptochrome3 GQ404480; Cryptochrome4 GQ404481; Cryptochrome5 GQ404482; Clock1 GQ404483; Clock2 GQ404484; Clock3 GQ404485; Period1 GQ404486; Period2 GQ404487; Period3 GQ404488; Melanopsin
II.6 Phylogenetic analysis
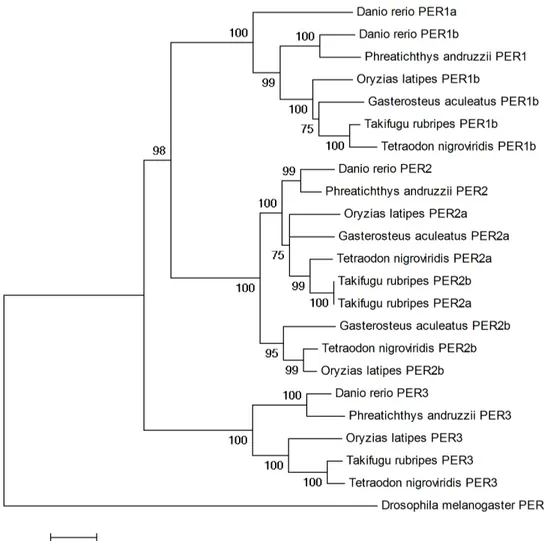
Sequences from the cavefish PER protein family have been aligned with homologs from other teleost species (Takifugu rubripes, Tetraodon nigroviridis, Danio rerio, Gasterosteus aculeatus and Oryzias latipes) (Wang, 2008) using ClustalW (Thompson et al., 1994). Alignments were manually verified and phylogenetic trees were generated using Neighbour-joining methods (Tamura et al., 2007) with a complete deletion mode. Bootstrap tests were performed with 1000 replications. Poisson correction distance was adopted and rates among sites were set as uniform. The PER sequence from Drosophila melanogaster was used as an outgroup to root the tree.
II.7 LD experiment (adults and larvae)
Adults (n=24, 14 years old, belonged to the offspring of a wild stock collected in 1982 from the
wells of Bud-Bud) and larvae (1st day and 4th weeks post hatching) were used. Adults were
maintained at 29±1°C under a 12:12-h light-dark cycle (lights on from zeitgeber time (zt) 0 to 12 with an intensity of 100 lux). Adult were starved for 10 days and tissues (brain and fin) collected from ZT3 every 6 h for 24 h. Larvae were maintained at 29±1°C under a 14:10-h light-dark cycle. Larvae were collected during the 1st day post hatching at 5 different time points (24, 29,
36, 44 and 48 hours post fertilization, 20 larvae for time point) and 4 weeks post hatching at ZT3, 9, 15 and 21 (10 larvae per time point). Dissections in dark conditions were performer under dim red light (<1 lux). Tissues and whole larvae were immediately frozen in dry ice to avoid RNA degradation.
II.8 Feeding experiment in adult cavefish
Cavefish (n=36, 14 years old, belonged to the offspring of a wild stock collected in 1982 from the wells of Bud-Bud) were kept in DD at 29±1°C and food was supplied daily at 12:00. Food was available for a short period to avoid the possibility to eat out of the established time window resulting in a non-homogeneous synchronization in the group. After 30 days, samples from different tissues (brain and heart) were collected at six different time points (N=3 for time point) in the 24h during the 1st and the 2nd day of fasting (every 4 hours from CT21), for a total of 48
hours, in order to test for the persistence of circadian clock driven gene expression in constant conditions.
II.9 Gene expression analysis
Quantitative RT PCR was performed for the various P. andruzzii clock genes using the following pairs of primers: CF Clock1 Fwd: GTACTGTGGAGGAGCCCAAT-3’ Rev:
5’-GGGTCTCCAGGTCATCCAC-3’ (162bp fragment); CF Period1 Fwd:
5’-GGCAACATCTCAACCAGTGG-3’ Rev. 5’-GGGCTTCATAACCCGCGTGC-3’ (145bp
fragment); CF Period2 Fwd: TTCCAGCTGTGTGTTTCAGG-3’ Rev:
5’-AGAAGCGGAAAGAGTGGTCA-3’ (187bp fragment); CF Cry1a Fwd:
5’-TGATGAGAAGTTCGGGGTTC-3’, Rev: 5’-GCGAATTGGCATTCATTCTT-3’ (173bp
fragment); CF Cry5 Fwd: CTGCAGAGGTCCTTCCAAAG-3’, Rev:
GCTTTCCGTTGTTCTCTTCG-3’ (198bp fragment) and CF β-actin Fwd: 5’-AGGACCTGTATGCCAACACA-3’, Rev: 5’-AATCCACATCTGCTGGAAGG-3’ (200bp fragment). Quantitative RT PCR was performed for the various zebrafish clock genes using the following pairs of primers: ZF Clock1 Fwd: CTGGAGGATCAGCTGGGTAG-3’ Rev: 5’-CACACACAGGCACAGACACA-3’; ZF Period1 Fwd: 5’-CCGTCAGTTTCGCTTTTCTC-3’
Rev. 5’-ATGTGCAGGCTGTAGATCCC-3’; ZF Period2 Fwd:
5’-ATGTCGATGGCTTTAGGCAG-3’ Rev: 5’-CGAGACATCCAGAAGGTGCT-3’; ZF Cry1a Fwd: 5’-TCCGCTGTGTGTACATCCTC-3’, Rev: 5’-CAAACACTGCAGCAAAAACC-3’; ZF
Cry5 Fwd: 5’-AATGGCAAGACTCCCATGAC-3’, Rev: 5’-GTGGCCCTAAGGATGACGTA-3’
and ZF β-actin Fwd: GCCTGACGGACAGGTCAT-3’, Rev:
5’-ACCGCAAGATTCCATACCC-3’. 4µl of 1:5 diluted cDNA was pipetted in each well of a 96well plate together with according SYBRgreen-Primer-MasterMix. Quantitative Real-Time PCR was performed using an Applied Biosystems StepOnePlus Real-Time PCR System (Applied Biosystems). PCR conditions were: 15 min at 95 °C, then 40 cycles of 15 s at 95 °C, 30
s at 60 °C. The relative levels of each RNA were calculated by the 2-ΔΔCT method (CT standing
for the cycle number at which the signal reaches the threshold of detection). Relative expression levels were normalized to cavefish or zebrafish β-actin respectively.
II.10 Cells in light-dark cycles
For LD experiment CF and AB9 cells were seeded in culture flasks approximately 70% of confluency. Flasks containing cells were submerged in 60 l water baths with circulating heating and cooling units (Lauda, Lauda-Königshofen, Germany) to keep the temperature constant and illuminated with a tungsten light source (11 μW/cm2). Cells were raised at 25°C under a 12:12-h
light-dark cycle and then collected during the 4th day in LD cycle at 4 different time points (ZT3,
9, 15, 21; N=4 for CF cells and N=4 for AB9 cells).
II.11 Reporter and expression vectors
zfPer1b-luc: The zfPer1b promoter was amplified by using Genome Walker PCR (Clontech), according to the manufacturer’s instructions, and subcloned into pGL3Basic (Promega) (zfper4:luc, Vallone et al. PNAS 2004).
zfPer2-luc: The light responsive promoter of zebrafish Period 2 (zfPer2) containing a fragment of 1,571 bp of the 5’ flanking region and 129 bp of the 5’UTR of the per2 gene was PCR amplified using the Universal GenomeWalker Kit (Clontech) by using Genome Walker PCR (Clontech) and subcloned into pGL3Basic (Promega) ( -1.7per2:Luc, Vatine et al., 2009).
zfPer2 LRM: The per2 minimal promoter, containing 431 bp of the 5’ flanking region and 164 bp of 5’ UTR of the per2 gene was subcloned into pGL3basic (Promega) upstream of the luciferase reporter gene (-0.43per2:Luc,Vatine et al.,2009).
cfPer2-luc: The promoter fragment of the cavefish Period 2 gene, containing 876 bp of the 5' flanking region and 112 bp of the 5'UTR, was amplified by using Genome Walker PCR (Clontech) from cavefish genomic DNA with the primer CFPer1GW1 (5’-TCTGTCCGGCTAAAAAGTCCGACTAAAT-1) in combination with the AP1 primer
(Clontech) and sequenced. CFPer2SacIF
(5'-ACTGGAGCTCTGCGATTTTCACCTTAGATTCC-3') CFPer2XhoIR
(5'-ACTGCTCGAGTCTGTCCGGCTAAAAAGTCC-3') introducing the restriction site for the enzyme SacI and XhoI (Fermentas) were used to clone the fragment into PGL3 basic vector (Promega).
Expression vectors were generated using a PCR-based strategy. The zebrafish per2 minigene (zfPER2) was constructed by first amplifying the full length coding sequence of zebrafish per2
(genbank NM_182857.1), eliminating the stop codon by introducing an artificial XbaI restriction site and cloning into the expression vector pcDNA3.1 Myc/His A. The CMV promoter was eliminated from this expression vector by digestion with the restriction enzymes MfeI and BamHI (New England Biolabs). CMV promoter fragment was replaced with the light responsive promoter fragment of the zebrafish Period 2 gene (Vatine et al., 2009); the fragment contains 1,457 bp of the 5' flanking region and 164 bp of the 5' untranslated region (UTR) of the zebrafish
Per2 gene, amplified from zebrafish genomic DNA with the primers ZFPer2MfeIF
(5'-ATCGCAATTGACCATGCATAGCAGAAACTT-3') and ZFPer2BamHIR
(5'-ATCGGGATCCCTGACAACTTCAGCAAATCTT-3').
The full-length zebrafish TMT-opsin (ENSDART00000081729) was amplified with the primers 5'TMTfor ATCGGAATTCGCTTTCCCCTCAGAAAACAA-3') and 3'TMTrev (5'-ATCGGAATTCTCGCCTGTAAACAAATCCAA-3') introducing restriction sites for EcoRI (Fermentas) and cloned into the pcDNA3.1 (+) to generate the TMT-opsin expression vector. In the case of Opn4m2 (ENSDART00000018501), appropriate restriction sites were introduced (BamHI, XhoI, Fermentas) and stop codon abolished using the PCR primers ZFOpn4m2BamHIF
GATCGGATCCGCATGAGCCATCACTCTTCA-3') and ZFOpn4m2MycXhoIR
(5'-GATCCTCGAGGTTCCCTCCAAGCAAAGCCT-3'). Amplified Opn4m2 was then used to create an expression vector introducing the cDNA into the pcDNA3.1 Myc/His A.
These PCR reactions were performed using the Perkin Elmer Gene Amp XL PCR kit according to manufacturer’s instructions. All PCR reactions were temperature cycled using a Perkin Elmer 9700 thermal cycler. Obtained cDNA and DNA inserts were digested and purified by agarose gel electrophoresis followed by Qiaquick column purification from agarose gel slices (gel extraction kit, Qiagen). Vectors were transformed into competent E.coli bacteria (TOP10F’, InVitrogen) using the manufacturer’s reagents and instructions.
II.12 Plasmid DNA extraction
Liquid cultures of ampicillin-resistant bacteria were prepared by inoculating 100ml aliquots of Luria Bertani (LB) medium using either single bacterial colonies or frozen bacterial glycerol stocks (Sambrook et al., 1989). Plasmid DNA was extracted from saturated overnight cultures using a column-based extraction system according to the manufacturer’s instructions (Midi prep, Qiagen) and the final DNA pellets were dissolved in 100–200µl of Millipore filtered, glass
distilled water. Yields of DNA were calculated based on optical density measurements of dilutions made from the stocks. The optical density was measured at both 260nm and 280nm and so used to assess DNA purity as well as concentration (Sambrook et al., 1989). Glycerol stocks were prepared for each plasmid produced according to standard methods (Sambrook et al., 1989). Minipreps of plasmid DNA from 1.5ml cultures were prepared using a standard “boiling method” (Sambrook et al., 1989).
II.13 Transfection using Fugene HD
TMtransfection reagent (Roche
Diagnostics)
CF cells were transfected using Fugene HDTM transfection reagent according to the
manufacturer’s conditions with a 3:1 ratio of Fugene6TM(in µl):DNA(in µg) (Roche Diagnostics,
Fugene6TM) and subsequently stored in the incubator over night at 25oC.
II.14 In vivo luciferase assay LD
CF and AB9 cells were grown with Leibovitz’s L-15 medium (Gibco) supplemented with 20% fetal calf serum (Biochrom KG), 100 units/ml penicillin, 100 µg/ml streptomycin and 50 µg/ml
gentamycin (Gibco BRL) and approximately 6x10⁴ CF cells and 3x10⁴ AB9 cells per well were
seeded into a 96-well fluoro-assay plate (Nunc Rochester) 1 day before the experiment. The plate was then incubated overnight at 25°C to ensure proper attachment of the cells to the surface of the well. The day after, grown medium was replaced with serum free Leibovitz’s L-15 medium, to avoid any induction of oscillation driven by the culture serum. Cells were transfected with the reporter vectors zfPer1b-luc, zfPer2-luc or cfPer2-luc using FuGENE HD (Roche) according to the manufacturer's protocol. In the experiments with the minigene, zfPER2 minigene was co-tranfected at different concentration in combination with the zfPer1b-luc reporter vector.
24h after transfection medium was replaced with 250µl fresh culture medium containing 0.5mM beetle luciferin, potassium salt solution (Promega). The plate was sealed using an adhesive “Top Seal” sealing sheet (Packard). Plates were then transferred into a Packard Top-count NXT scintillation counter (2-detector model, Packard) and exposed to LD cycles (12:12).
Bioluminescence was measured and expressed as the frequency of photon emission (cps) counted during 4-6 sec/well at intervals of 30-60 mins. In the experiments the plate was illuminated during the intervals between counting. To ensure uniform illumination of wells across the plate, each sample plate was positioned below a transparent, empty 96 well plate when inserted into the counter’s plate-stacking unit. The counter was located in a thermostatically controlled dark room and illuminated using a tungsten light source (20 µW/cm2) that was
connected to a programmable timer. Luciferase assay data was analysed by first storing the data as ASCII data files using the Packard “Hologram” software system and then importing these files directly into Microsoft Excel using the Import and Analysis macro (I&A, Plautz et al., 1997). Subsequently data was plotted graphically using I&A Excel macro software.
II.14.1 Rescue of light induction on zfPer2 promoter-reporter in CF cells
CF-1 cells were grown with Leibovitz’s L-15 medium (Gibco) supplemented with 20% fetal calf serum (Biochrom KG), 100 units/ml penicillin, 100 µg/ml streptomycin and 50 µg/ml
gentamycin (Gibco BRL) and approximately 6x10⁴ CF cells per well were seeded into a 96-well
fluoro-assay plate (Nunc Rochester) 1 day before the experiment. The plate was then incubated overnight at 25°C to ensure proper attachment of the cells to the surface of the well. The day after, grown medium was replaced with serum free Leibovitz’s L-15 medium. Cells were transfected with the reporter vector zfPer2-luc and the opsins expression vectors using FuGENE HD (Roche) according to the manufacturer's protocol. 24h after transfection medium was replaced with 250µl fresh culture medium containing 0.5mM beetle luciferin, potassium salt solution (Promega) and also retinaldehyde isoforms (100 nM; 9-cis-Retinal and all-trans-Retinal from Sigma-Aldrich) under dim red light. The plate was sealed using an adhesive “Top Seal” sealing sheet (Packard).
Plates were then transferred into a Packard Top-count NXT scintillation counter (2-detector model, Packard) and exposed to LD cycles (12:12). Cells were kept in the dark or under dim red light during the experiment. Bioluminescence was measured and expressed as the frequency of photon emission (cps) counted during 4-6 sec/well at intervals of 30-60mins. In the experiments the plate was illuminated during the intervals between counting. To ensure uniform illumination of wells across the plate, each sample plate was positioned below a transparent, empty 96 well plate when inserted into the counter’s plate-stacking unit. The counter was located in a
thermostatically controlled dark room and illuminated using a tungsten light source (20 µW/cm2)
that was connected to a programmable timer. Luciferase assay data was analysed by first storing the data as ASCII data files using the Packard “Hologram” software system and then importing these files directly into Microsoft Excel using the Import and Analysis macro (I&A, Plautz et al., 1997). Subsequently data was plotted graphically using I&A Excel macro software.
II.15 Induction of cycling Per1b promoter-reporter vector by Dexamethasone
CF-1 cells were grown with Leibovitz’s L-15 medium (Gibco) supplemented with 20% fetal calf serum (Biochrom KG), 100 units/ml penicillin, 100 µg/ml streptomycin and 50 µg/ml gentamycin (Gibco BRL) and approximately X cells/96 well plate were plated 1 day before the experiment into a 96-well fluoro-assay plate (Nunc Rochester). The plate was then incubated overnight at 25°C to ensure proper attachment of the cells to the surface of the well. After 24h grown medium was replaced with serum free L-15 medium. Cells were transfected with the reporter vector zfPer1b-luc using FuGENE HD (Roche) according to the manufacturer's protocol. In the experiments with the minigene, zfPER2 minigene was co-tranfected at different concentration in combination with the zfPer1b-luc reporter vector.
The day after cells were treated with Dexamethasone (Sigma) added in L-15 at a final concentration of 100 nM which replaced the transfection medium. After 2 hours the Dexamethasone was removed by washing the plate twice with PBS and substituted with 250µl fresh culture medium containing 0.5mM beetle luciferin, potassium salt solution (Promega) and the plate sealed using an adhesive “Top Seal” sealing sheet (Packard). Plates were then transferred into the scintillation counter (Envision Top Count; Perkin Elmer) and incubated at constant temperature (22°, 25°, 29°C). Bioluminescence was measured once per hour directly after the treatment. Data were exported with the Wallac EnVision Manager 1.12 software and analysed by first storing the data as CSV data file and then importing directly into Microsoft Excel.
II.15.1 Phase Response Curve
CF-1 cells were grown with Leibovitz’s L-15 medium (Gibco) supplemented with 20% fetal calf serum (Biochrom KG), 100 units/ml penicillin, 100 µg/ml streptomycin and 50 µg/ml
gentamycin (Gibco BRL) and approximately 6x10⁴ CF cells per well were seeded into a 96-well
fluoro-assay plate (Nunc Rochester) 1 day before the experiment. The samples on the plate were distributed in five group on the left part (I-V; Light pulse) and five group on the right part (I-V; Dark control). The plate was then incubated overnight at 25°C to ensure proper attachment of the cells to the surface of the well. After 24h grown medium was replaced with serum free L-15 medium. Cells were transfected with the reporter vector zfPer1b-luc using FuGENE HD (Roche) according to the manufacturer's protocol. The day after each group of cells were treated with dexamethasone (Sigma) added in L-15 at a final concentration of 100 nM with an interval of approximately 8 hours per group. After 2 hours the medium was replaced with 250µl fresh culture medium containing 0.5mM beetle luciferin, potassium salt solution (Promega). At the end of the treatments the plate was sealed using an adhesive “Top Seal” sealing sheet (Packard) and half of the plate was exposed to 15 min light pulse. Plate was then transferred into the scintillation counter (Envision Top Count; Perkin Elmer) and incubated at constant temperature (25°C). Cells were kept in the dark or under dim red light during the experiment. Bioluminescence was measured once per hour directly after the treatment. Data were exported with the Wallac EnVision Manager 1.12 software and analysed by first storing the data as CSV data file and then importing directly into Microsoft Excel.
III. RESULTS
III.1 Cavefish clock genes cloning
The first part of the study focused on the molecular characterisation of the P. andruzzii circadian oscillator. With this aim, an analysis of the transcriptome was performed where various clock and clock-controlled genes were identified.
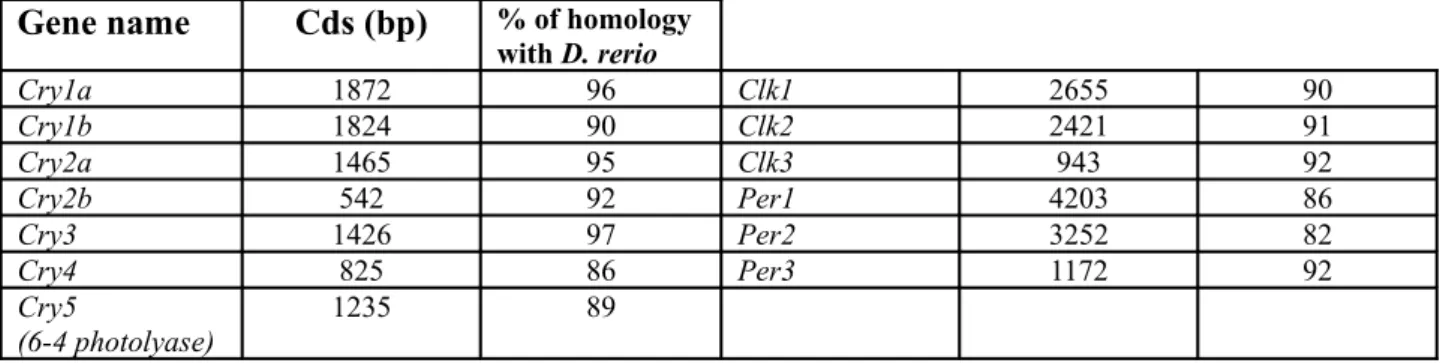
cDNA sequences of vertebrate clock genes, cloned from various species, have revealed regions of high conservation. A RT-PCR approach with primers designed against conserved domains of zebrafish clock gene homologs was used to clone many positive and negative elements of the clock machinery in the Somalian cavefish. Clock genes such as Clock, Period and Cryptochrome have all been isolated and characterised (Table 1).
Large sections of the coding sequences of members of the Cryptochrome family have been identified: as in other teleosts, this group of genes is composed by six Crys (Cry1a, Cry1b,
Cry2a, Cry2b, Cry3, Cry4) together with 6-4 photolyase, that is also called Cry5. DNA
photolyase is an enzyme that repairs UV damaged DNA in a light-dependent manner (Todo et al., 1993). Specifically, (6–4) photolyases repair (6–4) pyrimidine photoproducts.
Cryptochromes are evolutionary descendents of photolyases; they have lost the DNA repair
activity and function as photoreceptors or transcriptional repressors (Cashmore et al., 1999). CRYs share the same structure with a conserved N-terminal alpha/beta domain homologous to photolyases and a divergent C-terminal helical domain, connected by an interdomain loop. CRYs have been implicated as photoreceptors in zebrafish, as in the case of Drosophila, where CRY is a directly photosensitive nuclear protein that interacts with the negative feedback loop in the fruitfly clock.
In zebrafish, Cry1a is a light inducible gene (Hirayama et al., 2005) and a strong repressor of the positive limb via its binding with the heterodimer CLOCK-BMAL in the nucleus (Ishikawa et al., 2002). The P. andruzzii Cry1a cDNA contains an 1872-bp open reading frame (ORF) encoding a 623 amino acid protein. The predicted CRY1a protein shares very high sequence similarity with other vertebrate orthologs (96% with zebrafish, 82% with human, 80% with mouse, 79% with chicken), revealing that functional domains are conserved. They include the two characteristic chromophore-binding domains (FAD-binding domain and pterin-binding domain) also shared with photolyases.