IMPACT OF SOLAR IRRADIATION MODELS ON BUILDING REFURBISHMENT
MEASURES FROM MULTI-OBJECTIVE OPTIMIZATION
Alessandro Prada
1, Giovanni Pernigotto
2, Francesca Cappelletti
3, Andrea Gasparella
11
Free University of Bozen-Bolzano, Faculty of Science and Technology, Bolzano, Italy
2
University of Padova, Department of Management and Engineering, Vicenza, Italy
3
IUAV of Venezia, Dep. of Design and Planning in Complex Environments, Venice, Italy
ABSTRACT
The European energy regulations encourage the refurbishment of existing buildings in order to ensure a reduction of the energy use. The choice of the optimal solutions is actually a trade-off problem between conflicting goals. For this reason, multi-objective optimization techniques can be coupled with building energy simulation (BES). However, even if validated BES codes are used, some discrepancies arise due to the accuracy of implemented models, such as those related to the elaboration of solar irradiation profiles.
This research work investigates the extent to which the choice of solar irradiation models can affect the robustness of the Pareto front for several building configurations in two Italian climates.
The results highlight the building characteristics reducing the robustness of Pareto front solutions. Nonetheless, the analysis shows a low sensitivity of cost and energy optimal solutions to the uncertainty introduced by solar models.
INTRODUCTION
In the European Union (EU), increasing attention on building energy refurbishment has been paid in the last few years since the proper definition of conservation measures for existing buildings seems the only way to ensure noticeable energy savings. In this respect, the
EU has decided to combine the search of energy and
economically effective measures, binding the diffusion of different solutions for building energy renovation to their market appeals. Hence, the recast of the European energy performance of building directive (European Commission, 2010) and the Commission Delegated Regulation EU 244 (European Commission, 2012) require the definition of an “energy performance level which leads to the lowest cost during the estimated economic lifecycle”. The choice of the optimal solution is actually a trade-off problem between conflicting goals. For this reason, multi-objective optimization techniques (MOO), such as genetic algorithm (GA), have to be coupled with building energy simulation (BES). However, even if validated BES codes are used, some epistemic uncertainty arises in the simulation results due to the accuracy of the implemented models. For this reason, the verification of the result robustness is a key aspect
in the optimization process. In the literature, some works dealt with the robustness of optimal solutions to the algorithm parameters (Wright and Alajmi 2005; Ihm and Krarti 2012) while others researches (Prada
et al. 2014) focused on the robustness of GA to the
uncertainty introduced by some BES boundary conditions, especially to the weather data. In this framework, the robustness of the MOO solutions to uncertain solar irradiation data can assume a greater relevance in BES results, especially in nearly-zero energy buildings. A noteworthy number of alternative models are available for the estimation of irradiation incident on various tilted surfaces. In fact, the solar irradiation on tilted surface is seldom recorded in most of the weather stations thus, a variety of mathematical and empirical models has been proposed in the literature. The solar models are divided in “horizontal
diffuse irradiance models” for the subdivision of
horizontal solar irradiation into direct and diffuse components and in “irradiance models for tilted
surfaces” for the calculation of irradiation on tilted
surfaces. No pair of models is universally acknowledged as the most reliable for different worldwide localities. Thus, energy modellers have some choice of model combinations that can affect the results of the MOO.
This research work investigates the extent to which the choice of solar irradiation models affects the robustness of the optimal solutions provided by MOO. To this purpose the MOO of the building retrofit has been repeated considering different solar irradiation models, in order to highlight differences in terms of configuration or in terms of performance of the optimal solutions in the Pareto front. Starting from a set of 264 combinations of irradiance models presented in Prada et al. 2015, three statistically-significant pairs have been chosen for two Italian climates (i.e., Roma and Monza) and used to pre-process the hourly global solar irradiance profiles of horizontal and vertical surfaces. The developed profiles have been used in different MOO runs, for several building configurations. Finally, the sensitivity of the mix in energy saving measures (ESMs) for the optimal retrofit solutions as a function of the building configuration has been assessed with the purpose of verifying the robustness of the MOO procedure to the choice of solar irradiation models.
METHOD
Cases of study
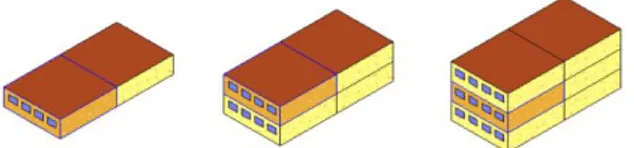
In order to broaden the result representativeness, the robustness analysis is performed on three building typologies according to the screening analysis, which individuates the variables affecting the results (Pernigotto et al. 2014). The investigated buildings are a semi-detached house (S/V = 0.97 m-1), a penthouse (S/V = 0.63 m-1) and an intermediate flat in a multi-storey building (S/V = 0.3 m-1). The three buildings were obtained by imposing an adiabatic boundary condition whenever the envelope structures are adjacent to other apartments (Figure 1). The envelope surfaces are directly exposed to the external environment in all the other cases. These buildings were developed starting from a reference module, which is a typical flat having 100 m2 floor surface, 3 m internal height and façades oriented towards the main cardinal directions. Windows are in the same façade and the window to floor ratio is equal to 0.144. Either a South or an East windows orientation is considered. As a result, the variable combinations produced a set of 12 buildings for which, the MOO were performed by a GA. Moreover, two alternatives of opaque envelope were modelled in order to consider different initial conditions of the building to be refurbished (Penna et al. 2015). The cases REF 1 represent constructions built prior to the first Italian energy law in 1976 (Italian Parliament 1976) whereas
REF 2 buildings have the typical thermal
transmittances capable to meet the mandatory provisions introduced by the second energy legislations (Italian Parliament 1991). The infiltration rate was estimated according to EN 12207 (CEN 1999) and EN 15242 (CEN 2007a) with a reference air tightness n50 equal to 7 ACH. The associated
infiltration rates were 0.20 ACH, 0.13 ACH and 0.062 ACH, respectively for semi-detached houses, penthouses and intermediate flats. All the test cases adopted a standard gas boiler coupled with radiators and on-off control system.
Figure 1 – Test cases used in robustness analysis.
Energy Saving Measures
An Elitist Non-dominated sorting GA algorithm, NSGA-II, (Deb 2002) was implemented in Matlab® with the purpose of selecting the optimal mixes of energy saving measures (ESMs). The energy performance for heating EPh and the net present value
(NPV) were used as objectives, according to the EN ISO 15459 (CEN 2007b). The fitness function is a Matlab® function that launches the BES code (i.e., TRNSYS model), reads the BES output file and
computes the NPV by means of the method proposed by the technical standard EN ISO 15459.
The application of mature off-the-shelf technologies is expected to allow a total energy consumption reduction of one-third (European Commission 2014) with lower initial cost respect to renewable source systems. Hence, in this analysis the conventional
ESMs were considered, applied either to the envelope
components and to the HVAC systems:
1. external insulation of the opaque envelope with an EPS additional layer (thermal conductivity of 0.04 W m-1 K-1, specific heat of 1470 J kg-1 K-1 and specific mass of 40 kg m-3) with thicknesses range from 0 to 20 cm. The insulation thickness was changed independently for vertical walls, roof and floor as well as different installation costs were considered;
2. replacement of existing windows with more efficient glazing systems (i.e., double, D, or triple,
T, glazing with aluminium frames and thermal
break coupled with either high, H, or low, L,
SHGC);
3. boiler replacement with either a modulating (MOD) or condensing boiler adjusted by a climatic control (COND);
4. installation of a mechanical ventilation system (MVS) with a cross flow heat recovery system. For all the ESMs, the initial cost derived from regional price list was adopted (Penna et al. 2015). Additionally, the adoption of the primaries ESMs introduced some secondary improvements:
1. thermal bridge reduction caused by the envelope insulation and the windows replacement modelled by a polynomial regressions derived in (Penna et al. 2015);
2. the air leakage is decreased with new glazing systems. Especially, the new windows installation was considered able to halve the infiltration rate with respect to the initial configuration;
3. the lower heating needs allow decreasing the inlet temperature of the radiators and, consequently, the reduction of the distribution losses.
Solar irradiation models
The analysis was performed considering two Italian climatic contexts, i.e., Monza, a mixed-humid climate (class 4A), and Roma, a warm marine (class 3C), according to ASHRAE classification (ASHRAE 2013).
Table 1
Coordinates of the two reference cities
CITY LATITUDE LONGITUDE ALTITUDE
Monza 45.57° N 9.35° E 162 m
In this research, the 264 combinations of the horizontal diffuse irradiance model and solar irradiation models for tilted surface presented in (Prada et al. 2015) were considered. For each city, the hourly distributions of solar irradiance, predicted by means of all the possible couples between the 22 horizontal diffuse irradiance models and 12 irradiance models for tilted surfaces, were investigated for the vertical surfaces oriented towards the four cardinal points. Following on from this point, the three pairs of models characterized by the extreme and average behaviours were selected. Especially, the three pairs of models whose estimated solar radiation falls most frequently among the first 66 positions (i.e., within the first quartile), in the last 66 positions (i.e., beyond the third quartile), and between first and third quartiles of the entire population of model predictions were chosen (Table 2). It can be noticed that the selected diffuse irradiance models have different characteristics. The older works, i.e., Orgill and Holland and (1977) and Erbs et al. (1982), correlate the diffuse fraction of solar irradiation with the clearness index that represents the portion of horizontal extra-terrestrial radiation reaching the surface. On the contrary, Chendo and Maduekwe (1994) introduced also the dependency to the solar altitude, while Perez et al. (1992) proposed a modification to the DISC model introduced by Maxwell (1987) with the purpose of considering the dynamics effect in time series. Finally, Boland et al. (2008), involved a logistic function instead of piecewise linear or simple nonlinear functions.
Table 2
Solar radiation models used in optimization analysis
CITY CODE DIFFUSE
MODEL TILTED SURFACE MODEL Monza C1 Erbs et al. 1982 2 nd model by Muneer 2006 C2 Orgill and Holland 1977 Ma and Iqbal 1983 C3 2nd model by Chendo and Maduekwe 1994 Klucher 1978 Roma
C1 Perez et al. 1992 Liu and Jordan 1960
C2 Boland et al.
2008 Burgler 1977
C3 Erbs et al. 1982 Perez et al. 1990
Similarly, the solar models for tilted surface have different characteristics. According to Muneer (2007) the irradiance model for tilted surface can be divided in three generations:
1. First Generation: the simplest and earliest model based on strong assumptions (Liu and Jordan, 1960 and Ma and Iqbal, 1983);
2. Second Generation: the model differentiating the radiance distributions between clear and overcast skies (Burgler 1977 and Klucher 1978);
3. Third Generation: the models considering the anisotropy of diffuse irradiations (Perez et al. 1990 and Muneer 2007).
Thus, there is a model belonging to each of the three generations for both the cities. This consideration, together with the characteristics of diffuse irradiance models, highlights the nature of the uncertainty introduced in building energy simulation. In fact, the variability of solar radiation is closely related to the different approximation levels of the models used in the pre-processing of solar data.
The MOO procedure was repeated three times for each building configuration by using the different pairs of solar models in order to compare each other the Pareto fronts.
RESULTS
Figure 2 presents the different Pareto fronts obtained with the three couples of irradiation models according to the window orientation and the S/V ratio for the cases REF 2. The same pictures are also obtained for
REF 1 case but are not reported for brevity. In
renovated compact buildings (e.g., S/V = 0.3 m-1), the incident solar irradiation is higher than the exploitable solar gains. Thus, the choice of solar irradiance models seems to affect scarcely the Pareto fronts. On the contrary, there is a greater influence in those situations where indoor solar gains play a driving role in determining the building heating need, such as buildings with larger envelope external surface. The primary effect of the different solar irradiation model is a translation of the Pareto’s fronts. Note that a variations in the shape of the fronts is also present in buildings with lower S/V ratios. The change in the shape implies a different composition of the trade-off solutions while the mere translation, especially if limited, cannot demonstrate a lower robustness of the
MOO. Since the choice of solar irradiance models can
modify the optimality of a certain mix of ESMs, the robustness of the GA is firstly assessed through the variation of the ESMs frequencies in the Pareto front. Furthermore, the analysis was carried out by separating the different building configurations in order to highlight the building features increasing the sensitivity of the Pareto front.
The choice of solar irradiation model causes a frequency variation of the ESMs values in the Pareto front solutions (Figure 2) generally lower than 10 % for all the considered ESMs. Nonetheless some building configurations increase the variation of the
ESMs frequencies between the fronts obtained using
different pairs of solar irradiation models. In this regard, the East windows orientation increases the sensitivity of the Pareto front especially for some
ESMs. The variation among the frequencies of the
three combinations of irradiance models increases up to 8 % in cases of East oriented windows with respect to the 3 % of the South cases. Similarly, the average frequency variation of roof insulation thickness passes from 2 % (i.e., South window cases) to 5 % in East cases while negligible variations are presents in floor insulations. Instead, the Pareto front robustness is little affected by the window orientation as regards the choice of window and boiler typologies, while the East orientation little increases the percentage changes in the MVS frequencies.
The variation analysis of the front compositions demonstrates a poor correlation with the building shape. In fact, the three investigated buildings (i.e., semi-detached houses, penthouse and intermediate flats in multi-story buildings) have the same sensitivity, for any ESMs. On the contrary, the envelope insulation level of the initial building configuration strongly affects the robustness of the Pareto front to the epistemic uncertainty introduced by
the solar irradiation models. The buildings complying with the second Italian energy legislation (REF 2) show more variations in the Pareto front composition. In fact, while for REF 1 cases negligible changes are presents in the fronts obtained with the different models, the variations of insulation thickness frequencies in REF 2 cases are equal to 25 %, 19 % and 9 % respectively for wall, roof and floor. Similarly, the changes in frequencies for the REF 2 buildings are up to 2 %, 6 % and 9 % for the window, boiler and ventilation system typologies.
Finally, the climate weakly interacts with the sensitivity of the GA results when different solar irradiation models are used. In fact, the variations caused by the climate in the ESMs frequencies are limited to 1 % for all ESMs except for the ventilation systems where, the frequency variation passes from 3 % in Monza to 5 % in Roma.
Nevertheless, among all the trade-off solutions in the Pareto front, the interest is mainly focused on two points that represent the minimum value obtained for each objective: the cost-optimal and the energy optimal.
Robustness of the cost optimal performances The ESMs ensuring the achievement of the cost optimality are quite robust to the use of different models of solar irradiation (Tables 3 and 4). In fact, all the models lead to the same configuration as regards the type of heating and ventilation systems. Noticeable changes happen only to the insulation thicknesses while only in a few cases the cost optimal solutions vary the windows type, when different solar irradiation models are used in the MOO.
Note that the East orientation of windows tends to increase the sensitivity in the choice of optimal insulation thicknesses. In this case, the solar model combination, that generally predicts a lower incident solar irradiation (C1), increases the economic convenience of greater insulation thicknesses. On the contrary, the presence of South windows in intermediate flat of multi-storey buildings leads, in some cases, to change the window typology. Due to the flattened shape of the Pareto front, this type of buildings is more sensitive to variations in the incident solar radiation. The results reported in Tables 3 and 4 show a poor correlation between the robustness of the cost optimal solutions and the shape of the building.
Table 3
Cost and energy optimal solutions for the different test cases in Monza obtained with the 3 pairs of solar models.
REF 1 C1 C2 C3 C1 C2 C3 C1 C2 C3 C1 C2 C3 C1 C2 C3 C1 C2 C3 Cost-Optimal Wall [cm] 19 18 18 15 16 16 18 19 17 17 17 18 17 18 18 17 18 16 Roof [cm] 0 0 0 0 0 0 17 17 17 16 15 15 17 15 15 17 17 17 Floor [cm] 0 0 0 0 0 0 0 0 0 0 0 0 16 16 17 15 16 16 Wind. DH DH DH DH DH DH DH DH DH DH DH DH DH DH DH DH DH DH Boiler STD STD STD STD STD STD STD STD STD STD STD STD STD STD STD STD STD STD
Vent. NAT NAT NAT NAT NAT NAT NAT NAT NAT NAT NAT NAT NAT NAT NAT NAT NAT NAT
EPH [kWh m-2 y-1] 20.22 21.41 18.39 9.01 6.77 10.73 38.23 38.49 35.31 23.37 21.99 25.98 58.85 60.30 55.82 42.74 38.83 44.91 NPV [k€] 18.32 18.51 17.69 14.74 14.26 15.34 27.51 27.71 26.58 23.12 22.54 23.76 37.20 37.31 36.30 32.61 31.88 33.27 Energy-Optimal Wall [cm] 20 20 19 15 18 15 19 19 20 20 20 20 18 19 18 18 18 18 Roof [cm] 0 0 0 0 0 0 19 20 20 20 20 20 18 18 19 19 19 19 Floor [cm] 0 0 0 0 0 0 0 0 0 0 0 0 19 20 19 19 18 20 Wind. TH TH TH TL DH TL TH TH TH TH TH TH TH TH TH TH TH TH
Boiler COND COND STD STD STD STD COND COND COND STD STD STD M OD COND COND M OD M OD COND
Vent. M VS M VS M VS M VS M VS M VS M VS M VS M VS M VS M VS M VS M VS M VS M VS M VS M VS M VS EPH [kWh m -2 y-1 ] 0.52 0.57 0.47 0.47 0.47 0.47 11.86 11.78 9.20 2.50 1.79 3.49 27.20 26.26 23.76 13.76 12.48 14.70 NPV [k€] 30.73 30.74 27.71 26.81 26.41 26.81 38.51 38.70 38.13 33.43 33.24 33.70 46.29 47.27 46.45 42.84 42.28 44.19 S /V = 0.3 m-1 S /V = 0.63 m-1 S /V = 0.97 m-1
East S outh East S outh East S outh
REF 2 C1 C2 C3 C1 C2 C3 C1 C2 C3 C1 C2 C3 C1 C2 C3 C1 C2 C3 Cost-Optimal Wall [cm] 19 12 12 11 11 12 18 12 12 12 12 12 18 11 10 10 11 10 Roof [cm] 0 0 0 0 0 0 17 12 12 12 12 12 17 11 11 11 11 11 Floor [cm] 0 0 0 0 0 0 0 0 0 0 0 0 18 11 11 11 11 11 Wind. DH DH DH SG SG DH DH DH DH DH DH DH DH DH DH DH DH DH Boiler STD STD STD STD STD STD STD STD STD STD STD STD STD STD STD STD STD STD
Vent. NAT NAT NAT NAT NAT NAT NAT NAT NAT NAT NAT NAT NAT NAT NAT NAT NAT NAT
EPH [kWh m -2 y-1] 21.47 27.23 23.74 35.01 31.88 14.11 39.60 49.85 45.56 32.32 29.82 34.59 58.05 76.89 73.54 60.24 56.27 62.50 NPV [k€] 18.66 19.30 18.35 14.88 14.03 15.73 27.88 28.84 27.67 24.07 23.39 24.68 37.53 39.04 37.99 34.37 33.43 34.99 Energy-Optimal Wall [cm] 20 12 12 12 12 12 20 12 12 12 12 12 18 12 11 11 12 12 Roof [cm] 0 0 0 0 0 0 20 12 12 12 12 12 19 12 11 11 11 11 Floor [cm] 0 0 0 0 0 0 0 0 0 0 0 0 19 12 12 12 11 12 Wind. TH TH TH TH TH TH TH TH TH TH TH TH TH TH TH TH TH TH
Boiler STD COND COND COND COND COND COND COND COND STD COND COND COND COND COND COND COND COND
Vent. M VS M VS M VS M VS M VS M VS M VS M VS M VS M VS M VS M VS M VS M VS M VS M VS M VS M VS EPH [kWh m-2 y-1] 0.62 3.24 2.12 0.54 0.48 0.54 11.94 22.42 19.25 11.07 8.68 11.90 27.71 43.77 42.17 31.19 29.18 31.97 NPV [k€] 27.88 30.41 30.10 29.67 29.66 29.67 38.88 39.01 38.15 33.05 35.27 36.15 47.53 48.21 47.43 44.44 43.82 44.79 S /V = 0.3 m-1 S /V = 0.63 m-1 S /V = 0.97 m-1
In fact, the variations in the insulation thickness of wall and roof are basically the same in the three analyzed building configurations. The cost optimal solutions show rather a lower robustness in partially insulated buildings (i.e. REF 2 cases) as already observed for the frequencies of ESMs in the Pareto front. The number of solutions, with a greater difference in insulation thickness, is considerably increased in REF 2 cases for both the investigated climates.
Finally, the weather seems to affect slightly the spread of the uncertainties caused by the choice of solar irradiation model, since the results show a quite similar behavior in the two analyzed cities. The robustness of the optimal solutions can also be assessed by analyzing the variations in the values of
NPV and EPh.
The variations of the NPV of the cost optimal are lower the threshold of 5 % in most of the solutions. The NPV variations increase up to 10 % only for the intermediate flat in multi-storey buildings with REF 2 envelope. However, the changes in the EPh of the cost
optima are generally higher. Indeed, the choice of the solar irradiation models often leads to EPh variations
higher than 10 %. Note that the major changes are detected by the compact buildings with South oriented windows either for NPV and EPh.
Robustness of the energy optimal performances The same analysis on the robustness of the performances of the solutions able to minimize one of the two objectives was also performed for the energy optimal, which is the solution with the lowest EPh
value on the Pareto front (Tables 3 and 4).
Table 4
Cost and energy optimal solutions for the different test cases in Roma obtained with the 3 pairs of solar models.
REF 1 C1 C2 C3 C1 C2 C3 C1 C2 C3 C1 C2 C3 C1 C2 C3 C1 C2 C3 Cost-Optimal Wall [cm] 12 12 12 9 8 15 13 13 15 13 12 12 15 15 15 15 14 14 Roof [cm] 0 0 0 0 0 0 11 12 11 11 10 10 12 12 12 12 12 12 Floor [cm] 0 0 0 0 0 0 0 0 0 0 0 0 13 13 13 13 12 13 Wind. DH DH DH DH DH SG DH DH DH DH DH DH DH DH DH DH DH DH Boiler STD STD STD STD STD STD STD STD STD STD STD STD STD STD STD STD STD STD
Vent. NAT NAT NAT NAT NAT NAT NAT NAT NAT NAT NAT NAT NAT NAT NAT NAT NAT NAT
EPH [kWh m -2 y-1 ] 5.53 5.87 5.40 2.45 2.22 20.13 17.56 17.54 16.93 10.24 10.03 6.77 29.63 30.58 30.04 21.79 21.28 16.56 NPV [k€] 13.39 13.48 13.35 12.15 11.96 11.36 19.98 20.18 20.07 17.98 17.58 16.70 27.32 27.58 27.43 25.19 24.71 23.63 Energy-Optimal Wall [cm] 12 12 12 18 16 12 20 20 20 17 18 14 18 18 19 18 19 18 Roof [cm] 0 0 0 0 0 0 19 20 20 14 12 12 19 18 19 19 19 18 Floor [cm] 0 0 0 0 0 0 0 0 0 0 0 0 20 18 20 18 20 18 Wind. TH TH TH TH TH TH TH TH TH TH TH TH TH TH TH TH TH TH
Boiler STD STD STD STD COND COND STD STD STD STD STD STD COND COND COND M OD COND M OD
Vent. M VS M VS M VS NAT NAT NAT M VS M VS M VS M VS M VS M VS M VS M VS M VS M VS M VS M VS
EPH [kWh m
-2
y-1] 0.39 0.39 0.39 0.30 0.28 0.28 0.43 0.49 0.43 0.43 0.43 0.43 5.76 6.90 5.55 2.37 1.49 1.22
NPV [k€] 26.75 26.75 26.75 13.92 16.53 16.00 32.66 32.88 32.87 31.23 30.95 30.41 41.76 41.45 41.83 39.53 40.73 39.01
S /V = 0.3 m-1 S /V = 0.63 m-1 S /V = 0.97 m-1
East S outh East S outh East S outh
REF 2 C1 C2 C3 C1 C2 C3 C1 C2 C3 C1 C2 C3 C1 C2 C3 C1 C2 C3 Cost-Optimal Wall [cm] 15 15 15 11 11 10 16 11 11 11 11 11 15 10 10 11 10 10 Roof [cm] 0 0 0 0 0 0 12 11 11 11 11 11 11 10 10 10 10 11 Floor [cm] 0 0 0 0 0 0 0 0 0 0 0 0 12 11 11 11 11 11 Wind. SG SG SG SG SG SG SG SG SG SG SG SG SG SG SG SG SG SG Boiler STD STD STD STD STD STD STD STD STD STD STD STD STD STD STD STD STD STD
Vent. NAT NAT NAT NAT NAT NAT NAT NAT NAT NAT NAT NAT NAT NAT NAT NAT NAT NAT
EPH [kWh m-2 y-1] 19.57 19.57 19.57 12.67 10.63 7.08 33.83 38.76 38.31 28.18 26.14 21.25 52.29 58.55 58.10 47.28 46.06 40.16 NPV [k€] 11.21 11.54 11.36 8.80 8.24 7.14 18.61 19.08 18.95 16.19 15.64 14.31 26.68 27.30 27.18 24.37 23.90 22.50 Energy-Optimal Wall [cm] 11 11 11 8 7 12 20 12 12 12 12 12 19 11 11 12 12 11 Roof [cm] 0 0 0 0 0 0 20 12 12 12 12 12 19 11 11 11 12 11 Floor [cm] 0 0 0 0 0 0 0 0 0 0 0 0 20 11 11 12 12 12 Wind. DH DH DH DH DH TH TH TH TH TH TH TH TH TH TH TH TH TH
Boiler COND COND COND COND COND STD COND COND COND COND STD STD COND COND COND COND COND COND
Vent. M VS M VS M VS M VS M VS NAT M VS M VS M VS M VS M VS M VS M VS M VS M VS M VS M VS M VS EPH [kWh m -2 y-1 ] 0.45 0.45 0.45 0.45 0.45 0.30 0.51 3.77 3.58 1.05 0.93 0.57 5.97 17.65 17.31 9.44 7.56 5.90 NPV [k€] 28.35 28.35 28.35 27.95 27.82 13.13 35.76 33.93 33.88 33.19 30.28 30.18 41.95 40.55 40.46 38.65 38.35 37.56 S /V = 0.3 m-1 S /V = 0.63 m-1 S /V = 0.97 m-1
The sensitivities of the optimal are similar to those found for the cost optimal, although the greater sensitivity of EPh to solar irradiation causes more
variations in the ESMs mix. As it happens for the cost optima, the more frequent changes deal with the insulation thicknesses. On the other hand, the cases in which the choice of the solar irradiation models leads to a different choice with regard to the substitution of the heat generator are augmented.
The East orientation of windows together with the
REF 2 envelope tend to increase the sensitivity in the
choice of optimum insulation of the opaque envelope, with increasing insulation thickness for the C1 pair of models. On the contrary, the presence of South windows in intermediate flat of multi-storey buildings leads in some cases to vary the window typology. The presence of South oriented windows, together with the other ESMs, ensure the achievement of very low values of EPh in compact buildings (i.e., S/V = 0.30
and 0.63 m-1). This results in a higher sensitivity of the boiler replacement option when the different solar irradiation models are adopted. Beyond this consideration, a poor correlation between the robustness of the energy optimal solutions and the shape of the building is found. The energy optimal solutions show rather a lower robustness in partially insulated buildings (i.e., REF 2 cases), as already observed for the cost optimal. Finally, the climate conditions interact with the optimal insulation thickness variations. In fact, a lower robustness of optimal insulation thickness emerges also for the REF
1 cases in Roma, while negligible changes happened
in Monza. As for the cost optima performances, the
NPV of the energy optimal shows a good robustness
to the choice of the solar irradiation models. In fact, the changes of the NPVs are again below the threshold of 5 % in most cases. On the contrary, the low EPh
values stress the percentage variations of the energy performance of the energy optima due to the choice of the models.
CONCLUSION
This work assessed the robustness of NSGA II in finding optimal building energy refurbishment when different couples of solar irradiation models are adopted in the BES.
The choice of solar irradiation model firstly affects the Pareto fronts through a translation of them and, in some cases, with a modification of the front shape. This result has been shown also by the analysis of the frequencies with which each ESM is present on the Pareto front obtained with the different pairs of solar irradiation models. The results showed frequencies variation generally lower than 10 % for any ESM. The typologies of solution in the Pareto front showed a higher sensitivity only in some cases, especially when the building is partially insulated and the window surfaces are oriented to the East.
The influence of the initial configuration of the building to be renovated and the robustness of the
Pareto front is another result of the research. The analysis highlighted the reduced sensitivity of the GA solutions to the climates and to the investigated building shapes. On the contrary, in presence of a partial insulation of the opaque envelope the window orientation affects the sensitivity of the GA to the different solar irradiation models used in the BES. The analysis about the robustness of the solutions minimizing one of the two objectives has shown a higher robustness of the cost optimal with respect to the energy optimal. The NPV of the cost and energy optimal obtained with the three pairs of models show variations lower than 5 % in most of the test cases. On the other hand, the EPh change magnitudes are roughly
equal to 10 % in the cost optimal, while higher values have been highlighted for the energy optimal. The NSGA-II then shows a good robustness when the solutions are optimized in terms of NPV and EPh.
However, substantial changes can happen if the objective of the GA are more sensitive to the solar irradiation, such as the discomfort time or the illuminance on the working plane.
NOMENCLATURE
A = Area (m2)COND = Condensing boiler
DH = Double glazing with high SHGC DL = Double glazing with low SHGC EPh = Energy Performance for Heating
ESMs = Energy Saving Measures MOD = Modulating boiler configuration NPV = Net Present Value (k€)
S = Surface of dispersing envelope (m2)
SG = Single glazing
SHGC = Solar heat gain coefficient STD = Standard boiler configuration TH = Triple glazing with high SHGC TL = Triple glazing with low SHGC V = Conditioned volume (m3)
ACKNOWLEDGEMENT
The authors would like to thank the Autonomous Province of Bozen-Bolzano for the financial support in the framework of the project TimBeest.
REFERENCES
ASHRAE. 2013. ANSI/ASHRAE/IESNA Standard 90.1, Energy standard for buildings except low-rise residential buildings. Atlanta, U.S.
Boland, J., Ridley, B., Brown, B. 2008. Models of diffuse solar radiation. Renewable Energy, 33: 575–584.
Bugler, J.W. 1977. The determination of hourly insolation on an inclined plane using a diffuse irradiance model based on hourly measured global horizontal insolation. Solar Energy, 19(5):477 – 491.
CEN European Committee for Standardization. 1999.
EN 12207, Windows and doors. Air permeability – classification, Brussels, Belgium.
CEN European Committee for Standardization. 2007a. EN 15242, Ventilation for buildings –
calculation method for the determination of air flow rates in buildings including infiltration,
Brussels, Belgium.
CEN European Committee for Standardization. 2007b. EN 15459, Energy performance of
buildings - Economic evaluation procedure for energy systems in buildings, Brussels, Belgium.
Chendo, M.A.C., Maduekwe, A.L. 1994. Hourly global and diffuse radiation of Lagos, Nigeria - correlation with some atmospheric parameters. Solar Energy, 52(3):247–251.
Deb, K., Pratap, A., Agarwal, S. 2002. A Fast and Elitist Multi-objectives Genetic Algorithm: NSGA-II, IEE Transactions on Evolutionary Computation, 6(2):182-197.
Erbs, D.G., Klein, S.A., Duffie, J.A. 1982. Estimation of the diffuse radiation fraction for hourly, daily and monthly-average global radiation. Solar Energy, 28(4): 293–302.
European Commission. 2010. Directive 2010/31/EU
of the European Parliament and of the council of 19 may 2010 on the energy performance of buildings (recast), Official Journal of European
Union 153: 13 – 35.
European Commission. 2012. Commission delegated
regulation (EU) No 244/2012 of 16 January 2012.
Official Journal of European Union L81/18. European Commission. 2014. DG Energy. 2014
Technical Guidance, Financing the energy renovation of buildings with cohesion policy funding. Brussels: European Commission, DG
Energy.
Klucher, T. M. 1979. Evaluation of models to predict insolation on tilted surfaces. Solar Energy, 23(2): 111–114.
Ihm, P., Krarti, M. 2012. Design optimization of
energy efficient residential buildings in Tunisia,
Building and Environment, 58: 81-90.
Italian Parliament. 1976. Law 373 Norme per il
contenimento del consume energatico per usi termici negli edifici.
Italian Parliament. 1991. Law 10, Norme per
l’attuazione del piano energetico nazionale in materia di uso nazionale dell’energia, di risparmio energetico e di sviluppo delle fonti rinnovabili di energia.
Liu, B.Y.H., Jordan, R.C. 1960. The interrelationship and characteristic distribution of direct, diffuse and total solar radiation. Solar Energy, 4(3):1–19.
Ma, C.C.Y., Iqbal, M. 1983. Statistical comparison of models for estimating solar radiation on inclined surfaces. Solar Energy, 31(3):313–317.
Maxwell, E.L. 1987. A quasi-physical model for converting hourly global horizontal to direct normal insolation. Technical Report of Solar Energy Research Institute, SERI/TR-215-3087. Muneer, T., Younes, S. 2006. The all-sky
meteorological radiation model: proposed improvements. Applied Energy, 83(5):436–450. Muneer T. 2007. Solar radiation and daylight models.
Oxford, Butterworth-Heinemann.
Orgill, J.F., Hollands, K.G.T. 1977. Correlation equation for hourly diffuse radiation on a horizontal surface. Solar Energy, 19(4): 357 – 359.
Penna, P., Prada, A., Cappelletti, F., Gasparella, A. 2015. Multi-objectives optimization of Energy Efficiency Measures in existing buildings. Energy and Buildings, 95:57–69.
Perez, R.R., Ineichen, P., Maxwell, E.L. 1992. Dynamic global-to-direct irradiance conversion models. ASHRAE Transactions, 98(1): 354-369. Perez, R.R., Ineichen, P., Seals, R. 1990. Modeling daylight availability and irradiance components from direct and global irradiance. Solar Energy, 44(5):271–289.
Pernigotto, G., Prada, A. Gasparella, A., Hensen, J.L.M. 2014. Development of sets of simplified building models for building simulation. Proc. of 3rd International High Performance Buildings Conference, Purdue, U.S., p. 1–10.
Prada, A., Pernigotto, G., Cappelletti, F., Gasparella, A., Hensen, J.L.M. 2014a. Robustness of multi-objective optimization of building refurbishment to suboptimal weather data. Proc. of 3rd Int. High Performance Building Conference, Purdue U.S. Prada, A., Pernigotto, G., Gasparella, A. Mahdavi, A.
2015. Combined effects of diffuse fraction and tilted surface radiation models, Proc. Of ECPPM 2014 - 10th European Conference on Product & Process Modelling, Vienna, Austria.
Wright, J., Alajmi, A. 2005. The robustness of genetic algorithms in solving unconstrained building optimization problems. Proc. of 9th Building Simulation, p. 1361-1368.