2021-02-23T15:30:47Z
Acceptance in OA@INAF
The AGILE Gamma-Ray observatory: software and pipelines
Title
BULGARELLI, ANDREA
Authors
10.1007/s10686-019-09644-w
DOI
http://hdl.handle.net/20.500.12386/30559
Handle
EXPERIMENTAL ASTRONOMY
Journal
48
Number
The AGILE Gamma-Ray Observatory: software and
pipelines
Software management approach and lessons learned for the
next generation of high-energy observatories
Andrea Bulgarelli
Received: date / Accepted: date
Abstract In this paper is described the approach used to develop the software system of the AGILE γ-ray Observatory, from the definition phase to construc-tion, verification and calibration activities of the satellite, until operations for scientific observations. Flexible software architectures, effective software man-agement workflow, new algorithms (from payload simulators to reconstruction algorithms, from detection algorithms for Real-Time Analysis systems to the follow-up of science alerts in the multi-wavelength and multi-messenger con-text) and team management approaches are described. The approach followed by the AGILE Team in more than twenty years of work is a key element of the success of the AGILE Observatory, and the foundation for the involve-ment in new high-energy telescopes and observatories. Our legacy is not only in experience and tools but also in lesson learned, that are described in this work.
Keywords observatory · data acquisition · gamma-ray PACS 07.05.Hd · 07.05.Kf · 95.55.Ka
1 Introduction
AGILE, the Italian satellite for the exploration of the γ-ray sky, was launched on April 23, 2007, from the Indian space base of Sriharikota with a very pre-cise insertion in a 550 km high equatorial orbit. After a few hours, the first engineering data from the satellite confirmed the success of the launch and the first scientific data were received, processed and archived at the ASI Data Center (SSDC) and at the INAF scientific institutes. At the beginning of July A. Bulgarelli
INAF/OAS Bologna
Via Gobetti 93/3, Bologna (Italy) E-mail: [email protected]
2007 the scientific verification phase of the γ-ray telescope was completed: AGILE was performing nominally, and scientific observations started. Imme-diately, the AGILE telescope detected the most brilliant sources (the pulsars Vela, Geminga and Crab, the most intense γ-ray sources in the AGILE energy band), but especially between 24 and 30 July, following the notification of other observatories, AGILE changed its pointing and began the observation of the blazar 3C 454.3. AGILE immediately recorded an intense emission of γ-rays . The flux of the source rapidly increased, and 3C 454.3 soon became one of the brightest sources of the γ-ray sky. An early version of an automated processing system allowed the AGILE Team to follow the phenomena during the observation, and the first Astronomer’s Telegram was issued immediately [Vercellone et al. (2007)]. This γ-ray flare immediately revealed to us all the ability of AGILE system to follow the variable phenomena in real-time. This experience was one of the main drivers for the development in the following years of the AGILE Real-Time Analysis (RTA), a software pipeline that analyse the AGILE data in real-time to detect γ-ray flares or GRBs from AGILE data or to react to external science alert from other instruments.
How was it possible for the AGILE Team to acquire and process data and to have an automatic data analysis system running immediately after the launch, considering that, together with the Italian space industry, until the day of the launch the team was involved in the construction and testing of the satellite? To understand the role of the software, and of his management, we must go back to the beginning of the AGILE project, and focus on three systems developed during the definition phases (a.k.a. A and B) and construc-tion phases (C and D) of a space mission, the have been reused during the operational phase E:
1. the P/L (Payload) simulators, that has enabled us to have a full data generation chain in the early phase of the project for the development of the entire software system for engineering and scientific verification activities (Sect. 4);
2. the assembly, integration and verification (AIV) software and its full reuse in the Ground Segment; (Sect. 5);
3. the Science Tools, for the scientific analysis of AGILE data (Sect. 6).
The instrument and the data flow are described in Sect. 2 and 3 respec-tively. Sect. 4 describes the P/L simulators and their role in the AGILE devel-opment workflow, Sect. 5 describes the AIV software and its complete reuse in the AGILE Ground Segment. Sect. 6 describes the reconstruction software and the Science Tools, the building blocks of the AGILE Real-Time Analysis, described in Sect. 7 together with the transient γ-ray sky follow-up strategy. Finally, Sect. 8 and Sect. 9 reports lesson learned and how our tools could be reused for future γ-ray observatories.
2 The instrument
AGILE (Astrorivelatore Gamma ad Immagini LEggero, Light Imager for Gamma-Ray Astrophysics) is a scientific mission of the Italian Space Agency (ASI) for γ-ray astrophysics [Tavani et al. 2009]. The AGILE payload detector consists
of a silicon tracker (ST) [Barbiellini et al. (2001), Prest et al. (2003), Bulgarelli et al. (2010), Cattaneo et al. (2011)] the SuperAGILE X-ray detector [Feroci et al. (2007)],
the CsI(Tl) Mini-Calorimeter (MCAL) [Labanti et al. (2009)], and an anti co-incidence system (ACS) [Perotti et al. (2006)]. The combination of ST, MCAL and ACS forms the Gamma-Ray Imaging Detector (GRID), for observations in the energy range 30 MeV-50 GeV. Accurate timing, positional and attitude information are provided by a precise positioning system (PPS) and the two star sensors (SS) units. The ST is the core of the AGILE-GRID, and it relies on the process of photon conversion into electron-positron pairs. It consists of a total of 12 trays, the first 10 of which consist by a tungsten converter followed by a pair of silicon microstrip detectors with strips orthogonal to each other, the last two consisting only of the silicon detectors. The γ-rays are converted in the tungsten layers, and a readout electronics acquire and process the data.
MCAL is composed of 30 CsI(Tl) scintillator bars each one 15 × 23 × 375 mm3
in size, arranged in two orthogonal layers, for a total thickness of 1.5 radi-ation lengths. The AC system is aimed at a very efficient charged particle background rejection; it surrounds all AGILE detectors (Super-AGILE, ST and MCAL). The AGILE-GRID event processing is operated by the payload data handling unit (PDHU) that provides onboard trigger logic algorithms [Argan et al. (2004)].
3 The data flow
AGILE scientific data (about 300 Mbit/orbit) are sent from the satellite to the ASI ground station in Malindi (Kenya) at every satellite passage (about 96 minutes) in telemetry data format [CCSDS (2000)] (a.k.a raw data format). A fast ASINET connection between Malindi and the Mission Operation Centre (MOC) at Fucino send the data to the Telespazio Satellite Control Center (SCC). The ASINET ensures every orbit the data communication between Fucino and the ASI Space Science Data Center (SSDC) where the AGILE Science Operation Center (SOC) is located. The AGILE MOC is located at Fucino and is operated by Telespazio with scientific and programmatic input by ASI and the AGILE Team through the SSDC.
Raw data are routinely archived at SOC and converted to a FITS format1
called LV1 (preprocessed data) through the AGILE Telemetry Preprocess-ing System (TMPPS) [Trifoglio et al. (2008)]. Auxiliary files (AUX, with information about orbits and attitude prevision) are also send to SOC. LV1 are converted in COR files, that give a temporal correction of LV1. Data are further processed to produce LV2, i.e. the EVT files (the photon list) and LOG
Ground Station (Malindi) Mission Operation Center (MOC) -Fucino (IT) Science Operation Center (SOC) - SSDC Rome (IT) ASINet INTELSAT (2 Mbps) AGILE (1 Mbps)
SCC Bologna (IT)INAF/OAS -
OHB Italia SpA - Milan (IT) LV0 LV1/COR AUX/LV2 LV0 LV0/AUX TMPPS (nominal) RECO (nominal) Quick-look Sci. Real-Time Analysis (backup)
TMPPS (backup) RECO (backup) Real-Time Analysis (nominal)
Fig. 1 Agile TM data flow. Every ∼ 96 minutes the satellite passes over the Malindi (Kenya) Ground Station. At each pass, the satellite telemetry is downlinked and forwarded in near real-time to the Mission Operations Centre (MOC) via INTELSAT. Telemetry is then transferred by the MOC Satellite Control Centre (SSC) to the AGILE Science Oper-ation Center (SOC) at the ASI Space Science Data Centre (SSDC, formerly ASDC) and then to the INAF/OAS Bologna site (formerly INAF/IASF Bologna). A backup chain from Telespazio to OHB Italia SpA (formerly Compagnia Generale dello Spazio (CGS)), Milan is also present. The main software systems are also listed in the white boxes and described in the text.
files that describe the status of the satellite. LV1 are transformed in LV2 at SOC by means of a reconstruction (RECO) system (see Sect. 6).
In the first version of the AGILE Real-Time Analysis the LV1 data was forwarded from SSDC to the INAF/OAS site where they were processed by AGILE Real-Time Analysis pipelines. With the second version of the AGILE Real-Time Analysis, the COR, AUX and LV2 data are forwarded from SSDC to the INAF/OAS site.
Scientific processing produces LV3 data, or sky maps, using the Science
Tools developed by the AGILE team (see Sect. 6). Scientific processing is
performed at both sites. A pipeline on AGILE-GRID data is developed at SOC for quick look monitoring and consolidated archive generation and is called Quick-Look Scientific pipeline (see Sect. 7.1.1 and [Pittori et al. 2013]). The rest of the AGILE Real-Time Analysis is developed at INAF/OAS Bologna site (see Sect. 7 for a full description of the first and second version of the AGILE-Real-Time Analysis). In the past, with the first version of the AGILE Real-Time Analysis, also the INAF/IAPS Rome site was involved in this data flow to analyse AGILE-SA data.
There is a backup chain that runs from Telespazio to OHB Italia SpA in Milan (formerly Compagnia Generale dello Spazio - CGS) and then to the INAF/OAS site, that is activated only when problems occur in the nominal flow chain and only after the Mission Director’s authorisation; the backup chain runs a backup version of the TMPPS and a simplified version of the reconstruction system from LV0 to LV2 that is used as input for the AGILE Real-Time Analysis. A backup system of the second version of the
AGILE Real-Time Analysis is also present at SOC and activated by the AGILE Team when there are problems at the Bologna’s site. Fig. 1 shows the data flow and the main systems.
A very important aspect of the AGILE software system is that the data for-mats (the hardware-driven satellite telemetry data format defined by CCSDS, and NASA/FITS data format widely recognised by the astrophysical commu-nity) and the internal data structure were defined in the initial phases of the project (before the start of the AIV phase), and since then they are not changed. The choice of data format and data structure at the beginning of the mission allowed the AGILE Team to develop and maintain the AGILE software system in an iterative and incremental way, with a development pro-cess lasted 20 years and still ongoing, where the data acquired in all mission phases or produced by simulators are accessible with all software versions. The NASA/FITS data format allows also the storing of the metadata information (data format evolution, software version used to produce the files) within the file headers, allowing to track changes in a simple way.
4 The role of the satellite simulators: GAMS and DHSIM
The construction of the AGILE satellite started in the late nineties. In the initial phases of each space mission the hardware is not available, and the effort is focused on the design of the instrument. To support this initial phase the AGILE Team have developed P/L simulators. One of the primary advantages of simulators is that they can provide scientists with practical feedback when designing real-world systems like a space segment of a γ-ray mission. This allows the scientists to determine the correctness and efficiency of a design before the system is constructed, and to support the construction phase, in particular, the verification of the P/L.
For these reasons, these simulators are critical components of the entire AGILE software system, not only because they are fundamental along the entire development process (from the instrument design to the verification and calibration phase), but also for the development of the software for AIV (see Sect. 5) and for the development of the reconstruction software (see Sect. 6).
For the AGILE space mission, we have developed two categories of satellite simulators, two Payload simulators (the new P/L simulator is described in Sect. 9.2.1) and a PDHU simulator.
4.1 The first AGILE Payload simulator: GAMS
During the definition phase and for the evaluation of the scientific perfor-mances a Monte Carlo simulator based on particles transport codes (e.g. the
Geant3 or Geant4 toolkit2) is needed to create a virtual model of the entire
high-energy space mission. In this way, we can simulate the interaction of the particles and photons inside the matter to optimise and understand the instrument.
The AGILE Payload Monte Carlo simulator developed in the early phase of the project, and still used, is called GAMS (Geant Agile Montecarlo Sim-ulator) [Longo et al. (2002), Cocco et al. (2002)]. By using a complete and detailed model of the AGILE instrument, the simulation of the interaction of γ-ray photons into the telescope was performed, together with the the onboard trigger logic, with in-depth optimisation study of trigger configuration for the cosmic γ-ray signals and the rejection of the particles and albedo-photon back-grounds in a 550 km equatorial orbit. Based on these studies, was also possible to define the fundamental parameters of the scientific instrument, i.e. the ef-fective area, the point spread function (PSF) and energy dispersion (EDP), that constitutes the instrument response functions (IRFs), and finally the sen-sitivity of the instrument [Chen et al. (2013)]. This was a first fundamental step in the construction of the AGILE instrument and for the definition of the trigger logic of the PDHU.
4.2 The Data Handling simulator: DHSIM
The GRID trigger logic for the acquisition of γ-ray photons and background rejection is very complex and is structured in two main levels: Level-1 and Level-2 trigger stages [Argan et al. (2004)]. An intermediate Level-1.5 stage is also envisioned, with the acquisition of the event topology based on the identification of chips (TAA1) that acquire the fired silicon strips. Both Level-1 and Level-Level-1.5 have a hardware-oriented veto logic providing a first cut of background events. Level-2 data processing includes a GRID readout and pre-processing cluster data acquisition. Level-2 pre-processing is asynchronous. A set of memory buffers and burst search algorithms are implemented to maximise data acquisition for transient γ-ray events (e.g., a GRBs) in the ST, Super-AGILE and MCAL, respectively.
To manage the high complexity of the onboard processing, the AGILE Team developed a PDHU simulator called Data Handling Simulator (DHSIM), a full simulator implemented in software [Argan et al. (2004)]. The main pur-poses of the DHSIM are (i) to prepare and test the telecommands sent to the P/L; the simulator verifies these commands before uploading them on the real PDHU, and (ii) to generate telemetry in LV1 data format as output of a simu-lated onboard data processing starting from GAMS Monte Carlo data. Thanks to this last feature, simulated and real data have the same data format: an essential feature for the next steps (see Fig. 2).
A dedicated database developed by the AGILE Team stores and manages the onboard configuration.
Science Console PDHU
P/L P/L sim
(GAMS) PDHU sim (DHSIM)
LV0 DISCoS
LV1 SC-QL
EGSE Processors
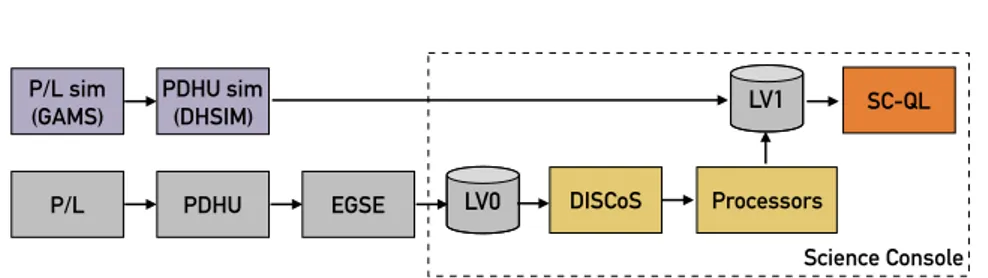
Fig. 2 The figure shows the workflow that includes the P/L, the P/L simulator (GAMS), the PDHU, the PDHU simulator (DHSIM) and the AIV Science Console. LV1 is the standard data format between the simulators and the real space segment. The EGSE is a tool to integrate and validate the electrical and communication interfaces of the P/L and provides an interface to the Science Console, a system that supports the science team and the industry during the construction phase. DISCoS and the processors are the Science Console Data Acquisition System, SC-QL is the on-line analysis quick-look used for the verification of the P/L.
4.3 The advantages of a full simulation chain
There are a lot of advantages if Monte Carlo and real data (i.e. data acquired from the PDHU) have the same structure (the LV1 data format), and if the common data format is also the final data format of the project. As already said, from Monte Carlo data it is possible to get LV1 format thanks to the use of the DHSIM. From LV1, the data processing follows the elaboration applied to real data. This is a fundamental feature for the development of the overall software system of the AGILE mission, in particular, this has speed-up and enabled
1. the development of the AIV software during the definition phase, because the interface of the AIV software is the real PDHU, but with the DHSIM was possible to start the development of the AIV software in the early phases (see Fig. 2);
2. the calibration of the AGILE P/L, to prepare the software before the cal-ibration campaign;
3. the development of the on-ground event filters [Bulgarelli et al. (2019)], aiming at the selection of events and to their classification;
4. the development of the Science Tools and the definition of the IRFs; 5. the development of the AGILE Real-Time Analysis pipelines.
For these reasons, a full simulation chain is the first pillar that has allowed the AGILE Team to be ready with the scientific Real-Time Analysis just after the launch. In Sect. 5 we analyse the second pillar: the strict collaboration between all AGILE Team members around a unique system, the AIV software, and its full reuse in the Ground Segment.
5 The AIV software and its evolution to the Ground Segment
In the context of the AGILE project an AIV a software framework called
Sci-ence Console (a.k.a. Instrument Workstation) [Trifoglio et al. (2000), Gianotti et al. (2001), Bulgarelli et al. (2003)], has been extensively used to support the assembly,
in-tegration and verification (AIV) activities carried out for the AGILE satellite, from unit to payload level, the calibration campaign (at the Frascati facil-ity in 2006), qualification campaign (during the period 2006 June-July and February-March, 2007 at the IABG facility in Munich (Germany)), launch campaign and in-orbit commissioning.
The Science Console (see Fig. 2) is a Linux workstation connected to the PDHU through an EGSE (Electric Ground Support Equipment) procured by industry. The EGSE is an essential tool which allows to integrate and validate the electrical and communication interfaces of the P/L during the construc-tion and launch phases and provides an interface to the Science Console. The main purpose of the Science Console is to support the science team and the industry during the various phases of the AIV of the satellite, providing a set of scientific-oriented tools that enable the analysis and the verification of the PDHU functionalities and P/L performances. Many Science Consoles has been developed during the AGILE construction phase, some specialised for specific instruments (e.g. the MCAL [Bulgarelli et al. (2004)]), a Science Console spe-cific for calibration [Cattaneo et al. (2011)], and the final science console for the entire P/L.
The Science Console Data Acquisition System (DISCoS, [Gianotti et al. (2001)], see Fig.2) receives the echo of the telemetry data and the telecommand data exchanged by the EGSE with the P/L, and processes, converts and archives the telemetry LV0 data into LV1 files thanks to software components called processors.
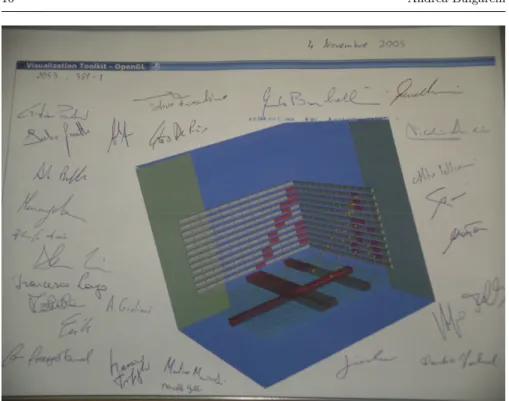
The LV1 archive generated by DISCoS system is the primary input for the Science Console Quick Look (SC-QL or QL) [Bulgarelli et al. (2008a)]. The SC-QL software performs the following functions: (i) to process and dis-play the scientific data coming from the AGILE instruments (as output of the PDHU) for engineering verification purposes (see Fig. 3); (2) to perform the health assessment of the detectors and the overall P/L by means of the housekeeping displays, and to provide a high-level view of the content of the scientific data; (3) to display the ratemeters of each instrument; (4) to check the correct status of the P/L in all the phases of the AGILE construction phase. One of the main features of the QL is its ability to work in real-time (i.e. during the data acquisition) and off-line (retrieving data from the archive); the real-time display of the data enabled the AGILE Team and the industrial partners to check the status and the health of all the subsystems of the AGILE satellite during the tests, and to stop the test immediately if something was malfunctioning.
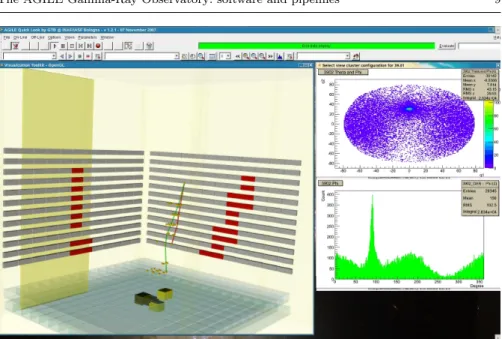
Fig. 3 On the left, a 3D view of the AGILE P/L that show the full topology of a single GRID event. The grey horizontal blocks are the Silicon Tracker chips not fired, the red horizontal blocks are the fired chips (a fired chip is a chip with one or more clusters of silicon strips that has passed the trigger level logic). The two tracks (red and green) are the converted electron and positron of the initial γ-ray ; the small yellow boxes are a 3D projection of the clusters on ST plans (not shown). On the bottom of the AGILE 3D view is shown the MCAL (cyan bars) and the hit on MCAL bars generated by the converted electron and positron (yellow blocks into the cyan bars - the gradient of this blocks is proportional to the energy deposit). Finally, the big yellow vertical box is a fired lateral panel of the AC system. On the right, in the first window an example of a 2D display, where is shown the real-time reconstructed direction θ, φ of electrons acquired during the calibration campaign in Frascati. In the second window only the reconstructed φ direction is shown.
5.1 The reuse of the AIV software at MOC and SOC
The AGILE Team, including the software developers, took an active part in the AGILE construction and calibration phases. In particular, the active par-ticipation of the software developer team in the AIV phase, and the strict col-laboration with the AGILE instrument, system and science teams allowed the AGILE Team to focus the effort around a single system, the Science Console, which grew with the experience of the team acquired during the construction phase (AIV, calibration, launch campaign and commissioning). In particular, the SC-QL included not only the necessary engineering checks, but also be-come a collector of advanced knowledge on some instruments (thanks to the close interaction between the instrument teams and the software developers), and algorithms of data reconstruction (thanks to the collaboration between software developers and science team, see Fig. 3 and Fig. 4).
Some members of the software developer team were also included in the AGILE system team, and this allowed daily participation of software
devel-Fig. 4 The first γ-ray photon acquired during the calibration campaign in Frascati in a 3D view of the AGILE P/L displayed by the SC-QL
opers in AIV operations in strict collaboration with the industries involved in the construction of AGILE, allowing developers to understand the instrument, the on-going testing activities and to adapt the SC-QL software according.
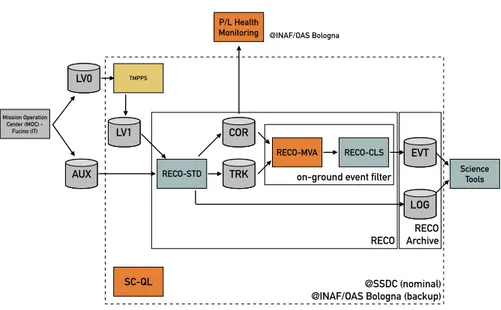
The flexibility of the SC-QL, that was part of its requirements and design (i.e. the system must be flexible to include new algorithms and an high level of customisation of the data checks and visualization). Even if the initial devel-opment of a highly flexible system required at more initial effort, this approach allowed maximising the effectiveness of the work performed during the con-struction phase, in which the AIV software became a fundamental part of the whole AGILE software system. For these reasons the knowledge included in this software system was not lost, but entirely reused in the Ground Segment, at both MOC and SOC (see Fig. 5), i.e. during the operational phase. This has allowed maximising the reuse of code, and to preserve the knowledge learned during the AIV campaign.
The SC-QL is used in the AGILE Ground Segment in different ways. The QL (i) was the only validation tool for the P/L, also used during the in-flight commissioning phase. A version of the QL is always available in SSDC and used in case of problems at the P/L during the operational phase; (ii) the QL was converted into a web application that is officially released to Telespazio at MOC, for the daily control of the state of the P/L (the P/L Health Monitoring); (iii) the QL is one component of the on-ground event filters,
on-ground event filter
@SSDC (nominal) @INAF/OAS Bologna (backup)
RECO LV1 RECO-MVA RECO-STD LOG EVT Science Tools COR AUX TMPPS TRK P/L Health
Monitoring @INAF/OAS Bologna
SC-QL RECO-CLS LV0 Mission Operation Center (MOC) -Fucino (IT) RECO Archive
Fig. 5 The workflow from LV0 to LV3 and the relationship with the AIV soft-ware. Yellow and orange boxes are software derived or reused from the AIV software. TMPPS runs at SOC in SSDC and the P/L Health monitoring is used by MOC people to check the status of the P/L. The RECO system (RECO-STD and on-ground event filter) and the Science Tools are the core of the AGILE Science Alert System and of the Quick-Look Scientific pipeline and runs in two sites: at INAF/OAS Bologna site and at SOC. RECO Archive stores LV2 files, that can be downloaded from SSDC website. TRK files contain the re-constructed incident direction and energy of the events in the AGILE-GRID reference system. The Science Tools, which are publicly available from the AG-ILE website at SSDC, can be also downloaded and run on single-user machines. A version of the SC-QL is available in SSDC and used in case of P/L problems.
the RECO-MVA that generates the information used as input to the machine learning algorithms developed for this task (see Sect. 6).
The DISCoS system and processors, which converts LV0 telemetry into LV1, was completely reused in AGILE’s Ground Segment, becoming the TMPPS [Trifoglio et al. (2008)]: this system archives each telemetry LV0 files and sorts its packets into one stream for each layout. At each pass in Malindi, the LV0 is received at MOC, through the TCP/IP protocol, and is ingested into the SOC, where the TMPPS runs. Each stream is processed in parallel in order to unpack the various telemetry fields. Each operation is tracked into a MySQL
database3 which interfaces the TMPPS pipeline to the scientific pipeline
run-ning at SOC.
6 The third pillar: the Reconstruction software and the Science Tools
The development of the P/L simulators has allowed the design of the P/L and also to provide the inputs for the development of many software components of the AGILE software system, in particular the AIV software. The third pillar of the operational phase is undoubtedly the reconstruction software and the Science Tools (the last one developed at INAF/IASF Milano along with some components of the reconstruction pipeline).
6.1 The reconstruction software and the machine learning
The reconstruction software (a.k.a. RECO) is compound of the standard analy-sis (RECO-STD) and the on-ground event filter (see Fig 5). The standard analysis has the following components:
1. COR processors, providing a timing correction of LV1 files;
2. track reconstruction algorithm, used for energy estimation and event direc-tion reconstrucdirec-tion, is carried out by an AGILE-GRID specific implemen-tation of the Kalman Filter technique [Giuliani et al. (2006)] and provides the incident direction and the energy of the events in the AGILE-GRID reference system, that are saved in the TRK file format;
3. LOG event generator, to produce LOG files containing all the spacecraft information relevant to the computation of the effective exposure and good time interval) (GTI).
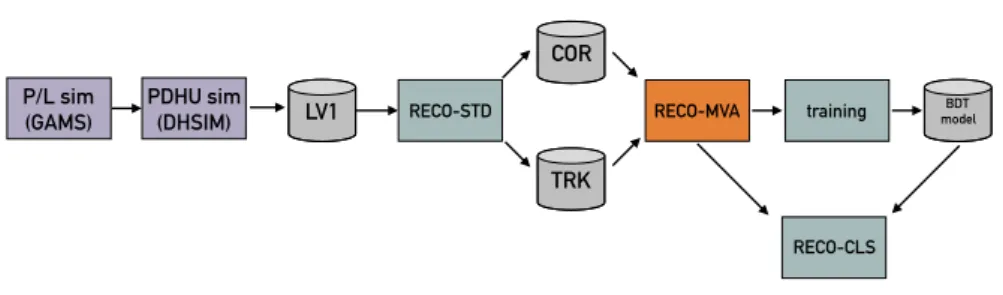
The AGILE-GRID on-ground event filter [Bulgarelli et al. (2019)] as-signs a classification flag to each event acquired by the GRID instrument de-pending on whether it is recognised as a γ-ray event (gamma), a charged par-ticle (parpar-ticle), a single-track event (single), or an event of uncertain classifica-tion (limbo). The filter is compound of two main components: the RECO-MVA that generates the information used for the classifier, and the RECO-CLS, the classifier that is based on a machine learning technique called boosted deci-sion tree (BDT). BDT maximises the signal-to-background ratio, efficiently suppressing the background events and, in the meanwhile, keeping a high sig-nal detection efficiency. The selection is done on a majority vote on the result of several decision trees, which are all derived from the same training sam-ple by supplying different event weights during the training. A versione using Neural Networks has been also developed. These classifiers was tuned with two samples of Monte Carlo events (generated by GAMS and converted in LV1 by DHSIM, see Fig.6), the training sample, and then tested with an independent testing sample. The trained BDT become the ground event filter. Two on-ground event filters was developed: FT3ab and FM3.119, in addition to the F4 filter developed at INAF/IASF Milano and included in the FM3.119 filter. The FM3.119 is the currently used on-ground background event filter for the scientific analysis of the AGILE-GRID data. FM3.119 is an evolution
P/L sim
(GAMS) PDHU sim (DHSIM) LV1 RECO-STD
COR TRK RECO-MVA training RECO-CLS BDT model
Fig. 6 The workflow of the development of the on-ground event filters. The data to perform the training with machine learning techniques are generated as Monte Carlo events with GAMS and converted in LV1 with the DHSIM. The RECO-STD prepares the data as input for the training of the BDT method. The trained BDT become the on-ground event filter. The RECO-MVA is derived from the SC-QL, and prepare the data for machine learning algorithms. RECO-CLS is the classifier that takes as input an already trained BDT model.
of the FT3ab, where 182 descriptor parameters of the interacting event inside the AGILE-GRID has been defined, and a subset of 57 of them have been selected as the most effective input variables for optimising the event separa-tion, also using the previously developed F4 on-ground background event filter optimised for a good pattern recognition of a sub-class of γ-ray events.
Finally, the event direction in sky coordinates is reconstructed and reported in the AGILE event files (EVT), excluding events flagged as charged back-ground particles. The Level-2 (LV2) archive of LOG and EVT files is then produced.
6.2 The Science Tools
The AGILE Science Tools [Chen et al. (2019)] are the tools necessary to anal-yse AGILE data starting from LOG and EVT files (LV2). They provide a way to generate counts, exposure and diffuse emission maps (LV3) that are used as input for the binned maximum likelihood estimator (MLE). The anal-ysis depends on the isotropic and Galactic diffuse emission, the γ-ray photon statistics, the Instrument Response Functions (IRFs). IRFs are matrices that characterise the effective area (Aeff), the Point Spread Function (PSF), and the energy dispersion probability (EDP), that depend on the direction of the incoming γ-ray in instrument coordinates, its energy and on the on-ground event filter. The result of the MLE is an evaluation of the presence of one or more point-like sources in the sky maps [Bulgarelli et al. (2012a)]: this is the essential step for the scientific results of AGILE.
Table 1 reports the list of internal and publicly released Science Tools. Table 2 reports the list of internal and publicly released IRFs with compatible Science Tools. With the last version of the Science Tools AGILE SW 6.0 a new diffuse Galactic emission model, optimised in particular for the Galactic central region, has been released. Until 2015 the concurrent version system
was CVS4, currently a git system5 hosted on github.com is used and also the
development version of the AGILE Science Tools is publicly available6.
Science Tools, IRFs and Galactic emission model are publicly available
from the AGILE website at SSDC7. A full description and characterisation of
the last release of the Science Tools is available in [Bulgarelli et al. (2019)].
Table 1 Science Tools releases. The first column reports the official and public version; the second column indicates the internal tag of the AGILE code repository system (report in the third column), the fourth column reports the release date and last column a short description of the main changes.
Public Version Internal tag Repository Date Description
AGILE SW 3.0 BUILD18 CVS May 21, 2009
First MLE multi-source analysis.
AGILE SW 4.0 BUILD19 CVS Oct 10, 2009
Performance optimisation. Bug correction.
AGILE SW 5.0 BUILD20 CVS Nov 22, 2011 TS map.
Internal BUILD21 CVS May 21, 2013
Performance optimisation. Bug correction.
Internal BUILD22 CVS June 25, 2015
Performance optimisation. Bug correction.
Internal BUILD23 github.com Dec 22, 2015 Analysis of extended sources.
Internal BUILD24 github.com Apr 19, 2016
Aperture photometry. Performance optimisation.
Bug correction.
AGILE SW 6.0 BUILD25 github.com Mar 15, 2019
Performance optimisation. Wavelet analysis.
GRB search. Blind search of γ-ray excesses.
Multi-spectral analysis with MLE. EDP correction.
6.3 From construction phase to operations
In the last sections we have described the approach used for the development of the AGILE software system during the construction phase. In particular, some design choice played a fundamental role: the early decision of the final data model and format, the development of the P/L simulators, the AIV software and its full reuse in the Ground Segment, the organisation of the AGILE Team during the construction phase, the reconstruction software and the Science Tools. These elements allowed the AGILE Team to have an automatic scientific data analysis system running immediately after the launch, an early version
4 https://savannah.nongnu.org/projects/cvs 5 https://git-scm.com
6 https://github.com/AGILESCIENCE/AGILE-GRID-ScienceTools-Setup 7 http://agile.ssdc.asi.it
Table 2 IRF releases. The IRFs I0023 analysed in [Chen et al. (2013)] are the same as I0025 but compatible with the last release of the Science Tools for energy dispersion inclusion. H0025 are equal to I0025, except for a different boundary of two energy channels: we have 100 – 400 MeV, 400 – 1000 MeV in I0023 and I0025, and 100 – 300 MeV, 300 – 1000 MeV in H0025. Earlier versions (I0007/I0010) of the PSF matrices used histograms taken directly from the Monte Carlo simulations. The updated PSF matrices contain values derived from a fit to the Monte Carlo data using a modified King function.
IRF version I0007 I0010 I0023 I0025 H0025
Public release May 21, 2009 Internal Nov 22, 2011 Mar 15, 2019 Mar 15, 2019
Compatible Science Tools release AGILE SW 3.0 AGILE SW 4.0 AGILE SW 5.0 AGILE SW 3.0 AGILE SW 4.0 AGILE SW 5.0 AGILE SW 3.0 AGILE SW 4.0
AGILE SW 5.0 AGILE SW 6.0 AGILE SW 6.0
PSF binned directly
from MC histograms X X X -
-PSF binned from
fit to King function - - X X X
of the AGILE Real-Time Analysis (RTA), a software pipeline that analyse the AGILE data in real-time to detect γ-ray flares or GRBs from AGILE data and to react to external science alert from other instruments.
Most of these components come from the AIV software, with some addi-tional RECO and Science Tools components, but the RTA is not just a set of software tools organised around a flexible software architecture, it is also a set of procedures, ideas and people that have allowed the AGILE Observatory to be a protagonist of the multi-messenger and multi-wavelength astronomy.
In the following sections is described how the AGILE Team has faced the continuous challenge made of fundamental scientific discoveries that caused changes in scientific scenarios and mission configuration.
7 The AGILE Real-Time Analysis and the transient sky
To understand the variability of the γ-ray sky is necessary to follow the sky in real-time, to notify the astrophysical community as soon as possible if some-thing of new occurs in the sky, e.g. a new γ-ray flare. Only a coordination, also
achieved through the publication of so-called Astronomer’s Telegrams8or
no-tice or circulars to the Gamma-ray Coordinates Network (GCN)9, allows the
astrophysical community to follow these phenomena when they occur, to better understand the nature and the behaviour of known and unknown astrophysi-cal sources; this is the ”observational” part of the so-astrophysi-called multi-wavelength and multi-messenger astronomy.
In this context, quick reaction time allow focusing on transient events de-tected by AGILE in the MeV-GeV energy range. Serendipity transient discov-eries during the AGILE observations is possible given the large field of view
8 http://www.astronomerstelegram.org 9 https://gcn.gsfc.nasa.gov
and AGILE sensitivity. The search for γ-ray transients (of Galactic and extra-galactic at time scales from hours to days, or Gamma-Ray Bursts (GRBs)) is one of the major activities performed by the AGILE Team, with a monitoring program active daily since the beginning of the mission, with a dedicated alert system that is implemented within the AGILE Ground Segment, distributed between SSDC and INAF/OAS Bologna and called the AGILE Real-Time Analysis (RTA).
The history of the AGILE monitoring program could be divided into two parts. The first part (2007-2015, see Sect. 7.1) was devoted in searching for γ-ray transients (Galactic and extragalactic) detectable on timescales of 1-2 days in the AGILE-GRID data (with a Flare Advocate team dedicated to follow the science alerts generated by the Real-Time Analysis system and to publish Astronomer’s Telegrams), and to search GRBs detected by MCAL and SA (with a GRB team devoted to issue GCN notices or circulars).
The second part of this history started in 2015 (see Sect. 7.2), with the first direct observation of a gravitational wave, made on September 14, 2015, by the LIGO and Virgo collaborations and announced on February 11, 2016. ICECUBE experiment started to send notices via the GCN network in 2016; this has opened a new scientific context also for the AGILE Team: additional efforts have been required to move our pipelines in the context of the multi-messenger astronomy.
The first version of the AGILE Real-Time Analysis, in operation until 2016, is described in Sect. 7.1. The current version of the AGILE Real-Time Analysis, used in the multi-messenger context, is described in 7.2.
7.1 The AGILE Real-Time Analysis first version: the variabile sky in the multi-wavelength context
7.1.1 The AGILE-GRIDpipelines
After the launch the AGILE Team began to develop the first system of data analysis in real-time, with the various components described in the previous sections.
Two automatic alert generation systems for analysing AGILE-GRID scien-tific data was created [Bulgarelli et al. 2014]: these systems perform the same operations as humans do, with the same software, and start whenever new data arrives, and decide if there is a γ-ray flare and then alert the team. Why two automatic analysis systems? Given the scientific importance of the sky in real-time, two groups of the AGILE Team took up the challenge and created two systems in a completely independent way. the first at the INAF/IASF Bologna (now INAF/OAS), the second at the ASDC data centre in Rome (now SSDC). The two solutions were very different, even if the software components used was the same.
The first alert generation system, at INAF/OAS Bologna, called AGILE-GRID Science Alert System [Bulgarelli et al. 2014], maximises the speed
of reaction, even at the cost of losing something on the data quality, and starts immediately as new data arrives (every 96 minutes), generating alerts in near real-time. In the Bologna’s pipeline the search for candidate transient Galactic sources in daily AGILE-GRID maps is carried out with two statis-tical methods: (i) blind-search ( the first version of the system was called SPOT4) based on counts excesses search and on the MLE multi-source anal-ysis [Bulgarelli et al. (2012a)] of the Science Tools; (ii) false discovery rate (FDR) method in source detection, that selects candidate sources with an
FDR of 10−3 [Sabatini et al. (2010)] or less. The current version of the
sys-tem is called SPOT6 and is in operation since 2016 (based on the BUILD24 of the Science Tools), with an update in 2019 (called SPOT6b) to integrate the new BUILD25 of the Science Tools (see Sect. 6.2).
The second alert generation system, in SSDC, called Quick-Look Scien-tific pipeline [Pittori et al. 2013], maximises data quality, and for this reason, it performs a more in-depth analysis, twice a day. The procedure uses a more complete data set to consolidate the data and is necessarily slower, as it is nec-essary to wait for the following orbit to generate an output because the data to reconstruct the last minutes of the satellite pointing direction are contained in the next orbit. After the generation of sky maps, a blind search based on counts maps and a MLE analysis runs. The results are distributed twice a day. The two automatic alert generation systems were put into place in a few months, first in Bologna starting from September 2007 and then, shortly, in Rome at SSDC. From 2008 the two systems send the results by e-mail. Al-though apparently it would seem a duplication of effort, from this challenge a synergy came out, with the common goal of following the sky in real-time: the two systems allow independent cross-checking, thus maximising the scien-tific return of AGILE. Once an alert has been generated, the Flare Advocate team works to confirm the results before publishing an Astronomer’s Tele-gram. Having two different alert generation systems running in two different locations allows the AGILE Team to have a geographically distributed system to increase the availability if one of the two sites goes off-line.
At the start of the new automatic AGILE-GRID Science Alert System in Bologna, in September 2007 automated science alerts were generated from the Crab nebula region: a γ-ray flare from the Crab Nebula was detected for the first time. Seeing a variable behaviour from this source was so strange that the only possible hypothesis was that the new automatic system was wrong. The team spent a lot of time checking the automated system but finding nothing. The system restarted, leaving this doubt open, but in the 1AGL Catalog [Pittori et al. 2009] it was pointed out that the average flux of the Crab Nebula was higher than expected. Even if not publicly announced, this is the first detection of a γ-ray flare from the Crab Nebula ever seen.
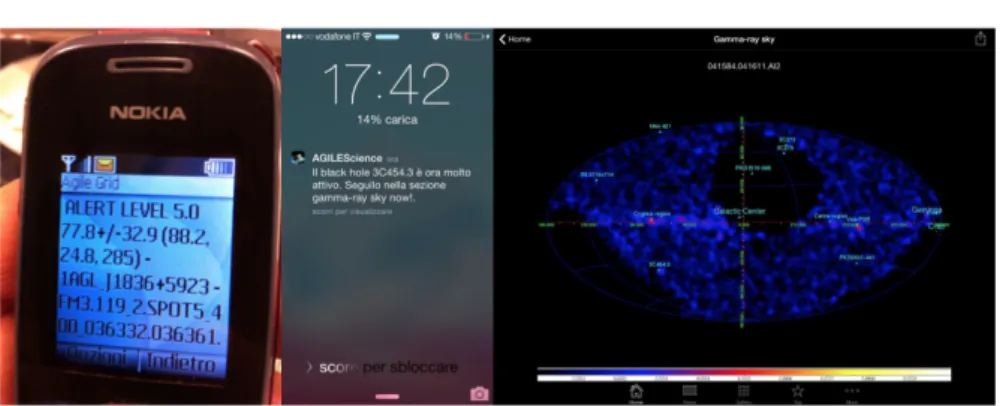
In the second half of 2008 to the Bologna system was added the possibility to send alerts via text messages (SMS) on the mobile phones (see Fig. 8) (in those days, smartphones did not yet exist).
Since 2007 the two AGILE-GRID pipelines are working without interrup-tion. Almost every week new possible γ-ray flares are found. Throughout 12
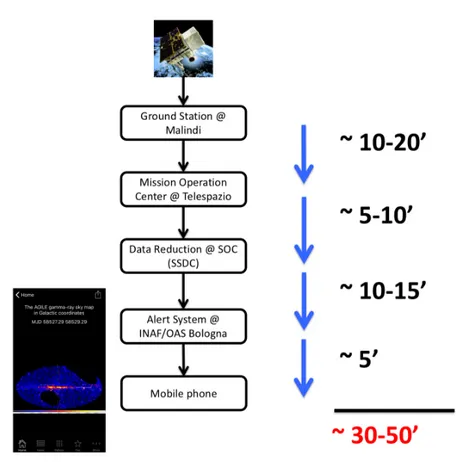
Fig. 7 Data transfer time of the Ground Segment from the AGILE satellite to science alerts to mobile phones and to the AGILEScience App.
years of activity (at the time of writing), more than 140 astronomical tele-grams have been published, but cross-checks have been made on alerts at least 4-5 times higher.
The response time of the system was fundamental. The generation of alerts in 30-50 minutes after the ground contact is an absolute record for γ-ray mis-sions of this type. All this is possible thanks to the flexibility of the AGILE Ground Segment. Fig. 7 shows the transfer time of the Ground Segment from the AGILE satellite to science alerts to mobile phones and to the AGILE-Science App. This data transfer time is the result of an optimisation of the data flow performed by SSDC in 2016. Before this optimisation, the response time was around 110-150 minutes.
Fig. 8 From text messages (SMS) to push notifications and to γ-ray sky maps on the tablets and Apps. Over the last few years, mobile technology has evolved and has changed the way we work and live. This evolution has been used to maximise the scientific return of AGILE.
7.1.2 The Flare Advocate team and the App AGILEscience: science on the road
The introduction of smartphones and tablets (the first iPad was presented in 2010) quickly changed the approach to mobile technologies. The interactivity allowed by these technologies makes it possible to move some of the activities carried out by the Flare Advocates to mobile devices. In 2009 we added the possibility to see the γ-ray sky maps in real-time on smartphones, allowing scientists to have an immediate view of what is happening in the sky.
However, the big step to the AGILE Team to mobile computing was in
2011: we decided to develop the AGILEScience App for Apple10,11and
An-droid12mobile platforms, thanks also to the help of the University of Modena
Reggio Emilia. The App13 not only provides information, photos, videos
and updates on the AGILE mission, but the primary purpose was to give all astronomy enthusiasts the chance to follow the γ-ray sky in real-time; the App shows the γ-ray sky map of our Universe as seen by AGILE-GRID, and updated every orbit. The Flare Advocates also use this feature. To achieve this goal, the App has been connected to the Bologna AGILE-GRID Science Alert System and subsequently, in 2013, to the SSDC system for data quality checks.
In 2014 our App allowed the astronomy enthusiasts to follow, for the first time, the evolution of the 3C54.3’s super-flare through push notifications (see Figure 8).
In 2015 we added a unique feature among all high-energy instrument: the possibility to perform a full scientific analysis with real-time data using only the App. This allows the Flare Advocate team to perform what we call,
”sci-10 https://itunes.apple.com/it/app/agilescience/id587328264?mt=8 11 https://itunes.apple.com/it/app/agilescience-for-ipad/id690462286?mt=8 12 https://play.google.com/store/apps/details?id=com.agile.science 13 http://www.agilescienceapp.it/wp/agilescienceen/
Fig. 9 ”Science on the road” with the AGILEScience App. From left to right: (i) the Flare Advocate can check the γ-ray sky. If a candidate γ-ray flare is found it is possible to perform a manual scientific analysis to confirm the result. To perform the scientific analysis, (ii) the Flare Advocate goes in the ”Scientific Analysis” section, (iii) where is possible to create a new analysis or select an existing one, (iv) some parameters of the analysis must be inserted (e.g. integration time, position in the sky), and (v) the App shows the final result, analysed with the Maximum Likelihood Estimator, and the sky maps.
ence on the road”, i.e. possibility to check the results of the AGILE-GRID Science Alert System, the possibility to receive important science alert via push notification, and finally, the possibility to perform a scientific analysis for the confirmation of the results before publishing an Astronomer’s Tele-gram, everything using only the App (see Fig. 9). This significantly decreased the reaction time of the AGILE Team in the context of the multi-wavelength astronomy.
7.1.3 The AGILE GRB WebMon: GRID, MCAL and SA GRB alert pipelines The AGILE-GRID Science Alert System pipeline was not alone. Other three pipeline focused on GRB detection was developed and integrated into a unique web interface [Bulgarelli et al. (2008b), Trifoglio et al. (2013)]:
1. the SuperAGILE (SA) Alert Pipeline runs at INAF/IASF Roma to search for GRBs, X-ray bursts and other transients in the hard X-ray band [Feroci et al. (2007)]. The SuperAGILE ground software is equipped with a ground trigger running on timescales from 512 ms up to 16384 ms using the scientific ratemeters and taking advantage of the segmentation of the SuperAGILE detector. A weak-up system is also present to alert the SA team if a GRB was found. The system was able to generate GCN notices
14 ;
2. the MCAL Alert Pipeline [Marisaldi at al. (2008a), Marisaldi at al. (2008b)] runs at INAF/IASF Bologna and processes the data of the MCAL burst chain in order to identify valid burst on-board triggers and to search for both cosmic GRBs and valid Terrestrial Gamma-ray Flashes (TGF) can-didates. For every trigger detected by the onboard logic the event data
are analysed to exclude instrumental triggers. Information on all on-board triggers is stored in a database that can be accessed from the Web for monitoring. In addition, on contact by contact basis, a ground trigger al-gorithm runs on scientific ratemeters to notify via e-mail the MCAL team for transients not recognised by the on-board logic;
3. a dispatcher task handles the Swift/BAT, INTEGRAL/IBIS, and Fermi/GBM Notices received from the GCN through a TCP/IP Internet socket and the GRB alerts generated via e-mail by the above SA and MCAL Pipelines. These results are sent to the GRID GRB pipeline;
4. the GRID GRB pipeline: in case the GRB is localised inside the GRID Field of view (FoV) by external instruments or by MCAL and SA, this task runs automated analysis in order to search for detection or provide an upper limit (UL) on the flux. The analysis results are e-mailed to the AGILE Team. The GRID GRB pipeline performs the GRB search in the AGILE data by comparing the expected background with the counts in the
first 60s, in a region of 15◦ of radius centred at the position of the burst.
The AGILE P/L Health Monitoring (see [Bulgarelli et al. (2008b)] for more details), already introduced in Sect. 5.1 is integrated into the same web inter-face with the MCAL and GRID GRB pipelines.
MCAL, SA and GRID GRB pipelines alerts the AGILE Team via e-mail and via SMS to mobile phones if transients or burst where detected. The system was distributed among the SOC at SSDC, and the AGILE Team Quick Look sites, located at INAF/OAS Bologna (P/L Health monitoring, MCAL and GRID GRB pipelines) and INAF/IASF Roma (SA pipelines).
The AGILE-GRID pipelines, the AGILE GRB WebMon, the P/L Health monitoring and the App AGILEscience was the first version of the AGILE Real-Time Analysis. Figure 10 shows the workflow and the general architecture of the pipelines.
7.1.4 The spinning mode: a new life for the AGILE Observatory
October 18, 2009. One of the subsystems on board the AGILE spacecraft, the rotation wheel, suffered a malfunction that caused the satellite to leave its nominal pointing mode and switch to the spinning control mode. The spin-ning control mode guarantees the safety of the Spacecraft and the Payload. The work performed by the AGILE Team and by the space industries in-volved in AGILE to reconfigure the space mission was very difficult, but after some weeks, on November 4, 2009, at 12:25:54 the AGILE scientific operations restarted. From that day the instrument is operating nominally, and all de-tectors are on and acquiring data. The satellite is working in a safe spinning mode, with the fixed solar panels pointing towards the Sun and the GRID instrument FOV covering about 70% of the sky in one day. The satellite scans
the sky with an angular velocity of about 0.8◦s−1
The reorganisation of the on-ground software continued in the following months, and some GRB WebMon pipelines were switched off because it was no more possible to follow GRB with a rotating P/L.
@SSDC
@IAPS Rome
@IASF Bologna
Fermi, Swift, INTEGRAL
Alerts are received Reaction
AGILE-GRID Science Alert (SPOT4) RECO @Bologna MCAL Alert pipeline SA Alert pipeline EM dispatcher GRID GRB pipeline + web interface Fermi, Swift, INTEGRAL LV1 GCN AGILE P/L Health Monitoring RECO TMPPS Quick-Look Scientific Pipeline GCN EM RTA web interface
Fig. 10 The first version of the AGILE Real-Time Analysis workflow at INAF/OAS Bologna (formerly INAF/IASF), INAF/IAPS Rome and SSDC, in operation until 2016, with the LV1 data received from SSDC. Alerts are received from the GCN network. The AGILE-GRID Science Alert System (SPOT4) the AGILE-MCAL and SA Alert pipelines analyze new data as soon as is processed by RECO-STD, that perform the reconstruction of the data. The AGILE-GRID GRB pipeline reacts if there are GRBs notified by the GCN network or detected by SA and MCAL pipelines (via the dispatcher). A web GUI and the AGILEScience App show the results of some automated processing. Alerts are sent by email to the AGILE Team. The SA Alert pipelines run at INAF/IAPS Rome and has a wake-up system and was able to generate GCN notices.
However, it is thanks to this new configuration that the most important
discoveries of AGILE-GRID in the field of multi-wavelength astronomy
have been possible. The most important γ-ray flare in the AGILE history was the Crab Nebula flare of September 2010. When the morning of September 21st we begin to receive SMS and e-mails with a flare positionally consistent with the Crab region, we took the matter seriously, reminding the Septem-ber 2007 event. That day the whole AGILE Team was in a meeting in Rome, so we were all out of the office. The γ-ray flux of the Crab Nebula was pro-gressively increasing (following the sequence of alerts that were coming from the AGILE-GRID Science Alert System). This is one of those cases where ”mobile” technology has played a fundamental role: we followed the evolu-tion of the phenomenon on our smartphones and checked the γ-ray sky maps in real-time. During the meeting, some of us started to work on the data, and after the necessary cross-checks an Astronomer’s Telegram was published
Fig. 11 96’ sliding light curve (with two-day integration time) of the 2010 September Crab nebula flare as seen by the Bologna’s AGILE-GRID Science Alert System. Errors are 1σ, and time is given in MJD. The yellow lines show the average Crab flux and the 3σ uncertainty range. 1.a and 1.b (in orange) are, respectively, the detected flux and the time of the alert generation by the Bologna pipeline when Crab nebula reaches a flux level that exceeds 1σ the mean flux level; on the right are the counts map of 1.b as seen by Bologna pipeline. 2.a and 2.b (in red) are related to the maximum flux level reached; on the right are the counts map of 2.b as seen by Bologna pipeline. The green arrow indicates the time that the Astronomer’s Telegram was posted. More details in [Bulgarelli et al. 2014]
[Tavani et al. 2010]. After a few hours, the NASA Fermi satellite confirmed the results [Buehler et al., 2010]. For this discovery Marco Tavani and the AGILE Team was awarded in 2012 the Bruno Rossi Prize of the American Astronom-ical Society (AAS). Fig. 11 shows the sequence of events of the 2010’s Crab Nebula flare.
7.1.5 Data Warehouse for scientific discoveries: business logic for science Until 2012 the main focus of the software developers was the optimisation of the AGILE-GRID Science Alert System pipeline. Five years of results were available, and the access to this large amount of data was a problem.
New questions emerged: was it possible to archive the detection and scien-tific alerts generated by these systems and make them accessible for historical analysis? Was it possible to generate science alerts from a γ-ray source, taking into account the history of the source? To answer these questions, the most nat-ural evolution was to apply standard techniques of the enterprise world, such as Data Warehouses, to the scientific context. To manage the large amount of data and result generated by the AGILE-GRID Science Alert System, a
new system was and put in operation in 2015, called AGILE-GRID Data Warehouse System.
In computing, a data warehouse (DWH) is a software system used for
reporting and data analysis and is considered a core component of a decision support system. DWHs are central repositories of integrated data from one or more disparate sources. They archive current and historical data in one single place that are used for creating analytical reports. The primary input is a User Database, that is the input to build the Operational Database, a database designed to integrate data from multiple sources for cleaning, to ensure data quality before it is used in the DWH for reporting, and additional operations on the data (e.g. to discover relationship into the data). The integrated data of the operational database could be transformed to another database, the Data Warehouse Database, where the information is arranged into hierarchical groups (called dimensions, facts and aggregate facts) for a fast generation of the final reports.
This system ingests and clean the results of the AGILE-GRID Science Alert System in a MySQL server. For each detection, various information is stored in the User Database, to allow researchers to study the astrophysical phenomenon in real-time but also to carry out historical analyses. After being stored in the User Database, the data is aggregated and inserted into the Operational Database (i.e. the database feds with the data contained in the User Database) following a different scheme that enables the aggregation of detections into light curves (starting from the last detection imported into the User Database) allowing the correlation of the current detection with the historical data and enabling the identification of a science alert associated with a light curve: in this way a science alert is no longer a single detection above a certain threshold of significance, but becomes a complex system of heuristic rules that also take into account the historical evolution of the source and the region of the sky: a science alert is a concept built on top of a set of correlated detections.
An additional level of integration for sky regions and time has also been developed for the AGILE-GRID Data Warehouse System. It is of fundamental importance to reduce the computation time of the queries performed on a large amount of data and to do so we must rely on the specially designed Data Warehouse Database, where a higher level of aggregation is precomputed. The facts that have been chosen are a time aggregation level (by day, week, month or years) and a sky region aggregation level (using circular regions (called rings) centred on points defined by HEALPix (Hierarchical Equal Area isoLatitude Pixelisation) [G´orski et al.(2005)] tessellation with Nside32, 64 or
128.
A reporting system called ”Dashboard” was also developed. A Dashboard is a tool that usually allows to quickly view the essential information of a process or of the key performance indicators (KPIs), on dimensions useful for decision makers. In the scientific context, the KPIs are the trend of astrophys-ical sources, the significance of detection, a full view of the sky, the behaviour of some regions of the sky for historical analysis. With this tool, researchers
Fig. 12 An example of the use of the AGILE DWH. The first report is the interactive sky map of the last N hours (in the example, N=48), where each yellow or orange dots represent a detection (yellow, with detections in the range 3 − 4σ or orange, with detections in the range 4 − 5σ, red dots are science alerts. In this example of Nov 11, 2016, we can see that the science alert come from Galactic coordinates (l,b) = (77.4, -38.4), associated with the source CTA 102.
Fig. 13 An example of the use of the DWH. The second report shows the light curve associated with the science alerts generated by the CTA 102 position. Four of Astronomer’s Telegrams have been published.
can access the data contained both in the database and through their mobile devices, integrating this tool in their daily research activities. Fig. 12 and Fig. 13 report an example of the use of Data Warehouse.
7.2 The AGILE Real-Time Analysis second version: the multi-messenger astronomy
With the first direct observation of a gravitational wave (GW) announced by the LIGO/Virgo collaboration, the era of the multi-messenger astron-omy entered into a new phase and marked the onset of gravitational-wave astronomy [Branchesi et al. (2016)]. On August 17, 2017, the first gravita-tional wave event GW170817 observed with an electromagnetic counterpart marking a significant breakthrough for multi-messenger astronomy. The next step happened on September 22, 2017, when an extremely high-energy neu-trino event (IceCube-170922A) was recorded by the IceCube Collaboration which sent out an alert that prompted an extensive multi-wavelength cam-paign [Aartsen et al. (2018)].
A vital feature of the AGILE Observatory was the spinning mode configu-ration, described in Sect. 7.1.4. Thanks to this observing mode the capability of the AGILE satellite for the discovery of transients is unique: the current spinning configuration of the satellite, together with a large field of view and a good sensitivity provides coverage of 70% of the sky, with each position exposed for 100 seconds, 200 times a day. Thanks to this configuration, it im-mediately became evident that AGILE plays an important role in search of the γ-ray electromagnetic counterparts of gravitational waves, so the AGILE Team decided to evolve the AGILE Real-Time Analysis in a second version, to reacts to external GW or neutrino alerts.
To reorganise the AGILE pipelines, taking into account the new scientific requirements, the first step was a definition of the use cases and the workflow of the whole system, and connected with this a risk analysis was performed. Based on this analysis, and considering the existing software architecture, the software components that could be reused were selected, other parts refactored, and others developed from scratch. To speed up the process the team adopted
a development method based on Scrum, applying DevOps principles15, and
using an automation server16 and a release management process based on
containers17. The code is publicly available on the GitHub platform18.
After some months of intense development, the second version of the AG-ILE Real-Time Analysis with an automated search of γ-ray electromagnetic counterparts of a GW was ready in October 2016, just before the start of the O2 LIGO/Virgo run.
7.2.1 The software architecture
The software system RECO, running in SSDC has been optimised to reduce the processing time. Also thanks to this effort, the time needed to send the data to Bologna was further reduced, up to the 30-50 minutes. The Science
15 https://en.wikipedia.org/wiki/DevOps 16 https://jenkins.io
17 https://www.sylabs.io/
Tools have been subjected to an intense refactoring to speed up the analysis and to add new features. The BUILD25 is the current official release (see Sect. 6.2).
The parts left unchanged are the TMPPS, the P/L Health Monitoring system and the GRID Science Alert System: this because the AGILE-GRID Science Alert System does not react to external science alerts but looks for γ-ray flares when new data is available.
The components that were developed from scratch was the management of external science alerts (which replaced the dispatcher described in Sec. 7.1.3), to include also the LIGO/Virgo alerts (the gcndaemon), a two new wake-up systems (morfeo and hermes) that call the team when a GW alert is received [Zoli et al. (2016)], and a completely new and flexible system (called rta-sci) for the management of scientific analyses that perform scientific tasks automatically as soon as the data is available and in response to external alerts. A pipeline manager orchestrates the workflow, and the analyses are submitted
to a job scheduler (slurm19) and stored in a database (MySQL). New analysis
can be easily added thanks to this architecture.
Thanks to this new development the old GRID and MCAL GRB Alert Pipeline systems have been redeveloped, and integrated into the rta-sci system. The SA GRB Alert Pipeline system is currently used in manual mode.
In addition to the reaction the external science alerts, a new MCAL pipeline (AGILE-MCAL pipeline) that searches for GRB and TGF in MCAL data has been developed and integrated into the rta-sci. In the presence of a GRB
identified by MCAL an automated GCN notice is submitted20, also taking
into account any notice received in the meantime by other satellites. A sketch of the workflow is shown in Fig. 14.
A control room web page shows the status of the data acquisition, the delay on the data flow and some information about the data quality (provided by SSDC) and is used by the AGILE Team to evaluate the delay of the data with respect to a GRB/neutrino/Gravitational Wave events.
In this effort, the Graphical User Interface (GUI) has been updated with new web technologies, allowing access to the results of automatic processing. Also the AGILEScience App has been connected with the rta-sci system.
7.2.2 AGILE-GRID GRB and MCAL Pipeline
The AGILE-GRID GRB and MCAL pipelines react when new GRBs, neutri-nos or LIGO/Virgo events are notified through the GCN network, and a set of automated analysis on AGILE-GRID and MCAL data starts as soon as data are available. Also an MCAL GRB detection can trigger the pipelines of the AGILE Real-Time Analysis. A visibility prevision plot is produced immedi-ately and shows the prevision of the position of the Earth and the Sun with respect to the localisation error region in a sky map in AITOFF projection
19 https://slurm.schedmd.com/
@INAF/OAS Bologna GCN receiver GCN GW EM Neutrino IceCube Fermi, Swift, INTEGRAL, … LIGO/Virgo Morfeo Hermes rta-sci
Alerts are received Reaction
RTA web interface AGILE-GRID Science Alert (SPOT6) AGILE-MCAL pipeline RECO Archive AGILE-MCAL GRB pipeline AGILE-GRID GRB pipeline GCN AGILE P/L Health Monitoring @SSDC RECO TMPPS Quick-Look Scientific Pipeline wake-up system COR, LV2
Fig. 14 The second version of the AGILE Real-Time Analysis workflow at INAF/OAS Bologna, with the LV2 data received from SSDC. Alerts are received from the GCN network. Two independent wake-up systems call the AGILE Team if a new alert from LIGO/Virgo collaboration is received. If new alerts and or data are received, the rta-sci performs the required scientific analysis. The GRID, MCAL and SA GRB Alert pipeline react to external science alerts. The AGILE-GRID Science Alert System (SPOT6) and the AGILE-MCAL pipelines process new data as soon as is received from SSDC, that perform the reconstruction of the data. In the presence of a GRB identified by MCAL pipeline, an automated GCN notice is submitted to the GCN network.. A web GUI and the AGILEScience App show the results of the automated processing. A backup of the AGILE RTA is also running in SSDC.
and, as soon as the data is available, also a final visibility plot with real data is generated. In this final visibility plot, provided by SSDC, the field of view of AGILE-GRID and AGILE-SA is overlapped with the error localisation region.
A burst search algorithm on MCAL data runs on the following time win-dows: 5, 10, 100 and 1000s to find possible GRBs. On GRID data a burst search method that uses an algorithm reported in [Li and Ma (1983)] is performed to find candidate γ-ray emission in the energy range 50 MeV-10 GeV with the following time scales: 2, 5, 10 and 100 s. In parallel, counts and exposure maps on GRID data are produced with the same time scales, with overlapped the localisation error region. Automated evaluation of the AGILE-GRID and MCAL upper limits inside the localisation error region is performed.
Finally, the text of the MCAL and GRID circulars is automatically pro-duced and is checked by the AGILE Team before its publication as GCN Circulars.
7.2.3 Advocate team management
The software is only one aspect of the AGILE monitoring program. Effective management of the AGILE Flare and GW Advocate teams is mandatory. Key elements are:
1. people, on-duty and on-call that understand what they are doing and can analyse and understand the result of the automated pipelines and to perform manual analysis effectively;
2. data, in the shortest time and with the best data quality;
3. procedures, to understand what the advocate teams have to do and when, and a clear chain of responsibilities to publish scientific results;
4. software, of course, in particular, an effective Real-Time Analysis system with a high degree of availability, a clear and simple Graphical User Inter-face, and a high degree of flexibility to add or change the scientific analysis performed in an automated way.
An extended and in-depth definition of the procedure was performed before the development of the AGILE Real-Time Analysis pipelines and included in the software architecture; this has increased the effectiveness of the entire system.
8 Lesson learned
We report some lesson learned that could help the development of new data acquisition and analysis systems for both space and ground observatories. The following list is not ordered in any way, but only a collection of lessons learned from our experience, ranging from software management to team management and to data analysis.
1. define the data format and structure at the beginning of the project.
Software changes and evolves, but the definition of the data format allows the project to be able to access and analyse the data acquired in any phase of the project, from AIV to scientific operations.
2. develop P/L simulators at the beginning of the project: this is a fundamen-tal aspect of the entire project, that enable other developer and science teams to have inputs for their work at the beginning of the project; keep the simulators updated and under configuration control;
3. new ideas, new algorithms, new methods? The PI must support and be flexible enough to let people propose and try new solutions;
4. it is essential for all team members to have a general view of the Ob-servatory operations; this generates positive feedbacks that increase the knowledge of the Observatory.


![Table 2 IRF releases. The IRFs I0023 analysed in [Chen et al. (2013)] are the same as I0025 but compatible with the last release of the Science Tools for energy dispersion inclusion.](https://thumb-eu.123doks.com/thumbv2/123dokorg/8097127.124800/16.892.108.765.256.379/table-releases-analysed-compatible-release-science-dispersion-inclusion.webp)