A
A
l
l
m
m
a
a
M
M
a
a
t
t
e
e
r
r
S
S
t
t
u
u
d
d
i
i
o
o
r
r
u
u
m
m
–
–
U
U
n
n
i
i
v
v
e
e
r
r
s
s
i
i
t
t
à
à
d
d
i
i
B
B
o
o
l
l
o
o
g
g
n
n
a
a
DOTTORATO DI RICERCA IN
INGEGNERIA CHIMICA DELL’AMBIENTE E DELLA
SICUREZZA
Ciclo XXV
Settore Concorsuale di afferenza: 09/D2 Settore Scientifico disciplinare: IND-ING/24
CONFRONTO TRA SUPPORTI CROMATOGRAFICI DI AFFINITÀ
PER SEPARAZIONE DI PROTEINE
Presentata da: JOUCIANE DE SOUSA SILVA
Coordinatore Dottorato
Relatore
Prof.ssa Serena Bandini
Prof. Ing. Giulio Cesare Sarti
Correlatore
Dott. Ing. Cristiana Boi
Even mistaken hypotheses and theories are of use in leading to discoveries. This remark is true in all the sciences. The alchemists founded chemistry by pursuing chimerical problems and theories which are false. In physical science, which is more advanced than biology, we might still cite men of science who make great discoveries by relying on false theories. It seems, indeed, a necessary weakness of our mind to be able to reach truth only across a multitude of errors and obstacles.
Contents
Introduction ... 1
Chapter 1 – Affinity Chromatography ... 4
1.1. Introduction to Chromatography ... 4
1.2 Affinity chromatography ... 6
1.2.1 Chromatographic supports ... 9
1.2.2 Advantages and limitations of adsorbers ... 12
1.3. Langmuir model ... 14
Chapter 2 – Materials and methods ... 17
2.1. Introduction... 17
2.2 Ligand ... 19
2.3. Chromatographic supports ... 22
2.3.1. Resin ... 22
2.3.2. Membrane ... 23
2.3.2.1. Regenerated cellulose membranes ... 24
2.3.2.2. Membrane Sartobind® Epoxy ... 25
2.3.2.3. Membrane Sartobind® Aldehyde ... 26
2.3.3. Monoliths ... 23
2.4. Analytical methods ... 26
2.4.1.Proteinconcentratiob determination methods ... 29
2.4.1.1. UV adsorption ... 29
2.4.1.3. Electrophoresis ... 32
2.4.1.3.1. Experimental procedure ... 34
2.4.1.4. HPLC ... 36
2.4.2. Chromatographic apparatus ... 38
2.4.2.1. Qualitative description of chromatographic cycles ... 43
2.4.3. Elaboration of experimental data... 45
2.5. Buffers and protein ... 38
Chapter 3 – Affinity Membranes ... 49
3.1. Ligand immobilization ... 49 3.1.1. SartoE membranes ... 49 3.1.2. SartoA membranes ... 52 3.1.3. RC membranes ... 54 3.2. Ligand density ... 54 3.3. Ligand leakage ... 55
3.4. Results and discussion ... 55
3.4.1. Efficiency evaluation of the membrane modification procedure ... 55
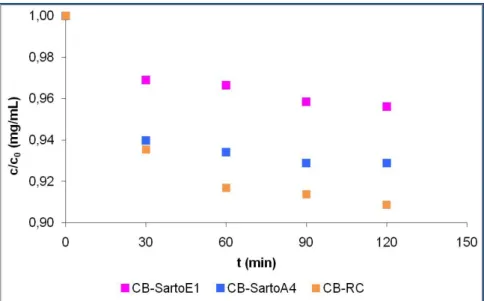
3.5. Characterization of the modified membranes with batch tests ... 60
3.5.1. Experimental results ... 61
3.5.1.1. Elution step ... 64
3.5.2 Dynamic experiments ... 67
Chapter 4 – Affinity Monoliths ... 78
4.2. CB-monoliths characterization through the separation of pure BSA
solution in batch system ... 83
4.3. Dynamic experiments ... 84
4.4. Results and discussion ... 86
4.4.1. Ligand immobilization ... 86
4.4.2. Batch tests ... 86
4.4.3. Dynamic experiments ... 89
Chapter 5 – Comparison of the affinity supports ... 94
5.1. Introduction... 94
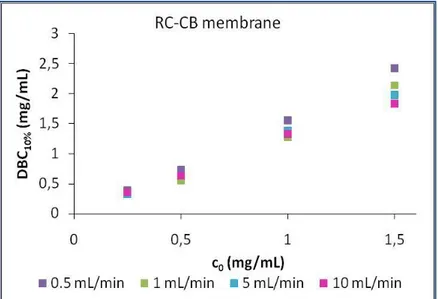
5.2. Dynamic binding capacity ... 94
5.2.1 Dynamic experiments with BSA solutions loaded until saturation ... 95
5.2.2. Dynamic experiments with BSA solutions loaded until 10% breakthrough ... 101
5.3. Productivity ... 106
5.4. Tests with bovine serum ... 109
Conclusions... 113
References ... 116
Appendix I ... 125
1
Introduction
Chromatography is the most widely used technique for high-resolution separation and analysis of proteins [1]. In chromatographic processes a solute mixture is introduced into a column containing a selective adsorbent, called stationary phase; the separation results from a different solute partition between the mobile phase and the fixed bed. This technique is very useful for the purification of delicate compounds, e.g. pharmaceuticals, because it is usually performed at milder conditions than separation processes typically used by chemical industry. In particular, affinity separation allows to obtain high purity products using an economic process, for this reason the research of new stationary phases and techniques is stimulated.
Many different types of chromatographic techniques are used in biotechnology, due to several possible interaction mechanisms (such as electrostatic, hydrophobic, and others) that occur between proteins and stationary phases. This thesis focuses on affinity chromatography, this technique is based on specific reversible complexes formation between the molecules to purified and the ligand bound on a suitable insoluble support.
Chromatographic processes are traditionally performed using columns packed with porous resins; these media have a high binding capacity, because of the high specific surface area due to the network of intraparticle pores present in the beads. However, these supports have several limitations, including the dependence on intra-particle diffusion, a slow mass transfer mechanism, for the transport of solute molecules to the binding sites within the pores and high pressure drop through the packed bed [1]. These limitations can be overcome by using chromatographic supports like membranes or monoliths [2]. In chromatography processes with these supports the transport of solutes through binding sites takes place mainly by convection, thus the process time is
2
reduced. The pressure drop is also significantly lower than with packed beds. The main disadvantage of these media is their low binding capacity, since the specific surface area is much lower than that of resins [1].
In recent years, supports were modified in different ways and various ligands were tested. Dye-ligands, as triazine dyes ,are considered important alternatives to natural ligands. These dyes are able to bind most types of proteins, they interact with the active sites of proteins by mimicking the structure of the substrates, cofactors or binding agents for those proteins [3].
Several reactive dyes, particularly Cibacron Blue F3GA, are used as affinity ligand for protein purification. Most of them consist of a chromophore linked to a reactive group. The interaction between the dye ligand and proteins can be realized by combination of electrostatic, hydrophobic and hydrogen bonds. Cibacron Blue F3GA is a triazine dye that interacts specifically and reversibly with albumin [4].
The aim of this study is to prepare dye-affinity membranes and monoliths for efficient removal of albumin and to compare the three different affinity supports: commercial resin, membranes and monoliths. In particular, this work describes the experimental comparison between the performance of three different affinity chromatography media: membranes and monoliths modified with Cibacron Blue F3GA and a commercial column HiTrapTM Blue
HP, produced by GE Healthcare.
In Chapter 1 the principles of affinity chromatography are introduced and the various steps of a chromatographic cycle are described. In the last part of the chapter the main advantages and disadvantages of the different chromatographic supports studied are discussed.
In Chapter 2 the materials used during the research project are described in detail. A qualitative description of the chromatographic cycles performed is also presented, along with the explanation of the procedure employed for data
3
elaboration and the description of the analytical assays performed during the research activity.
In Chapters3 and 4 the experiments performed with membranes and monoliths are described in detail and results are discussed, while in Chapter 5 the comparison among the affinity supports is described.
In Appendix I is listed the composition of all solutions used, in Appendix II the calibration realized for calculations of the results.
4
Chapter 1
Affinity Chromatography
1.1. Introduction to Chromatography
Chromatography is a separation technique based on differential partitioning between the mobile and stationary phases.
In a chromatographic process a mixture of molecules is carried by a liquid, called mobile phase, through a column containing a porous solid substance, called stationary phase, which remains fixed in the column. The stationary phase acts as a restraint on many of the components in the mixture, which travel at different speeds. The movement of the components is controlled by the significance of their interactions with the mobile and/or stationary phases. Some components will move faster than others according to the differences in solubility in the mobile phase and according to the strength of their affinities with the stationary phase. In this way the separation of the components within the mixture is facilitated.
The chromatographic methods are among the most widely used separation techniques for the purification of proteins, they are classified according to the nature of the interactions that are established between the protein and the stationary phase.
5
Various types of chromatographic techniques are used for protein separation. These methods are based on different supports such as silica gel, glass plates, paper and liquids.
Paper chromatography uses a piece of specialized paper. It is a planar system in which cellulose filter paper represents the stationary phase. The separation of compounds occurs on the stationary phase.
Gel filtration or Size Exclusion Chromatography (SEC) separates molecules according to differences in size as they pass through a gel filtration medium packed in a column, using mild conditions.
Thin layer chromatography (TLC) is used frequently to visualize components of a mixture. The common TLC plate is a rectangular piece of glass coated with silica powder. The silica is the stationary phase because it remains adhered to the glass plate and it does not move during the chromatographic process.
Ion Exchange Chromatography (IEC) separates molecules by reason of differences in their surface charge. Molecules vary significantly in their charge properties and will exhibit different levels of interaction with charged media according to differences in their surface charge distribution, density and overall charge. An IEC medium, stationary phase, consists of a matrix of spherical particles substituted with ionic groups that are negatively or positively charged. Hydrophobic Interaction Chromatography (HIC) separates according to the reversible interaction between the target protein and the hydrophobic ligand bounded to the chromatographic matrix.
High Performance Liquid Chromatography (HPLC), in this technique the mobile phase is pumped through the column, composed by small particles which offer a great surface area for the interaction between the stationary phase and the molecules, under high pressure. An HPLC system consists of a pump, sample injection, detection and data-processing unit.
6
Affinity Chromatography (AF), this technique exploits the properties of proteins to interact specifically with a ligand. The affinity ligand is immobilized on a solid matrix to create the stationary phase while the target molecules are in the mobile phase. The interactions between ligand and target proteins are typically reversible and so it is possible to recover proteins using a specific eluent.
1.2.Affinity chromatography
Affinity chromatography is one of the most used methods for the protein purification. This technique allows to obtain high purity products at a relatively low cost.
Affinity chromatography is based on the specific interaction between a ligand and a target protein. The high specificity and capacity of affinity chromatography allows the use of high speeds of the mobile phase in small matrix volumes obtaining fast separations [5].
The ligand is immobilized on an inert support, in this way it can interact with the target molecule, called ligate. Ligand and ligate form a complex bonded on the support. Usually, the interactions between protein and ligand are weak chemical bonds as Van der Waals forces, electrostatic forces, hydrogen bonds and hydrophobic interactions. The interactions are reversible and they ensure the link between the two substances, and the subsequently release of the protein varying the conditions. These conditions are varied sufficiently to cause the release of the ligate from the complex, but not to cause significant release of the ligand from the support.
7
The affinity separation occurs in three steps: adsorption, washing and elution. The simplicity of the chromatographic process is represented in the Figure 1.1.
Figure 1.1 – Schematic diagram of affinity chromatography.
In the first step, adsorption, the protein interacts with the ligand immobilized on the support.
Thereafter, in the washing step, the molecules nonspecifically linked to the matrix are removed from the support.
Finally, elution allows the desorption of the target molecule using an appropriate elution buffer. Elution can be performed in a competitive or non-competitive manner. In the non-competitive elution, the buffer contains a compound that has a great affinity with the target biomolecule and it competes with the ligand for the active sites. The non-competitive elution consists in a change of the operating conditions, which can be achieved by varying the pH, temperature and ionic strength [6].
The fourth step consists in the regeneration and/or sanitization of the solid support with a strong alkali or acid, in order to reuse it for subsequent cycles.
8
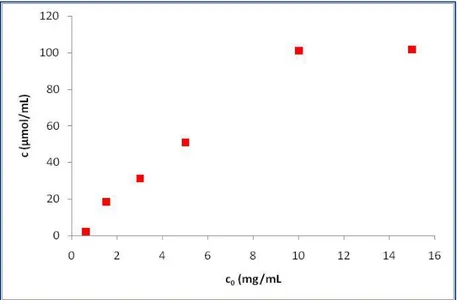
Breakthrough analysis (BTC) is a method used for the evaluation of a chromatographic process. The breakthrough curve (BTC) is defined as the plot of effluent concentration versus time, or versus effluent volume, Figure 1.2.
A solution containing a known concentration of the ligate is applied continuously to an affinity column. As this ligate is bound to the ligand, the ligand becomes saturated and the amount of ligate eluted from the column increases, forming a characteristic breakthrough curve.
An ideal BTC increases instantaneously from zero to the feed concentration when the adsorbent becomes saturated; actual BTCs are broadened by the non-idealities of real flow systems, like dead volume mixing and slow sorption kinetics. A broad BTC means that the system is inefficient, because if the loading step is performed until ligand saturation, protein will be lost in the effluent [7].
Figure 1.2 – Breakthrough analysis for a typical chromatographic process.
In this figure, the solute in the feed is completely retained by the column at short times. After a while the effluent concentration increases with time, until the column becomes saturated and the effluent concentration becomes equal to
9
the feed concentration. The maximum capacity of the column for a given feed concentration is equal to the area behind the breakthrough curve, while the amount of solute that exits from the column is the area under this curve [8].
In industrial processes the adsorption step is usually concluded before column saturation, at breakthrough point, when the solute reaches a specified concentration, cBP, in order to reduce the loss of product. In this case the
breakthrough curve can be used to determine how much of the column capacity is exploited, how much solute is lost in the effluent and the processing time [8]. It is desirable to work with systems that have a high binding capacity and in which the breakthrough curve is very steep.
The position of the breakthrough curve on the volume axis depends on the column capacity and on the feed concentration: increasing the capacity at a fixed feed concentration or decreasing the feed concentration at a fixed capacity, the volume of feed that can be processed increases and shifts the breakthrough to the right [8].
Although the performance of a chromatographic process depends strongly on the adsorption step, it is important to consider also washing and elution steps.
1.2.1. Chromatographic supports
The main technologies available for chromatographic separations employ different supports: conventional resins (diffusive), perfusive resins membranes or monoliths.
The solid supports traditionally used in the stationary phase are functionalized resins or polymeric matrices, such as agarose, formed by beads with spherical shape and variable size. This method is based on the use of a column packed with a porous adsorbent in which the ligand is immobilized.
10
Particles are typically 50 to 100 μm in diameter to minimize pressure drops [9]. These particles exhibit high throughputs, because of the high superficial area, but they have various limitations.
First, pressure drop across a packed bed is high and increases during a process due to the combined effects of bed consolidation and column obstruction caused by the accumulation of colloidal material. Another major limitation is the dependence on intra-particle diffusion for the transport of solute molecules to their binding sites within the pores. This increases the process time since diffusive transport of macromolecules is slow, especially when it is hindered [10]. Consequently, the volume of the elution buffer also increases and biomolecules may be denatured because of a long exposition to aggressive conditions. Smaller particles with a higher superficial area and a lower diffusive distance could be employed to solve this problem, but pressure drop would drastically increase.
Another problem is the possible formation of flow passages due to cracking of the packed bed (channeling). This results in short-circuiting of material flow, leading to poor bed utilization. Furthermore, the complexity of the transport phenomena makes scale-up of packed bed chromatographic process complicated [1].
Perfusion chromatography is based on the use of bidisperse porous particles on which the ligand is immobilized. These particles have a network of large pores, through pores, in which the particles transit, and also a network of smaller interconnecting pores between the through pores. In this media, the intraparticle convective velocity is non-zero; this property helps to overcome the limitations encountered in conventional processes with purely diffusive particles.
11
An alternative to packed beds is represented by supports with polymeric matrix as membranes and monoliths. These materials provide advantages over the conventional chromatography packed columns, especially in relation to processing time and activity recovery [11].
Membranes act like short and wide chromatographic columns in which the adsorptive packing consists of one or more microporous or macroporous membranes in series, each derivatized with adsorptive portions. They are basically derived from filtration modules and consequently they exist in a similar variety of configurations, as flat or spiral sheets, hollow fibers and cast cylindrical plugs, Figure 1.3.
Figure 1.3 - Schematic comparison of the configurations of the membrane adsorbers [12].
Cellulose, regenerated cellulose, nylon, polyethlyene, poly(styrene-co-divinylbenzene), poly(HEMA), polyamide, chitin and chitosan are some materials used as substrate in adsorptive membranes [12].
12
Monolithic supports compete with macroporous membranes since they have similar pore morphology but different manufacturing technology [13,14].
Monolithic supports consist of a single piece of a solid stationary phase cast as a homogeneous column. The use of monolithic supports has been exploited with immobilized low molecular mass ligands, as dyes, inhibitors, chelating species, combinatorial ligands, and high molecular mass ligands, like proteins A and G, antibodies and receptors [15].
Normally, monolithic stationary phases for affinity separations are polymerized using ethylene dimethacrylate (EDMA) or trimethylolpropane trimethacrylate (TRIM) like a cross-linking monomer and glycidyl methacrylate (GMA) as the active monomer for successive immobilization of the ligand [15]. The macroporous poly(glycidylmethacrylate–co-ethylene dimethacrylate) monoliths have been also used for the immobilization of dye in affinity chromatography for protein separations [16].
1.2.2. Advantages and limitations of adsorbers
The main difference between polymeric matrixes, membranes and monoliths, and beads is the mechanisms by which solutes are transported to and from their surfaces, as schematically illustrated in Figure 1.4. Diffusion and convection are the primary types of mass transport. Diffusion is the migration of solutes from the area with high concentration to the area with low concentration through random movement. The mass transport phenomena in beads depend mainly on the diffusion [17]. One important point regarding the diffusion is the process is slow, and it becomes much slower with increasing molecular size. As a result, dynamic binding capacity decreases with increasing of the flow rates [17-20].
13
Figure 1.4 – Comparison of mass transport phenomena during adsorption of molecules in generalized structures of membranes stacked, monoliths and beads.
The convective transport of mass is not limited by diffusion or molecular size. The convection is imposed by an external force, in the case of chromatography, the flow of liquid is delivered from the pumps. Instead of beads, membranes and monoliths structures are designed to take advantages of convective mass transport. Capacity and resolution are independent of the flow rate for these supports [21–23, 18, 24, 25]. So, it is possible to work at high flow rates reducing the process time.
Operating pressures in a certain flow rate are lowest on membranes and usually highest on beads. Monoliths create a less back pressure than beads at flow rates lower than one column volume per minute.
Several membrane adsorbers are disposable, that means for a single use application. As a consequence, the costs of the process can be reduced since it is not necessary to realize and validate the steps of cleaning, regeneration and sanitization.
The flow distribution inside the membranes housing is less controlled than monoliths housing or packed columns, resulting in irregularities in the flow and reductions in the binding efficiency [26]. Monoliths are optimized to eliminate areas of uncontrolled dispersion and to provide constant flow distribution in the column.
14
Furthermore, membranes and monoliths differ from resins by the presence or absence of void volume between the particles. In packed beds, the fluid takes the easiest path which offers lower flow resistance, that is, through the void volume rather than through the particles. The flow through monoliths is laminar that minimizes the shear. This ensures an instantaneous response (to changes) in buffer composition changes, which maximizes elution kinetics and contributes to clear and better resolved elution peaks [25].
1.3. Langmuir model
The Langmuir model is most common type of isotherm used to describe the stationary phase adsorption of a biomolecule. Adsorption is a result of the interactions between the biomolecule and the chromatographic support; in general there can be various kinds of interactions, such as electrostatic interactions, hydrophobic interactions, Van der Waals forces.
Langmuir model is based on the hypotheses that the interaction between the biomolecule and the ligand is monovalent, reversible and that the adsorbed molecules do not interact with each other. Another approximation is made by considering the support homogeneous, all the interactions have the same binding energy [27]. Under these hypotheses the interaction can be described with the following reaction:
+ ↔ (1.1)
where P is the protein, L is the ligand and PL represents the protein–ligand complex. The mass balance associated with eq. (1.1) for the adsorbed biomolecule is the sum of two terms, one related to the reaction of formation of
15
the protein-ligand complex and one related to the reaction of dissociation of this complex.
The formation of the complex depends directly on the interaction between the protein and the support, so it is reasonable to consider a linear dependence of the adsorption rate on the concentration of biomolecule. Moreover, since a protein cannot interact with active sites that are already involved in an interaction with other proteins, the adsorption rate should be proportional to the concentration of free binding sites. The following second order equation results from the combination of these two effects:
= ( − ) (1.2)
where Ra is the adsorption rate, c is the local concentration of protein, cs is the
concentration of protein bound to the stationary phase, qm is the maximum
binding capacity of the support and ka is the kinetic constant of the adsorption
reaction.
Similar considerations can be done for the desorption reaction, whose rate is assumed proportional to the concentration of protein adsorbed on the stationary phase. The following first order equation can thus be written:
= (1.3)
where Rd is the desorption rate and kd is the kinetic constant of the desorption
reaction.
The mass balance obtained by coupling eq. 1.2 and 1.3 is
16
If the system is in equilibrium, the adsorption rate is equal to the desorption rate:
( − ) = (1.5)
The concentration of adsorbed protein can be easily derived from eq. previous equation:
= (1.6)
Equation 1.6 is the Langmuir adsorption isotherm. The parameter Kd is
the Langmuir dissociation constant, equal to the following ratio:
= (1.12)
The Langmuir kinetic model contains 3 parameters, ka, kd and qm, while
the Langmuir equilibrium isotherm contains only 2 parameters, Kd and qm, that
17
Chapter 2
Materials and methods
2.1. Introduction
In this chapter materials and experimental methods employed during the work are described. In § 2.2 properties, biological functions and main applications of bovine serum albumin are presented, in order to provide some information about the biomolecule used in the research for the characterization of the chromatographic media examined. In § 2.3 materials used in the experiments are described in detail. In § 2.4 a detailed description of the assays used for protein quantifications. The last paragraph consists in a qualitative description of chromatographic cycles performed is presented, and an explanation of the procedure employed for the elaboration of experimental data.
2.2. Protein
Serum albumin is one of the most widely studied proteins and it is the most abundant protein in the circulatory system. Bovine Serum Albumin, BSA, is often chosen as a model protein for experimental studies due to its low cost and availability, Figure 2.1.
This protein has a capacity of conformational adaptation and so it can bind with high affinity a variety of compounds.
18
Figure 2.1 – Bovine serum albumin.
BSA is a large globular protein constituted by the twenty essential amino acids in a structure which contains 583 amino acid residues. The molecular weight calculated from different techniques, ranges from 66411 to 66700 Da and the used value for solution is 66500 Da [28]. It has an isoelectric point of 4.7, so it is negatively charged at pH 7 [29].
The structure and properties of BSA in solution can be characterized by a versatile conformation as a function of pH, ionic strength, presence of ions, and others. This protein presents various conformations [30] according to pH of the medium:
Figure 2.2- Reversible conformational isomerization of serum albumin in function of pH.
BSA conformer N has a globular, compressed structure, that reveals a triangular heart shape [31]. The N to F conformation transition is an abrupt expansion occurring at pH 4.3 [32]. This form is characterized by a an increase of viscosity and a reduction of solubility. Conformer E is found in the pH range of 3.4 - 2.75, so denatures for mutual repulsion of internal amino acid residues
19
positively charged [33]. At pH 9, albumin changes conformation to B basic form and after three or four days, the protein isomerizes forming the A structure.
The sequence of BSA is 75.8% identical to that of human serum albumin (HSA), the main difference being the presence of a second tryptophan residue in position 131 in the bovine protein [34, 35].
Serum albumin has many physiological functions. It is essential for maintaining the osmotic pressure needed for proper distribution of body fluids between intravascular compartments and body tissues. It is also the principal carrier of fatty acids, steroid, hormones and flavour compounds that are otherwise insoluble in plasma, because of its hydrophobic domains [36].
BSA has numerous applications in biochemistry, including Enzyme-Linked ImmunoSorbent Assay (ELISA) and immunohistochemistry. Moreover, it is also used as nutrient in microbial cultures and it is employed to stabilize some enzymes during digestion of DNA and to prevent adhesion of these enzymes to reaction tubes and other vessels. BSA is also commonly used as standard in protein assays, such as BCA, Bradford and Lowry assays. This protein is widely employed because of its stability, its lack of effect in many biochemical reactions and its low cost since it can be purified in large quantities from bovine blood, a byproduct of the cattle industry.
2.2. Ligand
There are several pigments capable of interacting with proteins, especially enzymes, and, in some cases, in a very specific way. The pigments are classified as affinity ligands, they mimic the structure of coenzymes and enzyme cofactors and interact with the active site of enzymes [37-40].
20
Dye ligands have been considered as an important alternatives to natural homologues for specific affinity chromatography, in order to overcome many of their disadvantages [37, 43- 45].
The majority of reactive dyes used as affinity ligands consists of a chromophore, such as anthraquinone, attached to a reactive group as a triazine ring. These compounds also have sulfonic acids in their structure in order to increase solubility in aqueous media.
Although dyes are all synthetic in nature, dye ligands are commercially available, economic, and can be easily immobilized, especially on matrices with active hydroxyl groups. So, triazine dyes, such as Cibacron Blue F3GA, are among the promising ligands for large scale purification of bioproducts.
Cibacron Blue F3GA, that will be indicated throughout this work by the abbreviation CB, was used as the ligand for specific binding of bovine serum albumin.
The reactive group of CB contains a chlorine atom replaceable that provides a convenient chemical immobilization on supports containing hydroxyl groups, forming an ether bond between the dye and the matrix [46].
Figure 2.3 shows the chemical structure of this dye. It contains several possible active sites that can react with proteins as NH2, SO3Na and NH. CB has
aromatic rings in the sulphonated anthraquinone portion that tends to bind preferentially to the active sites of several enzymes, since it resembles the structure of coenzymes such as NADH and FAD, for this reason CB is widely used in the purification of kinases and hydrogenases [47-50].
21
Figure 2.3 - Structure of Cibacron Blue F3GA [51].
The adsorption of albumin, human and bovine, by the CB molecule has been extensively studied using agarose matrices [52], polyamide [53], polystyrene [54], poly (styrene-co-divinylbenzene) [55], and poly (methylmethacrylate) [47].
Althoughmost studies have focused on albumin, other applications for CB were also studied.Doğanet al. [56] used a supermacroporous cryogels as a CB affinity adsorbent for interferon purification.
Recently, affinity membranes have become an alternative to chromatographic columns packed with polymeric resin. Nie and Zhu [57] studied CB immobilized on nylon affinity membranes for adsorption of papain.
Hollow-fiber membranes of various polymers containing immobilized CB were tested to purify proteins. Membranes of poly (2-hydroxyethyl) [58], polysulfone and cellulose [59] and polyamide [60] were used to purify albumin, catalase and lysozyme.
Champluvierand Kula [61] studied the commercial Sartobind membranes (Sartorius, Germany) with immobilized CB for the recovery of glucose-6-phosphate dehydrogenase from Saccharomyces cerevisiae.
Monoliths are novel alternative supports studied in affinity chromatography. Monoliths composed by poly(EDMA-GMA) [16] and poly(acrylamide-allyl glycidyl ether) [62] with immobilized CB were studied for HSA purification.
22
2.3. Chromatographic supports
2.3.1. Resin
Several affinity matrices with immobilized reactive dye are commercially available. Matrices containing Cibacron Blue F3GA are available with varying amounts of dye bound. Some of them are Sepharose CL-6B, Affi-Gel Blue Gel, AcroSep™ and HiTrap™ Blue HP manufactured by Sigma Aldrich, Bio-Rad, Pall Life Sciences and GE Healthcare respectively.
HiTrap™ Blue HP Columns, Figure 2.4, are prepacked columns with Blue Sepharose™ High Performance, that is a specific adsorbent for the purification of albumin, enzymes, coagulation factors, interferons, and related proteins. The carbohydrate nature of the agarose base promotes the coupling due to a hydrophilic and chemically favourable environment. The cross linked structure has a spherical matrix with 34 μm of mean particle size.
Figure 2.4 - HiTrap™ Blue HP Column.
The ligand, CB, is covalently attached to the matrix via the triazine part of the dye molecule.
The columns are made of polypropylene, which is biocompatible and does not interact with biomolecules. The columns used are 1 mL of volume, they can be used either with a syringe, a laboratory pump or a chromatographic system.
23
The main characteristics of HiTrapTM Blue HP columns are summarized
in Table 2.1.
Table 2.1. Characteristics of HiTrapTM Blue HP columns with volume of 1 mL.
Column dimensions 0.7 × 2.5 cm
Ligand concentration 4 mg/mL medium
Binding capacity 20 mg human albumin/mL medium
Mean particle size 34 μm
Matrix Highly cross-linked, spherical agarose
Maximum backpressure 3 bar (0.3 MPa)
Maximum flow rate 4 mL/min
Recommended flow rate 1 mL/min
pH stability Regular use¹ Cleaning² 4–12 3–13 Temperature stability Regular use Storage 4°C to room temperature 4°C to 8°C
Storage buffer 20% ethanol
¹ Refers to the pH interval where the medium is stable over a long period of time without adverse effects on its subsequent chromatographic performance.
² Refers to the pH interval for regeneration, cleaning-in-place, and sanitization procedures.
2.3.2. Membranes
Flat sheet regenerated cellulose membranes were used as solid support for ligand immobilization. Sartobind membranes, kindly provided by Sartorius Stedim Biotech GmbH, Göettingen, Germany, have been used in three different formats: preactivated with epoxy groups, Sartobind® Epoxy; with aldehyde
groups, Sartobind® Aldehyde; as well as the unmodified membrane.
These membranes have a base matrix of stabilized and reinforced cellulose: this hydrophilic polysaccharide consists of linear chains of several
24
hundreds to over ten thousand D-glucose units linked with β1-4 glycosidic bonds (fig. 2.5). Reticulations between adjacent chains are also possible through β1-6 glycosidic bonds.
Figure 2.5 – Cellulose structure.
The hydroxyl groups in position 2, 3 and 5 can be activated with functional groups, such as epoxy or aldehydic groups, and then a ligand can be attached to these groups.
2.3.2.1.Regenerated cellulose membranes
The unmodified regenerated cellulose membrane is the base matrix of all Sartobind family, figure 2.6. The membranes have an average pore size of 0.45 μm and a thickness in the range of 227 to 252 μm. The thickness of individual sample was measured using Digimatic Disk Micrometer (Mitutoyo Corporation, Japan).These membranes are indicated with RC throughout this work.
25
Figure 2.6 - SEM image of matrix in cellulose reinforced and stabilized.
2.3.2.2.Membrane Sartobind® Epoxy
The second membrane used for CB coupling was Sartobind® Epoxy, a
stabilized reinforced cellulose with active epoxy groups, Figure 2.7.
Figure 2.7 - SEM of Sartobind® Epoxy membrane surface view x 1000.
The activation is usually accomplished through grafting technique, using an epoxy monomer. The membrane obtained has a thickness of 275 μm, the average pore size of 0.45 μm and a void fraction of about 64%.The density of the
26
epoxy monomer on membrane is 1.5 μeq/cm2. Membranes characteristics are
summarized in table 2.2, in which the information provided in the manufacturer in data sheet is reported. Sartobind® Epoxy membranes are
indicated with SartoE throughout this work.
Table 2.2 – Main characteristics of SartoE and SartoA membranes.
Binding capacity of protein > 1.1-5.5 mg/mL
> 30-150 μg/cm2
Flow rate at 0.1 MPa (1 bar, 14.5 psi) > 40 mL/cm2×min
Poresize 0.45 μm
Ligand density 1.5 μeq/cm²
1 mL membrane 36.4cm²
2.3.2.3.Membrane Sartobind® Aldehyde
Membranes in cellulose with aldehyde activation Sartobind® Aldehyde
membranes, for simplicity indicated with the abbreviation SartoA, are constituted by the same reinforced and stabilized cellulose used for all Sartobind membranes, Figure 2.8.
27
The activation is achieved through grafting technique, in this case using an aldehyde monomer which is a spacer arm and provides functional groups for subsequent immobilization of the ligand. Thickness, average pore size and porosity are equal to the membranes SartoE as specified in Table 2.2.
2.3.3. Monoliths
A monolithic column is constituted of a single piece of separation media which presents high permeability and low resistance to mass transfer. For this reason monolithic material is especially suited for the separation of analytes with low diffusion constants, like proteins, peptides, nucleic acids and synthetic polymers [63].
The monolithic supports used in this work were kindly provided by BIA Separations GesmbH. Monoliths with two different activation chemistry, epoxy and EDA, were used as a chromatographic support for CB immobilization, Figure 2.9.
Figure 2.9 - Convective interaction media (CIM) disks.
These monoliths have a diameter of 12 mm and thickness of 3 mm, volume of 0.34 mL, placed in an appropriate housing [64], Figure 2.10, which was connected to a FPLC system.
28
Figure 2.10 –CIM® housing and CB-Epoxy disk.
This monolith contains a homogeneous base matrix of poly(glycidyl methacrylate-co-ethylene dimethacrylate), Figure 2.11, and a non-porous, self-sealing fitting ring that ensures only axial flow through the disk and prevents any sample and mobile phase leakage or bypass.
29
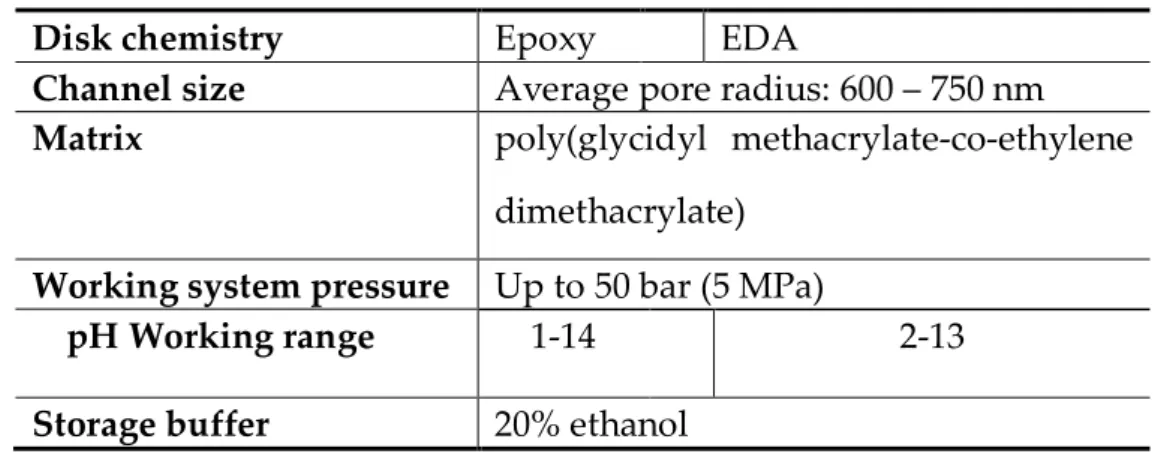
The main characteristics of CIM disks are summarized in Table 2.4.
Table 2.4. Comparison of the characteristics of CIM Epoxy and EDA disks.
Disk chemistry Epoxy EDA
Channel size Average pore radius: 600 – 750 nm
Matrix poly(glycidyl methacrylate-co-ethylene
dimethacrylate) Working system pressure Up to 50 bar (5 MPa)
pH Working range 1-14 2-13
Storage buffer 20% ethanol
2.4. Analytical methods
2.4.1. Protein concentration determination methods
Accurate protein quantification is essential to all experiments related to proteins in many research projects.
During the last century several methods have been developed to quantify proteins either to determine the total protein content and also as a specific assay to quantify a single protein.
Total protein quantification methods include traditional methods such as the UV adsorption at 280 nm (A280), bicinchoninic acid (BCA) and Bradford
assays, as well as alternative methods like Lowry or novel assays developed by commercial suppliers.
30 2.4.1.1.UV adsorption
UV adsorption is one of the simplest and effective methods for the measurement of the concentration of pure protein solutions. When an electromagnetic radiation hits a substance, this substance absorbs a portion of the incident radiation. If I0 indicates the incident radiation intensity and I
indicates the intensity of the radiation that has passed through the sample, the transmittance T is defined by the following relationship:
=
(2.1)while the absorbance A, for liquid solutions, is defined by the following relationship:
= log = − log ( ) (2.2)
Proteins absorb at 280 nm mainly for the presence of tyrosine and tryptophan residues and cysteine, disulfide bonded cysteine residues. A280method is based on the protein capacity to absorb the radiation in the near
ultraviolet (UV). Usually the wavelengths used are 215 and 280 nm according to the absorbance peaks of proteins.
Some conditions that alter the protein tertiary structure as buffer type, pH and reducing agents, can affect its absorbance. Nevertheless, measuring the absorbance at 280 nm is often used because few other chemicals also absorb at this wavelength.
In the range of 20 to 3000 μg/mL, the relationship between absorbance and concentration of an absorbing species is linear and can be described by the Lambert Beer law. The general Lambert Beer law is usually written as:
31
= ∙ ∙ (2.3)
where A is the measured absorbance, ε is the molar absorptivity coefficient dependent to wavelength having units of M-1 cm-1, b is the path length and c is
the analyte concentration [65].
The absorbance measurements were performed with a
spectrophotometer UV1601 (Shimadzu) and with the UV detector module of the FPLC System ÄKTA Purifier 100 (GE Healthcare), that will be described in Section 2.6.1.3.
Due to the use of two UV cells with different path length it was necessary to determine a conversion factor between the two instruments. This coefficient is 209.7.
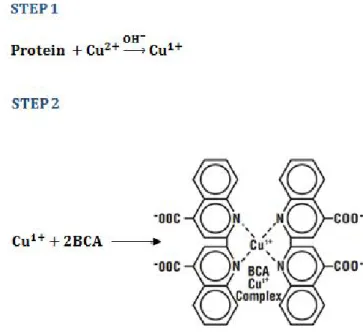
2.4.1.2. BCA assay
Another method used to determine the total amount of protein is the bicinchoninic acid assay, BCA. The BCA Protein Assay Reagent Kit (Pierce Biotechnology, Inc.) was used as indicated in the manufacturer instructions specified for the standard protocol, as experimental conditions: 37 °C for 30 minutes in a working range of 20 - 2,000 μg/mL.
The principle of the bicinchoninic acid (BCA) assay is based on the formation of a Cu+2 protein complex under alkaline conditions, followed by
reduction of the Cu+2 to Cu+(Biuret reaction). The amount of reduction is
proportional to the protein present. It has been shown that cysteine, trytophan, tyrosine and the peptide bond are able to reduce Cu+2 to Cu+1[66]. The reaction
32
coloured reaction product of this assay is formed by the chelation of two molecules of BCA with one cuprous ion, Figure 2.12.
Figure 2. 12 – Reactionrepresentation of the BCA assay. In step 1 the chelation of copper with protein is shown and in step 2 the chelation of two BCA molecules with one cuprous ion.
Since the production of Cu+ in this assay is a function of protein
concentration and incubation time, the protein content of unknown samples may be determined spectrophotometrically by comparison with known protein standards.
The BCA protein assay was performed using a ShimadzuUV-1601 spectrophotometer (Kyoto, Japan). The samples and their corresponding blanks were assayed in triplicate by the BCA method, using BSA as the standard, for these data see Appendix II.
33 2.4.1.3. Electrophoresis
Proteins have a net average charge in solution at any pH other than their isoelectric point, allowing to analyze heterogeneous protein samples. The proteins migrate by action of an electric field due to their charges. This migration is different for each protein and it depends on its charge density, that is, a ratio charge/mass. As a result, proteins have characteristic migration rates that can be exploited for the purpose of separation as in electrophoresis.
The force acting on a protein is equal to Ez, being E the electric field applied and z the net charge on the protein. This force is opposed by viscous forces in the moving medium proportional to the viscosity η, the particle radius
r (Stokes radius) and the velocity v.
In a steady state
= 6 (2.4)
The specific mobility, defined as velocity per unit of electric field is therefore
= (2.5)
From this relation, it is evident that the final mobility of a charged protein is a function of both net charge and size.
The support frequently used to carry out an electrophoresis separation is a polymeric gel. The electrophoresis gel is a three dimensional network of filaments forming pores of various sizes, acting as a screening towards proteins of different dimensions. As a consequence, the effective viscosity of the gel η
34
varies as a function of protein size, causing mobility, Eq. 2.5, to be a more complex function.
Lastly, gel electrophoresis separates according to both net charges and molecular size.
The different electrophoresis procedures using polyacrylamide gels as a medium are Native electrophoresis, Urea gel, Sodium dodecyl sulphate gel electrophoresis (SDS-PAGE) and Gradient gels.
SDS-PAGE is adopted to determine the molecule weight and purity of a protein sample. It provides a platform to analyze multiple samples simultaneously and multiple components in a single sample.
This method involves denaturing the protein with sodium dodecyl sulphate (SDS). SDS binds noncovalently to protein in a manner that confers an overall negative charge on the proteins, the same charge/mass ratio for all proteins and a long rod-like shape on the proteins instead of the tertiary conformation. As a result, the separation occurs only due to the screening effect through the pores of the gel.
The separation of molecules of the same size is not realizable, despite of the best resolution achieved with this method.
It is possible to compare unknown samples in the gel using standard polypeptides of known molecular weight in terms of mobility against size.
Electrophoresis technique can be used during purification process to identify whether the desired product is pure or contains impurities. When the product is completely isolated only a band is expected.
35 2.4.1.3.1. Experimental procedure
The apparatus available in our laboratory requires the use of precast gel, Figure 2.13. The precast gel used is Tris-HCl CriterionTM Gel 4-20% Linear
Gradient (Bio-Rad) 13.3 cm of width, 8.7 cm of length and thickness of 0.1 cm.
Figure 2.13 – Electrophoresis apparatus.
The procedure adopted is as follow:
Mix in Eppendorf tubes 80 μL of protein samples with 20 μL of CPB (classic protein buffer) solution. At the same time, mix 80 μL of protein markers with 20 μL of CPB. For the composition of these solution see Appendix I.
Heat the sample at 90-95°C for 10 min.
Prepare the running buffer solution, Appendix I.
Remove the gel from the package. Remove the comb and rinse the wells with deionized water. Thereafter, remove the tape from the bottom of the cassette into one of the slots in the cell tank.
Fill the cell tank with running buffer until the mark Fill.
After having inserted the precast gel to the cell tank, load 25 μL of markers in the terminal wells and 25 μL of protein samples in the wells available.
36 Set the power supplier working at 140 V and 40 mA and connect the power supply to the cell tank and run the gel for about one hour and thirty minutes.
After electrophoresis is complete, turn off the power supply and disconnect the electrical leads. Remove the cover from the tank and remove the gel from the cell. Remove the gel from the cassette carefully.
Soak the gel in staining solution, Comassie Brilliant Blue (Bio-Safe Comassie, Bio-Rad) for about one hour.
Destain overnight in water for few hours.
2.4.1.4. HPLC
Classic liquid chromatography has severe limitations as a separation method. When the solvent is driven by gravity, the separation is very slow, and if the solvent is driven by vacuum, in a standard packed column, the plate height increases and the effect of the vacuum is negated.
The limiting factor in liquid chromatography was originally the size of the column packing, once columns could be packed with particles as small as 3 μm, faster separations could be performed in smaller and narrower columns. High pressure was required to force the mobile phase and sample through the column.
The use of high pressures in a narrow column allowed for a effective separation to be achieved in much less time than was required for others forms of liquid chromatography.
General instrumentation, for this technique called High Performance Liquid Chromatography (HPLC), has following components:
degasser, the solvent is passed through a very narrow bore column and any contaminant could at worst plug the column, or at the very least add
37
variability to the retention times during repeated different trials. Therefore HPLC solvent must be kept free of dissolved gases, which could come out of solution mid-separation, and particulates.
pump, to deliver the mobile phase with varying range of pressure up to several hundred atmospheres to achieve reasonable flow rates.
injector, the chromatographic process begins by injecting the solute into the injector connected to the top of the column.
guard column to prevent contamination of the main column.
column, the most important part of the system is the column where the separation occurs. Separation column contains packing to accomplish desired separation.
detector, capable enough of measuring the solute concentration. The method used for detection is dependent upon the detector used.
The response of the detector, a chromatogram, is displayed on a chart recorder or computer screen. To collect, store and analyze the chromatogram, integrators and other data-processing equipment are frequently used.
The concentrations of BSA eluted and the other components of the mixture were determined by the use of HPLC Watters Alliance 2695, Figure 2.14.
38
Figure 2.14 – Schematic diagram of High Performance Liquid Chromatography.
The chromatographic method applied to our separation is based on differences in size or shape, that is Size Exclusion Chromatography (SEC). In this case the separation is due to a specific distribution of the solutes between the mobile phase and the stationary phase. The characteristic of SEC is its gentle non-adsorptive interaction with the sample, enabling high retention of biomolecular activity.
On analytical scale, columns with small size beads are preferred since the resolution is more an issue than flow rate.
The column used for this procedure was BioSuiteTM 250 4 μm UHR SEC
Columns Waters, with internal diameter 4.6 mm and length 300 mm.
The method used is isocratic with SEC Buffer, for the composition of this solution see Appendix I. The flow rate used is constant and equal to 0.35 mL/min.
The samples, before injection, are filtered in filters 0.22 μm. The injection volume used is 10 μL.
39
2.4.2. Chromatographic apparatus
The characterization of the chromatographic devices tested was done with a Fast Protein Liquid Chromatography (FPLC) system. The commercial name of the FPLC employed during the research project is Äkta Purifier 100, produced by GE Healthcare Life Sciences. Äkta Purifier 100is a chromatographic system designed for development and optimization of biomolecular purifications at lab scale. An Äkta Purifier 100 is shown in fig. 2.15.
FPLC ÄKTA Purifier 100 is a system for protein separation and purification. This equipment is used for protein separation by different chromatographic techniques such as affinity, ion exchange, gel filtration, hydrophobic interaction and reversed phase chromatography.
40
The system includes a pump P-901 capable of providing flows from 0.01 to 100 mL/min until a maximum pressure of 10 MPa (100 bar). It also includes a gradient mixer M-925 with a 2mL chamber capable of using two pads simultaneously to flow 30 mL/min. The sample injection is made by INV-907 module that allows to use loops of different volumes or use a pump P-960 for loading large volumes of sample flows can reach up to 50 mL/min pressures up to 2 MPa (20 bar).
For the chromatographic separation control system includes a detection module Monitor UV-900 absorbance can monitor up to three wavelengths simultaneously in the range 190-700 nm, with a module that includes pH/C-900, detector conductivity and pH probe that control the gradients of solvents used. Following separation valve PV-908 allows the separation of waste products or the collection of fractions using a fraction collector Frac-920. A representative flow diagram for a Äkta Purifier 100 is shown in fig. 2.16.
41
Figure 2.16 – Flow diagram for a FPLC Äkta Purifier 100.
In addition to the components described above, there are some accessory items, such as valves, a fraction collector, and others. Eleven different buffer lines can be used to load buffers into the system: 8 of them (from A11 to A18) belong to the group of lines A1, the other are the lines A2, B1 and B2. An 8 -port fractionation valve is used for the choice of the line of the group A1.
The system of pumps is constituted of 4 heads, two of them belonging to the couple of pumps A and the other two belonging to the couple of pumps B. The two pumps of a certain couple run in parallel, in order to provide a constant flow rate. The couple of pumps A can process either one of the lines of the group A1 or the line A2, while the system B can process either the line B1 or the line B2. The choice between the lines 1 and 2 is determined by the position of a switch valve; thus, the chromatographic system can process simultaneously
42
two different buffers, one from a line A and the other one from a line B. The lubrication of pumps is performed with a proper system, in which a fluid flows in a closed circuit with a velocity proportional to that of the pumps. The lubricant is a 20% (v/v) of ethanol aqueous solution.
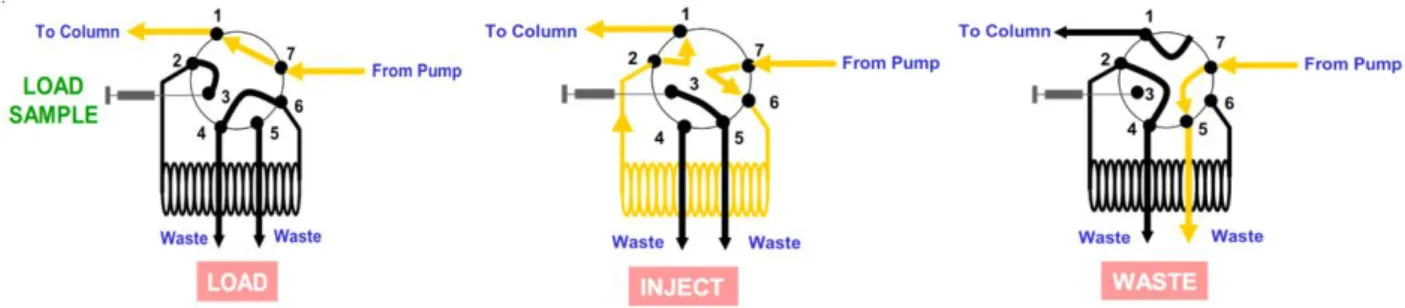
After the pumps, a magnetic, single chamber mixer homogenizes the solutions that come from different lines. Then, these solutions are filtered with a polypropylene filter with 2 μm pores and reach a 7-port injection valve. This valve can assume three different positions: Load, Inject and Waste. These positions are shown in fig. 2.17.
Figure 2.17 – Positions that can be assumed by the injection valve.
When the valve is in the Load position, the buffer is directly sent to the flow direction valve placed immediately after the injection valve. In this position, it is possible to load a sample from the port 3 while the chromatographic column is equilibrated. A loop, a simple tube of known volume that contains the sample, is connected to the ports 2 and 6. When the valve moves to the Inject position, the sample is pushed to the flow direction valve by the buffer; when the valve assumes the Waste position the column is disconnected from the circuit and the buffer pumped is discharged into the waste. This position is useful when it is necessary to change buffer, since it allows washing the volumes before the column.
The flow direction valve is a 7-port valve that, basing on the position assumed, directs the flow either downward or upward through the column.
43
After this valve there is a column valve. 8 chromatographic devices can be simultaneously connected to the Äkta system; the column valve directs the flow to the desired column. After the column there are the UV monitor and the pH/conductivity monitor. Before the outlet valve there is a flow restrictor, a device that generates a pressure drop. Because of the presence of this flow restrictor, the pressure in the UV and pH monitors is sufficiently high to avoid the formation of air bubbles that could lead to inaccurate measurements.
After this device there is another 8-port valve, the outlet valve. It can direct the buffer stream either to the waste or to another system, such as a fraction collector. A fraction collector FRAC-902 was connected to the Äkta Purifier 100.
Unicorn™ 5.0 is the software employed for the control of the chromatographic unit and for data elaboration. It has a 4 windows structure; the sections of the program are:
Manager: this window is used to organize data, such as result files and user set up. It is divided into two columns: in the left one the working methods are displayed, in the right one the experimental results are saved.
Method editor: in this window it is possible to create, modify and save working methods.
System control: this is the most important window, since it allows to view run data in real time and to control the instrument manually with immediate effect on the process;
Evaluation: this window is used to elaborate experimental data. A lot of different operations can be performed, such as peak integration, curve normalization, curve smoothing and curve differentiation. Results can be exported into other programs, like Excel worksheets, for further elaboration.
44
2.4.2.1.Qualitative description of chromatographic cycles
All protein solutions employed during chromatographic experiments were filtered with 0.45 μm Sartorius filters made of cellulose nitrate. The filter material was hydrophilic, so, non-specific adsorption of BSA was minimized.
The experiments were performed as chromatographic cycles in bind and elute mode. This kind of chromatographic process is usually constituted of the following steps:
Equilibration: a buffer with pH and ionic strength similar to those of the sample under examination is flushed into the column, in order to obtain uniform working conditions along the chromatographic media. The duration of this step depends on the column volume.
Loading: in this step the sample is fed to the column. Its duration depends on the purpose of the chromatographic process: in industrial operations, the step is interrupted when the outlet concentration reaches a certain value, called Breakthrough concentration. In lab scale experiments, the adsorption step can be prolonged until the column is completely saturated; thus the maximum binding capacity of the column can be measured. In the cycles done during this study both these working modes were employed, see Chapters 4 and 5.
Washing: in this step the solute molecules present in the dead volumes and those not specifically bound to the stationary phase are removed from the system. The buffer used is usually identical to that employed during the equilibration step. The wash ceases when the absorbance signal is close to zero, thus its duration depends on the column volume.
Elution: the buffer flushed during this step breaks the bonds between the target biomolecule and the ligand and allows the recovery of the protein.
45
The duration is dependent on both the column volume and the desorption kinetic.
Regeneration: the purpose of this step is to restore the primitive conditions of the column. Regeneration buffers usually have a pH acid or basic, in order to promote the denaturation of adsorbed proteins and their detachment. In some applications regeneration is performed after each cycle, in other cases it is sufficient to regenerate after a certain number of cycles.
Riequilibration: the equilibration buffer is loaded again to the column.
In the experiments carried out during the work, for resin 0.1 M Tris-HCl pH 8, membranes 0.05 M Tris-HCl containing 0.05 M NaCl pH 8 and monoliths 25mM phosphate buffer containing 0.1 M NaCl pH 7.4 were employed for the equilibration, washing and riequilibration steps. The duration of the various steps varied from one cycle to another: the experimental protocols will be reported in detail in chapters4 and 5. All buffers were loaded with buffer lines of the group A1. For elution the same buffer solution was used for all supports, 0.05M Tris-HCl containing 0.05 M NaCl and 0.5 M NASCN pH 8.0. Fractions were collected during the elution steps of each experiment and their concentration was measured with UV absorbance readings at 280 nm, since pure protein solutions were loaded during the runs.
2.4.3. Elaboration of experimental data
The purpose of the chromatographic cycles performed was the determination of the binding capacity at saturation, DBC100%, and of the
46
DBC10%, at different flow rates of the affinity membranes and monolith selected
for comparison with the resin. These parameters are defined in the following way:
% = , % (2.6)
% = , %
(2.7)
where mads,100% is the mass of adsorbed proteins on the stationary phase when
the mobile phase and the adsorbent are in equilibrium, mads,10% is the mass of
protein adsorbed when the height of the breakthrough curve is equal to the 10% of the saturation BTC height and V is the volume of the adsorbent, total volume of the membranes, monolith or resin bed.
DBC10% is an extremely important indicator of column performance and
the knowledge of its dependence on the superficial velocity is fundamental for industrial applications, since at industrial scale the adsorption step is usually interrupted when the BTC height reaches a certain fraction of the height at saturation, otherwise too much protein would be lost.
The DBC10% usually decreases when the superficial velocity increases,
because of mass transfer and kinetic limitations. These phenomena are particularly important when the stationary phase is a resin bed.
The binding capacities can also be referred to the adsorbent surface area A:
% = , % (2.8)
47
After the washing step, a fraction of the mass of protein loaded to the system is bound to the adsorbent and the other fraction has been lost; no protein is present in the system dead volumes. Thus, the mass of protein adsorbed can be easily calculated with the following equation:
= − (2.10)
where c0 is the concentration of the feed, Vloaded is the volume of protein solution
loaded to the system and mlost is the mass of protein lost. This last term can be
calculated by integrating the area under the breakthrough curve during the loading and the washing steps, this operation can be easily performed with Unicorn™. mads can be either the mass of protein adsorbed at saturation or the
mass of protein adsorbed at 10% of the maximum BTC height, depending on whether the load step is interrupted at 10% of the BTC height at saturation or it is prolonged until saturation.
The DBC10% can also be calculated from a breakthrough prolonged until
saturation; in this case the previous equation must be corrected in order to keep in consideration the amount of protein that is present in the system dead volume at 10% of the maximum BTC height. Indeed, the washing step is not performed immediately after the BTC reaches the 10% of its maximum height, so at that point some protein occupies the system dead volumes.
The quantity of protein not specifically bounded to the stationary phase can be estimated by multiplying the feed concentration times the system dead volume.
This calculation introduces an approximation, since the concentration of the protein is considered uniform over the entire system and equal to the feed concentration, while, especially in the dead volume of the adsorbent media, it is lower.
48
, % = , % − , % − (2.11)
where Vloaded,10% is the volume of protein solution loaded at 10% of the maximum
BTC height, mlost,10% represents the mass of protein lost at 10% of the BTC height
at saturation, calculated by integration of the area under the curve until the 10% of the maximum BTC height, and Vsys is the total system dead volume. Vsys can
be calculated by loading a solute that is not adsorbed on the stationary phase from one of the buffer lines.
Other important parameters of a chromatographic process are the recovery and the yield:
= (2.12)
= (2.13)
where melu is the mass of protein eluted, mloaded is the mass of protein fed to the
system and the other terms have the meanings previously specified. In the experiments performed, the mass of protein eluted was calculated by integration of the area under the elution peaks.
2.5. Buffers and protein
BSA used in the experiments was purchased from Sigma-Aldrich and had a purity ≥96%. All buffers employed were prepared in our labs; the preparation methods of all solutions employed are described in Appendix I.
![Figure 1.3 - Schematic comparison of the configurations of the membrane adsorbers [12]](https://thumb-eu.123doks.com/thumbv2/123dokorg/8170781.126923/18.892.301.613.510.872/figure-schematic-comparison-configurations-membrane-adsorbers.webp)