PhD Program in Behavioral Neuroscience
Psychobiology and Psychopharmacology
XXXI Cycle
From Parents to Offspring:
Influence of Approaching/Avoidance parental
phenotypes on Progeny
PhD Candidate
Erica Berretta
TUTOR
Prof. Laura Petrosini
MAUDE: […] What flower would you like to be? HAROLD: I don't know. One of these, maybe. MAUDE: Why do you say that?
HAROLD: Because they are all alike...
MAUDE: Oooh, but they are not. Look. See – some are smaller, some are fatter, some grow to the left, some to the right, some even have lost some petals – all kinds of observable differences. You see, Harold, I feel that much of the world’s sorrow comes from people who are this, and allow themselves to be treated as that…
Harold and Maude (1971)
Abstract
Individuals are hardwired to approach pleasure and to avoid negative stimuli. Nonetheless, Approach/Avoidance (A/A) conflict arises when a situation elicits these two opposite drives, simultaneously.
I selected three sub-populations of male and female mice based on their withdrawing, balanced or advancing response to an A/A conflict task (i.e., avoiding (AV), balancing (BA) and approaching (AP) mice). The neuronal substrates sustaining the selected phenotypes were investigated by immunofluorescence methods, focusing on the oxytocinergic modulation (OXT) of dopamine (DA) neurons via oxytocin receptors (OTR), in the ventral tegmental area (VTA). The behavioral consequences of parental phenotypes on the progenies were evaluated.
I found that AP male mice were characterized by a greater number of VTA-DA neurons, enriched in OTR, compared to controls and the AP paternal phenotype was able to bias descendants’ behaviors. Indeed, the offspring of AP fathers were more approaching and faster at the A/A conflict task, more prone towards novel stimuli compared to the offspring of AV fathers, and less anxious compared to controls. Conversely, AV females were characterized by lower VTA-DA cell
density compared to controls,but maternal phenotype did not impact
offspring’s response to A/A conflict. Maternal phenotype effects on progenies were sex-specific, affecting response to novelty only in female offspring and anxiety levels only in males.
Finally, no phenotype effect on spontaneous parental care was observed. On the contrary, AV paternal phenotype influenced pup-retrieval behaviors of fathers and, indirectly, of their female mates, when separated from their pups.
Given abnormal A/A motivation has been recognized in several psychological and psychiatric diseases, investigations on the mechanisms involved in A/A phenotype transmission and the development of transgenerational animal preclinical models are coveted.
Contents
1 Introduction 1
1.1 The Approach/Avoidance conflict 3
1.2 Animal models to investigate the Approach/Avoidance conflict 5
1.3 Oxytocin-dopamine interplay in motivated behaviors 8
2 Rationale 12
3 Materials and methods 15
3.1 Experimental design 15
3.2 Animals and rearing conditions 16
3.3 Behavioral testing 19
3.3.1 Approach/Avoidance Y-Maze 19
3.3.2 Open Field with novel object 21
3.3.3 Elevated Plus Maze 23
3.3.4 Undisturbed Parental care Observation 24
3.3.5 Retrieval test 24 3.4 Biochemical analysis 26 3.4.1 Brain collection 26 3.4.2 Immunofluorescence 26 3.4.2.1 Oxytocin in the PVN 26 3.4.2.2 Dopamine-oxytocin receptors colocalization in the VTA 27
3.4.3 Confocal microscopy acquisition and cell counting 27
3.5 Statistics 28
4 F0 Results 30
4.1 Approach/Avoidance Y-Maze 30
4.3 Elevated Plus Maze 38
4.4 Undisturbed Parental care Observation 42
4.5 Retrieval test 43
4.6 Oxytocin in the PVN 51
4.7 Dopamine in the VTA 53
4.8 Dopamine-oxytocin receptors colocalization in the VTA 56
5 F1 Results 59
5.1 Maternal effect 59
5.1.1 Approach/Avoidance Y-Maze 59
5.1.2 Open Field with novel object 62
5.1.3 Elevated Plus Maze 65
5.2 Paternal effect 68
5.2.1 Approach/Avoidance Y-Maze 68
5.2.2 Open Field with novel object 72
5.2.3 Elevated Plus Maze 74
6 Summary of main F0 and F1 results 78
7 Discussion 82
8 Conclusion and outlooks 88
Bibliography 90
Supplementary materials 105
S1 Antibodies’ details 105
S2 Estrous phase determination 106
S3 Tables 107
S4 Figures 120
List of abbreviations
A/A: Approach/Avoidance AP: approaching AV: avoiding BA: balancing CTR: controls DA: dopamineEPM: elevated plus maze OF: open field with novel object OTR: oxytocin receptors
OXT: oxytocin
PCO: undisturbed parental care observation PVN: paraventricular hypothalamic nucleus pnd: post-natal day
ROI: region of interest THY: tyrosine hydroxylase VTA: ventral tegmental area
1
1 Introduction
Approach and Avoidance (A/A) are the pillars of motivated behavior (Berridge and Kringelbach, 2008; Cornwell et al., 2014; Elliot, 2006; Elliot and Thrash, 2002, 2010; Higgins, 1997). Individuals tend to approach pleasant stimuli and avoid pain and danger, nonetheless some stimuli can exhibit desirable and undesirable features, simultaneously, thus they require a contention between opposite
drives (Berkman et al., 2009; Corr and Krupić, 2017; Ehrlich and
Fasbender, 2017; Lewin, 1935; Miller, 1944; Wilborn et al., 2018). Individual differences in response to A/A motivation occur spontaneously in humans and other animals (Berkman et al., 2009; Laricchiuta et al., 2012 a,b, 2015; Laricchiuta and Petrosini, 2014; Norbury et al., 2015; Petrosini et al., 2017). Some individuals are more willing to take risk for achieving gains while others are more cautious and sensitive to the undesirable aspects of A/A conflict. Such an interindividual variability can represent a boon for the population (Wilson et al., 1994), though approaching/avoidance tendencies can go beyond the functional behavior and become maladaptive, as in many psychological and psychiatric disorders (such as substance use disorders, depression, bipolar disorder and schizophrenia) (Alcaro and Panksepp, 2011; Baskin-Sommers and Foti, 2015; Der-Avakianet et al., 2016; Whitton, Treadway and Pizzagalli, 2015; Wilborn et al., 2018).
The dopaminergic system is strictly involved in A/A responses (Baik, 2013; Ikemoto and Panksepp, 1999; Wise and Rompre, 1989) and anomalies in dopaminergic signaling have been recognized in disorders linked to aberrant motivation (Baskin-Sommers and Foti, 2015; Cardozo Pinto and Lammel, 2017; Comings and Blum, 2000;
2
Di Chiara et al., 2004; Nestler and Carlezon, 2006; Volkow, Wise and Baler, 2017; Whitton, Treadway and Pizzagalli, 2015).
In the recent years, striking evidence has revealed how parental life-events and characteristics may impact descendants across generations (Bohacek and Mansuy 2013, 2015; Franklin et al., 2010; He et al., 2016; Mitchell et al., 2016; Yehuda and Lehrner, 2018; Yeshurun and Hannan, 2018).
Evidence of inter- and trans-generational transmission comes from studies in humans (Mendoza Diaz et al., 2018; Pavlickova et al., 2014), non-human primates (Kinnally et al., 2018), rodents (Sauce et al., 2017; Weber-Stadlbauer et al., 2017), birds (Leroux et al., 2017) and fish (Cavalieri and Spinelli, 2017; Newman et al. 2016). Most studies focused on transmission of trauma and stress (Franklin et al., 2010; Pang et al., 2017; Yehuda and Lehrner, 2018), drug/toxic exposure (reviewed in Bohacek and Mansuy, 2013), or on the intergenerational impact of apparent psychological or psychiatric disorders as anxiety (Gibler et al., 2018), depression (Mikkonen et al., 2016; Ronovsky et al., 2017; Sharp et al., 2014), alcohol use disorder (Long et al., 2018), gambling problem (Dowling et al., 2016). Most of these studies emphasize the importance of parents’ behavior in the transmission of vulnerability across generations, in some cases sex specific, and the increased vulnerability to disease development in children who have both parents exposed to negative psychological/environmental insults.
To date, little attention has been paid to the intergenerational consequence of spontaneous individual differences in approaching or avoidance traits.
3
The present work investigated the neural substrates and behavioral consequences for the progenies of maternal and paternal approaching/avoidance phenotypes, in mice, focusing on the role of dopaminergic neurons in the ventral tegmental area.
Understanding pathways of transmission of approaching/avoidance traits is a compelling challenge both to understand physiological influences from parents to offspring as well as to develop
promotion/prevention/intervention strategies on vulnerable
phenotypes across generations (Anttila et al., Brainstorm Consortium, 2018; Denham, 2018; Gapp et al., 2016; Jiménez et al., 2018; Maciejewski et al., 2018; Zorumski, 1988).
1.1 The Approach/Avoidance conflict
Throughout life, individuals respond to environmental stimuli crucial for wellbeing and survival (e.g., food, mates, danger, competitors). Reactions to salient stimuli are biologically hardwired, species-specific and evolved to promote survival and reproduction (Berridge and Kringelbach, 2008; Higgins, 1997).
Approach and Avoidance (A/A) have been defined as basic motivational systems, virtually present in the whole animal kingdom (Alcaro and Panksepp, 2011). Approach motivation can be described as the energization of behavior by, or the direction of behavior toward, positive stimuli, whereas avoidance motivation as the energization of behavior by, or the direction of behavior away from, negative stimuli (Elliot, 2008; Lewin, 1935).
The idea that individuals seek pleasure and escape from pain, has roots that lie far behind in history (e.g., the ethical hedonism by Democritus of Abdera (460–370 BC)) but still stimulates researches across fields from moral psychology (Janoff-Bulman, Sheikh and
4
Hepp, 2009) and neuroscience (Berridge and Kringelbach, 2008; Higgins, 1997), to behavioral economics (Simon, 1955) and animal welfare science (Fraser and Duncan, 1998).
Approaching positive stimuli (such as food) and avoiding pain and danger (such as being preyed) is so fundamental that the dedicated brain structures have very remote phylogenetic development and are maintained through many species, including invertebrate animals (Gray et al., 2005; Huber et al., 2011; Tinette et al., 2007; reviewed in Alcaro and Panksepp, 2011) up to mammals and other vertebrates (Fidler et al., 2007; Molina-Borja and Gómez-Soutullo, 1989; Panksepp, 1981).
Nonetheless, approach and avoidance are not a so simple matter. One motive can be direct toward two or more different positive stimuli simultaneously (i.e., approach/approach conflict) or away from two or more negative stimuli (i.e., avoidance/avoidance conflict). Moreover, the same situation can drive two different motives, unsolvable together (i.e., approach/avoidance conflict) (Arkoff, 1957; Claes et al., 2016; Ehrlich and Fasbender, 2017; Lewin, 1935). When a stimulus or a situation exhibits both desirable and aversive features simultaneously, A/A conflict arises, opposite drives collide, and the chance of eliciting of individual differences is revealed. Individual differences in response to A/A conflict occur within species with certain animals more willing to take risk to achieve their goals and others more risk-averse in their behaviors (Wilson et al., 1994). The variability could be evolutionarily befitting, but aberrations in the elaboration of aversive or rewarding stimuli and defective responses to conflict can interfere with goal-directed behavior. This has been associated with clinical observations (e.g., withdrawal from potential
5
rewards to avoid even potential negative outcomes, common in clinical anxiety and depressive disorders (Aupperle and Paulus, 2010; Kash et al., 2002; Muris et al., 2001) or approach of rewarding stimuli despite the negative consequences in drug abuse and gambling disorders (reviewed in Brevers et al., 2013; Cox et al., 2017)).
Sensible progress has been recently made to unravel the neuronal circuits and neurotransmitters involved in A/A behaviors.
The endocannabinoid system is implicated in individual differences in A/A behaviors through amygdaloid-hypothalamic-striatal and striatal-cerebellar networks, (Laricchiuta et al., 2012 a,b, 2014, 2016; Laricchiuta and Petrosini, 2014). Further, cerebellar levels of brain-derived neurotrophic factor (BDNF) have been linked to approaching exploratory behaviors (Laricchiuta et al., 2018).
Moreover, the mesolimbic and mesocortical dopaminergic systems, of which the ventral tegmental area (VTA) is the starting point, are closely involved in the responses to positive and negative stimuli and their conflict (Bromberg-Martin et al., 2010; Cardozo Pinto and Lammel, 2017; Cohen et al., 2012; Ikemoto, 2010; Lammel et al., 2012; Moriya et al., 2018; Nieh et al., 2015; Qi et al., 2016; Verharen et al., 2018; You, Vandegrift and Brodie, 2018).
1.2
Animal
models
to
investigate
the
Approach/Avoidance conflict
In humans, A/A tendencies are inferred by several tasks, including self-report questionnaires (Aupperle et al., 2011; Kirlic et al., 2017). For instance, among the Big Five (Dyce, 1997), Extraversion trait has been linked with approach-oriented goals and Neuroticism has been linked with avoidance-oriented goals (Smits and Boeck, 2006).
6
Prolific efforts to identify the neural substrates of such personality dimensions have been made by using neuroimaging approaches in humans (Gonen et al., 2016; Norbury et al., 2015; Petrosini et al., 2015, 2017).
Yet, starting from the seminal work of Olds and Miller (1954) on rat brain, decisive discoveries on the circuits involved in the response to positive and aversive stimuli, have been achieved by using animal models.
Several behavioral protocols have been developed to investigate reactions to A/A conflict in animals (Kirlic et al., 2017). Most paradigms combine reward delivery and punishment, for instance by means of food and electrical shock administration, simultaneously (e.g., Neil Miller conflict situation (1937, 1944), or by learned/punished responses (i.e., conditioned operant conflict tests) (Vogel et al., 1971).
Many attempts have been made to characterize A/A individual differences also using selective breeding in rats (e.g., Roman Low (RLA) and High (RHA) Avoidance rats selected for their extremely slow or rapid acquisition at the active-passive avoidance task; reviewed in Brush, 1991; Giorgi, Piras and Corda, 2007; Steimer and Driscoll, 2003; Steimer, la Fleur and Schulz, 1997).
Mouse models also, had demonstrated their suitability for causative study on the role of DA in motivation psychopathologies (Armario and Nadal, 2013; Bergamini et al., 2016; Young et al., 2011).
Among rodents, the use of inbred strain has grown over time (Casellas, 2011; Festing, 1979) and individual differences in response to A/A conflict have been demonstrated to occur even
7
within inbred strains (Laricchiuta et al., 2012 a,b, 2016, 2018; Pittaras et al., 2013, 2016).
In fact, although inbreeding guarantees a negligible genetic variability, inbred mice are far from exhibiting absolute isogeneity and behavioral uniformity (Gruneberg, 1954).
By using an A/A conflict task (the A/A Y-Maze, based on the conflict between appetitive drive toward palatable food and withdrawal drive away from an aversive environment) Laricchiuta and colleagues (Laricchiuta et al., 2012 a,b, 2016, 2018) studied spontaneous individual differences in A/A behaviors in inbred mice.
By means of this “ethological and unpunished” task the authors demonstrated that responses to A/A conflict are normally distributed within the population and detected three sub-populations of inbred C57BL/6JOlaHsd male mice. Balancing (BA) mice react to the conflict with balanced responses and represent the mean of the sample distribution; Approaching (AP) mice respond with advancing responses toward the positive stimulus despite the negative characteristics of environment; Avoiding mice (AV) react withdrawing the negative component of the conflict (Fig. 1).
8 Fig. 1 Normal distribution of approaching/avoiding phenotypes in inbred mice. The image represents the distribution of avoiding (AV), balancing (BA) and
approaching (AP) mice within the population. BA mice represent the mean of the distribution while AV and AP mice are positioned at -2 and +2 standard deviations from the mean, respectively.
1.3
Oxytocin-dopamine
interplay
in
motivated
behaviors
The dopaminergic (DA) system has a special place in motivation (Goto and Grace, 2005; Baik, 2013; Di Chiara et al., 2004; Nestler
and Carlezon, 2006; Volkow, Wise and Baler, 2017¸ Wise and
Rompre, 1989). In vertebrates, dopamine-producing nerve cells are located in discrete brain areas, mainly in the VTA and substantia nigra pars compacta (SNc) but affect extended brain circuits via widespread efferents. The VTA neurons receive input from the hypothalamus, raphe, ventral pallidum, striatal regions, globus pallidus, laterodorsal tegmentum and lateral habenula (Lammel et
9
al., 2012) and project to the nucleus accumbens (NAc) and medial prefrontal cortex (mPFC) (i.e., the mesocorticolimbic pathway), mediating motivated behaviors (Cohen et al., 2012; Lammel et al. 2012; Moriya et al., 2018), as well to other areas such the amygdala and hippocampus, facilitating emotional memory (Alcaro and Panksepp, 2011) (Fig. 2). Furthermore, SNc DA neurons project to the dorsal striatum (i.e., nigrostriatal pathway), mediating the control of motor function.
Fig. 2 The VTA dopaminergic system. Figure shows the main brain areas
involved in dopaminergic transmission and motivated behaviors. (From bottom to top) ventral tegmental area (VTA); lateral mammillary body (LMB); lateral hypothalamus (LH); basolateral amygdala (BLA); hippocampal complex (HC); lateral septum (LS); central nucleus of amygdala (CeA); medial nucleus of the amygdala (MeA); bed nucleus of stria terminalis (BNST); olfactory tubercle (OT); ventral pallidum (VP); nucleus accumbens (Nacc); anterior cingulated cortex (ACC); prefrontal cortex (pFC). (Image adapted from Alcaro, Huber and Panksepp, 2007)
10
In turn, the DA transmission is influenced by neurotransmitters (e.g., endocannabinoid and endogenous opioid system), hormones and microglia (reviewed in Fuxe et al. 2015; Laricchiuta et al., 2014; Nash, 2017; Wenzel and Cheer, 2018; Yoest et al., 2018).
Recently, the oxytocin (OXT), a neuropeptide classically linked with pregnancy, lactation, maternal care and pair bonding (Lee et al., 2009; Mitre et al., 2016; Numan and Young, 2016), has been recognized to play a role in mediating VTA dopaminergic transmission via oxytocin receptors (OTR) (Love, 2014; Peris et al., 2017; Xiao et al., 2017).
OXT is mainly synthesized within the paraventricular nucleus (PVN) and the supraoptic nucleus (SON) of the hypothalamus and, from PVN, OXT-neurons send projections to extrahypothalamic regions including the VTA and the nucleus accumbens. In fact, the activation of OXT stimulates the mesocorticolimbic pathway and enhanced DA levels in the nucleus accumbens have been detected after OXT infusion in the rats’ VTA (Melis et al., 2007; Shahrokh et al., 2010). Electrophysiological studies in mice confirmed that both the application of oxytocin and optogenetic stimulation of OXT terminals lead to increased DA neuron activity in the VTA (Xiao et al., 2017). Peris and colleagues by using OTR-Cre mice Tg(Oxtr-cre)ON66Gsat/Mmucd expressing Cre-recombinase under the control of the promoter for the OTR gene, identified OTR-expressing VTA neurons projecting to nucleus accumbens, prefrontal cortex and extended amygdala (Peris et al., 2017).
Together these findings provide evidence for a role of the oxytocinergic regulation in midbrain DA systems. Further studies will be necessary to understand the mechanistic interplay and function
11
of this modulation inspired by the intriguing hypothesis that OXT and DA can cooperate to refine the response to salient environmental stimuli (Xiao et al., 2017).
12
2 Rationale
Individuals are not all equal in facing A/A conflict (Gonen et al., 2016; Laricchiuta et al., 2012 a,b, 2016, 2018; Laricchiuta and Petrosini, 2014; Norbury et al., 2015; Pittaras et al., 2013, 2016).
The sensitiveness to positive and negative salient stimuli varies within the population and the functionality of the DA system has proved to have a special role in sustaining individual differences in motivated behaviors both in physiological and in pathological conditions (Baik, 2013; Baskin-Sommers and Foti, 2015; Cardozo Pinto and Lammel, 2017; Comings and Blum, 2000; Di Chiara et al., 2004; Ikemoto and Panksepp, 1999; Nestler and Carlezon, 2006; Volkow, Wise and Baler, 2017; Whitton, Treadway and Pizzagalli, 2015; Wise and Rompre, 1989).
Recently, the intergenerational impact of apparent psychological or psychiatric disorders linked to aberrant DA signaling as depression (Mikkonen et al., 2016; Ronovsky et al., 2017; Sharp et al., 2014), alcohol use disorder (Long et al., 2018) and gambling problem (Dowling et al., 2016) has been strictly demonstrated. These studies evidenced that the children of parents with a psychopathology are more likely to develop the same disorder themselves or otherwise are vulnerable to the development of problems related to it (Maciejewski et al., 2018).
Several lines of evidence suggest that neuronal and psychological anomalies, featuring such disorders, can be present before the patent expression of the disease (Alcaro and Panksepp, 2011; Bardo et al., 1996; Khantzian, 2003; Panksepp, 2010). For instance, some individuals characterized by extreme exploratory/foraging/seeking
13
dispositions are more susceptible to the development of substance use disorders (Alcaro and Panksepp, 2011; Panksepp, 2010). Despite the importance of investigating these vulnerability factors in depth for intervening in advance, to date only few studies have focused on the variations of A/A behaviors and of the respective neuronal substrates in the healthy population (Bradberry et al, 1991). Even less attention has been paid to the intergenerational consequence of spontaneous individual differences in A/A traits. The present Thesis work aimed to investigate in a mouse model the transmissibility and possible VTA-DA association of maternal and paternal A/A behavioral phenotypes in mice, by using an individual difference-based approach and by segregating individuals based on the response to an “ethological and unpunished” conflict task (Campos, 2013), namely selecting AV, BA and AP individuals (Laricchiuta et al., 2012 a,b, 2016, 2018; Laricchiuta and Petrosini, 2014).
Given that males and females neurobiologically and behaviorally differ (Palanza and Parmigiani, 2017; Wald and Wu, 2010), as demonstrated also in mice with attention to avoidance, approach-related exploratory behaviors, and attribution of incentive salience to reward cues (Carreira, 2017; Dickson et al., 2015; Yokota et al., 2017), I firstly investigated sex-difference in AV, BA and AP male and female mice.
Secondly, I formed breeding couples with AP/BA/AV mothers mated and reared with BA males (Maternal effect) and AP/BA/AV fathers mated and reared with BA females (Paternal effect) and evaluated phenotype effects on biparental care and pup-retrieval behaviors. As OXT has been linked both to maternal care and retrieval and to the
14
regulation of midbrain DA systems, the number of OXT neurons in the PVN and the OXT modulation of DA neurons via OTR, in the VTA of AV, BA and AP male and female mice were evaluated by immunofluorescence methods.
Finally, I assessed intergenerational outcome of the parental phenotype on the offspring’s response to A/A conflict, exploratory behaviors, response to novelty and anxiety, all behaviors previously linked to A/A tendencies.
15
3 Materials and methods
3.1 Experimental design
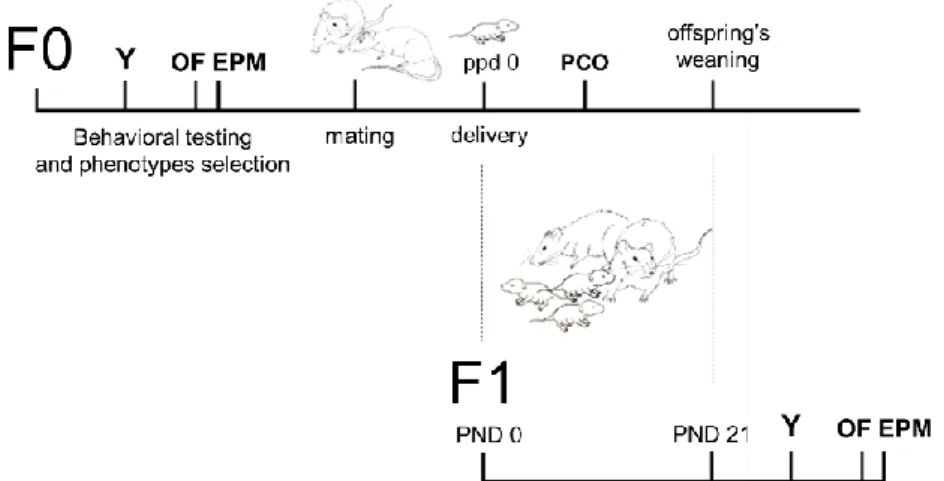
The study evaluated two generations of mice: parents (F0) and offspring (F1) (Fig.3).
To arrange the F0, male and freely cycling female C57BL/6JOlaHsd mice were tested at post-natal day (pnd) 35-40 at the A/A Y-Maze to select AV, BA and AP mice (Laricchiuta et al., 2012 a,b, 2016, 2018). Responses to novelty, exploratory and anxiety-like behaviors were investigated in adult AV, BA and AP mice (pnd 55-65) by the Open Field with novel object (OF) and Elevated Plus Maze (EPM).
After the behavioral testing, mice were coupled based on their phenotypes and used for breeding the F1 generation (see paragraph 3.2 for details on phenotypic assortments of couples and sample size).
At offspring’s pnd 3, 30-min undisturbed parental care (PCO) observation was performed to evaluate time spent contacting the litter by dams and sires.
At weaning (pnd 21) the offspring was separated from parents and arranged in same-sex cages. Dams and sires remained caged together for a second and a third mating.
The response of mothers and fathers to pups’ separation was evaluated by the pup-retrieval test (RTV) at pnd 6 of the second litter. Finally, at pnd 6 of the third litter, brains of mothers and fathers were collected and processed for immunofluorescence staining for OXT in the PVN and OTR/DA colocalization in the VTA.
The entire first litter born to each different couple was used for the behavioral characterization of the F1 by the A/A Y-Maze task at pnd
16
35-45 and the OF and EPM in adulthood. After testing animals were sacrificed and brain collected and stored for biochemical analysis.
Fig. 3 Timeline of the experimental design. Schematic representation of the
main experimental steps. Generation of parents (F0); Offpsring’s generation (F1); Approach/Avoidance Y-Maze (Y); Open Field with novel object (OF); Elevated Plus Maze (EPM); post-partum day (ppd); post-natal day (pnd); undisturbed parental care observation (PCO).
3.2 Animals and rearing conditions
219 C57BL/6JOlaHsd 21-day old mice (100 females) were purchased by ENVIGO (Netherland). Animals were arranged 4/5 per cage (standard cages with bedding sawdust and house supplementation: nesting material and a “Mouse House™” as refuge (Sherwin, 2007; Wirz et al., 2015) and reared according to the European Directive 2010/63/EU and Italian D.L. 26/2014 and to the Federation of European Laboratory Animal Science Associations’ guidelines and recommendation for rodents.
Mice were kept under a 12-h light/dark cycle (lights on at 07:00 am), controlled temperature (22-23 °C), and constant humidity (60 ± 5%),
17
with water and food (Mucedola 4RF21, Italy) ad libitum. Cages were cleaned twice a week.
Mice were identified using the non-invasive temporary identification method of tail-coloring (Dahlborn et al., 2013). Given the well-known stress effect of bedding change (Gray and Hurst, 1995), no cage-cleaning during behavioral tests was made.
Starting from the initial sample of 219 animals, 46 subjects (50% females) were selected according to their AV, BA and AP phenotypes. Namely, 4 AV, 13 BA and 6 AP males; 3 AV, 16 BA and 4 AP females. Selected animals were tested at the OF and EPM in adulthood and then used as F0 for breeding the F1.
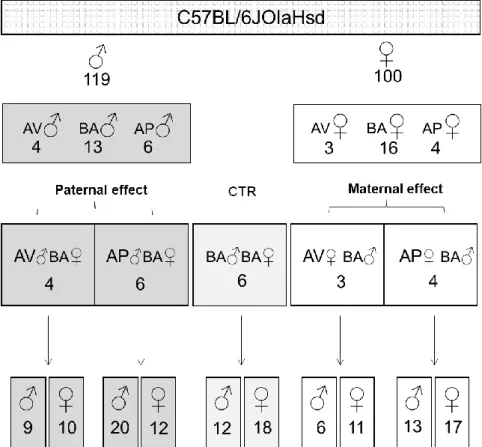
Precisely, 23 couples have been set up to obtain different phenotypic assortment:
▪ BA♀♂: both BA mother and father; N=6
(used as controls, properly the contrast group CTR) ▪ AV♂BA♀: AV father paired with BA mother; N=4 ▪ AP♂BA♀: AP father paired with BA mother; N=6 ▪ AV♀BA♂: AV mother paired with BA father; N=3 ▪ AP♀BA♂: AP mother paired with BA father; N=4
Each couple (one male and one female) was placed in a standard cage and reared as previously described, and remained together for mating, during gestation and delivery and until offspring’s weaning (pnd 21).
To note, those monogamous and biparental rearing conditions were similar to the breeding condition provided by the company where the animals were purchased (ENVIGO).
18
The entire first litter born to each different couple was used for the behavioral characterization of the F1.
Litters with less than 2 animals per sex were excluded from the experiment. Finally, I included 128 F1 animals (68 females) born to 3-6 different couples for each phenotypic assortment (Fig. 4).
Fig 4. Experimental groups. Schematic representation of the groups used in the
experiment. C57BL/6JOlaHsd mice were used.Males (♂); Females (♀); avoiding (AV), balancing (BA); approaching (AP) mice; control group (CTR) (properly, the F1 contrast group); AV father paired with BA mother (AV♂BA♀); AP father paired with BA mother (AP♂BA♀); both BA mother and father (BA♂BA♀); AV mother paired with BA father (AV♀BA♂); AP mother paired with BA father (AP♀ BA♂). Numbers indicate relative sample size.
19
3.3 Behavioral testing
All behavioral tests took place during the light phase (10:30 am - 04:00 pm) in a slightly lit and silent behavioral room. Each apparatus used was cleaned thoroughly with 30% ethanol and dried before and after each trial to remove scent cues.
3.3.1 Approach/Avoidance Y-Maze
The A/A Y-Maze task allows to detect individual differences in response to an A/A conflict. Namely, animals can advance or withdraw the conflicting salient stimulus or react with balanced response (Laricchiuta et al., 2012 a,b, 2014, 2018; Laricchiuta and Petrosini, 2014).
Fig 5. Approach/Avoidance Y-Maze. Figure shows
the Y-shaped apparatus used for the A/A Y-Maze task. The maze is made of three arms (each 8x30x15 cm) and is provided with black and white removable walls and floors that allow to set up one black arm and one white arm, alternately.
Apparatus: The A/A Maze consists of a Y-shaped apparatus made of three plexiglass arms (each 8x30x15 cm). The starting arm is gray-colored and is divided from other two arms by a T-guillotine gray door (Fig. 5). One of the two remaining arms (arranged at an angle of 90° to each other) has black and opaque walls and floor, the other one has white walls and floor and is lighted by a 16-W neon lamp (the aversive arm). At the end of each arm there is a food tray (3 cm in diameter, 1 cm deep). Apparatus’ walls, floors and the lamp are exchangeable to alternate the spatial position of the white and black arms among trials.
20 Fig 6. Approach/Avoidance Y-Maze procedure. Figure shows the A/A Y-Maze
procedure. One week after 3-days exposition to the novel palatable food, 3-day of testing interspersed with slight food deprivation.
Procedure: A week before the behavioral testing the animals were exposed to the palatable food (Fonzies, KP Snack Foods, Munchen, Germany) in their home cages for three consecutive days, to get them used with the novel food later used for the test. The A/A Y-Maze procedure lasted three days and consisted of a habituation phase (day 1) and two 10-trial-sessions: Session 1 (S1, day 2) and Session 2 (S2, day 3).
The habituation phase comprised 10-min-free exploration of the maze. All arms of the apparatus were opened, and no food was present in the food trays. After the habituation and 12 hours before the beginning of the S1, the animals were slightly food deprived by limiting food access.
The S1 consisted of 10 trials with 1 min-inter-trial interval. The animal was placed in the starting gray arm and chose to enter one of the two arms, both containing the same standard food. At the end of each trial food was always replaced.
During the S2, starting 24 h after S1, the A/A conflict was generated rewarding the white arm with the palatable food (Fonzies), while the black arm was still rewarded with the standard food. Again, the animal chose to enter one of the two arms, for 10 trials (Fig. 6).
21
Notably, the A/A Y-Maze allowed to exhibit two different behaviors: reaching the palatable reward despite the aversive environment or avoid the conflict reaching standard food placed in a reassuring environment.
Behavioral parameters: Number of white arm choices in S1 and S2 (an arm entry was defined as four paws entering one of the arms); latency to enter in the white arm (seconds); A/A conflict index (Δ of white arm choices): the number of S2 white arm choices minus the S1 white arm choices.
As in females it has been shown that some approaching behaviors (e.g. drug- or palatable food-related approach) may be influenced by the estrous cycle (Egan et al., 2018; Kerstetter et al., 2013), vaginal smears were collected to evaluate influences of estrous on behavioral performances (see Supplementary materials).
3.3.2 Open Field with novel object
The Open Field (OF) is a widely used test for assessing exploratory behavior, general activity and anxiety levels in rodents (Campos et al., 2013; Gould, Dao and Kovacsic, 2009; Prut and Belzung, 2003). The OF procedure used allowed also to assess reaction to novelty, placing a novel object in the center of the arena during an additional second session (S2) (Kazvauckas, 2005; Laricchiuta et al., 2012a).
22 Fig 7. Open Field with novel object. Figure shows the Open Field apparatus. A
circular arena (60 cm) is surrounded by 20-cm high walls. A 6-cm peripherical anulus and an arena center (10.5 cm) are virtually defined on the arena surface (highlighted in green). In the second session a novel object (the cone highlighted in green) is place in the arena center.
Apparatus: The Open Field apparatus consists of a circular arena (diameter 60 cm) delimited by a pale gray 20 cm-high wall. It is possible to define upon the apparatus different zones of interest: a 6cm peripheral anulus and a 10.5-cm arena center.
A novel object (a gray plastic cone: 10x6 cm; base diameter =9.5 cm) was used in the S2 and placed at the center of the arena (Fig. 7). Procedure: In S1, a single animal was allowed to explore the empty open field. In S2, the novel object was positioned in the arena center and the animal was placed again in the open field. Sessions lasted 10 minutes with a 5-min inter-session interval (Laricchiuta et al., 2012a). The whole testing was recorded by a video camera and processed by a behavioral analysis software (EthoVision, Noldus, Wageningen, The Netherlands). The contact with the novel object in S2 was also recorded with a second camera and manually scored by using Noldus EthoVision XT 7.1.
Behavioral parameters: S1 percentage of total distance traveled in the peripheral annulus and arena center, total distance travelled in
23
the arena (cm), mean velocity (cm/sec); S2 duration (sec), frequency (number) and latency (sec) of contact with the novel object. The contact with object was considered when the mouse snout touched the object, or when it sniffed the object for at least 1 sec.
3.3.3 Elevated Plus Maze
The EPM is used in rodents to assess anxiety levels (Hogg, 1996; Lister, 1987).
Fig. 8 Elevated Plus Maze. Figure shows the
EPM apparatus. The apparatus consists of four arms (30x5 cm) starting from a central 5x5 squared region, two arms are opened, and two arms are enclosed by 15 cm high walls. The maze is 90 cm elevated from the floor.
Apparatus: EPM apparatus is a cross-shaped wooden structure with four 30x5 cm arms extending from a central (5x5 cm) region. The maze is 90 cm raised above the ground. North and south arms were open, east and west arms were enclosed by 15 cm high walls (Fig. 8).
Procedure: Single 5-minutes videotaped exposition to the elevated maze (Laricchiuta et al., 2012a).
Behavioral parameters: Time spent in the open and closed arms (sec) and arm visit frequency (number).
Duration and frequency were manually scored by using Noldus EthoVision XT 7.1.
24
3.3.4 Undisturbed Parental care Observation
The protocol for the undisturbed parental care observation was adapted from Orefice and Heinrichs (2007).
Procedure: On pnd 3/4, between the 02:00-03:00 pm, biparental care behaviors of mice were videotaped in their home cage for 30 consecutive minutes. The father was colored on the back and on the tail for identification during the scoring phase. The cage with animals was placed on a cart inside the animal facility 3 hours before the recording to allow acclimatization.
Behavioral parameters: Time spent in pup-directed behaviors (sec) were scored for mothers and fathers, separately by using the Noldus EthoVision XT 7.1 software.
3.3.5 Retrieval test
Retrieval is a specific behavior consists in returning separated pups to the nest by carrying them in the mouth, burrowing under sawdust, to arrange the nest.
At pnd 6 a retrieval test was done for mother and father separately (Liu et al., 2013).
Procedure: The house supplementation was removed from the home cage to leave inside only parents with pups and the bedding nest. After 3 hours room- acclimatization parents were separated from pups for 10 min, placed in a cage with clean sawdust, located near the home cage. Three pups were selected (mix-sex and with milk spots, when possible) and gently placed at the opposite corner of the nest, immediately before the 10-min separation ended. Then the mother was placed in the home cage on nest-side and the latency to reach separated pups at the opposite corner and to retrieve all separated pups to the nest were measured (Fig. 9). The protocol
25
lasted 10 min, videotaped, and maternal pup-directed behaviors, digging, self-grooming and rearing were manually scored by Noldus EthoVision XT 7.1.
Fig. 9. Retrieval test. Figure shows
pup-retrieval behavior at the RTV test. Three pups were separated from the nest and located at the opposite corner of the cage.
At the end of the test the mother was placed again in the clean cage and the entire procedure was repeated with the father.
26
3.4 Biochemical analysis
3.4.1 Brain collection
Animals were sacrificed by decapitation. Brains were rapidly collected and post-fixed overnight by 4% paraformaldehyde fixative in 0.1M phosphate buffer (pH 7.4). Afterward, brains were equilibrated in a 30% sucrose phosphate buffer, frozen with dry-ice and stored at -80°C until staining. Brains were cut in 40 µm thick coronal sections with a freezing microtome. Regions of interest (ROI) were identified by Franklin and Paxinos brain mouse atlas (Franklin and Paxinos, 1997).
The ROI considered were:
▪ paraventricular nucleus of the hypothalamus (PVN) from -0.82 to -0.06 in relation to bregma
▪ ventral tegmental area (VTA): from -2.92 to -3.16 in relation to bregma
3.4.2 Immunofluorescence
PVN coronal sections were stained for OXT and VTA coronal sections were double-stained for OTR and DA (properly for tyrosine hydroxylase) to measure OTR-DA colocalization (details of the antibodies used for immunofluorescence staining are reported in Table 1S).
3.4.2.1 Oxytocin in the PVN
Brain slices were permeabilized with 0.3% Triton X-100 in PBS for 10 min. To saturate the non-specific sites where then incubated in a blocking solution containing 3% normal donkey serum (NDS) in 0.3% Triton X-100 in PBS for an hour. Afterwards, they were incubated in a blocking solution containing a mouse monoclonal anti-oxytocin
27
antibody (1:1000, clone OT-NP, PS38, a generous gift from Dr. Hal Gainer, NIH, Bethesda MD USA) for 16-18 h at room temperature. To visualize the primary antibody, donkey secondary antibodies conjugated to Cy2 against mouse were used (Jackson Immunoresearch, West Grove, USA; 1:200 in PBS). Nuclei were observed incubating sections with Hoechst (1:500).
3.4.2.2 Dopamine-oxytocin receptors colocalization in the VTA Brain slices were pretreated with 0.1% Triton X-100 in PBS for 10 min, then blocked in 1% bovine serum albumin (BSA) in 0.1% Triton X-100 in PBS for an hour. Afterwards, they were incubated in a blocking solution containing mouse anti-tyrosine hydroxylase (1:700, MAB318, Millipore) and rabbit anti-oxytocin receptors (1:1000, AVR-013, Alomone lab) antibodies for 16-18 h at room temperature. To visualize the primary antibodies, donkey secondary antibody conjugated to Cy2 against mouse and goat secondary antibody
conjugated to Cy5 against rabbit were used (Jackson
Immunoresearch, West Grove, USA; 1:200 in PBS). Nuclei were observed incubating sections with Hoechst (1:500).
3.4.3 Confocal microscopy acquisition and cell counting Digital pictures of brain slices were captured with a confocal microscope (20x magnification for OXT and THY; 40x for OTR). Cell counting was performed using the open access ImageJ 1.41n (Wayne Rasband, National Institute of Health, USA). Four bilateral slices per subject were counted for OTX and THY, using the ImageJ
plug in for Particle Analysis. Results express cell density (cell/mm2).
Three cells/slice were counted for OTR. Results express receptorial density (receptor/mm2).
28
3.5 Statistics
The R free software environment for statistical computing and graphics was used. (R Core Team; 2017). Graphs were generated
by using R basic tools and ggplot2 package1 (Wickham, 2016).
Prior to statistical analysis a data screening was led using graphical inspections, looking for outliers, points of high influence and missing data that could bring to misinterpret results.
To compare the A/A conflict index sample distributions in F0 males and females and in F1 offspring, Kolmogorov-Smirnov tests were performed (Conover, 1971; Marsaglia et al., 2003). Additionally, the Bhattacharyya coefficient (Bhattacharyya, 1943) was used to calculate the probability of overlap between males and females’ distributions.
To evaluate influence of the estrous cycle on behavioral performances at the A/A Y-Maze, an analysis of variance considering the cycle phase as independent variable was run on 83 females (17 missing data from the initial sample).
Parametric t-tests were run on the initial sample (N=219) to compare males and females’ latency at the A/A Y-maze. After phenotypes selection (N=46) Kruskal Wallis and Mann-Whitney-Wilcoxon non-parametric analyses were used for comparing selected groups
1 F0 results in which male and female mice are compared are shown in bordered
graphs with grid background; Results on dams and maternal effects are shown in graphs with white background; Results on sires and paternal effects are shown in graphs with gray background; Offspring’s sex is highlighted by respective symbols on the top of graphs’ legends (male offspring: ♂; female offspring: ♀).
29
(Sinclair, 1988). Sex and phenotype effects were investigated for each behavioral and neurobiological parameter.
Before analyzing the results on the F1 I checked by Kruskal Wallis tests that the litters born to the couples selected, belonging to the same phenotypic assortment, were not significantly different from each other, thus ensuring that there was not a significant effect of a single breeding pair in pulling the results.
30
4 F0 Results
Graphs with grid-background indicate data of male and female mice; graphs with white background indicate data of female mice; graphs with gray background indicate data of male mice. Asterisks on graphs indicate significant p-values (* p ≤ .05; ** p ≤ .01; *** p ≤ .005; **** p ≤ .001).
4.1 Approach/Avoidance Y-Maze
219 mice (100 females) were evaluated at the A/A Y-Maze for phenotype categorization. Mean values and standard deviations of the parameters considered are reported in Table 2S.
WHITE ARM CHOICES
Kolmogorov-Smirnov tests showed no sex effect on the number of white arm choices made by males and females in both S1 (D = 0.077395, p = .900) and S2 (D = 0.035882, p = 1).
During the S1, when both black and white arms were reinforced with standard food, mice preferred the black arm, as demonstrated by the higher number of visits in the black arm compared to the visit in the white arm (7 in the black arm vs. 3 in the white arm on average). In the S2, when the white arm was reinforced with palatable food, the number of white arm choices significantly increased in respect to the S1 (D = 0.14612, p = .018).
WHITE ARM LATENCY
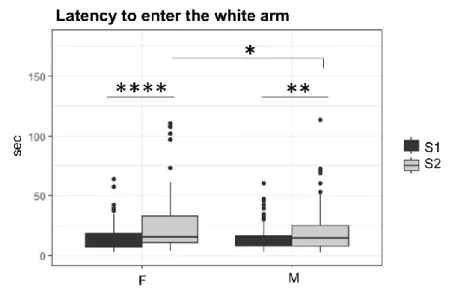
The latency to enter the white arm significantly increased from S1 to S2 in both male (t = 2.5913, df = 194.9, p = .010) and female (t = -3.6958, df = 147.17, p = .0003) mice. No sex effect on latency was found during the S1 (t = -0.94625, df = 195.37, p = .345).
31
Notably, females were significantly slower than males during the S2 (t = -2.3278, df = 174.7, p = .021) (Fig. 10).
Fig 10. Latency to enter the white arm. Boxplots indicate females (F) and males’
(M) latency to enter the white arm (seconds) during the Session 1 (S1) and Session 2 (S2) of the A/A Y-Maze.
A/A CONFLICT INDEX
The male and female distributions of the A/A conflict index 98% overlapped (Bhattacharrya coefficient = .985; Fig. 11) and Kolmogorov-Smirnov test confirmed that males and females were not statistically different (D = 0.047227, p = .999).
Both male and female samples approximated the normal distribution and reproduced values previously described in males by Laricchiuta and colleagues (Laricchiuta et al., 2012 a) (Table 1).
32 Table 1. Frequencies of AV, BA and AP phenotypes in male and female mice.
Table shows the relative frequencies of avoiding (AV), balancing (BA) and approaching (AP) phenotypes in males (♂) and females (♀). Values are expressed in percentage (%). Remaining animals (to reach the 100%) were at ± 1 standard deviation from BA mice and were not included in this experiment.
AV BA AP
♂ 9 % 49 % 7 %
♀ 5 % 48 % 8 %
Fig. 11: Approach/Avoidance conflict index. Density plots indicate the
distributions of the Approach/Avoidance (A/A) conflict index in males (M, green) and females (F, pink). Abbreviations indicate the location on the curve of avoiding (AV), balancing (BA) and approaching (AP) mice.
33
According to these distributions the phenotypes of interest were selected within males and females.
Namely, I selected
- BA mice whose behavioral performances represented the mean of the distribution (controls, CTR);
- AV mice whose behavioral performances fell almost 2 standard deviation under the mean of the distribution;
- AP mice whose behavioral performances fell almost 2 standard deviations upon the mean (Fig. 11). The descriptive analysis of the A/A conflict index is reported in Table 2.
Table 2: Approach/Avoidance conflict index. Table shows the descriptive
analysis of the Approach/Avoidance (A/A) conflict index in male (♂) and female (♀) mice2.
A/A conflict index ♂ ♀
Mean 0.47 0.40
st dev 1.77 1.56
se 0.16 0.16
skew -0.05 -0.19 kurtosis 0.27 0.02
No significant effect of cycle phase on female A/A conflict index was found (see S2, Supplementary materials).
2 From top to bottom (rows): Mean value (Mean); standard deviation (st dev);
standard error (se); skewness index (skew) (index of symmetry, = 0 for normal distribution); kurtosis (0 for mesokurtic distribution).
34
PHENOTYPE EFFECT
After the selection of phenotypes of interest (i.e., AV, BA, AP mice), data were analyzed considering phenotype as grouping factor within each sex-group.
The animals used for coupling and breeding the F1 generation were included in the analyses.
To balance the groups’ sample size, only the BA animals that formed
the BA ♀♂ couples (CTR) were included, while those used for the
couplings with AV and AP mates were excluded. Thus, I analyzed 16 males (4 AV, 6 BA, 6 AP) and 13 females (3 AV, 6 BA, 4 AP). WHITE ARM LATENCY
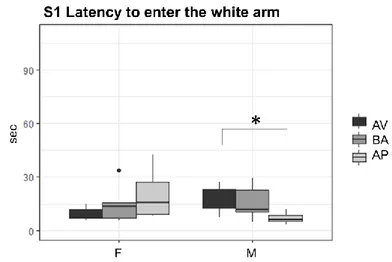
Kruskal-Wallis analyses showed no significant phenotype effects on S1 latency both in male (H = 5.4345, df = 2, p = .06) and female (H= 1.6099, df = 2, p = .447) mice.
Nevertheless, Mann-Whitney-Wilcoxon (W) planned comparisons showed that AP males were faster in entering the white arm during the S1 compared to AV (W = 2, p = .038) but not BA (W = 7, p = .092) males (Fig. 12). No significant differences were found between AV and BA (W = 10, p-value = .748) male mice.
35 Fig 12. S1 Latency to enter the white arm. Boxplots indicate latency (seconds)
to enter the white arm in avoiding (AV), balancing (BA) and approaching (AP) female (F) and male (M) mice during the Session 1 (S1).
No phenotype effect on S2 latency was found in males (H = 3.3088, df = 2, p = .191) and females (H = 1, df = 2, p = .606) (Fig. 13). Mean values and standard deviations are reported in Table 3S.
Fig 13. S2 Latency to enter the white arm. Boxplots indicate latency (seconds)
to enter the white arm in avoiding (AV), balancing (BA) and approaching (AP) female (F) and male (M) mice during the Session 2 (S2).
36
No sex effects were found comparing AV, BA and AP males and females by Mann-Whitney-Wilcoxon tests. Mean values, standard deviations and non-significant p-values are reported in Table 3S and Table 4S.
4.2 Open Field with novel object
Results on the OF behavioral parameters related to anxiety levels showed no sex effects. Male and female mice did not differ for the percentage of time spent in the periphery (W = 106, p = .948) and center (W = 116, p = .619) of arena during the S1.
Nevertheless, in S1 males and females were different in parameters linked to general locomotor and exploratory activity as distance traveled (W = 54, p = .028) and mean velocity (W = 44, p = .007). Namely, males travelled more distance and were faster than females (Fig. 14 and Fig. 15). Mean values and standard deviations are reported in Table 2S.
Fig. 14 Distance traveled. Boxplots indicate females (F) and males’ (M) total
distance traveled in centimeters (cm) during the Session 1 (S1) of the Open Field (OF).
37 Fig. 15 Mean velocity. Boxplots indicate females (F) and males’ (M) mean velocity in centimeters per seconds (cm/sec) during the Session 1 (S1) of the Open Field (OF).
Results from the S2 of OF test, showed no gender-dependent effects in novelty response. Male and female mice did not differ in time spent contacting the novel object (W = 88, p = .502) and in frequency (W = 97.5, p = .792) and latency (W = 122, p = .439) of novel object’s contact. Mean values and standard deviations are reported in Table 2S.
No phenotype effects were found in the percentage of time spent in the periphery and center of the arena, total distance traveled and mean velocity, time spent contacting the novel object and in frequency and latency of novel object’s contact neither within male or female mice (mean values, standard deviations and non-significant p-values are reported in Table 5S and Table 6S).
No sex effects were found in each parameter comparing AV, BA and AP males and females (Table 7S).
38
4.3 Elevated Plus Maze
Results on EPM parameters showed no sex effects. Male and female mice did not statistically differ in time spent in the open (W = 77, p = .245) and closed arms (W = 117, p = .589) and in open (W = 98, p = .807) and closed (W = 192.5, p = .098) arms’ frequency. Mean values and standard deviations are reported in Table 2S.
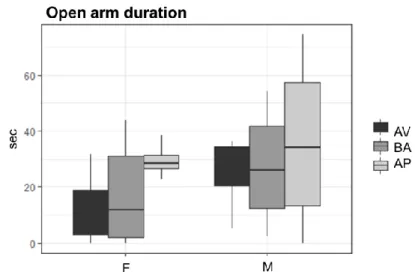
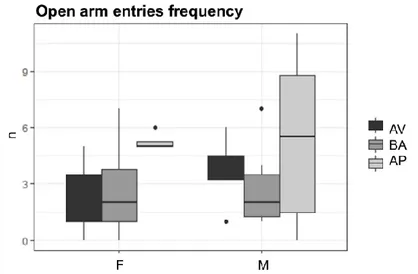
No phenotype effect was evident for all parameters considered in both males and females (non-significant p-values are reported in Table 8S). Notably, comparing male and female mice for each AV, BA and AP phenotype no sex differences were found in time spent in the open and closed arms (Fig. 16 and Fig. 17) and in open arms’ frequency (Fig. 18) but a sex effect emerged regarding closed arm entries’ frequency: AV, BA and AP females more frequently entered the closed arm compared to AV (W = 12, p = .047), BA (W = 31.5, p = .033) and AP (W = 24, p = .013) males (Fig. 19). Mean values, standard deviations and p-values are reported in Table 9S and Table 10S.
39 Fig. 16 Time spent in the open arm of the Elevated Plus Maze. Boxplots
indicate time spent in the open arm of the EPM, in seconds (sec), in avoiding (AV), balancing (BA) and approaching (AP) female (F) and male (M) mice.
Fig. 17 Time spent in the closed arm of the Elevated Plus Maze. Boxplots
indicate time spent in the closed arm of the EPM, in seconds (sec), in avoiding (AV), balancing (BA) and approaching (AP) female (F) and male (M) mice.
40 Fig. 18. Open arm entries at the Elevated Plus Maze. Boxplots indicate number
(n) of entries in the open arm of the EPM in avoiding (AV), balancing (BA) and approaching (AP) female (F) and male (M) mice.
Fig. 19 Closed arm entries at the Elevated Plus Maze. Boxplots indicate number
(n) of entries in the closed arm of the EPM in avoiding (AV), balancing (BA) and approaching (AP) female (F) and male (M) mice.
41
Summary of F0 results:
- No significant difference was found between male and female A/A conflict index distributions;
- Females were slower in entering the white arm during the conflicting S2 of the A/A Y-maze and exhibited reduced general locomotor and exploratory activity in the OF than males, regardless their phenotype;
- In the EPM AV, BA and AP females entered more often in the closed arm compared to the respective AV, BA and AP males; - A specific phenotype effect was found for AP male mice that showed reduced latency to enter the white arm of the A/A Y-Maze compared to AV male mice.
42
4.4 Undisturbed Parental care Observation
Mann-Whitney-Wilcoxon tests on PCO revealed no significant sex differences in time spent in pup-directed behaviors (W = 220, p = .613) and in pup-contact frequency (W = 316, p = .079). Mean values and standard deviations are reported in Table11S.
MATERNAL CARE
AV, BA and AP mothers (coupled with BA fathers) did not differ in time spent in pup-directed behaviors (H= 1.5604, df = 2, p = .458) and pup-contact frequency (H = 2.1368, df = 2, p = .343) (Table 12S; Fig 1S).
No paternally-induced effect on maternal care was found. In fact, BA mothers coupled with AV, BA and AP fathers did not differ in time spent in directed behaviors (H = 0.525, df = 2, p = .769) and pup-contact frequency (H = 1.765, df = 2, p = .413) (Table 12S and Fig 2S).
PATERNAL CARE
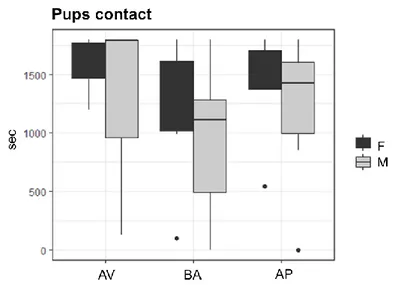
AV, BA and AP fathers (coupled with BA mothers) did not differ in time spent in pup-directed behaviors (H = 0.78891, df = 2, p = .674) and pups-contact frequency (H = 0.34615, df = 2, p = .841) (Table 12S and Fig 3S).
No maternally-induced effect on paternal care was found. In fact, BA fathers coupled with AV, BA and AP mothers did not differ in time spent in pup-directed behaviors (H = 3.4308, df = 2, p = .179) or in pup-contact frequency (H = 0.38769, df = 2, p = .823) (Table 12S and Fig 4S).
43
No sex effects in parental care were found comparing AV, BA and AP mothers and fathers (Fig. 20). Non-significant p-values are showed in Table 13S.
Fig. 20: Undisturbed parental care observation. Boxplots indicate time spent in
pup-directed behaviors (seconds) in avoiding (AV), balancing (BA) and approaching (AP) female (F) and male (M) mice.
4.5 Retrieval test
No sex effects were found in latency to reach separated pups (W = 152, p = .763), pup-directed behaviors (W = 202, p = .214) and digging (W = 219, p = .073).
As expected, mothers exhibited pup-retrieval behavior while almost all fathers did not (W = 34, p = <.0001; Fig. 21).
44 Fig. 21: Retrieval test. Boxplots indicate latency to retrieve all separated pups to
the nest in female (F) and male (M) mice. To note, 600 sec is the cut-off.
In addition, females showed less self-grooming (W = 58, p = .0008; Fig. 22) and rearing’s frequency (W = 55, p = .0007; Fig. 23) compared to males, regardless their phenotype. Mean values and standard deviations are reported in Table 11S.
Fig. 22: Retrieval test, grooming. Boxplots indicate time spent in
45 Fig. 23 Retrieval test, rearing. Boxplots indicate the frequency of rearing (number
-n) in female (F) and male (M) mice.
MATERNAL RETRIEVAL
AV, BA and AP mothers (coupled with BA fathers) did not differ in latency to reach the separated pups (H = 1.2606, df = 2, p = .532; Fig. 24), time to retrieve all pups to the nest (H = 0.97412, df = 2, p = .614), time spent in pup-directed behaviors (H = 0.13333, df = 2, p = .935), time spent in digging (H = 0.53333, df = 2, p = .765), self-grooming (H = 0.77117, df = 2, p = .680) and frequencies of rearing (H = 2.7275, df = 2, p = .255). Mean values and standard deviations are reported in Table 14S A.
46 Fig. 24: Retrieval test, latency to reach the separated pups. Boxplots indicate
latency (seconds -sec) to reach the separated pups in the retrieval test in avoiding (AV), balancing (BA) and approaching (AP) mothers coupled with BA males.
Notably, a paternally-induced effect on maternal latency to reach the separated pups was observed (Fig. 25). Despite the Kruskal-Wallis analysis did not evidence significant effects (H = 3.3115, df = 2, p = .190), planned Mann-Whitney-Wilcoxon comparisons showed that BA mothers paired with AV mates were faster in reaching separated pups compared to the BA mothers paired with BA (H = 0, p = .035) but not with AP (W = 6, p = 1) fathers. No significant differences were found in latency to reach the separated pups between mothers paired with AP or BA fathers (W = 7, p = .555).
47 Fig. 25: Retrieval test, latency to reach the separated pups. Boxplots indicate
latency in seconds (sec) to reach the separated pups in the retrieval test in balancing (BA) mothers coupled with avoiding (AV), BA and approaching (AP) males.
No other paternally-induced maternal differences were found neither in time to retrieve all pups (H = 1.0558, df = 2, p = .589) or in pup-directed (H = 1.4872, df = 2, p = .475), digging (H = 1.2603, df = 2, p = .532), self-grooming (H = 0.29971, df = 2, p = .860) and rearing (H = 3.4141, df = 2, p = .181) behaviors. Mean values and standard deviations are reported in Table 14S C.
PATERNAL RETRIEVAL
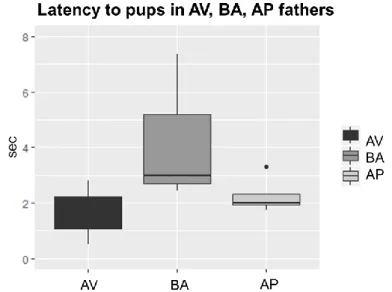
No significant phenotype effect was found in latency to reach the
separated pups (H =3.3232, df = 2, p = .189; Fig. 26), time spent in
pup-directed (H = 0.83077, df = 2, p = .660), digging (H = 0.42949, df = 2, p = .806), self-grooming (H = 1.0038, df = 2, p = .605) and frequencies of rearing (H = 1.4625, df = 2, p = .481) behaviors. Notably, paternal phenotype significantly affected the latency of fathers to retrieve all separated pups to the nest (H = 6.5455, df = 2,
48
p = .037). AV fathers were the only male group exhibiting a maternal-like retrieval behaviors, while BA and AP fathers reached the test cut-off without ever retrieve pups (see Table 14S B and Table 14S D).
Fig. 26: Retrieval test, latency to reach the separated pups. Boxplots indicate
latency in seconds (sec) to reach the separated pups in the retrieval test in avoiding (AV), balancing (BA) and approaching (AP) fathers coupled with BA females.
No significant maternally-induced effects on paternal latency to reach the separated pups (H = 4.4323, df = 2, p = .109, Fig. 27) and to retrieve separated pups (see Table 14S), time spent in pup-directed behaviors (H = 1.7455, df = 2, p = .417), digging (H = 0.1697, df = 2, p-value = 0.9187) and self-grooming (H = 1.6485, df = 2, p-value = 0.4386) and frequency of rearing (H = 1.3425, df = 2, p = .511) were found.
49 Fig. 27: Retrieval test, latency to reach the separated pups. Boxplots indicate
latency in seconds (sec) to reach the separated pups in the retrieval test in balancing (BA) fathers coupled with avoiding (AV), BA and approaching (AP) females.
Sex effects for each phenotype was calculated by Mann-Whitney-Wilcoxon tests on the RTV parameters (p-values are reported in Table 15S). AV, BA and AP males and females were different only for time to retrieve all pups to the nest and time spent in self-grooming. Namely, among AP animals only females retrieved their pups (W = 12, p = .031) and AP females showed less grooming duration than AP males (W = 12, p = .049).
50
Summary of F0 biparental care behaviors:
- No sex and phenotype effects were found on PCO;
- On the RTV test mothers showed more pup-retrieval, less self-grooming and less rearing behaviors compared to fathers, regardless their phenotype;
- A/A phenotype did not affect maternal retrieval, but the paternal phenotype significantly influenced maternal latency to reach the separated pups;
- Paternal phenotype influenced retrieval of fathers: AV fathers showed maternal-like pup-retrieval;
- The AP phenotype produced different effects in males and
females with AP females exhibiting more retrieval and less self-grooming behaviors than males.
51
4.6 Oxytocin in the PVN
Wilcoxon-Mann-Whitney test revealed no significant sex effect on OXT cell density in the PVN (W = 61, p = .625; Table 16S).
No significant phenotype effects on OXT cell density were found in the PVN of female (H = 1.8636, df = 2, p = .393; Fig. 28; Table 17S) and male (H = 0.75429, df = 2, p = .685; Fig. 29; Table 17S) mice.
Fig. 28: OXT cell density in the female PVN. Boxplots indicate cell density
(cell/mm2) of oxytocinergic (OXT) neurons in the paraventricular hypothalamic nucleus (PVN) of avoiding (AV), balancing (BA) and approaching (AP) female mice. Figures on the top of the graph represent OXT immunofluorescence, OXT in green; Hoechst (nuclei) in blue. Scalebar: 100 µm.
52 Fig. 29: OXT cell density in the male PVN. Boxplots indicate cell density
(cell/mm2) of oxytocinergic (OXT) neurons in the paraventricular hypothalamic nucleus (PVN) of avoiding (AV), balancing (BA) and approaching (AP) male mice. Figures on the top of the graph represent OXT immunofluorescence, OXT in green; Hoechst (nuclei) in blue. Scalebar: 100 µm.
Comparison between AP, BA and AP males and females on the OXT cell density was calculated for each phenotype by Mann-Whitney-Wilcoxon tests. No significant differences were found (p-values are reported in Table 18S).
53
4.7 Dopamine in the VTA
Wilcoxon-Mann-Whitney test revealed no significant sex effect on THY cell density in the VTA (W = 43, p = .282; Table 16S).
A significant phenotype effect on THY cell density in the VTA of female mice was found (H = 6.3, df = 2, p-value = .042; Fig. 30; Table 17S). AV females showed lower DA cell density compared to BA females (W = 0, p = .057), while no differences between AV and AP (W = 0, p = .1) and between AP and BA (W = 3, p = 0.4) females were found.
Fig. 30: THY cell density in the female VTA. Boxplots indicate cell density
(cell/mm2) of dopaminergic (THY) neurons in the ventral tegmental area (VTA) of avoiding (AV), balancing (BA) and approaching (AP) female mice. Figures on the top of the graph represent THY immunofluorescence, THY in green; Hoechst (nuclei) in blue. Scalebar: 100 µm.
54
Results on THY immunofluorescence staining in the VTA revealed also a significant difference among AV, BA and AP male mice (H = 5.8615, df = 2, p = .053; Fig. 31). Namely, AP males showed a significantly higher DA cell density compared to BA males (W = 19, p = .031), while no differences were found between AP and AV (W = 11, p = .114) and between AV and BA (W = 5, p = .571) males.
Fig. 31: THY cell density in the male VTA. Boxplots indicate cell density
(cell/mm2) of dopaminergic (THY) neurons in the ventral tegmental area (VTA) of avoiding (AV), balancing (BA) and approaching (AP) male mice. Figures on the top of the graph represent THY immunofluorescence, THY in green; Hoechst (nuclei) in blue. Scalebar: 100 µm.
55
Sex effects on the THY cell density was calculated for each phenotype by Mann-Whitney-Wilcoxon tests. No significant differences were found (p-values are reported in Table 18S; Fig. 32).
Fig. 32: THY cell density in the VTA. Boxplots indicate cell density (cell/mm2) of
dopaminergic (THY) neurons in the ventral tegmental area (VTA) of avoiding (AV), balancing (BA) and approaching (AP) female (F) and male (M) mice.
56
4.8 Dopamine-oxytocin receptors colocalization in
the VTA
No sex effect was found OTR density on VTA-DA neurons (W = 25, p = .190). Mean values and standard deviations are reported in Table 16S.
No phenotype effect was found in the OTR density on VTA-DA neurons in females (H = 1.8667, df = 2, p = .393; Fig. 33).
Fig. 33 OTR density in the female VTA. Boxplots indicate receptor density
(receptor/mm2) of OTR on DA neurons in the ventral tegmental area (VTA) of avoiding (AV), balancing (BA) and approaching (AP) female mice. Figures on the top of the graph represent OTR/THY double immunofluorescence, OTR in red; THY in green; Hoechst (nuclei) in blue. Scalebar: 25 µm.