Design of Critical Infrastructures:
application to Electrical Systems
Francesco Giordano*, Alessandro Puleggi*, Massimiliano M. Schiraldi*
*Department of Enterprise Engineering, Università di Roma “Tor Vergata”, Rome, Italy ([email protected], [email protected], [email protected])
Abstract: The recent publication of the 5th revision of TIA 942 standard represents a benchmark framework to design resilient power systems. This standard provides a classification for electric infrastructures in terms of their capacity to tolerate failures and to allow safely maintenance operations. This ranking is not based upon technical specifications, but on system resilience level, that is the capacity to resist to an unexpected destructive event, breakdown or malfunctioning which afflicts the end user. However, this standard is provided only for design purposes. Aim of this paper is to propose an approach by which the current resilience status of a system can be evaluated, in accordance to this standard classification. The proposed technique should allow to easily analyze the gap – in terms of infrastructure topology, components and distribution lines – between an existing system and a generic configuration with a desired resilience level, and thus to suggest the steps to reach the proper availability for the system specific mission. A preliminary version of the technique – which however still leaves some open issues – has been validated with the power system infrastructure that supports one of the largest datacenters in Italy, inside a primary IT Company which has to guarantee a 24/7 continuous operation of its software application, mission critical in the interests of its customers.
Keywords: Electrical Infrastructure, System Resilience & Reliability
1. Introduction
The power system of an IT structure suffers from specific issues which differ from those that affect electrical infrastructure supplying industrial machinery, for several reasons: for example, an electro-mechanic user may experience a downtime period only for a long voltage interruption, while an electronic component can switch off also for little power quality problems (Dugan, McGranaghan, Santoso, & Beaty, 1996); moreover, the down time measured by the end user may be much greater than the electric failure duration; furthermore, in IT systems there’s a higher chance that a single adverse event can influence all the subsystems. These are some of the reasons for an increased criticality in designing electrical infrastructures with high availability. This happens also inside modern industrial plants: indeed, the
spreading of information technology inside
manufacturing world has exponentially grown and it is not anymore limited to services supply. An example is given by the presence of Enterprise Resource Planning softwares, which nowadays manage all the aspect of companies life: human resources and accountability, operations and material management, supply chain and
customer relationship management, etc. These
softwares, implemented inside most of the medium and large enterprises, need large datacenters and computer communication networks, along with their proper power supply. Considering the criticality of these systems (a
single short blackout of the ERP can stop an industrial
plant for more than 4 hours), the US
Telecommunication Industry Association has issued a standard (TIA/EIA 942, subsequently acknowledged by the American National Standard Institute, ANSI) that encloses the state-of-art approaches for designing the support infrastructures for a datacenter, starting from the raised floor and up to the thermal systems, with specific regard to electrical cabling systems and network design. Despite the availability of an IT power system for a company is not as critical as power supply reliability for the Stock Exchange computers or for the surgery room equipment of an hospital, the TIA/EIA 942 standard provides useful criteria to assure a pre-defined resilience level while giving operative suggestions in designing system features like component redundancy for concurrently maintainability.
2. Reliability analysis for support infrastructures and auxiliary plant systems
The design architecture of a power system, like any other support infrastructure, heavily influences the availability of the end user device. In order to increase reliability, designing support systems with parallel redundant parts represents an easy solution, which can be proved through the application of the most known and used techniques for reliability analysis, that are the
Failure Mode and Effect Analysis (U.S. Department of
Defense, 1949).
The former is a quite old methodology, applied since ’60, to evaluate safety and reliability during the designing phases of projects in which errors were intolerable (Haumptmanns, 1988). Its aim is to identify every relevant fault cause and the interaction between them. It uses a logical scheme to describe the failure modes, reporting the relationship between symptoms and components, and, given the event probability, can calculate the top event (typically, the main system failure) chance to occur; this is the reason why this analytic method is called Probabilistic FTA. A significant advantage in using FTA is the availability of a great number of softwares that help the analyst to create the fault tree and to calculate the most important information upon it (minimal cut sets, probability of the top event, Monte Carlo Analysis, etc.). The typical use of this methodology is pre-hoc, to analyze design errors (Vesely, Goldberg, Roberts, & Haasl, 1981), despite recently it was used also, post-hoc, to analyze accidents and understand if it is more efficient to work over the single component or to review the system architecture. A fault tree is built from events and gates; the first ones can be also used to represent the man-system interaction, which is particularly important in IT power systems since 70% of their failures is generally attributed to human errors (Turner, Seader, Renaud, & Brill, 2008).
The second (Sheng-Hsien & Shin-Yann, 1996) is a technique used to show all the potential failures of single components and their effects on the whole system; if it is used also for quantitative analysis (FMECA, in which C stands for Criticality), it also helps assessing the criticality of these effects evaluating occurrence probability, detection opportunities and damage severity, estimating a Risk Priority Number (RPN) per each subsystem or component (the higher the value, the heavier is the risk). According to the cited Military Standard, “FMEA is a method of reliability
analysis intended to identify failures, which have consequences affecting the functioning of a system within the limits of a given application, thus enabling priorities for action to be set.”. For the aim of this
paper, we considered the Design FMEA more than the Process FMEA as a reference.
These two methodologies, extensively used for maintenance operations in manufacturing industry, aren’t easily applicable for the evaluation of IT
infrastructure resilience: Kontogianis et al.
(Kontogianis, Leopoulos, & Marmas, 2000) evidenced that FTA does not properly consider the time factor; for example, a short blackout may be protected by the UPS systems, while in a longer one the auxiliary power generators may succeed in granting the power supply continuity, thus the occurrence of these two different kind of events should be independently computed. The well-known flaw of FMEA/FMECA should be remembered as well: the qualitative attribution of the
three scores used for RPN calculation can lead to radically different results. Indeed, some standards oriented to uniform its application in automotive and industrial automation fields have been studied and improved along the years (Society of Automotive Engineering, 2009), but it seems that nothing similar has been issued for auxiliary systems, neither for standard manufacturing plants, nor for datacenter support infrastructure. Moreover, the order of magnitude of the traditional maintenance indexes significantly vary if we are dealing with IT users or plant infrastructure: the mean time to restore the operations of a datacenter is significantly different from the electrical system one (the biggest datacenters need up to 6 hours to be online again after a 20 minutes electric blackout, if this has affected the calculating machines).
Since IT system is classified as “support system” for industrial companies, its availability should be the highest possible, coherently with the theory which assumes that a support system should never represent a critical constraint for the core business. On the contrary, an IT system is more vulnerable to power supply issues than a standard electro-mechanical system, which, for example, is nearly not influenced at all by short interruptions and voltage dips (Dugan, McGranaghan, Santoso, & Beaty, 1996). Hence, it is important to design a robust architectural configuration for the IT load, in order to grant service continuity in spite of adverse events occurrence: according to Operations Management practices, stock buffers should be located between some manufacturing phases, in order to avoid the spread of inefficiencies among the process, which can affect production capacity; in the same way, in power system design, the evaluation of the opportunity of building twin distribution path or redundant components to reach higher resilience level should not be underestimated. In order to standardize this approach, the Uptime Institute proposed a classification pattern (Turner, Seader, Renaud, & Brill, 2008) which has been included in the informative annexes of the
ANSI/TIA/EIA 942 “Telecommunications
Infrastructure Standard for Data Centers” standard.
3. TIA 942 standard and the four-tier architectures
The mentioned standard, as it is clearly stated in the relative white paper, is only intended to support the design of the system architecture and it is not meant to replace the documentations and prescriptions issued by other technical authorities such as IEC, IEEE, etc.; its contents are indeed at a low detail level; the requisites do not concern components and parts sizing, but mainly
system topology, focusing on maintenance
management, on the availability perceived by the end user and on pursuing these goals in an efficient and effective way. So, the 942 standard results to be nearer to the industrial engineering vision than to the traditional electrical engineering approach. That’s why in this paper the technological aspects of the electrical parts are not kept in consideration, assuming that these
are always properly treated during the subsequent parts of the system design.
The ANSI/TIA/EIA 942 standard discriminate among 4 main different types of system architectures, each one with specific performance levels, namely Tier 1, 2, 3, 4. The following paragraphs will shortly describe the prescription that a system must have to reach each tier specification. The values of availability performances per each architecture are referred as an “end-user perceived unavailability” – which takes into account all the time in which tasks are stopped, including hardware and software restarts, not only the time in which power supply is interrupted – and have been statistically computed from the Uptime Institute based on the log files of 16 primary datacenters recorded along 10 years of analysis.
Tier 1 (basic architecture): a Tier 1 electrical
architecture is only capable to properly supply its users, without any redundancy within or between subsystems. Every planned maintenance operation must be completed during power off, as well as every power system failure will cause an IT structure shutdown. Another risk associated with this configuration is that, being impossible to plan scheduled maintenance intervention without experiencing an availability loss, only event maintenance is applicable and this furthermore reduces component reliability over time. Perceived availability statistically results to be 99,67%, correspondent to 28 hours/year of downtime for a 24/7 system. Approximately 24 hours out of 28 could be ascribed to maintenance. Node Subsystem A Utility feeder B N Auxiliary generators C Main LV switchgear D N UPS E Mech. systems switchgear F IT Switchgear G Mech. systems H Power distrib. net I IT power loads Figure 1. Digraph representing the block diagram for a
Tier 1 compliant architecture
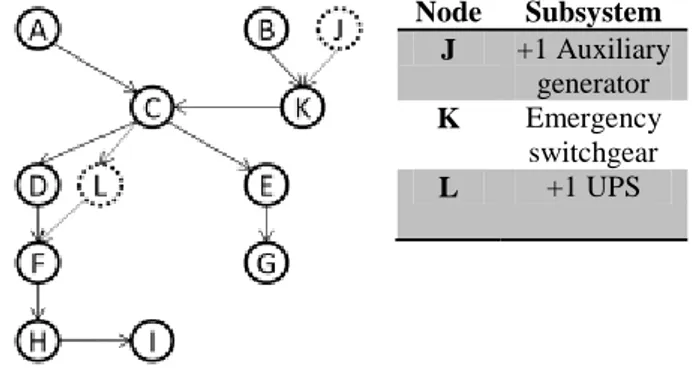
Tier 2 (redundant capacity components architecture): in
a Tier 2-like configuration, at least N+1 redundant UPS and auxiliary generators are present, with a single distribution path. No other redundant subsystem is considered. This architecture withstand one UPS failure without influencing the IT efficiency status while - although the probability of an UPS failure is greater than a wire damage, if the latter is properly designed – every distribution cable is still vulnerable. Tier 2 topology does not allow scheduled online maintenance. Moreover, in this configurations some UPS failures may however still impact on the power system continuity. Perceived availability is 99,75%, correspondent to 22 hours/year of downtime. 36 hours every two years are foreseen to be devoted to scheduled maintenance.
Node Subsystem J +1 Auxiliary generator K Emergency switchgear L +1 UPS
Figure 2. Digraph representing the block diagram for a Tier 2 compliant architecture
Tier 3 (concurrently maintainable architecture): a tier 3
architecture, on top of tier 2 specification, requires at least a N+1 redundant configuration for each subsystem; moreover, two different distribution paths are needed, though usually only one line is active at time; finally, two medium voltage utility feeders are present. Mechanical system distribution paths and gears are 1:2 redundant too, in order to avoid that an electrical failure can make unserviceable the critical HVAC components. It is thus possible to disconnect every component without harm the IT user, although this configuration is vulnerable during maintenance periods. In order to obtain a concurrently maintainability standard, every user load must be properly connected through a double power distribution unit (PDU). Perceived availability is 99,98%, correspondent to a 4 hours of down time every 2.5 years, and it is not necessary to disconnect the IT load during the scheduled maintenance.
Tier 4 (fault tolerant architecture): a Tier 4 architecture
is designed to have a completely redundant
configuration, which ensure that every failure of each component will not be critical for the IT load.
Node Subsystem M +1 Mech. Systems N Out UPS Switchgear O HVAC Switchgear P N HVAC Source Q +1 HVAC Source R Bypass Switchgear S In UPS Switchgear Figure 3. Digraph representing the block diagram for a
Tier 3 compliant architecture
Both paths must be compartmentalized, not to let a single failure event to affect the distribution subsystem. With this architecture, it is not only possible to perform maintenance operations without decreasing the system availability and reliability, but also to protect the users supply from nearly every kind of failure, with the obvious exception of large destructive events, some human error and sabotages. Perceived availability is 99,99%, correspondent to a 4 hours failure every 2.5 years, and it’s not necessary to disconnect the IT load during the scheduled maintenance.
Figure 4. Digraph representing the block diagram for a Tier 4 compliant architecture
4. Rating a power system architecture resilience
Although the abovementioned classification represents a useful starting point for an ex-novo power system design, it could hardly be applied to assess the TIA tier rate for an existing infrastructure, especially if the single-line diagrams or the blueprints have already been
defined. It must also be considered that new power systems design projects in an industrial plant are far less
common than reengineering or modernization
intervention on existing ones. Thus, this paper is focused on a methodology for the evaluation of power systems architecture resilience, conceived to support the assessment by a comparison with the Tier standard levels. The methodology can also be used to rapidly determine which subsystem should be developed or which path should be designed in order to reach a better availability and resilience rate. The proposed approach consists of the following steps:
1) analysis of the users’ needs in terms of real electrical power and of active components (auxiliary generators, UPS, transformers);
2) representation of the system as a low-detail block diagram, using the Reliability Block Diagram
approach (IEEE, 2007), including all the
subsystems up to components and gears;
3) transformation of the block diagram into a proper adjacency matrix;
4) difference analysis comparing the matrix obtained in step 3) with the matrices representative of each Tier standard;
5) cost-performance analysis for component or system development, based on the differences evidenced in step 4).
In the following paragraphs the first four phases are described in details..
4.1. Power needs analysis
Purpose of this first phase is to determine real power needed by IT users for calculating the redundancy rate between and within subsystems. In this phase, the heating, ventilating and air conditioning power consumption should not be underestimated (by the way of an example, a 2,000 m2 server farm which absorb 2 MW of electric power for the IT load may require up to 1MW for HVAC). Thanks to the modularity of modern electric components, in order to obtain a 1,200 kVA continuity source, it can be chosen either a non-redundant solution (2x600 kVA components) or a wide selection of redundant alternatives, for example 2:3 redundancy (3x600 kVA), 3:4 redundancy (4x400 kVA) and so on. It is important to notice that, due to continuous IT consumptions increase, a system may easily lose its redundant characteristic along the years (Bianchini & Rajamony, 2004). Thus, a system originally designed to be N out of N+1 redundant can result to be not oversized anymore after few upgrade
interventions. For this reason, the continuous
monitoring of the real power needed by all users becomes critical.
4.2. Graphic system sketch
In the second step, a block diagram (similar to a single-line diagram) is built. Indeed, once size and redundancy factor of each component have been analyzed, the next goal is to evaluate the reliability and the resilience rate reached by the system in its original design. As a result, the block diagram will represent, in a systemic view, the main subsystems, their connections and the physical locations inside the analyzed infrastructure. The detail on the internal configuration of each subsystem i is necessary to compare the number of installed components (Ki) with those needed (Ni) to supply the load (i.e. internal redundancy, Ni:Ki typically Ni out of
Ni +1).
The interconnections between subsystems allow to evaluate the tolerance towards power quality issues: it is thus possible to verify which load is protected from voltage dips and short interruptions thanks to online UPSs. Moreover, in this step, the positions of the eventual junctions between multiple distribution paths are determined: the more these junctions are located downstream in the electrical system (i.e. near the users), the higher is the reliability granted by redundant components. Finally, this phase is needed to verify the existence of redundancies between subsystems (i.e.
external redundancy, typically 1:2 and seldom 1:3 in
case of Defence or Aerospace applications).
Physical location of each subsystem and distribution path is the third characteristic to be evaluated in this step, and it represents a critical aspect since compartmentalization is required in designing highly reliable systems. Some architectures described in the TIA 942 standard require that redundant subsystems must be installed in physically separated areas. A severe component failure may cause fire indeed; this is especially true for power generators - due to fuel presence - for continuity sources - due to the presence of battery packs - and for transformers - due to the presence of insulating oil. Because of fire risk, physical isolation should be provided for preventing the damage spreading among subsystem which were theoretical designed to be completely redundant.
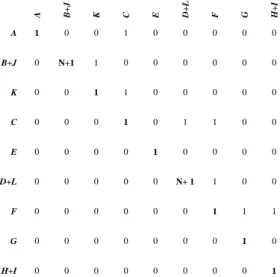
4.3. Matrix representation
The third phase is the core step of the proposed methodology: it consists in the representation, through a particular version of an adjacency matrix, of the digraph obtained considering each block of the block diagram as a node, and the downstream-oriented connections as edges - the upstream-oriented connections are not reported due to obvious symmetric consideration. The various subsystems are thus reported in the matrix both in the rows and in the columns, as it is shown in Figure 5. The matrix shows the (+1) value in the (i, j) position if the subsystem in the i row is supplied by the subsystem in the column j. In the main diagonal the internal redundancy of each component is indicated
according the notation where Ni and Ki are defined as
in step 2.
Given the need of lowering the detail level of the analysis in order to cope with a systemic block diagram and the suggested TIA942 Tier standard models, the component of the analyzed architecture must be brought back to the five following subsystem types:
a) transformers associated to an utility feeder; b) auxiliary power generators;
c) continuity sources; d) gears; e) user loads. A B C E D F G H+ I A 1 0 1 0 0 0 0 0 B 0 1 1 0 0 0 0 0 B 0 0 1 0 1 1 0 0 C 0 0 0 1 0 0 0 0 E 0 0 0 0 1 1 0 0 D 0 0 0 0 0 1 1 1 F 0 0 0 0 0 0 1 0 H+I 0 0 0 0 0 0 0 1
Figure 5. Tier 1 architecture matrix representation
A B+ J K C E D+ L F G H+ I A 1 0 0 1 0 0 0 0 0 B+J 0 N+1 1 0 0 0 0 0 0 K 0 0 1 1 0 0 0 0 0 C 0 0 0 1 0 1 1 0 0 E 0 0 0 0 1 0 0 0 0 D+L 0 0 0 0 0 N+ 1 1 0 0 F 0 0 0 0 0 0 1 1 1 G 0 0 0 0 0 0 0 1 0 H+I 0 0 0 0 0 0 0 0 1
Figure 6. Tier 2 architecture matrix representation
4.4. Difference analysis
Through the matrix obtained in step 3, it is possible to evaluate which resilience level is reached by a comparison with the TIA 942 Tier standard matrices, obtained with the same procedure, using, for each Tier,
the systems described by Turner et al. (Turner, Seader, Renaud, & Brill, 2008) as a minimal compliant systems. Clearly, both the matrices must be brought back to a comparable form, specifically:
- the Tier standard matrices must be adapted to the analyzed system, replacing each Ni in the
main diagonal with the proper number of component for each subsystem
- in both matrices, empty rows and columns
must be eventually added in case of absence of some of the subsystem types listed in the previous paragraph;
- finally, rows (and columns, as well) must be
coherently sorted until both matrices show the various subsystems in the same orders.
Easily, in order to state that the analyzed architecture is at least compliant with a specified tier, all ai, j terms of
the difference matrix must be equal or greater than 0.
A1 B1 K1 C1 S+ F + L N O A2 B2 K2 C2 R O2 P+Q I+ H1+ H2 A1 1 0 0 1 0 0 0 0 0 0 0 0 0 0 0 B1 0 1 1 0 0 0 0 0 0 0 0 0 0 0 0 K1 0 0 1 1 0 0 0 0 0 0 0 0 0 0 0 C1 0 0 0 1 1 0 0 0 0 0 0 0 0 0 0 S+F+L 0 0 0 0 N+ 1 1 1 0 0 0 0 0 0 0 0 N 0 0 0 0 0 1 0 0 0 0 0 0 0 0 1 O 0 0 0 0 0 0 1 0 0 0 0 0 0 1 0 A2 0 0 0 0 0 0 0 1 0 0 1 0 0 0 0 B2 0 0 0 0 0 0 0 0 1 1 0 0 0 0 0 K2 0 0 0 0 0 0 0 0 0 1 1 0 0 0 0 C2 0 0 0 0 0 0 0 0 0 0 1 1 0 0 0 R 0 0 0 0 0 0 0 0 0 0 0 1 0 0 1 O2 0 0 0 0 0 0 0 0 0 0 0 0 1 1 0 P+Q 0 0 0 0 0 0 0 0 0 0 0 0 0 N+ 1 0 I + H1 + H2 0 0 0 0 0 0 0 0 0 0 0 0 0 0 1
Figure 7. Tier 3 architecture matrix representation
5. Validation over a real site case
This methodology was validated over a real case, verifying the reliability level and the resilience rating of datacenter electric system of a primary IT Italian firm. The main goal was to check the need to redesign the power system, since the plant is contractually required to work 24/7 without even a single interruption; any downtime, regardless of its duration, will lead to high penalties, due to its critical importance in the customers’ business. The firm aims to grant a “five nine” availability level (i.e. 99.999%) for its IT system; as a consequence, from theory it is known that the power system availability level should be greater or equal to
this value – we should consider anyway that this target is almost impossible to reach, since it would require to incur in not more than 1 service failure every 45 years of continuous service; thus the firm objective is to reach the maximal availability rate possible. The system include a 2,000 A datacenter, a dedicated 6 MBTU cooling tower system, two continuity sources, one set of 4.4 MVA auxiliary power generators and a Medium Voltage feeder with four liquid transformers, for a total power supply of 6 MVA. The 4 steps described in the previous sections have been sequentially applied to the analysed system. A1 B1 K1 C1 S1+ F 1+ L 1 N1 O1 A2 B2 K2 C2 S2+ F 2+ L 2 N2 O2 P1+ P 2 H1+ H2+ I A1 1 0 0 1 0 0 0 0 0 0 0 0 0 0 0 0 B1 0 1 1 0 0 0 0 0 0 0 0 0 0 0 0 0 K1 0 0 1 1 0 0 0 0 0 0 0 0 0 0 0 0 C1 0 0 0 1 1 0 0 0 0 0 0 0 0 0 0 0 S1+ F1 +L1 0 0 0 0 1 1 1 0 0 0 0 0 0 0 0 0 N1 0 0 0 0 0 1 0 0 0 0 0 0 0 0 0 1 O1 0 0 0 0 0 0 1 0 0 0 0 0 0 0 1 0 A2 0 0 0 0 0 0 0 1 0 0 1 0 0 0 0 0 B2 0 0 0 0 0 0 0 0 1 1 0 0 0 0 0 0 K2 0 0 0 0 0 0 0 0 0 1 1 0 0 0 0 0 C2 0 0 0 0 0 0 0 0 0 0 1 1 0 0 0 0 S2+ F2 L2 0 0 0 0 0 0 0 0 0 0 0 1 1 1 0 0 N2 0 0 0 0 0 0 0 0 0 0 0 0 1 0 0 1 O2 0 0 0 0 0 0 0 0 0 0 0 0 0 1 1 0 P1+P2 0 0 0 0 0 0 0 0 0 0 0 0 0 0 2N 0 H1+H2 +I 0 0 0 0 0 0 0 0 0 0 0 0 0 0 0 1
Figure 8. Tier 4 architecture matrix representation
In the first phase, the subsystem capacity to supply the IT load was evaluated. It was found that both the only auxiliary power source (GE) and one of the continuity subsystems (S2) were not redundant anymore, for different reasons: the former is now undersized compared to the power consumption, while the latter was subjected to a de-rating procedure needed to cope with a severe failure occurred the year before, which had reduced the UPSs real power supply. Hence, these systems, that were once conceived N:N+1 redundant, cannot effectively grant any kind of fault tolerance. In the second step the block diagram was realized. This allowed to identify the presence of two continuity sources in 1:2 external redundancy, with a partially common distribution path. Moreover, these sources were not compartmentalized, since both battery packs and gears were in the same rooms. The results of this analysis are reported in the following diagram.
Figure 9. Block diagram for the analyzed system, after step 2
From this phase, the power system matrix as defined in step 3 was obtained.
The first continuity source was 3:4 redundant, which explains the value “1.33” on the UPS1 diagonal position.
In the last step, the system matrix was compared with the Tier standard matrices in order to determine the eventual differences. Since in step 2 not any dual distribution path was found (no second MV/LV substation and no second main gear were present), the compliance with Tier 3 or Tier 4 architecture was excluded. Thus, the analyzed system was benchmarked versus Tier 2 matrix. Since the absence of negative term
in the difference matrix, it was possible to state that the analyzed power system is Tier 2 compliant, i.e. has redundant capacity components but it’s impossible to maintain most of its parts keeping load online. Similarly, the system cannot be rated fault tolerant.
F E E D GE N EM -GE AR LV -GE AR UPS 1 DI S T -G E AR 1 HVAC -GE AR UPS 2 DI S T -G E AR 2 HVAC USE R FEED 1 0 0 1 0 0 0 0 0 0 0 GEN 0 1 1 0 0 0 0 0 0 0 0 EM-GEAR 0 0 1 1 0 0 0 0 0 0 0 LV-GEAR 0 0 0 1 1 0 1 1 0 0 0 UPS1 0 0 0 0 1.3 1 0 0 0 0 0 DIST-GEAR1 0 0 0 0 0 1 0 0 0 0 1 HVAC-GEAR 0 0 0 0 0 0 1 0 0 1 0 UPS2 0 0 0 0 0 0 0 1 1 0 0 DIST-GEAR2 0 0 0 0 0 0 0 0 1 0 1 HVAC 0 0 0 0 0 0 0 0 0 1.3 0 USER 0 0 0 0 0 0 0 0 0 0 1
Figure 10. Matrix representation of the analyzed system, after the step 3
F E E D GE N EM -GE AR LV -GE AR UPS 1 DI S T -G E AR 1 HVAC -GE AR UPS 2 DI S T -G E AR 2 HVAC USE R FEED 0 0 0 0 0 0 0 0 0 0 0 GEN 0 0 0 0 0 0 0 0 0 0 0 EM-GEAR 0 0 0 0 0 0 0 0 0 0 0 LV-GEAR 0 0 0 0 0 0 0 1 0 0 0 UPS1 0 0 0 0 0 0 0 0 0 0 0 DIST-GEAR1 0 0 0 0 0 0 0 0 0 0 0 HVAC-GEAR 0 0 0 0 0 0 0 0 0 0 0 UPS2 0 0 0 0 0 0 0 1 1 0 0 DIST-GEAR2 0 0 0 0 0 0 0 0 1 0 1 HVAC 0 0 0 0 0 0 0 0 0 0.3 0 USER 0 0 0 0 0 0 0 0 0 0 0
Figure 11. Difference matrix using the Tier 2 standard matrix during step 4
As a conclusion, recalculating the difference matrix with the Tier 3 standard one, it was possible to suggest to the firm’s managers the missing components and connection to achieve a concurrently maintainable system. It was anyway also suggested them to evaluate the opportunity of a global redesign of the electrical system; since the firm required a fault tolerant site, a tier 4 compliant redesign was suggested.
So rg en te S 1 ACEA 20kV Lo ca le g ru p p i em er ge n za Quadro parallelo G E3 800 G E1 1100 G E4 800 G E2 1100 G E5 800 Gruppi 1100 kVA Lo ca le T ec n ic o So rg en te S2 Quadro MT C ab in a M T/ B T TR 2 2000 TR 3 2000 TR 1 2000 TR 4 2000 Tr as fo rm at o ri o lio mi n er ale Lo ca li C ED Quadro sistema BT TR 2 800 TR 3 800 800 TR1 TR 4 800 Tr as fo rm at o ri is o la me n to C ar ich i c rit ici n o n in fo rm at ici (C D Z) A lt ri ca ric h i in fo rm at ici C ar ic h i o rd in ar i C ED 2 B CED 2 A C ED 2 -1000A CED 1 B CED 1 A C ED 1 -1000A C ro ss 2 1250A C ro ss 3 1250A C ro ss 1 1250A C ro ss 4 1250A C o m m u ta to ri Quadro Generale POWER CENTER Quadro sistema BT U P S 600 U P S 600 U P S 600 UP S 600 Gruppi 800 kVA Quadro COC Batterie UPS BAT2 BAT3 BAT1 BAT4 Batterie Batterie BAT2 BAT3 BAT1 BAT4 U P S 500 U P S 500 U P S 500 U P S 500 Quadro CED 1 Quadro CED 2
6. Conclusions
Power system availability has already become a serious criticality for industrial companies, mainly because of the increased use of electronic and information technology devices, both in manufacturing and in services field. This is the reason why an increased attention on integration and improvement of traditional reliability and resilience analysis techniques for these systems was found in literature. This paper, following this research stream, tries to give the basis for a methodology that has its strength into being:
i) fast and of easy application;
ii) quantitative and objective;
iii) referenced with a standard framework
(ANSI/EIA/TIA-942, 2008);
iv) conceived to be integrated with an automatic calculus procedure, given the fact that is applied through operations on matrices.
The possibilities to adopt this approach in different sectors, from manufacturing to IT services (like medical services, defense, etc.), let foresee other opportunities of exploitation. In this sense, the authors agree on the fact that, at this stage, the methodology is far from represent a complete ad directly usable tool, and further improvements and development are clearly needed. The analogies with other matrix approaches for system decomposition and integration problems is clear (i.e. see the Design Structure Matrices approaches in (Browning, 2001)) and thus this method may help designers in the very first phases on the conception of an auxiliary system or a critical infrastructure to properly take into account resilience on top of availability, reliability and maintainability issues.
7. References
U.S. Department of Defense. (1949). Procedure for
performing a failure mode effect and criticality analysis.
United States Military Procedure, MIL-P-1629. ANSI/EIA/TIA-942. (2008). Telecommunications
Infrastructure Standard For Data Centers - Revision 5.
Bianchini, R., & Rajamony, R. (2004). Power and Energy Management for Server Systems. Computer , 37 (11).
Browning, T. R. (2001). Applying the Design Structure Matrix to system decomposizion and Integration Problems: a review and new directions. IEEE
Transaction on Engineering Management , 3 (48),
292-306.
Dugan, R. C., McGranaghan, M. F., Santoso, S., & Beaty, H. W. (1996). Electrical Power Systems Quality. New York: McGraw Hill.
Haumptmanns, U. (1988). Fault tree analysis for process industries engineering risk and hazard assessment.
Engineering Risk and Hazard Assessment , 1, 21-59.
Institute of Electrical and Electronical Engineers (2007).
IEEE Recommended Practice for the Design of Reliable Industrial and Commercial Power Systems. IEEE
Standard 493-2007.
Kontogianis, T., Leopoulos, V., & Marmas, N. (2000). A comparison of accident analysis techniques for safety-critical man-machine systems. International
Journal of Industrial ergonomics (25), 327-347.
Sheng-Hsien, T., & Shin-Yann, H. (1996). Failure mode and effects analysis - an integrated approach for product design and process control. International Journal of
Quality & Reliability Management , 5 (13), 8-26.
Society of Automotive Engineering. (2009). J1739. SAE.
Turner, W. P., Seader, J. H., Renaud, V., & Brill, K. G. (2008). Tier Classification Define Site Infrastructure
Performance. Santa Fé: The Uptime Institute.
Vesely, W. E. (1969). Fault tree handbook. Idaho Falls, IN-1330: Idaho Nuclear Corp.
Vesely, W., Goldberg, F., Roberts, N., & Haasl, D. (1981). Fault Tree Handbook. US Nuclear Regulatory Commission, System and Reliability Research Office of Nuclear Regulatory Research. US Nuclear Regulatory Commission.
This document is provided with the intention of ensuring dissemination of technical work on a non-commercial basis. Copyright and all rights therein are maintained by the authors or by other copyright holders. This work may not be reposted without the explicit permission of the copyright holder. It is understood that all persons copying this information will adhere to the terms and constraints invoked by each author's copyright. The electronic version of this work may differ from the definitive published version.