DIPSI Workshop 2019 on Droplet Impact Phenomena & Spray Investigation, 17th May 2019, Bergamo, Italy
3D flow velocity inside sessile evaporating droplets
M. Rossi*
1, C.J. Kähler
2, A. Marin
31
Department of Physics, Technical University of Denmark, Denmark
2
Institute of Fluid Mechanics and Aerodynamics, Bundeswehr University Munich, Germany
3Physics of Fluids, University of Twente,The Netherlands
*Corresponding author: [email protected]
Introduction
The flow inside sessile evaporating droplets of pure water is characterized by a form of capillary flow directed from the interior towards the contact line, as described by the seminal paper by Deegan et al. in 1997 [1]. Furthermore, the evaporation process induces a tiny temperature gradient across the droplets that is however sufficient to drive a thermal-Marangoni flow on the drop water-air interface directed from the contact line towards the drop summit. This picture can change dramatically if other substances such as surfactants or salts are dissolved in water, even reversing the direction of the internal flow [2]. The experimental characterization of these flows is challenging, since the droplets have small dimensions with curved interfaces varying with time. We used General Defocusing Particle Tracking (GDPT) [3], a single-camera 3D-PTV method to measure the internal and interfacial flows of sessile evaporating droplets of water with unprecedented resolution. We compared results taken at different conditions (temperature, humidity) and different fluids (ultra-pure water and commercially-available mineral waters).
Material and methods
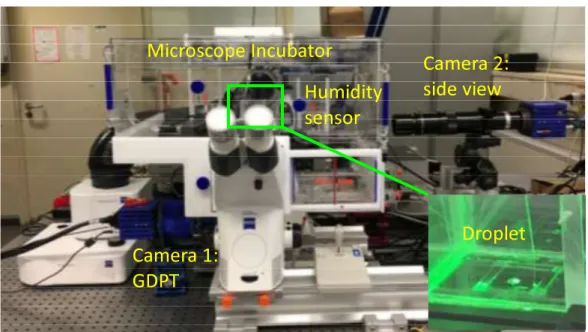
The experimental setup used for the experiments is shown in Figure 1. For each experiment, a water droplet is deposited on a glass slide and placed inside an incubator to control the temperature and humidity of the environment around the droplet. Small polystyrene spheres (1- m in diameter produced by Thermofisher) at low concentration (less than 0.01% w/w) are dispersed in the liquid and used as passive tracer particles. The particles inside the droplet are observed from below across the glass slide using a 10× magnification microscope objective. The three-dimensional position and velocity of the particles is determined using GDPT. This method looks at the defocusing patterns of the particle images to retrieve the three-dimensional position of the corresponding particles. A side camera is used to measure the drop contact angle (CA) during the evaporation process. More details on the measurement method and the experimental setup can be found in [2-3].
Figure 1. Experimental setup used for the measurements. The evaporating droplets are deposited on a microscope slide inside a microscope incubator with control of temperature and humidity. Tracer particles inside the droplets are used to measure the fluid flow velocity using General Defocusing Particle Tracking (GDPT). A side view camera is used to track the contact angle of
the sessile droplet during the evaporating process.
Figure 2. Internal (left) and interfacial (right) velocities of evaporating droplet measured with GDPT. Velocities are reported in cylindrical coordinates for different contact angles.
Results and Discussion
A typical result obtained for pure water is shown in Figure 2. The velocity data are reported in cylindrical coordinates normalized with the droplet radius. The drop radius is approximately 1.3 mm with small variations from experiment to experiment of ±0.05 mm. The velocity plots are obtained from an ensemble average of six experiments carried out under the same experimental conditions. The case presented in Figure 2, corresponding to ultra-pure water at 30 ºC and relative humidity 20%, shows that the bulk capillary flow slightly increase during the evaporation process (for CA between 40º and 30º), with maximum values around 4 m/s. A thermal-Marangoni flow can be observed at the interface with opposite direction and maximum values around 2 m/s. The magnitude of the Marangoni flow as a function of the radius and contact angle is reported on the right panel of Figure 2. The maximum values are observed at r/a = 0.8-0.9 and decrease during the evaporating process as well. These velocities are in qualitative agreement with numerical simulations available in the literature [4], but the velocity magnitudes are 2-3 orders of magnitude smaller than the predicted values. This discrepancy is commonly ascribed to unwanted contamination of the water samples, however we repeated the measurements on different water samples, taken from commercially-available mineral waters, and we obtained similar velocity magnitudes (2 m/s) for the interfacial flows. Mineral waters contain low content on mineral as well as traces of other substances, therefore a lower magnitude of the thermal-Marangoni flow would have been expected. These results suggest that unwanted contaminants are probably not the only reason for the discrepancy between simulations and experiments and that a more complex thermofluidic scenario at the water-air interface must be considered. Conclusions
We used General Defocusing Particle Tracking for measuring the internal and interfacial flow of evaporating water droplets with unprecedented details. These measurements showed that the thermal Marangoni flow in ultra-pure water droplets is 2-3 orders of magnitude slower than what predicted from current numerical simulations, but on the same order of magnitude of the flow observed in droplets of mineral waters, containing traces of minerals and other contaminants. These results provide evidence of a more complex thermofluidic scenario at the water-air interface than what currently expected.
The authors acknowledge financial support by the Deutsche Forschungsgemeinschaft KA1808/22. References
[1] Deegan, R. D., Bakajin, O., Dupont, T. F., Huber, G., Nagel, S. R., & Witten, T. A., Nature 389: 827 (1997).
[2] Marin, A., Karpitschka, S., Noguera-Marín, D., Cabrerizo-Vílchez, M. A., Rossi, M., Kähler, C. J., &
Valverde, M. A. R. Phys. Rev. Fluids 4: 041601 (2019).
[3] Barnkob, R., Kähler, C. J., & Rossi, M., Lab on a Chip 15: 3556 (2015). [4] Hu, H., & Larson, R. G., Langmuir 21: 3972 (2005).
5