ALMA MATER STUDIORUM - UNIVERSITY OF BOLOGNA
FACULTY OF AGRICULTURE
PhD
IN FOOD SCIENCE
Food safety in wine:
optimization of analytical controls and
evaluation of production technologies
Presented by
Dott. Claudia Corzani
Coordinator
Tutor
Prof. Claudio Cavani
Prof. Giuseppe Arfelli
Academic triennium 2005-2007
Cycle XX
I
Index
Preface
1 Biogenic amines
11.1 Definition 1
1.2 Mechanism of amines formation 1
1.3 Biogenic amines in food 3
1.4 Biogenic amines in wine and factors that influence their presence 7
1.5 Influence of winemaking process on the production of biogenic amines 9
1.6 Reduction of biogenic amine content in wine 12
1.7 Microorganism producing biogenic amines in wine 13
1.8 Factor affecting activity of lactic acid bacteria in wine 13
1.9 Toxicological effect 16
1.10 Analytical methods 17
1.11 Simultaneous determination analysis of amino acids and biogenic amines 19 in wines
1.11.1 Aim of work 19
1.11.2 Experimental 19
1.11.3 Results and discussion 22
1.11.4 Conclusion 31
1.12 Validation of a HPLC method for simultaneous determination of amino acids and amines with precolumn-derivatization with 9-Fluorenyl-methoxycarbonyl chloride (FMOC-Cl) and UV detection using a monolithic column 32
1.12.1 Aim of work 32
1.12.2 Experimental 32
1.12.3 Results and discussion 35
1.12.4 Conclusion 44
1.13 A survey of amino acids and biogenic amines in wines produced in the
Emilia Romagna region 45
II
1.13.2 Experimental 45
1.13.3 Results and discussion 45
1.13.4 Conclusion 48
1.14 Determination of biogenic amines in red wines: influence of enological 49 practices and composition of wine
1.14.1 Aim of work 49
1.14.2 Experimental 49
1.14.3 Results and discussion 52
1.14.4 Conclusion 62
Biogenic amines references 63
2 Ochratoxin A
812.1 Natural occurrence of ochratoxin A 81
2.2 OTA in grapes derivates 82
2.3 Sources of OTA contamination in grapes 83
2.4 Factor influencing production of OTA concentration in wine 84
2.5 Prevention strategies in vineyard 85
2.6 Prevention strategies in winery 86
2.7 Regulation of OTA levels in grape-derived products 90
2.8 Biological effects of OTA 90
2.9 Analytical methods for the detection of OTA 91
2.10 Evaluation of different clean-up and analytical methods for the
determination of ochratoxin A 93
2.10.1 Aim of work 93
2.10.2 Experimental 93
2.10.3 Results and discussion 97
2.10.4 Conclusion 101
Ochratoxin A references 102
a
Preface
In the last ten years, the safe use of food products has been big acceleration in the field of scientific studies in order to be able to protect human health.
Security, in terms of the absence of chemical contaminants, physical and toxic agents of biological origin, it must be the most important and indispensable requirement of quality.
The quality and safety of food can be affected by many factors involved in the different stages of production, such as raw materials, techniques of production and conservation. Quality and food safety, therefore, should be guaranteed not only by respecting the laws, even for the control systems implemented by the manufacturer.
In this regard, the Community EC Regulation 178/2002, establishing the general rules for the traceability of food, allowed further protect consumers. However, to do the appropriate monitoring, it is indispensable to have analytical methodologies more reliable and speedy, that allow to carry out specific checks with limited use of resources.
The sector of beverages (e.g. wine, beer, fruit juices, soy milk, etc.) needs special attention, because the biotechnological process of transformation is quite complex.
The search for chemical contaminants of natural origin such as biogenic amines and mycotoxins has been particularly important in recent years, because these substances are dangerous to human health.
Biogenic amines are organic bases which are often in wines and other fermented foods and can cause a number of problems to humans. Some are already present in the must, others are produced and accumulated during the winemaking, by yeasts (during alcoholic fermentation), or bacteria (during malolactic fermentation) or other microorganism responsible for alterations of wine.
Mycotoxins, highly toxic molecules produced by several fungal species, have a stable configuration and a mutagenic and carcinogenic action. Concerning beverages, especially wine, is present ochratoxin A, produced by various species in the Penicillium and Aspergillus genera which widely occur in nature. The European Community established, with regulation 123/2005 dated 26th January 2005, the legal limit of ochratoxin A content in the Italian and European wines that is 2 micrograms/kg (ppb).
The following research has been proposed to validate and then apply innovative analytical methodologies for the determination of ochratoxin A and biogenic amines in white and red wines. The study was therefore conducted on different separate strands:
b
B) Validation of a HPLC method for simultaneous determination of amino acids and amines with precolumn-derivatization with 9-Fluorenyl-methoxycarbonyl chloride (FMOC-Cl) and UV detection using a monolithic column;
C) A survey of amino acids and biogenic amines in wines produced in the Emilia Romagna region;
D) Determination of biogenic amines in red wines: influence of enological practices and composition of wine;
1
1 Biogenic amines
1.1 Definition
Biogenic amines are basic nitrogenous compounds formed mainly by decarboxylation of amino acids or by amination and transamination of aldehydes and ketones (Askar A. and Treptow H., 1986; Maijala R.L. et al., 1993; Silla Santos M.H., 1996). They are organic bases with low molecular weight and are synthesized by microbial, vegetable and animal metabolisms (Brink B.
et al., 1990). Biogenic amines in food and beverages are formed by enzymes of raw material or
are generated by microbial decarboxylation of amino acids (Brink B. et al.,1990; Halasz A. et al., 1994) but it has been found that some of the aliphatic amines can be formed “in vivo” by amination from corresponding aldehydes (Maijala R.L., 1993).
The chemical structure of biogenic amines can either be: - aliphatic (putrescine, cadaverine, spermine, spermidine); - aromatic (tyramine, phenylethylamine);
- heterocyclic (histamine, tryptamine) (Silla Santos M.H., 1996).
Amines such as polyamines, putrescine, spermidine, spermine and also cadaverine are indispensable components of living cells and they are important in the regulation of nucleic acid fraction and protein synthesis and probably also in the stabilization of membranes (Bardocz S. et
al., 1993; Maijala R.L. et al., 1993; Halasz A. et al., 1994; Silla Santos M.H., 1996).
1.2 Mechanism of amines formation
Amine build-up usually results from decarboxylation of free amino acid by enzymes of bacterial origin. Amino acid decarboxylation takes place by removal of the α-carboxyl group to give the corresponding amine. Arginine is easily converted to agmatine, or as result of bacterial activity can be degraded to ornithine from which putrescine is formed by decarboxylation. Lysine can be converted by bacterial action into cadaverine. Histidine can, under certain conditions, be decarboxylated to histamine. Tyramine, tryptamine and β-phenylethylamine come by the same manner from tyrosine, tryptophan and phenylalanine, respectively.
Proteolysis, either autolytic or bacterial, may play a significant role in the release of free amino acids from tissue proteins which offer a substrate for decarboxylases reactions (Shalaby A.R., 1996).
2 O NH2 NH OH N H NH2 tryptophan → tryptamine O H NH2 serine → ethanolamine O NH2 NH2
phenylalanine → phenyl ethylamine
H N N CH2CHCOOH NH2 N N CH2CH2NH2 H histidine → histamine HO CH2CHCOOH NH2 HO CH2CH2NH2 tyrosine → tyramine
NH2 NH2 COOH
NH2 NH2 lysine → cadaverine NH2 COOH NH2 NH2 NH2 ornithine → putrescine O NH2 OH
3 NH2 COOH NH H2N NH N H2N NH H2N H arginine → spermine NH2 COOH NH H2N NH N H2N NH2 H arginine → spermidine NH2 COOH NH H2N NH NH2 COOH NH H2N NH arginine → agmatine
Prerequisites for biogenic amine formation by microorganisms are:
1) availability of free amino acids (Joosten H.M.L.J., 1988; Marklinder I. and Lonner C., 1992; Soufleros E. et al., 1998);
2) presence of decarboxylase-positive microorganisms (Tiecco T. et al., 1986; Brink B. et al.,
1990; Huis in’t Veld J.H.J. et al., 1990);
3) conditions that allow bacterial growth, decarboxylase synthesis and decarboxylase activity (Brink B. et al., 1990; Silla Santos M.H., 1996; Coton E. et al., 1998; Gardini F. et al., 2005).
1.3 Biogenic amines in food
In virtually, all food that contain proteins or free amino acids are subject to conditions enabling microbial or biochemical activity; biogenic amines can be expected. The total amount of the
4
different amines formed strongly depends on the nature of the food and the microorganisms present (Brink B. et al., 1990).
Biogenic amines are present in a wide range of food products including fish products, meat products, dairy products, wine, beer, vegetables, fruits, nuts and chocolate (Askar A. and Treptow H., 1986; Brink B. et al., 1990; Halasz A. et al., 1994; Silla Santos M.H., 1996; Shalaby A.R., 1996; Soufleros E. et al., 1998).
In non-fermented foods, the presence of biogenic amines above a certain level is considered as indicative of undesired microbial activity, therefore, the amine level could be used as an indicator of microbial spoilage. However, the presence of biogenic amines in food does not necessary correlate with the growth of spoilage organisms, because they are not all decarboxylase-positive (Santos C. et al., 1985; Vidal-Carou M.C. et al., 1990a; Silla Santos M.H., 1996).
Levels of histamine, putrescine and cadaverine usually increase during spoilage of fish and meat whereas levels of spermine and spermidine decrease during this process (Brink B. et al., 1990). During the preparation of fermented food, the presence of many kinds of microorganisms can be expected, some of them are capable of producing biogenic amines. Most products, in which lactic bacteria grow, contain considerable amounts of putrescine, cadaverine, histamine, and tyramine (Brink B. et al., 1990).
FISH. Scombroid fish have most commonly been associated with incidents of histamine intoxication (scombrotoxicosis). The formation of histamine in scombroid and other marine fish containing abundant endogenous histidine has been attributed to microbial action rather than to endogenous histidine decardoxylase activity (Baranowski J.D. et al., 1985; Halasz A. et al., 1994). The histidine can be catabolized in two ways in fish muscle. The amino acid deamination to obtain urocanic acid or the histidine decarboxylation to form histamine (Mackie M. and Fernandez J., 1977). The deamination activity is the principal way in normal physiological conditions; decarboxylation activity can be most important in other circumstances, e.g. bacterial contamination (Vidal M.C. and Mariné A., 1984).
Different biogenic amines (histamine, putrescine, cadaverine, tyramine, spermine, spermidine) have been detected in fish such as mackerel, herring, tuna, sardines (Yoshida A. and Nakamura A., 1982; Vidal M.C. and Mariné A., 1984; Baranowski J.D., 1985; Silla Santos M.H., 1996; Merialdi G. et al., 2001).
Other amines, such as trimethylamine and dimethylamine are present in fish and fish products at levels determined by the fish freshness (Hotchkiss J.H., 1989; Pfundstein B. et al., 1991; Silla Santos M.H., 1996).
5
FRESH FRUIT, JUICES AND VEGETABLES. Amines were found to be widespread in fruits and vegetables (Lovenberg W., 1973; Shalaby A.R., 1996).
Several juices, nectars and lemonades made from oranges, raspberries, lemons, grapefruits, mandarins, strawberries, currant and grapes contain different biogenic amines in variable concentrations: putrescine is the most important (Maxa E. and Brandes W., 1993).
Halasz A. et al. (1994) have reported high amine levels in orange juice (noradrenaline, tryptamine), tomato (tyramine, tryptamine, histamine), banana (tyramine, noradrenaline, tryptamine, serotonin) and plum (tyramine, noradrenaline) and spinach leaves (histamine). Phenylethylamine is also a natural constituent of cocoa beans and thus occurs in chocolate, chocolate products and confectionery containing chocolate. Some species of mushrooms also contain high levels of phenylethylamine and in white and black pepper and soy sauce high levels of pyrrolidine have been detected (Pfundstein B. et al., 1991).
Fermented vegetables represent another class of food from which biogenic amines have been isolated. The main biogenic amines in sauerkraut are histamine, tyramine, putrescine and cadaverine, while β-phenylethylamine is found only in minor quantities (Taylor S. et al., 1978; Brink B. et al., 1990; Silla Santos M.H., 1996).
MEAT AND FERMENTED MEAT PRODUCT. Meat and meat products have been reported to contain tyramine, cadaverine, putrescine, spermine, and spermidine (Koehler P.E. and Eitenmiller R.R., 1978; Santos Buelga C. et al., 1986; Stratton J.E. et al., 1991; Shalaby A.R., 1996).
Maijala R.L. et al. (1993) detected increased concentrations of histamine and tyramine during sausage fermentation. Fermentation may be important in the formation of histamine in certain types of sausage. Semi-dry sausages are fermented for short periods often with lactic acid cultures, while dry sausages are allowed to ferment from the action of natural microflora for a long period. During the sausage ripening process, the histamine concentration increases at least 10-fold during the first 3 days of ripening (Silla Santos M.H.,1996; Shalaby A.R., 1996). In general, quite variable quantities of biogenic amines were reported for sausages. The variable concentration could be due to the variation of the ripening process time (Cantoni C. et al., 1974), the variation and difference of decarboxylase activity of the natural microflora responsible for fermentation and the biosynthesis and metabolism of such amines in addition to variations in the manufacturing process, the great variation in the type and quality of the meat used, the proportion of meat content included and the length of maturation (Shalaby A.R., 1996).
CHEESE AND DAIRY PRODUCTS. After fish, cheese is the most commonly implicated food item associated with histamine poisoning and the first reported case occurred in 1967 in Netherlands and involved Gouda cheese (Stratton J.E. et al., 1991). The most important biogenic
6
amines occurring in cheeses are tyramine, histamine, putrescine, cadaverine, tryptamine and β -phenylethylamine (Sumner S.S. et al., 1985; Stratton J.E. et al., 1991; Besançon X. et al., 1992; Celano G.V. et al., 1992; Diaz-Cinco M.E. et al., 1992; Moret S. et al., 1992; Halasz A. et
al.,1994; Silla Santos M.H., 1996). During cheese ripening, casein is slowly degraded by
proteolytic enzymes, leading to an increase of free amino acids content (Joosten H.M.L.G. and Olieman C., 1986), which can be subjected to subsequent breakdown reactions and catalyzed by specific bacterial decarboxylases to give rise to the formation of CO2 and amines. Therefore,
biogenic amines are gradually increased with different levels especially histamine, putrescine and cadaverine by extending cheese ripening time. Processed cheeses which are subjected to high temperature during manufacturing contained appreciable levels of biogenic amines (Shalaby A.R., 1996).
WINE AND BEER. Wine, like other fermented foods, is an ideal substrate for amine production, as its manufacturing process involves not only available free amino acids, but also the possible presence of decarboxylase-positive microorganisms and the environmental conditions that allow the growth of microorganisms, as well as the activity of decarboxylase enzymes.
The formation of biogenic amines has been associated to the alcoholic fermentation (Vidal-Carou M.C. et al., 1990b) and/or the malolactic fermentation (Lonvaud-Funel A. and Joyeux A., 1994; Coton E. et al.,1998; Lonvaud-Funel A., 2001). Bad sanitary conditions, during the winemaking process, also contributed to an increased formation of biogenic amines (Vidal-Carou M.C. et al., 1991; Zee J.A. et al.,1983).
The formation of biogenic amines in wine is dependent upon the presence of certain microorganisms as well as on the content of the precursor amino acids, duration of the initial fermentation phase, period of contact of must with grape skin, levels of sulfure dioxide, pH and duration of wine contact with yeast lees (Vidal-Carou M.C. et al., 1990b; Martelli A. et al., 1997). Biogenic amines can also be present in the must itself (Daeschel M.A., 1996).
Many types of biogenic amine have been detected in both white and red wine: tyramine, histamine, tryptamine, monomethylamine, 2-phenethylamine, putrescine, cadaverine, spermidine (Zee J.A. et al., 1983; Lehtonen P. et al., 1992; Bauza T. et al., 1995a; Silla Santos M.H., 1996). In beer the presence of biogenic amines is related to the yeast activity (Saccharomyces cerevisiae,
Saccharomyces carlsbergensis) or to microbiological contamination (Lactobacillus,
Pediococcus). Formation of some amines in beer has been related to unsanitary conditions during
production and to raw material quality, because of hop(Humulus lupulus) is a natural source of histamine (Martelli A. et al.,1997).
7
Halasz A. et al. (1994) investigated the influence of technological conditions of beer production on biogenic amine formation. Barley variety, malting technology, wort processing and fermentation conditions seem to affect the total biogenic amines content of beer.
The amount of biogenic amines in beer and wine is considerably lower than in other fermented foods such as cheese (Martelli A. et al.,1997; Soufleros E. et al., 1998).
1.4 Biogenic amines in wine and factors that influence their presence
The presence of amines in musts and wines is well documented in the literature (Ough C.S. et al., 1981; Zee J.A. et al., 1983; Radler F. and Fath K.P., 1991; Mafra I. et al., 1999). However, the processes that generate these amines, together with the factors that influence their quantitative and qualitative presence are in some cases not well defined yet (Radler F. and Fath K.P., 1991; Herbert P. et al., 2005; Guerrini S. et al., 2005).
They may be three possible origins of biogenic amines in wines (Lafon-Lafourcade S. and Joyeux A., 1976):
a) some amines are already present in the must, namely histamine and tyramine (Mayer K. and Pause G., 1973; Buteau C. et al., 1984; Vidal-Carou M.C. et al., 1990b);
b) they are formed by yeast during alcoholic fermentation (Buteau C. et al.,1984; Vidal-Carou M.C. and Marinè-Font A., 1985) and/or they are formed by the action of bacteria involved in the malolactic fermentation (Aerny J., 1985; Bertrand A. et al., 1989; Vidal-Carou M.C. et al., 1990c; Bauza T. et al., 1995b).
Furthermore, Buteau C. et al. (1984); Vidal-Carou M.C. et al. (1991); Lehtonen P. (1996); Bravo-Abad F. (1996) indicated the possibility that biogenic amines are formed in wine by the action of contaminant microorganism such as the enteric bacteria Klebsiella and Proteus. Cerutti G. and Remondi L. (1972) indicated out that “a wine produced in optimal conditions, from a hygienic point of view, should be nearly free of amines”. Likewise Zappavigna R. et al. (1974) pointed out that technological conditions of the winemaking process and the quality of raw materials employed have a definite influence on the intensity of amine biogenesis. On the basis, histamine has been proposed as an indicator of defective manufacturing (Battaglia R. and Frolich P., 1978) or as a quality parameter of wines (Coppini D. et al., 1973; Inigo B. and Bravo F., 1980).
The amines more commonly found in wine are histamine, tyramine, putrescine, cadaverine (Vidal-Carou M.C. et al., 1990b; Lehtonen P., 1996; Soufleros E. et al., 1998; Vazquez-Lasa M.B. et al., 1998; Coton E. et al.,1999; Lonvaud-Funel A., 2001).
8
It is generally accepted that red wine contain higher concentrations of biogenic amines than white wines (Lafon-Lafourcade S. and Joyeux A., 1976; Zee J.A. et al., 1983; Cilliers J.D. and Van Wyk C.L., 1985; Cerutti G. et al., 1986; Vidal-Carou M.C. et al., 1990c; Bauza T. et al., 1995b; Kallay M. and Body-Szalkai M., 1996; Vazquez-Lasa M.B. et al., 1998; Gerbaux V. and Monamy C., 2000; Arena M.E. and Manca de Nadra M.C., 2001; Galgano F. et al., 2003; Leitao M.C. et al., 2005; Bover-Cid S. et al., 2006). It can be explained by the difference in the vinification techniques.
The variability in biogenic amines contents of wine could be explained on the basis of differences in:
- type of soil(Baucom T.L. et al., 1986);
- variety(Zee J. et al., 1983; Beatriz M.A.G. et al., 1998; Nicolini G. et al., 2003; Bertoldi D.
et al., 2004; Landete J.M. et al., 2005a) and degree of maturation of the grape (Ough C.S.,
1971; Herbert P. et al., 2005);
- raw material quality (Karmas E., 1981; Onal A., 2007);
- precursor free amino acids (Cerutti G. et al., 1978; Soufleros E. et al., 1998);
- contact time of must and grape skin (Ough C.S., 1971; Inigo B. and Bravo F., 1980; Guitart A. et al., 1997; Martin-Alvarez P.J. et al., 2006);
- action of yeast in alcoholic fermentation (Vidal-Carou M.C. et al., 1990b; Torrea Goni D. and Ancin Azpilicueta C., 2001; Caruso M. et al., 2002; Torrea Goni D. and Ancin Azpilicueta C., 2002; Valero E. et al., 2003);
- alcohol content (Landete J.M. et al., 2004; Vidal-Carou M.C. et al., 1990b);
- sulfur dioxide concentration (Rivas-Gonzalo J.C. et al., 1983; Vidal-Carou M.C. et al., 1990b; Ferrer S. and Pardo I., 2005);
- added nutrients(Gloria M.B.A. et al., 1998);
- pH (Cerutti G. and Remondi L., 1972; Aerny J., 1990; Vidal-Carou M.C. et al., 1990b; Lonvaud-Funel A., 2001; Landete J.M. et al., 2004; Landete J.M. et al., 2005a; Ferrer S. and Pardo I., 2005);
- quantity and type of fining agents (Jakob L., 1968; Spettoli P., 1971; Kallay M. and Body-Szalkai B., 1996; Eder R. et al., 2002);
- duration of wine contact with yeast lees and marcs (Bauza T. et al., 1995a; Coton E. et al., 1999; Lonvaud-Funel A., 2001);
9
- action of lactic acid bacteria in the malolactic fermentation (Delfini C., 1989; Vidal-Carou M.C. et al., 1990b; Funel A. and Joyeux A., 1994; Coton E. et al.,1998; Lonvaud-Funel A., 2001; Guerrini S. et al., 2002; Landete J.M. et al., 2005a; Palacios A. et al., 2005); - time and storage conditions (Gonzalez J.M. et al., 1977; Ough C.S. et al., 1981; Gonzalez A.
and Ancin Azpilicueta C., 2006; Landete J.M. et al., 2005a);
- possible microbial contamination during winemaking (Zee J.A. et al., 1983; Vidal-Carou M.C. et al., 1991).
Some of these factors increase the concentration of precursor amino acids of biogenic amines in the medium, while other favor the development of microorganisms with the ability to form amines (Torrea Goni D. and Ancin Azpilicueta C., 2001).
1.5 Influence of winemaking process on the production of biogenic amines
Some amines, such putrescine, may already be present in grapes (Brodequis M. et al., 1989) whereas other can be formed and accumulated during winemaking (Rivas-Gonzalo J.C. et
al.,1983; Vidal-Carou M.C. et al., 1990b; Bauza T. et al., 1995a; Martin-Alvarez P.J. et al.,
2006).
The main factor affecting its formation during vinification are free amino acid concentrations and the presence of microorganisms able to decarboxylate these amino acids.
1.5.1 TYPE OF SOIL AND GRAPES HEALTH
The composition and type of soil can influence the content of biogenic amines. Di- and polyamine metabolism is dependent on external conditions and a major shift in nitrogen and amine metabolism can occur when plants are starved of nutrients, or exposed to osmotic shock or atmospheric pollution (Bouchereau A. et al., 1999).
Some Authors (Broquedis M. et al., 1989; Adams D.O. et al., 1990; Vaz de Arruda Silveira R.L.
et al., 2001) observed that potassium deficiency increase the levels of putrescine in grapevine
leaves. This amine could be accumulated in the grapes, and, as a result, remain in the wine. Viticulture practices that do not prevent potassium deficiency may contribute to increase the content of putrescine in wine (Leitao M.C. et al., 2005).
In the grapevine, biotic stress, such as Botrytis cinerea, can also alter the composition of grape berries, increasing amines content (Hajos G. et al., 2000). Botrytis cinerea metabolism induces a decrease in the water content of the grapes, while the content of sugar, amino acids, biogenic amines (polyamine) increases and the taste improves (Sass-Kiss A. et al., 2000).
10
1.5.2 VARIETY AND DEGREE OF GRAPES RIPENING
It was noticed that grape variety (Soleas G.J. et al., 1999; Hernandez-Orte P. et al., 2006; Soufleros E.H. et al., 2007), region of production and vintage can influence free amino acids and amines content of musts and wines (Zee J. et al., 1983; Beatriz M.A.G. et al., 1998; Nicolini G.
et al., 2003; Bertoldi D. et al., 2004; Landete J.M. et al., 2005b; Herbert P. et al., 2005).
The different degree of grape maturity and the duration of maceration may also influence the nitrogenous components in the raw materials used for fermentation (Ough C.S., 1971; Herbert P.
et al., 2005).
During maturation, amino acids content increases from 2 to 5 times and it becomes the main type of nitrogen(50-90 % of total nitrogen).It decreases, during over ripening and in rotted berries, in dry conditions (Ribéreau-Gayon P. et al., 1998b).
1.5.3 DURATION OF SKIN MACERATION
During alcoholic fermentation, the duration of skin maceration is the first factor that affect extraction of some compounds present in the skin, such as phenolic compounds, which are responsible for wine color. However, maceration affects the extraction not only of phenolics but also of other grape components, such as proteins, polysaccharides and also amino acids, which are the precursors of biogenic amines (Ribéreau-Gayon P., 1998a). For this reason, it is important to have a thorough knowledge of influence of the duration of maceration on the accumulation of biogenic amines in wines (Martin-Alvarez P.J. et al., 2006). These results obtained are in agreement with previous studies that showed that longest maceration times could favor a greater production of biogenic amines (Bauza T. et al., 1995b; Guitart A. et al., 1997).
1.5.4 USE OF PECTOLYTIC ENZYMES
Commercial pectolytic enzymes are used in winemaking to increase juice yields, facilitate pressing and filtering, to provide a great clarity to must and wines, to have a good extraction of phenols and aromas. However, mainly depending on the composition of these commercial preparations, they may also produce concomitant effects, such as an important proteolytic activity, which can lead to hydrolysis of proteins and peptides and release of amino acids (Ferrer S. and Pardo I., 2005). Martin-Alvarez P.J. et al. (2006) reported that there was little change in biogenic amine composition as a consequence of the use of commercial pectolytic enzymes. Only the mean concentration of phenylethylamine and cadaverine were affected by the use of these enzymes. However, it is interesting to note that the mean values of these amines were lower in the wines with supplements of pectinases compared with the wines manufactured without enzymes, showing that, apparently, use of these enzymes does not favor accumulation of amines in wines.
11 1.5.5 CONTACT WITH YEAST LEES
An extended contact with lees of yeast leads to higher amine content, than a short contact (Cerutti G. et al., 1987). If wines are maintained in contact with yeast lees, lactic acid bacteria find more peptides and free amino acids to hydrolyze and decarboxylate. This explains the higher level of amines in some wines which are produced with an extended lees contact (Coton E. et al., 1999; Lonvaud-Funel A., 2001).
Martin-Alvarez P.J. et al. (2006) compared wines aged or not with lees and they found that the mean concentration of methylamine and putrescine were higher in wines aged on yeast lees. This was probably because through contact of wine with lees, the proteins are initially hydrolyzed to peptides of different molecular weight and these peptides are later degraded further to amino acids and amines as consequence of yeast and bacteria lysis. These results agree in part with those of Bauza T. et al. (1995a), who also found a higher production of tyramine and putrescine in wines added with lees and inoculated with lactic bacteria.
1.5.6 MALOLACTIC FERMENTATION
Malolactic fermentation (MLF) is an important biological process in winemaking because it reduces wine acidity and, if carried out by proper strains of lactic acid bacteria (LAB), it improves the flavor and the microbial stability during the wine aging (Davis C.R. et al., 1985). MLF is therefore considered essential for most red and some white wines. Oenococcus oeni, due to its acid tolerance, is the most frequent bacterial species occurring in wine having spontaneous MLF and thus it is also the preferred bacterium used as starter culture in induced MLF. However,
O. oeni has recently been found capable of producing a wide range of biogenic amines
(Lonvaud-Funel A., 2001; Guerrini S. et al., 2002). 1.5.7 LACK OF HYGIENE
Formation of some amines in wines has been related to unsanitary conditions during the winemaking process (Vidal-Carou M.C. et al., 1991).
Bacterial contamination in wineries is an important factor (Marquardt P. et al.,1963; Coton E. et
al., 1999), especially during the malolactic fermentation, where efficient control is necessary to
avoid amine formations; all cleaning and disinfection methods are important. Addition of sulfur dioxide in wines inhibits microorganism and directly influences amine contents (Zee J.A. et al., 1983).
In wines, high levels of histamine have been related to spoilage bacteria mainly Pediococcus spp. (Aerny J., 1985; Delfini C., 1989). Pediococcus can be present in wine, but usually in a few number of cells.
12 1.5.8 WOOD AGING
Wood aging can effect biogenic amines contents of wines because it could increase the microbial contamination risk(Bauza T. et al., 1995a; Bauza T. et al., 1995b;Gerbaux V. and Monamy C., 2000; Woller R., 2005).
An investigation on the evolution of amines in red wines during aging in American oak barrels (Quercus alba) and French oak barrels (Quercus sessilis) from the Allier and Nevers regions was carried out by Jimenez Moreno N. et al. (2003). The results showed that the evolution of amines were similar in all three types of oak woods. Histamine and tyramine were produced at the beginning of the aging process, although they were not accumulated in the wines, probably due to their degradation. The production of histamine during the first months of aging was probably due to the proliferation of microorganism with decarboxylase activity and could be favored by the release of amino acids at the end of fermentation because of yeast autolysis and alteration of yeast plasma membrane. Putrescine was the most abundant amine in the wines; its concentration increased to an important extent during aging as it did not undergo degradation. The concentration of cadaverine increased slightly at the first stage of aging and, like putrescine, did not degrade at all.
1.6 Reduction of biogenic amines content in wine
Clarification is the best oenological treatment to reduce the biogenic amines content in wine. Clarification can be carried out by physical methods (sedimentation, flotation, centrifugation and filtration) or by fining agents addition (gelatine, albumin, casein) or by pectolytic enzymes addition (Ribéreau-Gayon P. et al., 1998b).
Research carried out by Enartis (www.enartis.it) on bentonite, pvpp, silica sol, active charcoal, tannin and albumin showed that only bentonite was effective in reducing the amines content. A decrease in the amines content was directly related to the amount of bentonite (www.enartis.it; Mannino M. et al., 2006).
Kally M. e Body-Szalkai M. (1996) observed that, in red wines, 80 g/hL of bentonite reduced histamine content by 60 % and more with a higher amount of bentonite. The wine color must be considered, because bentonite reduce it.
Other Authors put in evidence the efficiency of bentonite in amines content decreasing (Jakob L., 1968; Spettoli P., 1971;Mannino M. et al., 2006).
Mannino M. et al. (2006) carried out trials on different fining agents (bentonite, tannin and gelatin) to verify the possibility to reduce the amount of bentonite in amines removing. They found that the addition of tannin before bentonite addition is useful to reduce amines content of
13
2-6 time. So, it is possible to decrease the amount of bentonite added to wine and to preserve wine sensory characteristics.
The clarification induces a loss of nitrogen compounds. The use of silica sol induces a good decrease of nitrogen compounds, while pectolytic enzymes improves the amino acids content n relation to their activity on proteins and peptides (Guitart A. et al., 1998).
The clarification carried out with physical treatments not always induces a decrease in amino acids amount.
1.7 Microorganism producing biogenic amines in wine
Usually amines production results from the presence of bacteria that are capable of decarboxylating amino acids (Gale E.F., 1946).
Musts and wines are very selective media, which can support growth of only few species of lactic acid bacteria (LAB). Four genera are represented: Lactobacillus, Pediococcus, Leuconostoc and
Oenococcus. During alcoholic fermentation, the LAB population is mainly composed of Pediococcus along with Oenococcus oeni. The homofermentative lactobacilli, the major type
present on grapes, disappear quickly after the start of alcoholic fermentation in favor of
Leuconostoc mesenteroides which, at the end of the fermentation, is replaced by O. oeni
(Moreno-Arribas M.V. et al., 2003).
Among lactic acid bacteria, O. oeni is the main species present in wine and the best adapted to carry out the malolactic fermentation at the low pH of wine (Wibowo D.
et al., 1985). If biogenic amines formation is associated to MLF, it would be expected that O. oeni has the enzymes for breakdown of peptides and decarboxylation of amino acids present in
wine in this stage (Leitao M.C. et al., 2000).
1.8 Factors affecting activity of lactic acid bacteria in wine
Sulphur dioxide. The antimicrobial activity of SO2 is based on their ability to pass across cell
membrane.
The few data in literature regarding the relationship between this antiseptic and biogenic amines accumulation in wine generally report that SO2 added at high levels decreases biogenic amines
formation (Rivas-Gonzalo J.C. et al., 1983; Vidal-Carou M.C. et al., 1990c) since it inhibits the development of microorganisms with amino acid decarboxylase activity (Palacios A. et al., 2005). In fact, Bauza T. et al. (1995a) demonstrated that, in the presence of 100 mg/L and more of this antiseptic, the accumulation of biogenic amines in wine was greatly reduced. Red wines with about 40 mg/L of SO2 contained more tyramine (8 mg/L) than histamine (2 mg/L), while the
14
ratio changed (4 and 7 mg/L respectively) if the sulfitation reached 85 mg/L (Vidal-Carou M.C.
et al., 1990b).
The SO2 effect on biogenic amines accumulation depend also on other variables. In fact, at the
higher pH values an increase of SO2 caused a diminution of tyramine concentration. An opposite
effect was observed when pH decreased (Gardini F. et al., 2005).
A sulfitation after racking must be avoid, if the malolactic fermentation is requested (Aerny J., 1985; Bauza T. et al., 1995b). Sulphur dioxide delays the start of MLF because Leuconostoc
oenos is negatively influenced. In these conditions Pediococcus strains, producer of biogenic
amines, is favored (Aerny J., 1990; Ingargiola M.C. and Bertrand A., 1992). So, the use of sulphur dioxide must be delayed after MLF.
After malolactic fermentation, wine is sulfited in order to eliminate yeast and bacteria which are no more desirable. This would normally prevent any changes in composition due to microorganisms. However, several compounds change in level and this is the case of biogenic amines. In Burgundy wines, histamine, tyramine and putrescine showed an increase in Chardonnay and Pinot noir during malolactic fermentation, and also during aging (Gerbaux V. and Monamy C., 2000). Histamine and tyramine content continuously increased. In their study, Gerbaux V. and Monamy C. showed that a more active phase was between the fourth and eighth month after malolactic fermentation. It was obvious that sulphur dioxide did not completely stop all the biochemical reactions triggered by bacteria. Due to high pH, a situation which is becoming more and more frequent, SO2 is less active and it is accentuated in red wines due to its
combinations to polyphenols (Lonvaud-Funel A., 2001).
The use of lysozyme is suggested to replace sulphur dioxide in lactic bacteria control. Lysozyme is more specific than SO2 in lactic bacteria control and its activity improves when the pH rises
(Gerbaux V. and Monamy C., 2000). An addition of 125 a 250 mg/L of lysozyme before MLF stops the increase of biogenic amines.
pH. It is the most important factor determining not only the biological activity of bacteria in wine
but also their variety (Lonvaud-Funel A. and Joyeux A., 1994; Gerbaux V. and Monamy C., 2000; Landete J.M. et al., 2005b). The higher the pH, the more complex the bacterial microflora, because pH acts as a selective factor of microorganisms in wine (Lonvaud-Funel A., 2001). At high pH, biogenic amines are always produced in high amounts (Lonvaud-Funel A. and Joyeux A., 1994). This is a consequence of an easier total growth and of the greater bacterial diversity. White wines, which are generally rich in acidic compounds, contain lower biogenic amine concentrations than red wines (Gerbaux V. and Monany C., 2000).
15
The influence of ethanol is related to pH and SO2. In wines with high pH and low amounts of
SO2, MLF can occur also if the ethanol content is high (Schieri G., 1991).
Temperature. Lactic bacteria can normally growth in a range of 10-30 °C, out of this range their
metabolism is reduced or stopped. The optimum temperature is 20-25 °C for Leuconostoc and 25-30 °C for Lactobacillus. At 35 °C the growth of lactic bacteria can be stopped (Schieri G., 1991).
Temperature is influenced by ethanol; if the alcohol is 13-14 %, the optimum temperature decreases (Ribéreau-Gayon P. et al., 1998a).
If MLF starts, lactic bacteria can complete it also if temperature falls down (Ribéreau-Gayon P. et
al., 1998a).
The influence of temperature on lactic bacteria growth is also relate to pH and SO2. A good level
of one of this parameters can positively influence the bacteria metabolism, also if the other parameters are bad (Palacios A. et al., 2005). For example, if the pH is good, lactic bacteria can growth better than in a wine with a low pH, also with high content of ethanol and SO2
(Ribéreau-Gayon P. et al., 1998b).
Nutrition. The amount of biogenic amines is strictly related to the presence of nutrients in wine
(Lonvaud-Funel A. and Joyeux A., 1994; Palacios A. et al., 2005).
The lactic bacteria needs of organic compounds: sugars, amino acids and organic acids.
Sugars are the best nutrient for lactic bacteria because they provide energy stored in ATP molecules. Also citric acid and arginine provide energy to lactic bacteria. Malolactic fermentation and histidine decarboxylation are useful to conserve energy (Ribéreau-Gayon P. et al., 1998a). Lactic bacteria are not able to synthesize amino acids on the contrary of yeasts (Schieri G., 1991). Amino acids must be present in wine to have lactic bacteria growth (Coton E. et al., 1999). The different strains have different needs: cocci are more exigent than bacilli. Normally, alanine, arginine, cystine, glutamine, histidine, leucine, phenylalanine, serine, tryptamine, tyramine and valine are necessary together or in part. Amino acids are usually used to synthesize new proteins or to provide energy (arginine and histidine) (Ribéreau-Gayon P. et al., 1998a).
After alcoholic fermentation yeast lees undergo proteolysis and release amino acids and peptides in the medium. This release is useful for the following activity of lactic bacteria.
Other factors can influence lactic bacteria growth:
Osmotic pressure. Most bacteria cannot survive at high osmotic pressure or at low water
activity. With sugar concentration of 40 % or more lactic bacteria cannot growth, even if they can survive.
16
Oxygen.Lactic acid bacteria derive benefit from the increase of the oxidoreduction potential of wine in order to multiply or at least to improve their existence temporarily (Millet V. et al., 1995).
1.9 Toxicological effect
Biogenic amines, such as tyramine and β− phenylethylamine, have been proposed as the starters of hypertensive crisis in certain patients and dietary-induced migraine. Another amine, histamine, has been implicated as the causive agent in several outbreaks of food poisoning. Histamine intake ranged within 8-40 mg, 40-100 mg and higher than 100 mg may cause slight, intermediate and intensive poisoning, respectively (Parente E. et al., 2001). Nout M.J.R (1994) pointed out that the maximum daily intake of histamine and tyramine should be in the range of 50-100 mg/kg and 100-800 mg/kg, respectively; over 1080 mg/kg tyramine becomes toxic. Putrescine, spermine, spermidine and cadaverine have not adverse health effect, but they may react with nitrite to form carcinogenic nitrosoamines and also can be proposed as indicators of spoilage (Hernandez-Jover T. et al., 1997). Tryptamine can induce blood pressure increase, therefore causes hypertension, however there is no regulation on the maximum amount of tryptamine consummation in sausage in some countries (Shalaby A.R., 1996).
Food poisoning may occur especially in conjunction with potentiating factors such as monoamine oxidase inhibiting (MAOI) drugs, alcohol, gastrointestinal diseases and other food containing amines. Histaminic intoxication, hypertensive crisis due to interaction between food and MAOI anti-depressants and food-induced migraines are the most common reactions associated with the consumption of food containing large amounts of biogenic amines (Marine-Font A. et al., 1995). The diamines (putrescine and cadaverine) and the polyamines (spermine and spermidine) favor the intestinal absorption and decrease the catabolism of the above amines, thus, potentiating their toxicity (Bardocz S., 1995). Formation of nitrosoamines, which are potential carcinogens, constitutes an additional toxicological risk associated to biogenic amines, especially in meat products that contain nitrite and nitrate salts as curing agents (Scanlan R.A., 1983).
Determination of the exact toxicity threshold of biogenic amines in individuals is extremely difficult, since the toxic dose is strongly dependent on the efficiency of the detoxification mechanisms of each individual (Halasz A. et al., 1994). Normally, during the food intake process in the human gut, low amounts of biogenic amines are metabolized to physiologically less active degradation products. This detoxification system includes specific enzymes such as diamine oxidase (DAO). However, upon intake of high loads of biogenic amines in foods, the detoxification system is unable to eliminate these biogenic amines sufficiently. Moreover, in the
17
case of insufficient DAO activity, caused for example by generic predisposition, gastrointestinal disease or inhibition of DAO activity due to secondary effects of medicines or alcohol, even low amounts of biogenic amines cannot be metabolized efficiently (Bodmer S. et al., 1999). Some biogenic amines, e.g., histamine and tyramine, are considered as antinutritional compounds. For sensitive individuals they represent a health risk, especially when their effects is potentiated by other substances. Poisoning by histamine with its allergy-like symptoms is usually related to the consumption of scombroid fish such as tuna or mackerel (Veciana Nogue M.T. et al., 1997) and is considered to be one of the commonest forms of food intoxication reported.
1.10 Analytical methods
There are two reasons for determination of amines in food: the first is their potential toxicity; the second is the possibility of using them as food quality markers.
Analytical determination of biogenic amines is not simple because of their structure and because they are usually present at low levels in a complex matrix.
Biogenic amines in food have been determined in different ways, including thin-layer chromatography (TLC), gas chromatography, capillary electrophoretic method (CE) and high performance liquid chromatography (HPLC) (Busto O. et al., 1996). All the analytical techniques mentioned have an associated pre- or post- chromatographic treatment to improve the selectivity and sensitivity of different methods. However, it is not always necessary to resort to these treatments because the sample can be directly injected as long as there is a suitable detection system, both in GC and HPLC (Seiler N., 1977).
Many analytical methods have been proposed for the analysis of amino acids and biogenic amines. The most useful RP-HPLC method include precolumn derivatization. Since the aliphatic biogenic amines do not have chromophore groups which give pronounced absorption in the UV-Vis region, derivatization techniques have to be resorted in order to increase the sensitivity of the detection (Seiler S. and Demisch L., 1978).
Obtaining fluorescent derivates is the most widely used method since it can determine low concentration of amines with great sensitivity and selectivity.
Typical reagents for precolumn derivatization are phenylisothiocyanate (PITC) (Bidlingmeyer B.A. et al., 1987); o-phthalaldehyde (OPA) (Jones B.N. and Gilligan J.P., 1983); 9-fluorenyl-methyl-chloroformate (FMOC-Cl) (Einarsson S. et al., 1983); 1-fluoro-2,4-dinitrobenzene (FDNB) (Morton R.C. and Gerber G.E., 1988); 1-fluoro-2,4-dinitrophenyl-5-L-alanine amide (DNPAA) (Kochhar S. and Christen P., 1989); and dansyl-chloride (Thio A.P. and Tompkins D.H., 1989; Sarwar G. and Botting H.G.,1993; Romero R. et al., 2000).
18
Each of these reagents have particular advantages and limitations.
Phenylisothiocyanate (PITC) reacts with both primary and secondary amino acids to yield stable phenylthiocarbamoyl derivatives, which can be detected via using UV absorption. The main drawback of this ligand is its low sensitivity (Bidlingmeyer B.A. et al., 1984)
o-Phthalaldehyde (OPA) is itself nonfluorescent, but it reacts rapidly with primary amino acids at room temperature to form highly fluorescent isoindoles. The disadvantages of this method are the poor reactivity of OPA with secondary amino acids and the low stability of the reaction product (Lindroth P. and Mopper K., 1970; Roth M., 1971; Chen R.F. et al., 1979;Furst P. et al.,1990) 1-Dimethylaminonaphthalene-5-sulfonyl (dansyl) chloride forms fluorescent adducts with amino acids band primary and secondary amines but lacks selectivity (it reacts with both -OH and -NH2
groups) and requires rather long reaction times and high reaction temperatures (Tapuki Y. et al., 1981; Marquez F.J. et al., 1986)
In contrast 9-fluorenyl-methoxycarbonyl chloride (FMOC-Cl) reacts rapidly with amino acids to form highly fluorescent and stable adducts (Haynes P.A. et al., 1991; Ou K. et al., 1996). The advantages of using FMOC-Cl are the reaction is straightforward, rapid and can be performed at ambient temperature; the reaction products are stable at room temperature and can react with both primary and secondary amines. The major disadvantage of FMOC-Cl is its reactivity towards water; after hydrolysis and decarboxylation, the fluorescent alcohol, FMOC-OH, elutes in the middle of the chromatogram. At high concentrations, FMOC-OH overlaps with other amino acids in the chromatogram, complicating the quantification of these amino acids. In as much as FMOC-Cl is also fluorescent, excess reagent should be removed before chromatography, by extraction or by addition of a second reagent (1-aminoadamantane, ADAM) ADAM is a hydrophobic amine that reacts with FMOC-Cl in excess only to form a complex (FMOC-ADAM), thus allowing for the reduction of the chromatographic interference of FMOC-OH formed in alkaline medium (Einarsson S. et al., 1983; Gustavsson B. and Betnér I., 1990; Chan E.C.Y. et al., 2000).
19
1.11 Simultaneous determination analysis of amino acids and biogenic amines in wines
1.11.1 Aim of work
The aim of this work was to validate a new HPLC method for the simultaneous determination of amino acids and amines in musts and wines.
The validation of the method was in term of accuracy, precision, limit of detection and quantification.
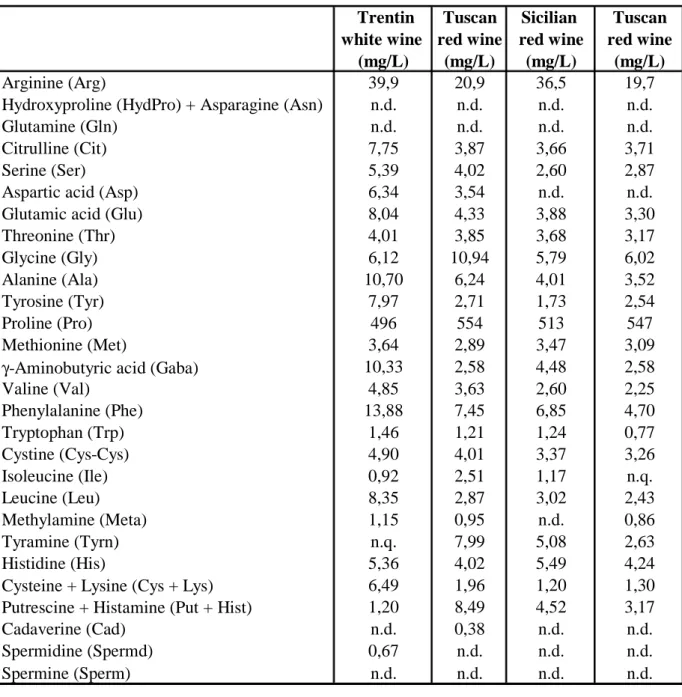
1.11.2 Experimental Samples
Four commercial wines from different Italian regions were analyzed. The samples were analyzed as the standard solution. The identification of the chromatographic peaks was confirmed using spiked samples.
Apparatus
An LC-1500 HPLC system (Jasco, Tokyo, Japan) was equipped with an MD-1510 diode-array detector set at 263 nm (λmax). Data were acquired and processed using Borwin-PDA Version 1,50 software (JMBS Developments, Grenoble, France). Samples were injected with a 20 µL loop using a 7125 valve (Rheodyne, Cotati, CA) onto a Luna RP-18 column (150 × 4 mm, 3 µm i.d.) protected with a guard column of the same material (Phenomenex, Torrance, USA). The column operated at 25 °C (Jones Chromatography, Mid Glamorgan, U.K.) with a flow rate of 0,5 mL/min.
Eluents
The separation was optimized using a mobile phase consisting two eluents.
Eluent A: sodium acetate (NaCH3COO) 50 mM (Carlo Erba, Milan, Italy) in H2O (Merck,
Darmstad, Germany) adjusted to pH = 4,2 with glacial acetic acid (Carlo Erba, Milan, Italy). Eluent B: CH3CN (Merck, Darmstad, Germany).
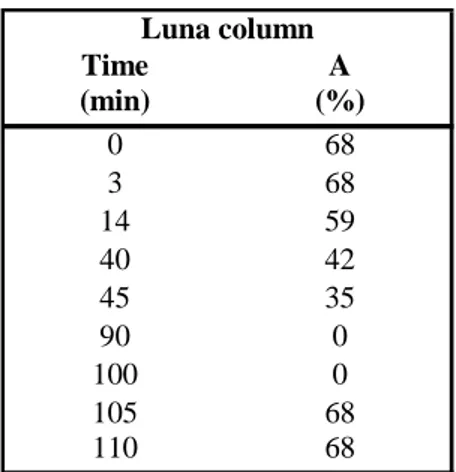
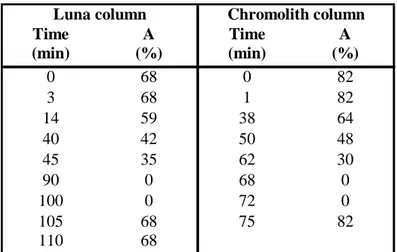
Eluents were filtered through a 0,22 µm nylon membrane filter. The binary gradient was constructed as described in table 1.
20
Table 1 - HPLC elution program for amino acids and biogenic amines analysis with Luna column.
Reagents
- borate buffer: 1,24 g boric acid (H3BO3) (Merk, Germany) in 100 mL of water adjusted to pH
= 8,25 with concentrated sodium hydroxide (NaOH);
- 9-fluorenyl-methoxycarbonyl chloride (FMOC-Cl) (Sigma-Aldrich, Milan, Italy) 0,015 M in 10 mL of acetonitrile (CH3CN)(Merck, Darmstad, Germany);
- 1-ammino amantadine (ADAM) (Sigma-Aldrich, Milan, Italy) 0,03 M in 10 mL of water/ acetonitrile (H2O/CH3CN)(1:1, v/v);
- chloridric acid (HCl)(Carlo Erba, Milan, Italy).
Standard solution
Standards of 24 amino acids and 7 amines were dissolved in HCl 0,01M, then derivatized and filtered through a 0,45 µm polytetrafluorethylene (PTFE) membrane (Gyrodisc, Orange Scientific, Waterloo, Belgium) prior to HPLC analysis.
Arginine (Arg), Hydroxiproline (HydPro), Asparagine (Asn), Glutamine (Glu), Citrulline (Cit), Serine (Ser), Aspartic acid (Asp), Glutammic acid (Glu), Threonine (Thr), Glycine (Gly), Alanine (Ala), Tyrosine (Tyr), Proline (Pro), Methionine (Met), γ-aminobutyric acid (Gaba), Valine (Val), Phenilalanine (Phe), Triptophan (Trp), Cysteine (Cys), Isoleucine (Ile), Leucine (Leu), Methylamine (Meta), Tyramine (Tyrn), Histidine (His), Lysine (Lys), histamine (Hist) Cystine (Cys-Cys), Putrescine (Put), Cadaverine (Cad), Spermidine (Spermd), Spermine (Sperm) were taken as salts from Sigma-Aldrich, Milan, Italy.
Time A (min) (%) 0 68 3 68 14 59 40 42 45 35 90 0 100 0 105 68 110 68 Luna column
21
Derivatization procedure
Amino acids and amines were derivatized (FMOC–AA) at room temperature using a precolumn procedure. An aliquot of 300 µ L of sample (wine or a standard solution of amino acids and amines) was added to 600 µ L of a 200 mM borate buffer (pH 10,0). Then, 600 µ L of 15 mM FMOC-Cl (in CH3CN) was added to the wine and derivatization occurred. After 2 min, the
reaction was stopped by the addition of 600 µ L of 300 mM ADAM (H2O/CH3CN)(1:1, v/v) to
form the FMOC–ADAM complex. Then, after 2 minutes, the sample was filtered and analyzed by HPLC.
The derivatization of amino acids with FMOC-Cl requires an alkaline pH (≥ 8,0). Considering wine acidic pH and its natural buffering capacity, a preliminary sample alkalinization with sodium hydroxide (32 %) was studied and used before the derivatization procedure. Best results were achieved by using a 0,2 M borate buffer at pH 10 with a 2:1 buffer–wine ratio. The FMOC- amino derivatives were tested to be stable up to 100 min.
In order to verify the influence of pH and time on derivatization several times (2, 3, 5, 8, 10 and 15 minutes) for the first derivatization and several buffer at different pH (8,00; 8,25 and 8,40) were tested. Other Authors (Melucci D. et al., 1999) verified that pH 8,25 and 2 minutes are the best solution for amino acids derivatization.
The simultaneous derivatization of amino acids and amines moved us to study also amines kinetics and pH of derivatization.
Validation
In order to assess the accuracy of the method, recoveries performances were carried out by spiking each sample with amino acid and amines at three concentration levels (0,04; 0,06; and 0,08 mM). Each of the resulting spiked samples were analyzed in triplicate.
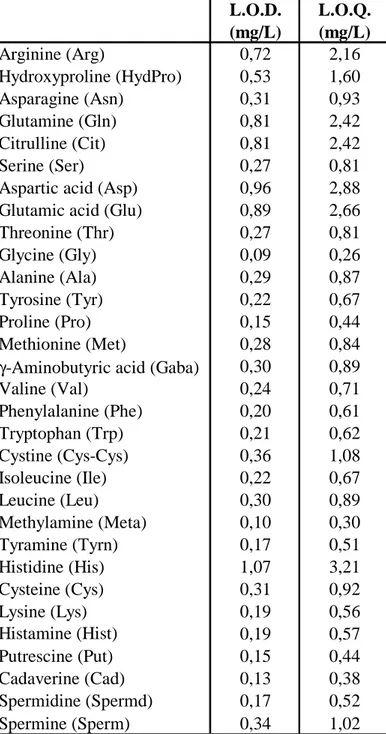
The limits of detection (L.O.D.) were calculated from the amount of amino acids and amines required to give a signal-to-noise ratio of 3 (S/N =3) and the limits of quantification (L.O.Q.) were determined with a signal-to-noise ratio of 10 (S/N = 10).
Linearity was determined with 3 derivatizations of 5 different concentrations of amino acids standard, ranging from 2 to 50 mg/L for each amino acids, ranging from 26 to 655 mg/L for proline and from 0,5 to 11 mg/L for amines.
Precision was determined in terms of peak chromatographic areas and retention times, repeatability on the base of 7 injection of the same standard solution, derivatized on the same condition (pH = 8,25 and derivatization time = 2 min).
22
1.11.3 Results and discussion
Optimal conditions of derivatization are evaluated. In particular, pH and time needed for a full and repeatable derivatization of each compounds was evaluated.
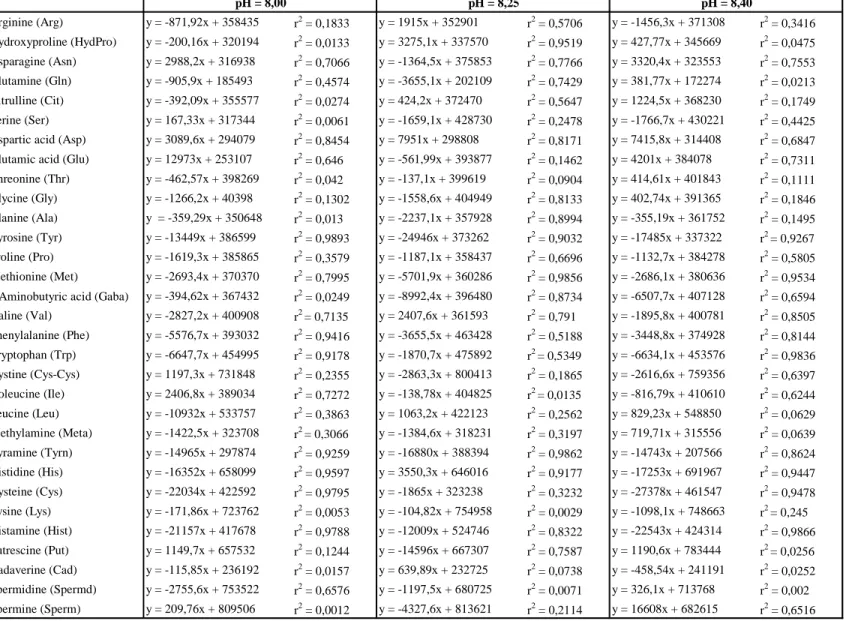
In table 2 can be observed that amino acids have a more stable derivatization at pH 8,25, as reported by other Authors (Melucci D. et al., 1999) than in the other 2 pH conditions. Also amines show a good stability at pH 8,25.
The time of 2 minutes resulted to be a good solution for both, amino acids and amines as shown in table 2.
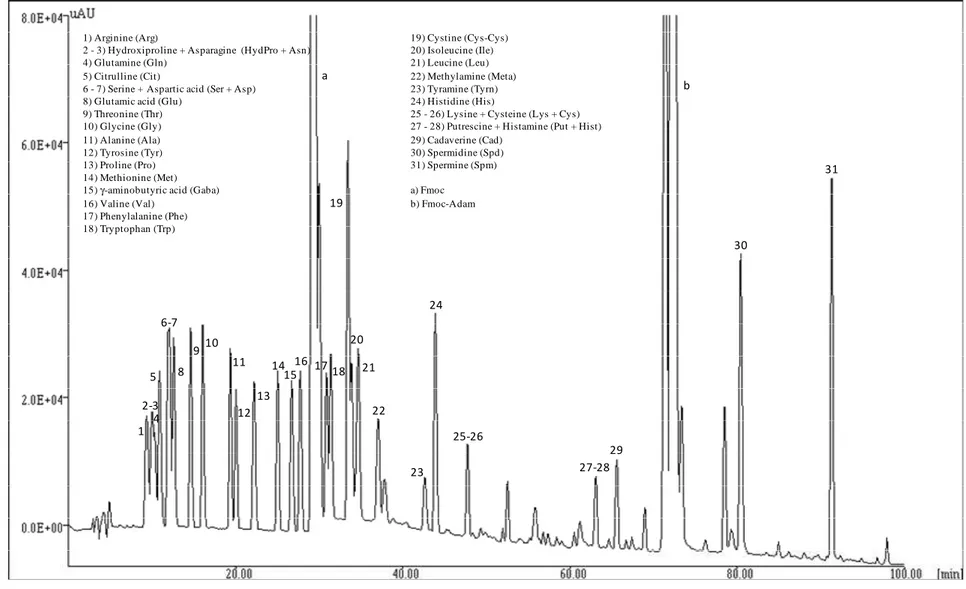
Several eluition gradients were tested in order to have a good peaks separation. The best one is showed in table 1, but using this gradient, there are still 3 pairs of substances coeluited (asparagine and glutamine, lysine and cystine, putrescine and histamine).
The addition of NaOH 0,1N after the use of borate buffer and before derivatization was founded as the best solution to obtain the desired pH.
23
Figure 1 - Chromatographic separation of a biogenic amines and amino acids standard solution with Luna column 1 2-3 4 5 6-7 8 9 10 11 12 13 14 15 16 a 17 18 19 20 21 22 23 24 25-26 27-28 29 b 30 31
1) Arginine (Arg) 19) Cystine (Cys-Cys)
2 - 3) Hydroxiproline + Asparagine (HydPro + Asn) 20) Isoleucine (Ile)
4) Glutamine (Gln) 21) Leucine (Leu)
5) Citrulline (Cit) 22) Methylamine (Meta)
6 - 7) Serine + Aspartic acid (Ser + Asp) 23) Tyramine (Tyrn)
8) Glutamic acid (Glu) 24) Histidine (His)
9) Threonine (Thr) 25 - 26) Lysine + Cysteine (Lys + Cys)
10) Glycine (Gly) 27 - 28) Putrescine + Histamine (Put + Hist)
11) Alanine (Ala) 29) Cadaverine (Cad)
12) Tyrosine (Tyr) 30) Spermidine (Spd)
13) Proline (Pro) 31) Spermine (Spm)
14) Methionine (Met)
15) γ-aminobutyric acid (Gaba) a) Fmoc
16) Valine (Val) b) Fmoc-Adam 17) Phenylalanine (Phe)
24
Table 2 – Correlation between different derivatization times (2-15 min) and peak area (µAu x s) (r2= coefficient of determination) Arginine (Arg) y = -871,92x + 358435 r2 = 0,1833 y = 1915x + 352901 r2 = 0,5706 y = -1456,3x + 371308 r2 = 0,3416 Hydroxyproline (HydPro) y = -200,16x + 320194 r2 = 0,0133 y = 3275,1x + 337570 r2 = 0,9519 y = 427,77x + 345669 r2 = 0,0475 Asparagine (Asn) y = 2988,2x + 316938 r2 = 0,7066 y = -1364,5x + 375853 r2 = 0,7766 y = 3320,4x + 323553 r2 = 0,7553 Glutamine (Gln) y = -905,9x + 185493 r2 = 0,4574 y = -3655,1x + 202109 r2 = 0,7429 y = 381,77x + 172274 r2 = 0,0213 Citrulline (Cit) y = -392,09x + 355577 r2 = 0,0274 y = 424,2x + 372470 r2 = 0,5647 y = 1224,5x + 368230 r2 = 0,1749 Serine (Ser) y = 167,33x + 317344 r2 = 0,0061 y = -1659,1x + 428730 r2 = 0,2478 y = -1766,7x + 430221 r2 = 0,4425
Aspartic acid (Asp) y = 3089,6x + 294079 r2 = 0,8454 y = 7951x + 298808 r2 = 0,8171 y = 7415,8x + 314408 r2 = 0,6847
Glutamic acid (Glu) y = 12973x + 253107 r2 = 0,646 y = -561,99x + 393877 r2 = 0,1462 y = 4201x + 384078 r2 = 0,7311
Threonine (Thr) y = -462,57x + 398269 r2 = 0,042 y = -137,1x + 399619 r2 = 0,0904 y = 414,61x + 401843 r2 = 0,1111 Glycine (Gly) y = -1266,2x + 40398 r2 = 0,1302 y = -1558,6x + 404949 r2 = 0,8133 y = 402,74x + 391365 r2 = 0,1846 Alanine (Ala) y = -359,29x + 350648 r2 = 0,013 y = -2237,1x + 357928 r2 = 0,8994 y = -355,19x + 361752 r2 = 0,1495 Tyrosine (Tyr) y = -13449x + 386599 r2 = 0,9893 y = -24946x + 373262 r2 = 0,9032 y = -17485x + 337322 r2 = 0,9267 Proline (Pro) y = -1619,3x + 385865 r2 = 0,3579 y = -1187,1x + 358437 r2 = 0,6696 y = -1132,7x + 384278 r2 = 0,5805 Methionine (Met) y = -2693,4x + 370370 r2 = 0,7995 y = -5701,9x + 360286 r2 = 0,9856 y = -2686,1x + 380636 r2 = 0,9534
γ-Aminobutyric acid (Gaba) y = -394,62x + 367432 r2 = 0,0249 y = -8992,4x + 396480 r2 = 0,8734 y = -6507,7x + 407128 r2 = 0,6594
Valine (Val) y = -2827,2x + 400908 r2 = 0,7135 y = 2407,6x + 361593 r2 = 0,791 y = -1895,8x + 400781 r2 = 0,8505 Phenylalanine (Phe) y = -5576,7x + 393032 r2 = 0,9416 y = -3655,5x + 463428 r2 = 0,5188 y = -3448,8x + 374928 r2 = 0,8144 Tryptophan (Trp) y = -6647,7x + 454995 r2 = 0,9178 y = -1870,7x + 475892 r2 = 0,5349 y = -6634,1x + 453576 r2 = 0,9836 Cystine (Cys-Cys) y = 1197,3x + 731848 r2 = 0,2355 y = -2863,3x + 800413 r2 = 0,1865 y = -2616,6x + 759356 r2 = 0,6397 Isoleucine (Ile) y = 2406,8x + 389034 r2 = 0,7272 y = -138,78x + 404825 r2 = 0,0135 y = -816,79x + 410610 r2 = 0,6244 Leucine (Leu) y = -10932x + 533757 r2 = 0,3863 y = 1063,2x + 422123 r2 = 0,2562 y = 829,23x + 548850 r2 = 0,0629 Methylamine (Meta) y = -1422,5x + 323708 r2 = 0,3066 y = -1384,6x + 318231 r2 = 0,3197 y = 719,71x + 315556 r2 = 0,0639 Tyramine (Tyrn) y = -14965x + 297874 r2 = 0,9259 y = -16880x + 388394 r2 = 0,9862 y = -14743x + 207566 r2 = 0,8624 Histidine (His) y = -16352x + 658099 r2 = 0,9597 y = 3550,3x + 646016 r2 = 0,9177 y = -17253x + 691967 r2 = 0,9447 Cysteine (Cys) y = -22034x + 422592 r2 = 0,9795 y = -1865x + 323238 r2 = 0,3232 y = -27378x + 461547 r2 = 0,9478 Lysine (Lys) y = -171,86x + 723762 r2 = 0,0053 y = -104,82x + 754958 r2 = 0,0029 y = -1098,1x + 748663 r2 = 0,245 Histamine (Hist) y = -21157x + 417678 r2 = 0,9788 y = -12009x + 524746 r2 = 0,8322 y = -22543x + 424314 r2 = 0,9866 Putrescine (Put) y = 1149,7x + 657532 r2 = 0,1244 y = -14596x + 667307 r2 = 0,7587 y = 1190,6x + 783444 r2 = 0,0256 Cadaverine (Cad) y = -115,85x + 236192 r2 = 0,0157 y = 639,89x + 232725 r2 = 0,0738 y = -458,54x + 241191 r2 = 0,0252 Spermidine (Spermd) y = -2755,6x + 753522 r2 = 0,6576 y = -1197,5x + 680725 r2 = 0,0071 y = 326,1x + 713768 r2 = 0,002 Spermine (Sperm) y = 209,76x + 809506 r2 = 0,0012 y = -4327,6x + 813621 r2 = 0,2114 y = 16608x + 682615 r2 = 0,6516 pH = 8,00 pH = 8,25 pH = 8,40
25
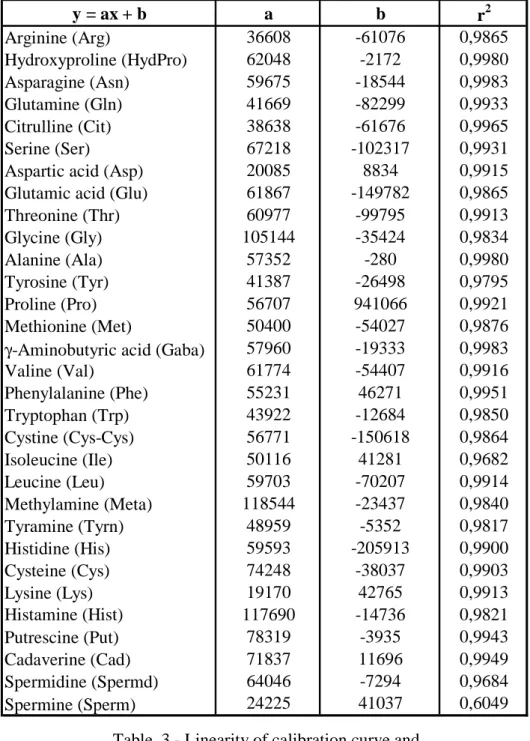
Linearity of the method for each amino acids and amines assayed was tested.
Calibration curve obtained for each compound have a good linearity and detemination coefficients, except for spermine which has r2 = 0,6049 (Table 3).
Table 3 - Linearity of calibration curve and
coefficients of determination y = ax + b a b r2 Arginine (Arg) 36608 -61076 0,9865 Hydroxyproline (HydPro) 62048 -2172 0,9980 Asparagine (Asn) 59675 -18544 0,9983 Glutamine (Gln) 41669 -82299 0,9933 Citrulline (Cit) 38638 -61676 0,9965 Serine (Ser) 67218 -102317 0,9931
Aspartic acid (Asp) 20085 8834 0,9915
Glutamic acid (Glu) 61867 -149782 0,9865
Threonine (Thr) 60977 -99795 0,9913 Glycine (Gly) 105144 -35424 0,9834 Alanine (Ala) 57352 -280 0,9980 Tyrosine (Tyr) 41387 -26498 0,9795 Proline (Pro) 56707 941066 0,9921 Methionine (Met) 50400 -54027 0,9876
γ-Aminobutyric acid (Gaba) 57960 -19333 0,9983
Valine (Val) 61774 -54407 0,9916 Phenylalanine (Phe) 55231 46271 0,9951 Tryptophan (Trp) 43922 -12684 0,9850 Cystine (Cys-Cys) 56771 -150618 0,9864 Isoleucine (Ile) 50116 41281 0,9682 Leucine (Leu) 59703 -70207 0,9914 Methylamine (Meta) 118544 -23437 0,9840 Tyramine (Tyrn) 48959 -5352 0,9817 Histidine (His) 59593 -205913 0,9900 Cysteine (Cys) 74248 -38037 0,9903 Lysine (Lys) 19170 42765 0,9913 Histamine (Hist) 117690 -14736 0,9821 Putrescine (Put) 78319 -3935 0,9943 Cadaverine (Cad) 71837 11696 0,9949 Spermidine (Spermd) 64046 -7294 0,9684 Spermine (Sperm) 24225 41037 0,6049
26
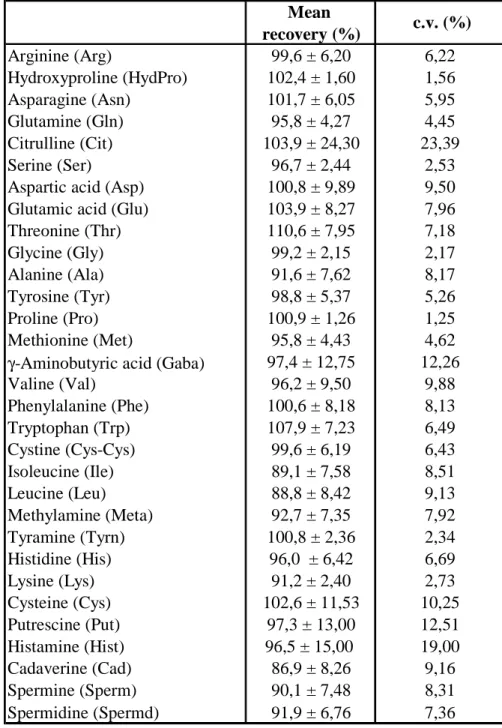
The recovery of the method was determined. The results obtained are shown in table 4.
Table 4 – Accuracy for amino acids and amines determination (c.v. = coefficient of variation = standard deviation/mean)
For most compound high recovery values were obtained (> 86,9 %),. Some variation coefficients are higher than 10 %, 23,39 for citrulline, 12,36 for gaba, 10,25 for cysteine, and 12,51 for putrescine. This result can be explained probably by lower stability of their derivatized products.
Mean recovery (%) Arginine (Arg) 99,6 ± 6,20 6,22 Hydroxyproline (HydPro) 102,4 ± 1,60 1,56 Asparagine (Asn) 101,7 ± 6,05 5,95 Glutamine (Gln) 95,8 ± 4,27 4,45 Citrulline (Cit) 103,9 ± 24,30 23,39 Serine (Ser) 96,7 ± 2,44 2,53
Aspartic acid (Asp) 100,8 ± 9,89 9,50
Glutamic acid (Glu) 103,9 ± 8,27 7,96
Threonine (Thr) 110,6 ± 7,95 7,18 Glycine (Gly) 99,2 ± 2,15 2,17 Alanine (Ala) 91,6 ± 7,62 8,17 Tyrosine (Tyr) 98,8 ± 5,37 5,26 Proline (Pro) 100,9 ± 1,26 1,25 Methionine (Met) 95,8 ± 4,43 4,62
γ-Aminobutyric acid (Gaba) 97,4 ± 12,75 12,26
Valine (Val) 96,2 ± 9,50 9,88 Phenylalanine (Phe) 100,6 ± 8,18 8,13 Tryptophan (Trp) 107,9 ± 7,23 6,49 Cystine (Cys-Cys) 99,6 ± 6,19 6,43 Isoleucine (Ile) 89,1 ± 7,58 8,51 Leucine (Leu) 88,8 ± 8,42 9,13 Methylamine (Meta) 92,7 ± 7,35 7,92 Tyramine (Tyrn) 100,8 ± 2,36 2,34 Histidine (His) 96,0 ± 6,42 6,69 Lysine (Lys) 91,2 ± 2,40 2,73 Cysteine (Cys) 102,6 ± 11,53 10,25 Putrescine (Put) 97,3 ± 13,00 12,51 Histamine (Hist) 96,5 ± 15,00 19,00 Cadaverine (Cad) 86,9 ± 8,26 9,16 Spermine (Sperm) 90,1 ± 7,48 8,31 Spermidine (Spermd) 91,9 ± 6,76 7,36 c.v. (%)
27
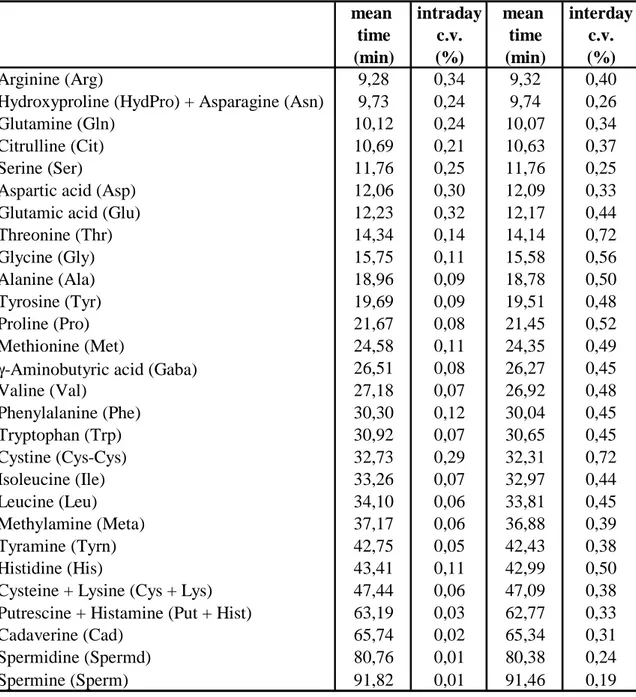
Concerning retention times, precision was calculated the same day (intraday) and in different days (interday) and expressed as c.v. (%). Value ranged from 0,01 % to 0,72 % (Table 5).
Table 5 - Precision of the method in relation to retention times of each compound (c.v. = coefficient of variation)
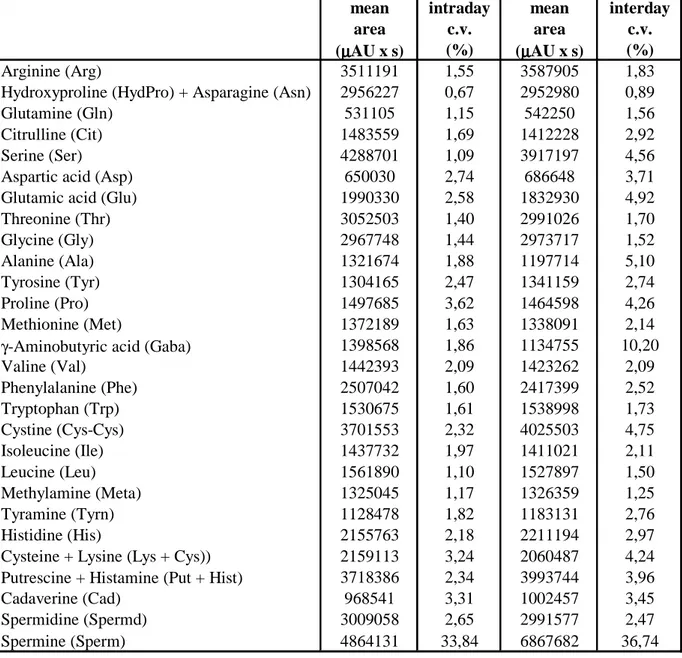
Regarding precision on the quantification (peak areas), results are interesting except those acquired interday for spermine and gaba (36,74 % and 10,20 % respectively) (Table 6).
mean intraday mean interday
time c.v. time c.v.
(min) (%) (min) (%)
Arginine (Arg) 9,28 0,34 9,32 0,40
Hydroxyproline (HydPro) + Asparagine (Asn) 9,73 0,24 9,74 0,26
Glutamine (Gln) 10,12 0,24 10,07 0,34
Citrulline (Cit) 10,69 0,21 10,63 0,37
Serine (Ser) 11,76 0,25 11,76 0,25
Aspartic acid (Asp) 12,06 0,30 12,09 0,33
Glutamic acid (Glu) 12,23 0,32 12,17 0,44
Threonine (Thr) 14,34 0,14 14,14 0,72 Glycine (Gly) 15,75 0,11 15,58 0,56 Alanine (Ala) 18,96 0,09 18,78 0,50 Tyrosine (Tyr) 19,69 0,09 19,51 0,48 Proline (Pro) 21,67 0,08 21,45 0,52 Methionine (Met) 24,58 0,11 24,35 0,49
γ-Aminobutyric acid (Gaba) 26,51 0,08 26,27 0,45
Valine (Val) 27,18 0,07 26,92 0,48 Phenylalanine (Phe) 30,30 0,12 30,04 0,45 Tryptophan (Trp) 30,92 0,07 30,65 0,45 Cystine (Cys-Cys) 32,73 0,29 32,31 0,72 Isoleucine (Ile) 33,26 0,07 32,97 0,44 Leucine (Leu) 34,10 0,06 33,81 0,45 Methylamine (Meta) 37,17 0,06 36,88 0,39 Tyramine (Tyrn) 42,75 0,05 42,43 0,38 Histidine (His) 43,41 0,11 42,99 0,50
Cysteine + Lysine (Cys + Lys) 47,44 0,06 47,09 0,38
Putrescine + Histamine (Put + Hist) 63,19 0,03 62,77 0,33
Cadaverine (Cad) 65,74 0,02 65,34 0,31
Spermidine (Spermd) 80,76 0,01 80,38 0,24
28
Table 6 - Precision of the method in relation to peaks area (c.v. = coefficient of variation)
mean intraday mean interday
area c.v. area c.v.
(µµµµAU x s) (%) (µµµµAU x s) (%)
Arginine (Arg) 3511191 1,55 3587905 1,83
Hydroxyproline (HydPro) + Asparagine (Asn) 2956227 0,67 2952980 0,89
Glutamine (Gln) 531105 1,15 542250 1,56
Citrulline (Cit) 1483559 1,69 1412228 2,92
Serine (Ser) 4288701 1,09 3917197 4,56
Aspartic acid (Asp) 650030 2,74 686648 3,71
Glutamic acid (Glu) 1990330 2,58 1832930 4,92
Threonine (Thr) 3052503 1,40 2991026 1,70 Glycine (Gly) 2967748 1,44 2973717 1,52 Alanine (Ala) 1321674 1,88 1197714 5,10 Tyrosine (Tyr) 1304165 2,47 1341159 2,74 Proline (Pro) 1497685 3,62 1464598 4,26 Methionine (Met) 1372189 1,63 1338091 2,14
γ-Aminobutyric acid (Gaba) 1398568 1,86 1134755 10,20
Valine (Val) 1442393 2,09 1423262 2,09 Phenylalanine (Phe) 2507042 1,60 2417399 2,52 Tryptophan (Trp) 1530675 1,61 1538998 1,73 Cystine (Cys-Cys) 3701553 2,32 4025503 4,75 Isoleucine (Ile) 1437732 1,97 1411021 2,11 Leucine (Leu) 1561890 1,10 1527897 1,50 Methylamine (Meta) 1325045 1,17 1326359 1,25 Tyramine (Tyrn) 1128478 1,82 1183131 2,76 Histidine (His) 2155763 2,18 2211194 2,97
Cysteine + Lysine (Lys + Cys)) 2159113 3,24 2060487 4,24
Putrescine + Histamine (Put + Hist) 3718386 2,34 3993744 3,96
Cadaverine (Cad) 968541 3,31 1002457 3,45
Spermidine (Spermd) 3009058 2,65 2991577 2,47