The calculation of the cardiac troponin T 99th percentile of the reference
population is affected by age, gender, and population selection: A
multicenter study in Italy
Maria Franzini
a,b,⁎
, Valentina Lorenzoni
a, Silvia Masotti
a, Concetta Prontera
b, Dante Chiappino
b,
Daniele Della Latta
b, Massimo Daves
c, Irene Deluggi
c, Massimo Zuin
d, Luigina Ferrigno
e, Alfonso Mele
e,
Fabrizio Marcucci
f, Carmelo A. Caserta
g, Pasquale Surace
g, Arianna Messineo
g, Giuseppe Turchetti
a,
Claudio Passino
b, Michele Emdin
b, Aldo Clerico
a,ba
Scuola Superiora Sant'Anna, Pisa, Italy
b
Fondazione Toscana G. Monasterio, Pisa, Italy
cClinical Biochemical Laboratory, San Maurizio Regional Hospital, Bolzano, ltaly
dDepartment of lnternal Medicine and Liver Unit, School of Medicine San Paolo, University of Milan, Milan, ltaly e
Centro Nazionale di Epidemiologia, Sorveglianza e Promozione della Salute, Istituto Superiore di Sanita', Roma, Italy
fScientific Directorate, Regina Elena Cancer Institute, Roma Italy g
Hepatology Association of Calabria, Pellaro, RC Italy
a b s t r a c t
a r t i c l e i n f o
Article history: Received 3 June 2014
Received in revised form 27 July 2014 Accepted 8 September 2014 Available online 17 September 2014 Keywords:
Cardiac troponin T 99th upper reference limit Reference population Outlier calculation
Background: The aim of this study is to determine the 99th upper-reference limit (URL) for cardiac troponin T (cTnT) in Italian apparently healthy subjects.
Methods: The reference population was selected from 5 cities: Bolzano (n = 290), Milano (CAMELIA-Study, n = 287), Montignoso (MEHLP-Study, n = 306), Pisa (n = 182), and Reggio Calabria (MAREA-Study, n = 535). Subjects having cardiac/systemic acute/chronic diseases were excluded. Participants to MEHLP project underwent cardiac imaging investigation. High-sensitive cTnT was measured with Cobas-e411 (Roche Diagnostics).
Results: We enrolled 1600 healthy subjects [54.6% males; age range 10–90 years; mean (SD): 36.4 (21.2) years], including 34.6% agedb20 years, 54.5% between 20 and 64 years, and 10.9% over 65 years. In the youngest the 99th URL was 10.9 ng/L in males and 6.8 ng/L in females; in adults 23.2 ng/L and 10.2 ng/L; and in elderly 36.8 ng/L and 28.6 ng/L. After the exclusion of outliers the 99th URL values were significantly decreased (Pb 0.05) in particular those of the oldest (13.8 ng/L and 14 ng/L). MEHLP participants were divided in healthy and asymptomatic, according to known cardiovascular risk factors (HDL, LDL, glucose, C-reactive protein): the 99th URL of cTnT values of these subgroups was significantly different (19.5 vs. 22.7, P b 0.05).
Conclusions: 99th URL of cTnT values was strongly affected by age, gender, selection of subjects and the statistical evaluation of outliers.
© 2014 Elsevier B.V. All rights reserved.
1. Introduction
Cardiac troponins (cTns) I and T are the marker of choice for the detection of myocardial injury and the diagnosis of myocardial infarc-tion, as recommended by the most recent guidelines[1,2]. In fact, the recommended criteria for the diagnosis of AMI is the evidence of a rise
and/or fall of cardiac cTnI or cTnT with one or more values above the 99th percentile upper reference limit (URL), found in a clinical setting suggestive of myocardial ischemia[3,4]. As a result, the correct and pre-cise (10% CV) estimation of the 99th URL represents the cornerstone for the differential diagnosis of the acute coronary syndromes. Over the past 10 years cTn assays have been improved in analytical sensitivity and precision thereby allowing the measurement of cTn in healthy sub-jects. According to Apple's scorecard for the classification of cTn assays, a high-sensitive assay must measure the 99th URL with 10% CV and more than 50% of healthy subjects must have detectable cTn levels[5]. The increasing analytical sensitivity of cTn assays greatly influences the 99th URL estimation. However the main factor that influences the 99th URL estimation is the selection of the reference population. ESC
Abbreviations: BMI, body mass index; BNP, brain natriuretic peptide; cTn, cardiac troponin; ECG, electrocardiogram; IQR, interquartile range; LVM, left ventricular mass; Q1, 25th percentile; Q3, 75th percentile; URL, upper reference limit.
⁎ Corresponding author at: Scuola Superiore Sant'Anna, c/o Fondazione Toscana G. Monasterio, Via G. Moruzzi 1, 56124 Pisa, Italy. Tel.: +39 050 3153309; fax:+39 050 3152166.
http://dx.doi.org/10.1016/j.cca.2014.09.010
0009-8981/© 2014 Elsevier B.V. All rights reserved.
Contents lists available atScienceDirect
Clinica Chimica Acta
guidelines (2010) suggest selecting a sex- and age-matched healthy reference population, which should have a normal cardiac function as assessed by imaging.
Age- and gender-dependent effects have been observed both for cTnI[6–10]and cTnT [10–14]high-sensitive assays: cTn levels are lower in women and increase with age in both genders, in particular a sharp increment is observed after 65 years of age[6,12,15]. The age-dependent increase in cTn might be related to a progressive increase of heart failure due to the aging of myocardial tissue[16]. This suggests that the selection of elderly people for the 99th URL estimation must be performed very carefully.
Patient selection criteria have been shown to greatly affect both the 99th URL value and the cTn distribution in genders[17–20]. While, no clear definition has been proposed for the selection of a reference population for cTn 99th URL estimation, several Authors agree that inclusion criteria should be based on data obtained from a health questionnaire, on screening for renal function through the estimation of glomerularfiltration rate measurement, and evaluation of hemody-namic stress and ventricular dysfunction through brain natriuretic peptide (BNP) or NT-proBNP measurement. In addition the reference population should be split equally by sex, include both young and elder-ly people, and be representative of the ethnicity present in the region
[17,18]. Finally, the mathematical approach, used to identify and exclude the outliers, may also play a significant role in the calculation of cTn 99th URL[21,22].
The principal aim of this study was to determine the 99th URL for high-sensitive cTnT (hs-cTnT) assay according to age and gender in healthy subjects representative of the Italian population. Another aim of this work is to evaluate the effect of different statistical methods to exclude outliers from the 99th URL estimation for hs-cTnT assay. 2. Materials and methods
2.1. Study population
Samples from apparently healthy subjects were obtained from the G. Monasterio Tuscany Foundation (Pisa, Italy), and in collaboration with the clinical biochemical laboratory of the San Maurizio Regional Hospital (Bolzano, Italy) and three Italian population studies (MEHLP, CAMELIA and MAREA studies).
Briefly, the MEHLP project is a screening study aimed at evaluating the amount of cardiovascular subclinical pathology in an asymptomatic general population. To this aim, the populationN40 years from the community of Montignoso (Massa, Italy) was enrolled (1474 people, mean ± SD 61 ± 14 years, males 48%, left ventricular ejection fraction 58 ± 5%, cardiac mass index 118 ± 42 mg/m2). CAMELIA and MAREA
[23,24]studies are coordinated by the University of Milan (San Paolo Hospital, Milano, Italy), the “Associazione Calabrese di Epatologia” (Hepatology Association of Calabria, Reggio Calabria, Italy) and the “Istituto Superiore di Sanità” (Institute of Health, Roma, Italy). The CAMELIA (CArdiovascular risks, MEtabolic syndrome, Liver, and Autoimmune) study is aimed to investigate interactions among liver disease and cardiovascular risk and atherosclerosis. To this aim, 3550 individuals, aged 18–75, participated to the study. Subjects were ran-domly enrolled by censoring lists in two towns that are representative of the socio-economic and lifestyle characteristics of Northern Italy (Abbiategrasso, Milan) and Southern Italy (Cittanova, Reggio Calabria). According to the order of randomization, carotid artery echography was performed on 1 out of 3 individuals in order to measure the carotid intima–media thickness (IMT). Troponin T was measured in 484 out of 1180 participants who underwent IMT measurement and for which a lithium heparin plasma aliquot was available.
With similar aims, the MAREA (Metabolic Alterations in Reggio Calabria Adolescents) study has been carried in a population of adoles-cents. A sample of 843 adolescents aged 10–14 years was randomly selected from an updated school census list; troponin T was measured
in 537 participants for which a lithium heparin plasma aliquots was available.
Subjects enrolled at the San Maurizio Regional Hospital (Bolzano; Italy) answered to questionnaire about an on-going therapy, past or present of cardiovascular diseases– including hypertension – cardio-vascular surgeries, endocrine dysfunction, and kidney failure. Plasma C-reactive protein and creatinine values were also registered.
Subjects enrolled in CAMELIA and MAREA studies underwent a health investigation on lifestyle habits and medical history by questionnaires, clinical examination, carotid ultrasonography, and laboratory tests (serum creatinine, glucose, insulin, total cholesterol, HDL-cholesterol, LDL-cholesterol, triglycerides, total bilirubin, aspartate-aminotransferase, alanine-aminotransferase, gamma-glutamyltransferase, alkaline phos-phatase, C-reactive protein, ferritin, iron, transferrin, homocysteine, TSH, complete blood count). NT-proBNP was measured only in MAREA participants.
Subjects recruited at the G. Monasterio Tuscany Foundation (Pisa, Italy) and participants to the MEHLP study answered a detailed questionnaire about lifestyle habits and medical history, and underwent clinical examination and laboratory tests (creatinine, glucose, insulin, total cholesterol, HDL-cholesterol, LDL-cholesterol, triglycerides, biliru-bin, aspartate-aminotransferase, alanine-aminotransferase, gamma-glutamyltransferase, alkaline phosphatase, C-reactive protein, ferritin, iron, transferrin, homocysteine, TSH, NT-proBNP, complete blood count). Participants to the MEHLP Study were subjected to electrocar-diogram (ECG) and cardiac imaging analysis (computed tomography scan, carotid echography, echocardiography).
This study was carried out in compliance with the principles set forth in the Declaration of Helsinki. The informed consent was obtained from all subjects enrolled in the study; the respective local ethical com-mittee approved all population studies.
2.2. Exclusion criteria and definitions
On the basis of all collected data, we excluded all subjects presenting cardiac or systemic acute or chronic diseases, such as myocardial infarc-tion, heart failure, coronary heart disease, hypertension, diabetes, kidney disease, obesity, tumor, hepatitis, and chronic obstructive pulmonary disease. Subjects using drugs, except for substitutive hormonal therapy, were also excluded.
For the present investigations, hypertension was defined as a systol-ic blood pressure of 140 mm Hg or higher, a diastolsystol-ic blood pressure of 90 mm Hg or higher, or the use of antihypertensive medications. Body mass index (BMI) was calculated as the weight in kilograms divided by the square of the height in meters (kg/m2); obesity was defined as BMI≥ 30 kg/m2. Diabetes was defined as a fasting blood glucose
level of 126 mg/dL (7 mmol/L) or greater, or the use of any hypoglyce-mic agent. Glomerularfiltration rate (GFR) was calculated according to the“modification of diet in renal disease” (MDRD) formula for serum creatinine assays not standardized to the IDMS reference method: GFR = 186 × serum creatinine–1.154× age–0.203× 0.742 (if female)
[25]. All considered subjects were Caucasian. Renal disease was defined as GFRb 60 ml/min/1.73 m2
.
2.3. Blood sampling and laboratory analysis
Blood samples were obtained from fasting participants between 8 and 9 AM; analyses were performed using standard clinical laboratory procedures with automated analyzers. cTnT levels were evaluated in al-iquot of lithium heparin plasma stored at−80 °C. Plasma concentra-tions of cTnT were measured at the Fondazione Toscana G. Monasterio using the hs-cTnT method (Ref. 05092744) with the automated Cobas e411 platform by Roche Diagnostics; the assay was performed according to the recommendations made by the manufacturer (Roche Diagnostics, Germany) using the recalibrated control materials (lot 167345 and subsequent)[26]. The limit of blank (LoB) and the limit of
detection (LoD), determined by the manufacturer, were 3 and 5 ng/L, respectively.
2.4. Statistical analysis
All statistical analyses were performed with Stata/SE 10.1 for Windows using parametric and nonparametric methods depending on variable distribution. The 99th percentile was calculated as the absolute single upper 99th percentile value (1-sided 99% reference interval) both for the overall study samples and after the outlier removal.
The identification of outlier was performed using both the non-parametric and the non-parametric approach by means of the Tukey's meth-od, applied to the original data, or using the standard deviation method on ln-transformed data.
The Tukey's method involves the computation of the 25th (Q1) and 75th (Q3) percentiles and the interquartile range (IQR = Q3− Q1); the exclusion limit corresponds to the sum of Q3 and 3 or 1.5 times IQR, according to the following formula: Q3 + 3IQR or Q3 + 1.5IQR. In the parametric method the exclusion limit has been calculated as the mean value plus 2 or 3 standard deviations.
Mann–Whitney test was used for comparison between two sub-groups, while comparison among subpopulation or several subgroups were performed using Kruskall–Wallis test and Mann–Whitney test with Bonferroni correction was used for post-hoc pairwise comparisons. Non-parametric test for linear trend was used to evaluate the associa-tion of cTnT values across age groups. Quantile regression using 10,000 bootstrap replicates was used to evaluate the association of the 99th URL with possible covariates including, age, gender, and study subgroups. Probability values were 2 tailed and values of 0.05 were considered significant.
3. Results
3.1. Characteristics of reference population
The study population included Caucasian subjects from five locations representative of all Italian population, from North to South, selected according to the criteria detailed in theMaterial and methods
section. The sources of clinical data for the 5 studies are summarized inTable 1, while the main demographic characteristics of thefive select-ed subpopulations are reportselect-ed inTable 2.
Overall, 1600 Italian subjects were recruited including 873 men (54.6%) and 727 women (45.4%). The mean (SD) age was 36.4 (21.2) years (range 10–90 years): 553 (34.6%) subjects were b20 years, 872 (54.5%) between 20 and 64 years, and 175 (10.9%) wereN65 years. The MAREA study contributed mostly to the youngest part of the study population, while the oldest subjects were mainly from the MHELP study and the Bolzano subgroup. The mean age was statistically different between all subgroups (Pb 0.001).
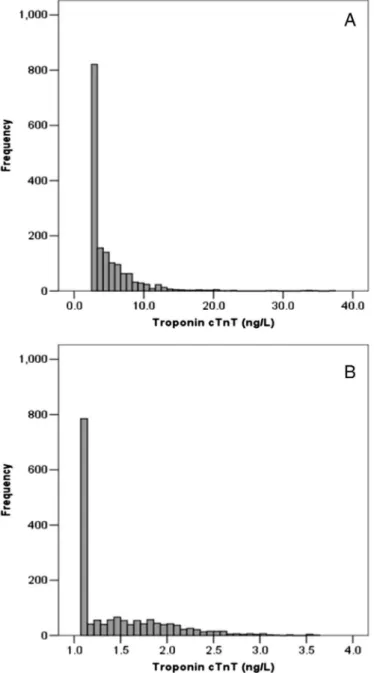
3.2. hs-cTnT distribution in the reference population according to gender In the study population, hs-cTnT values as well as the ln-transformed data showed a skewed distribution due to the high percentage of sample under the LoB (46.9%) (Fig. 1). Median values of hs-cTnT increased across age groups (PN 0.001 for linear trend) and men showed higher hs-cTnT values than women in all ages (Fig. 2).
On the other hand the percentage of samples with cTnT levels higher than the LoB and the LoD increased with age, being 19.3% and 4.2%, respectively, in the youngest subjects (b20 years), 67.0% and 37.7% in adults (20–64 years), and 90.9% and 77.7% in the oldest (≥65 years). 3.3. hs-cTnT 99th URL in the reference population and outlier calculation The overall selected population showed a 99th URL of 20.1 ng/L (95%CI: 17.6–22.6), this value was mainly determined by the 99th URL of subjects older than 65 years. In fact the 99th URL significantly increased with age (Pb 0.001) in both genders, being higher in men than in women in each age class (Table 3).
Statistical outlier calculation was performed both with non-parametric and non-parametric methods, the latter were applied on ln-transformed data. As expected, the highest percentage of outliers was detected, in both genders, in the subgroup of subjects older than 65 years (Table 3), regardless of the used statistical approach. After out-lier removal, the 99th URL value of the reference population decreased, ranging between 9.6 and 13.1 ng/L, as well as those of each age class in both genders (Table 3). In particular the 99th URL of the subgroup “≥65 years” is the most affected, being significantly lower than the value calculated in the whole population. In any case, we still observed an increase of the 99th URL according to age in both genders (P = 0.038 for male and Pb 0.001 for female;Table 3).
Non-parametric calculation of outliers was more restrictive than the parametric ones, showing the highest percentage of removed subjects and the lowest 99th URL values.
3.4. hs-cTnT 99th URL in thefive subpopulations
The values of hs-cTnT 99th URL for each subgroup constituting the reference population are reported inTable 4. The calculated 99th URLs ranged between 8.1 ng/L of the MAREA study, which includes the adolescent subjects, and 33.1 ng/L of the Bolzano subgroup, which com-prises the oldest and less selected subjects. The observed differences were almost all eliminated by the exclusion of outlier subjects. In fact the resulting 99th URL ranged between 13.1 ng/L and 13.9 ng/L for the three subgroups of adults recruited in the Pisa and Bolzano groups, and the MEHLP study. Only for adults recruited in CAMELIA study the 99th URL was 11.8 ng/L, lower with respect to values calculated in the other subgroups of adults (Pb 0.05) and similar to the 99th URL obtain-ed in the MAREA study (7.0 ng/L)
3.5. hs-cTnT 99th URL in the MEHLP study
Participants to the MEHLP study, as detailed in theMaterial and methodssection, are the most characterized subjects among thefive subpopulations considered in this study. In fact all MEHLP participants were subjected to ECG and cardiac imaging analysis (computed tomog-raphy scan, carotid echogtomog-raphy, echocardiogtomog-raphy), thus it has been possible to exclude also subclinical cardiovascular diseases.
On the basis of laboratory data about the known risk factors for cardiovascular and metabolic diseases we further divided the 306 normal subjects from the MEHLP study in two subgroups: 1) healthy subjects (n = 125; 42.4% men; mean age ± SD: 56.7 ± 6.4 years); and 2) asymptomatic subjects (n = 181; 62.4% men; age 59.2 ± 7.9 years), who showed one or more altered cardiovascular risk factors, i.e.: low plasma HDL cholesterol (b40 mg/dL or 1.04 mmol/L for men; b50 mg/dL or 1.30 mmol/L for women), or elevation of plasma glucose
Table 1
Source of clinical data in thefive subgroups constituting the reference population. Source of clinical data
MAREA Questionnaire, laboratory analysis, clinical examination, carotid echography Pisa Questionnaire, laboratory analysis, clinical examination,
CAMELIA Questionnaire, laboratory analysis, clinical examination, carotid echography Bolzano Questionnaire, laboratory analysis (creatinine, C-reactive protein) MHELP Questionnaire, laboratory analysis, clinical examination, TAC, carotid
echography, echocardiography
Laboratory analysis: serum creatinine, glucose, insulin, total cholesterol, HDL-cholesterol, LDL-HDL-cholesterol, triglycerides, bilirubin, aspartate-aminotransferase, alanine-aminotransferase, gamma-glutamyltransferase, alkaline phosphatase, C-reactive protein, ferritin, iron, transferrin, homocysteine, TSH, and complete blood count.
(between 110 and 126 mg/dL or 6.11 and 7.00 mmol/L), LDL choles-terol (N150 mg/dL or 3.89 mmol/L), triglycerides (N150 mg/dL or 1.70 mmol/L), and C-reactive protein (N0.3 mg/dL or 3 mg/L). The asymptomatic subgroup showed a 99th URL similar to the healthy sub-groups (P = 0.300,Table 5). Values were similar also after the outlier removal (P = 0.336;Table 5).
Computed tomography scan allowed the estimation of the left ventricular mass (LVM). Women showed a lower LVM in comparison with men (mean ± SD: 143.8 ± 35.8 g/m2vs. 178.2 ± 38.9 g/m2,
re-spectively) and a positive correlation existed between LVM and cTnT values both in the whole group (Spearman's coefficient: r = 0.181, 95%CI: 0.067–0.0290, P = 0.002) and healthy subgroup (r = 0.196, 95%CI: 0.011–0.037, P = 0.033).
4. Discussion
The current study allowed for thefirst time the establishment of the 99th URL for hs-cTnT assay in a large Italian population which consisted of 1600 apparently healthy subjects.
International guidelines suggest selecting the reference population for the calculation of the 99th URL of cTn on the basis of a health ques-tionnaire, screening for renal function, and for ventricular dysfunction. The reference population should include both young and elderly people, and be representative of the ethnicity present in the region and, in addi-tion, a sample size of at least 300 individuals per group has been recom-mended to calculate the 99th URL with 95% statistical confidence[18, 27]. To meet these criteria, recently reviewed by Sandoval and Apple
[28], we have set up a multicenter study to enroll a sufficient number of subjects to evaluate the variation of hs-cTnT values across age, in both genders; in particular this reference population spans a wide age range, from 10 to 90 years. To avoid inter-laboratory variability, cTnT measures have been centralized in the laboratory of the Fondazione G. Monasterio (Pisa, Italy).
Our reference population showed a higher 99th URL in comparison with other studies[10–12,14], this difference is likely a consequence of the lack of a clear guideline on what should be considered“normality”.
Table 2
Demographics of the study populations.
Origin N Male n (%) Female n (%) Mean age, (years) Age range (years) b 20 years (%) 20–64 years (%) ≥65 years (%) MAREA study 535 265 (49.5) 270 (50.5) 12.2 (0.9) 10–14 535 (100) 0 0 Pisa 182 146 (80.2) 36 (19.8) 36.0 (11.2) 19–90 1 (0.6) 178 (97.8) 3 (1.6) CAMELIA study 287 132 (46.0) 155 (54.0) 42.2 (13.1) 19–75 8 (2.8) 262 (91.3) 17 (5.9) Bolzano 290 164 (56.6) 126 (43.4) 52.2 (17.3) 18–86 9 (3.1) 200 (69.0) 81 (27.0) MHELP study 306 166 (54.2) 140 (45.8) 58.5 (7.8) 43–76 0 232 (75.8) 74 (24.2) Total 1600 873 (54.6) 727 (45.4)* 36.7 (21.4) 10–90 553 (34.6) 872 (54.5) 175 (10.9) Age data are reported as mean (SD). *Chi Square test: male vs. female, Pb 0.001.
Fig. 1. Cardiac troponin T frequency distribution in the overall study population; A: natural data, B: ln-trasformed data.
Fig. 2. Distribution of cTnT values in males and females according to age. The box indicates the 25th and 75th percentiles, the black line corresponds to the median value and the whiskers correspond to the 2.5th and 97.5th percentiles. Statistical comparison of males vs. females: *Pb 0.05, **P b 0.01, and ***P b 0.001.
The study reference populations vary by gender, age and number of enrolled subjects, and selection criteria of subjects, all elements that influence the calculation on 99th URL.
In fact we confirmed the effect of age and gender on median values and 99th URL of circulating hs-cTnT, and we showed a marked increase of these values over 65 years, in particular in women. Thus the different 99th URL observed in thefive subpopulations of our study could reflect their different compositions in terms of gender and age of enrolled subjects.
The presence of outliers can significantly modify the estimation of percentile values, especially the 99th that is the most affected by the extreme observations. Since the criteria used to enroll subjects in the five subpopulations of this study were different, the presence of out-liers is highly probable. The National Committee for Clinical Laborato-ry Standards[29]recommends the use of the Dixon test, however this test is not very sensitive in particular when there is more than one outlier. In this study we tested the effect of both non-parametric and parametric statistical methods, to identify and remove outliers. Due to the deviation of hs-cTnT values from the normal distribution, even after the ln-transformation, the non-parametric methods for the outlier selection seemed the most appropriate. Among the latter,
the exclusion limit corresponding to the sum of Q3 and 1.5 times IQR (Tukey 1.5-IQR) was too restrictive, thus we chose to use the exclusion limit corresponding to the sum of Q3 and 3 times IQR (Tukey 3-IQR). The percentage of outlier subjects is influenced both by the accuracy of subject selections and by age, irrespective of gender. In fact the major part of outlier subjects was found in the group over 65 years, both in men and women, and in the subpopulation of Bolzano, where apparently healthy people were selected only on the basis of a questionnaire.
After outlier removal the 99th URL in the four subpopulations of adult subjects was more homogeneous suggesting the utility of this statistical approach to reduce the differences among the subpopula-tions, constituting the reference population, mainly due to the different approaches used for the selection of apparently healthy subjects.
Removal of outlier subjects did not affect either the described difference between men and women or the association between age and hs-cTnT values, even if the 99th URL decreased up to a value similar to that declared by Roche Diagnostic, i.e. 14 ng/L, in male but lower in female adults (≥20 years); the 99th URL in adolescents of both gender was not affected by outlier removal. These data suggest that the ob-served differences between genders and adolescents and adults depend on physiological processes.
The observed increase of cTnT values across age runs in parallel with the decrease of not measurable samples, which were nearly 80% in the adolescent compared to 10% in the oldest class. It has been hypothesized that circulating cTn levels are positively related to LVM, which is lower in women than in men and in adolescents than in adults[30]. In fact, a mild association between cTnI[31]or cTnT[32]and LVM has been showed in small cohorts of patients without clinical evidence of acute coronary syndrome. For thefirst time, we showed an association between cTnT values and LVM in a population of highly selected healthy subjects, thus supporting the hypothesis that circulating troponin in healthy subjects could be a marker of the physiological renewal of cardiomyocytes[33].
Table 3
hs-cTnT 99th URL (95%CI; ng/L) calculation according to gender and age classes, with or without removing outlier subjects.
Reference population 99th URL (95%CI) after exclusion of outlier subjects, and % of removed subjects
Tukey 3-IQR Tukey 1.5-IQR Mean + 3-SD Mean + 2-SD N 99th URL 99th URL % 99th URL % 99th URL % 99th URL % Overall 1600 20.1 (17.6–22.6) 13.1 (12.3–13.2) 2.53 9.6 (9.3–9.8) 7.23 14.6 (13.5–16.1) 1.36 10.7 (10.2–10.8) 5.31 b20 years 553 8.3 (6.5–12.1) 7.5 (6.4–10.6) 0.18 6.8 (6.3–8.7) 0.54 7.5 (6.4–10.6) 0.18 7.0 (6.3–9.0) 0.36 20–64 years 872 19.9 (14.4–27.5) 12.4 (11.5–13.2) 1.82 9.7 (9.3–9.9) 5.69 13.3 (12.3–14.6) 1.14 10.4 (10.2–10.8) 3.53 ≥65 years 175 33.7 (21.0–37.0) 13.9 (13.4–14.0) 12.83 9.8 (9.7–9.8) 34.22 17.8 (16.6–18.0) 5.88 11.2 (10.9–11.3) 27.27 Male 872 21.8 (19.8–33.9) 13.2 (12.9–13.5) 3.64 9.8 (9.6–9.8) 10.71 14.7 (13.5–16.1) 2.28 10.8 (10.4–11.1) 7.74 b20 years 270 10.9 (6.7–20.4) 9.2 (6.7–11.9) 0.37 6.9 (6.3–8.7) 1.11 9.2 (6.7–11.9) 0.37 7.6 (6.5–10.5) 0.74 20–64 years 503 23.2 (17.3–34.1) 13.1 (11.9–13.4) 2.97 9.8 (9.6–9.9) 9.31 14.5 (13.1–17.2) 1.78 11.0 (10.3–11.0) 5.74 ≥65 years 99 36.8 (21.7–37.0) 13.8 (13.4–13.8) 15.53 9.8 (9.7–9.8) 43.69 16.7 (15.5–16.7) 9.71 11.3 (11.1–11.3) 35.92 Female 728 16.3 (12.4–18.0) 12.1 (10.2–13.2) 1.21 8.5 (8.3–9.3) 3.10 14.8 (12.2–17.5) 0.27 9.4 (8.5–10.4) 2.43 b20 years 283 6.8 (5.2–8.9) 6.8 (5.2–8.9) 0 6.8 (5.2–8.9) 0 6.8 (5.2–8.9) 0 6.8 (5.2–8.9) 0 20–64 years 369 10.2 (8.5–21.9) 9.6 (8.4–13.8) 0.27 8.5 (8.3–9.4) 1.07 9.6 (8.4–13.8) 0.27 8.8 (8.4–10.2) 0.53 ≥65 years 76 28.6 (17.6–28.6) 14.0 (12.4–14.0) 9.52 9.8 (8.6–9.7) 22.62 18.0 (17.3–18.0) 1.19 11.2 (10.2–11.2) 19.05 N: number of subjects; %: percentage of removed subjects. Outlier calculation was performed with non-parametric (Tukey 3-IQR; Tukey 1.5IQR) or parametric (Mean + 3SD; Mean + 2-SD) statistical methods, as detailed in Material and Methods section.
Table 4
hs-cTnT 99th URL (95% CI; ng/L) in thefive subgroups constituting the reference popula-tion with or without removing outlier subjects.
All Tukey 3-IQR % of removed subjects MAREA 8.1 (6.5–13.5) 7.0 (6.3–10.8) 0.19
Pisa 20.2 (13.6–20.2) 13.1 (10.7–13.1) 2.75 CAMELIA 12.9 (10.1–34.4) 11.8 (10.1–13.6) 0.34 Bolzano 33.1 (21.2–37.0) 13.9 (13.3–14.2) 8.64 MHELP 20.5 (14.9–33.9) 13.1 (12.3–13.4) 2.60
Outlier calculation was performed with Tukey's method, as detailed in theMaterial and methodssection.
Table 5
Calculation of the hs-cTnT 99th URL (ng/L) in MEHLP study subgroups, with or without removing outlier subjects with non-parametric (Tukey 3-IQR; Tukey 1.5-IQR) methods. All 99th URL (95%CI) after exclusion of outlier subjects, and % of removed subjects
Tukey 3-IQR Tukey 1.5-IQR
N 99th URL (95%CI) 99th URL (95%CI) % 99th URL (95%CI) % Overall 306 20.5 (14.9–33.9) 13.1 (12.3–13.4) 2.60 9.8 (9.3–9.8) 10.06
Asymptomatic 181 22.7 (16.2–33.9) 13.2 (12.4–13.4) 3.83 9.8 (9.6–9.8) 13.11 Healthy 125 19.5 (10.7–22.0) 12.4 (10.2–12.4) 0.80 9.7 (8.9–9.8) 5.60 N: number of subjects; %: percentage of removed subjects by outlier calculation performed as detailed in theMaterial and methodssection.
In conclusion, data collected in this study suggest that the hs-cTnT 99th URL is gender and age dependent; thus clinical study should be performed to verify if a gender and age specific hs-cTnT 99th URL might improve the sensitivity and specificity for myocardial infarction diagnosis.
A limit of this study is the heterogeneity of the various subpopula-tions included, which does not allow a definitive calculation of gender and age specific 99th URL for hs-cTnT; in fact the minimum number of highly selected reference individuals needed to appropriate-ly determine the 99th URL for cTn has been reported to be 300 per group, i.e. per gender, age and ethnicity group[21,28]. It is really difficult to enroll a high number of subjects with uniform procedures, the improvement of statistical methods to remove outliers could allow the set up of multicenter studies and the combination of differently selected subjects to constitute a reference population that is able to fulfill the recommended statistical power[28]. From the point of view of the basic clinical research, the new high sensitive immunoassay will allow deepening the meaning of cTn values in physiological conditions. Acknowledgments
The Authors wish to thank the staff of the ACE Group for its commit-ment to the current research and the foundation CARICAL (CAssa RIsparmio di Calabria e Lucania) thatfinance the ACE group.
References
[1]Hamm CW, Bassand JP, Agewall S, et al. ESC Committee for Practice Guidelines. ESC guidelines for the management of acute coronary syndromes in patients presenting without persistent ST-segment elevation: the Task Force for the management of acute coronary syndromes (ACS) in patients presenting without persistent ST-segment elevation of the European Society of Cardiology (ESC). Eur Heart J 2011; 32:2999–3054.
[2]Dickstein K, Cohen-Solal A, Filippatos G, et al. ESC Committee for Practice Guidelines (CPG). ESC guidelines for the diagnosis and treatment of acute and chronic heart failure 2008: the Task Force for the diagnosis and treatment of acute and chronic heart failure 2008 of the European Society of Cardiology. Developed in collaboration with the Heart Failure Association of the ESC (HFA) and endorsed by the European Society of Intensive Care Medicine (ESICM). Eur J Heart Fail 2008;10:933–89.
[3]Thygesen K, Mair J, Giannitsis E, et al. Study group on acute cardiac care. How to use high-sensitivity cardiac troponins in acute cardiac care. Eur Heart J 2012;33:2252–7.
[4]Thygesen K, Alpert JS, Jaffe AS, et al. Joint ESC/ACCF/AHA/WHF task force for universal definition of myocardial infarction. third universal definition of myocardial infarction. J Am Coll Cardiol 2012;60:1581–98.
[5]Apple FS. A new season for cardiac troponin assay: it's time to keep a scorecard. Clin Chem 2009;55:1303–6.
[6]Clerico A, Fortunato A, Ripoli A, et al. Distribution of plasma cardiac troponin I values in healthy subjects: pathophysiological considerations. Clin Chem Lab Med 2008;46: 804–8.
[7]Eggers KM, Jaffe AS, Lind L, et al. Value of cardiac troponin I cutoff concentrations below the 99th percentile for clinical decision-making. Clin Chem 2009;55:85–92.
[8]Aw TC, Phua SK, Tan SP. Measurement of cardiac troponin I in serum with a new high-sensitivity assay in a large multi-ethnic Asian cohort and the impact of gender. Clin Chim Acta 2013;422:26–8.
[9]Eggers KM, Lind L, Venge P, Lindahl B. Factors influencing the 99th percentile of cardiac troponin I evaluated in community-dwelling individuals at 70 and 75 years of age. Clin Chem 2013;59:1068–73.
[10]Apple FS, Ler R, Murakami MM. Determination of 19 cardiac troponin I and T assay 99th percentile values from a common presumably healthy population. Clin Chem 2012;58:1574–81.
[11]Mingels A, Jacobs L, Michielsen E, et al. Reference population and marathon runner sera assessed by highly sensitive cardiac troponin T and commercial cardiac tropo-nin T and I assays. Clin Chem 2009;55:101–8.
[12]Giannitsis E, Kurz K, Hallermayer K, et al. Analytical validation of a high-sensitivity cardiac troponin T assay. Clin Chem 2010;56:254–61.
[13]Hammarsten O, Fu ML, Sigurjonsdottir R, et al. Troponin T percentiles from a random population sample, emergency room patients and patients with myocardial infarc-tion. Clin Chem 2012;58:628–37.
[14]Saenger AK, Beyrau R, Braun S, et al. Multicenter analytical evaluation of a high-sensitivity troponin T assay. Clin Chim Acta 2011;412:748–54.
[15]Olivieri F, Galeazzi R, Giavarina D, et al. Aged-related increase of high sensitive Troponin T and its implication in acute myocardial infarction diagnosis of elderly patients. Mech Ageing Dev 2012;133:300–5.
[16]Pugh KG, Wei JY. Clinical implications of physiological changes in the aging heart. Drugs Aging 2001;18:263–76.
[17]Collinson PO, Heung YM, Gaze D, et al. Influence of population selection on the 99th percentile reference value for cardiac troponin assays. Clin Chem 2012;58:219–25.
[18]Apple FS, Collinson PO. IFCC task force on clinical applications of cardiac biomarkers. Analytical characteristics of high-sensitivity cardiac troponin assays. Clin Chem 2012;58:54–61.
[19]Menacer S, Claessens YE, Meune C, et al. Reference range values of troponin mea-sured by sensitive assays in elderly patients without any cardiac signs/symptoms. Clin Chim Acta 2013;417:45–7.
[20]Koerbin G, Abhayaratna WP, Potter JM, et al. Effect of population selection on 99th percentile values for a high sensitivity cardiac troponin I and T assays. Clin Biochem 2013;46:1636–43.
[21]Hickman PE, Badrick T, Wilson SR, McGill D. Reporting of cardiac troponin— problems with the 99th population percentile. Clin Chim Acta 2007;38:182–3.
[22]Ceriotti F, Hinzmann R, Panteghini M. Reference intervals: the way forward. Ann Clin Biochem 2009;46:8–17.
[23]Caserta CA, Pendino GM, Alicante S, et al. MAREA study group. Body mass index, cardiovascular risk factors, and carotid intima-media thickness in a pediatric population in southern Italy. J Pediatr Gastroenterol Nutr 2010;51:216–20.
[24]Caserta CA, Pendino GM, Amante A, et al. Cardiovascular risk factors, nonalcoholic fatty liver disease, and carotid artery intima–media thickness in an adolescent population in southern Italy. Am J Epidemiol 2010;171:1195–202.
[25]Levey AS, Coresh J, Greene T, et al. Chronic kidney disease epidemiology collabora-tion. Expressing the Modification of Diet in Renal Disease Study equation for estimating glomerularfiltration rate with standardized serum creatinine values. Clin Chem 2007;53:766–72.
[26]Franzini M, Masotti S, Prontera C, et al. Clinical implications of a recent adjustment to the high-sensitivity cardiac troponin T assay: some results. Clin Chem Lab Med 2014;52:e21–3.
[27]Thygesen K, Mair J, Katus H, et al. Study Group on biomarkers in cardiology of the ESC working group on acute cardiac care. Recommendations for the use of cardiac troponin measurement in acute cardiac care. Eur Heart J 2010;31:2197–204.
[28]Sandoval Y, Apple FS. The global need to define normality: the 99th percentile value of cardiac troponin. Clin Chem 2013;60:455–62.
[29]CLSI. Defining, establishing, and verifying reference intervals in the clinical laborato-ry; approved guideline. CLSI document C28–A33rd ed. . Wayne (PA): CLSI; 2008.
[30]Cain PA, Ahl R, Hedstrom E, et al. Age and gender specific normal values of left ventricular mass, volume and function for gradient echo magnetic resonance imaging: a cross sectional study. BMC Med Imaging 2009;9:2.
[31]Hamwi SM, Sharma AK, Weissman NJ, et al. Troponin-I elevation in patients with increased left ventricular mass. Am J Cardiol 2003;92:88–90.
[32]Duman D, Tokay S, Toprak A, et al. Elevated cardiac troponin T is associated with in-creased left ventricular mass index and predicts mortality in continuous ambulatory peritoneal dialysis patients. Nephrol Dial Transplant 2005;20:962–7.
[33]Mollova M, Bersell K, Walsh S, et al. Cardiomyocyte proliferation contributes to heart growth in young humans. Proc Natl Acad Sci U S A 2013;110:1446–51.