2021-01-04T11:01:20Z
Acceptance in OA@INAF
þÿA "<60 day Super-orbital Period Originating from the Ultraluminous X-Ray Pulsar in
M82
Title
Brightman, Murray; Harrison, Fiona A.; BACHETTI, Matteo; Xu, Yanjun; Fürst,
Felix; et al.
Authors
10.3847/1538-4357/ab0215
DOI
http://hdl.handle.net/20.500.12386/29423
Handle
THE ASTROPHYSICAL JOURNAL
Journal
873
Abstract
Ultraluminous X-ray(ULX) pulsars are a new class of object powered by apparent super-critical accretion onto magnetized neutron stars. Three sources in this class have been identified so far; M82X-2, NGC5907ULX-1, and NGC7793P13 have been found to have two properties in common; ∼1 s spin periods, and for NGC5907ULX-1 and NGC7793P13 periodic X-ray flux modulations on timescales of ∼60–80 days. M82 X-2 resides in a crowded field that includes the ULX M82 X-1 separated from X-2 by 5″, as well as other bright point sources. A 60 day modulation has been observed from the region, but the origin has been difficult to identify; both M82 X-1 and X-2 have been suggested as the source. In this paper we present the analysis of a systematic monitoring campaign by Chandra, the only X-ray telescope capable of resolving the crowded field. From a simple Lomb–Scargle periodogram analysis and a more sophisticated Gaussian Process analysis wefind that only X-2 exhibits a periodic signal around 60 days, supporting previous claims that it is the origin. We also construct a phase-averagedflux profile of the modulations from higher-cadence Swift/XRT data and find that the flux variations in the Chandra data are fully consistent with theflux profile. Since the orbit of the neutron star and its companion is known to be 2.5 days, the∼60 day period must be super-orbital in origin. The flux of the modulations varies by a factor of ∼100 from the minimum to the maximum, with no evidence for spectral variations, making the origin difficult to explain.
Key words: galaxies: individual(M82) – stars: neutron – X-rays: binaries
1. Introduction
The ultraluminous X-ray source (ULX) M82 X-2 is the second brightest point source in the galaxy M82 (Matsumoto et al. 2001; Feng & Kaaret 2007; Kong et al.2007) and was
recently discovered to be powered by accretion onto a magnetized neutron star (Bachetti et al.2014, B14) from the
detection of coherent X-ray pulsations by NuSTAR (Harrison et al. 2013) while observing the supernova 2014J. This
discovery revolutionized the field of ULXs, which were long thought to be powered by black holes because of their large apparent luminosities.
The pulsar has a spin period of 1.37 s and the pulse profile is close to being sinusoidal (B14). The orbit of the neutron star
around its companion star, which has a minimum mass of 5.2 Me, is close to circular, and has a period of 2.5 days, and a projected semimajor axis of∼7 million km. A linear spin up is also observed from the pulsations during the NuSTAR observations, with a pulse derivative P˙- ´2 10-10s s-1 that varies from observation to observation.
Since X-2 is separated from its brighter neighbor X-1 (Kaaret et al.2006) by only 5″ on the sky, Chandra is the only
X-ray telescope capable of resolving the two sources. In Brightman et al. (2016a) we analyzed the archival Chandra
observations of X-2,finding that the luminosity of the source is observed to range from ∼1038erg s−1 ∼1040erg s−1. Its
spectrum can be described in the Chandra band by an absorbed power law with Γ=1.33±0.15, typical of other known pulsars. From NuSTAR data we isolated the pulsed emission that was best fit by a power law with a high-energy cutoff, whereΓ=0.6±0.3 andEC=14-+35keV.
Since the discovery that the ULX M82 X-2 is powered by an accreting neutron star, intense theoretical work to determine how a pulsar can sustain such extreme luminosities has followed(e.g., Dall’Osso et al. 2015, 2016; Ekşi et al. 2015; Mushtukov et al. 2015; Karino & Miller 2016; Kawashima et al. 2016; King & Lasota 2016; Tsygankov et al.2016). In
addition, three further ULX pulsars have recently been identified, one in NGC5907 (ULX-1, Israel et al. 2017a), a
second in NGC7793 (P13, Fürst et al. 2016; Israel et al.
2017b), and a third in NGC300 (ULX1/SN2010da, Carpano
et al.2018). Furthermore, another ULX was identified as being
powered by a neutron star from the detection of a likely cyclotron resonance scattering feature, albeit with no pulsations detected, in M51 (ULX8, Brightman et al. 2018). These all
reside in more isolated environments than M82 X-2, making them easier to study.
The pulsars have remarkably similar basic properties: peak luminosities that exceed their Eddington limits by a factor of 50–500, spin periods of order 1 s, and periodic variability in theirfluxes on timescales of tens of days. NGC5907ULX-1 was found to have a periodic modulation in its X-rayflux of
78 days (Walton et al. 2016) and NGC7793P13 has a
∼64–65 day periodicity in the optical (Motch et al. 2014) and
X-rays(Hu et al.2017). While several claims have been made
that M82 X-2 exhibits a∼60 day periodic flux modulation (Qiu et al.2015; Kong et al.2016), due to the crowded field of M82,
the periodicity from X-2 is less certain.
The periodic X-ray variability of the central region of M82 has been well studied, originating from the discovery of a 62 day periodic modulation in RXTE data by Kaaret et al. (2006), which was at first interpreted as being due to M82 X-1
and being orbital in nature. Following this, the periodic signal was observed to change phase (Pasham & Strohmayer 2013),
which the authors considered to be more likely due to a super-orbital origin. Later analysis of Swift/XRT data by Qiu et al. (2015) implied that the periodicity does not in fact come from
M82 X-1; rather, one of three point sources ∼5″ to the southeast, one of which is the ULX pulsar, X-2. They also confirm that the period is not stable, finding that it changes in phase. Most recently, Kong et al. (2016) analyzed all archival
Chandra data identifying a possible 55 day period originating from X-2. In their own analysis of the Swift/XRT data, they find that the period varies between 55 and 62 days. All of these authors concluded that a systematic monitoring campaign by Chandra was necessary to correctly identify the origin of the periodicity.
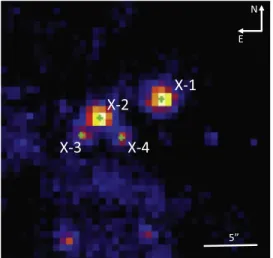
In this paper we present an analysis of a new systematic monitoring campaign on M82 by Chandra that took place in 2016. The primary goals of this campaign were to perform a temporal analysis of X-1 and X-2, to search for orbital and super-orbital modulations, to perform spectroscopic studies of the ULXs, and to study the nature of the other binary systems in M82. We focus here on unambiguously determining the source of the ∼60 day periodic signal. We concentrate on the four bright X-ray sources that have been claimed to be the possible source of the signal, X-1, X-2, X-3(CXOU J095551.2 +694044), and X-4 (CXOU J095550.6+694944); these are shown in Figure 1. We begin in Section2 where we conduct our own analysis of the Swift/XRT data presented by Qiu et al. (2015) and Kong et al. (2016) to use as a baseline for our
Chandra study. In Section3we present the analysis of our new Chandra data and in Section 4 we combine these results to determine the source of the periodicity. In Section5we discuss
the implications of our results and summarize and conclude in Section6.
2.Swift/XRT Data Analysis
While Swift/XRT, which has a point-spread function (PSF) of 18″ (half-power diameter at 1.5 keV; Moretti et al. 2005),
cannot resolve the various point sources in the center M82, it has conducted monitoring of the galaxy with a typical cadence of a few days between 2012 and 2016. Since this monitoring ran contemporaneously with our Chandra observations, and for four years prior, it provides us with a valuable baseline for our Chandra study. A total of 227 observations have been made of the galaxy over the 5 yr period, which we use to calculate a long-term light curve.
We calculate the fluxes via spectral fitting. We use the
HEASOFT (v 6.16) tool XSELECT to filter events from a 49″ radius region centered on the ULXs and to extract the spectrum. This extraction region encloses all sources of X-ray emission in the galaxy. Background events were extracted from a nearby circular region of the same size. We group the spectra with a minimum of one count per bin using theHEASOFT toolGRPPHA. We conduct spectralfitting using
XSPECv12.8.2 in the range 0.2–10 keV. We fit the spectra with a simple power law subjected to absorption intrinsic to M82 at z=0.00067 (zwabs∗powerlaw in XSPEC) with the Cash
statistic(Cash1979), which uses a Poisson likelihood function
and is hence most suitable for low numbers of counts per bin. From this model we calculate the observed flux in the 0.5–8 keV range, equivalent to the Chandra band.
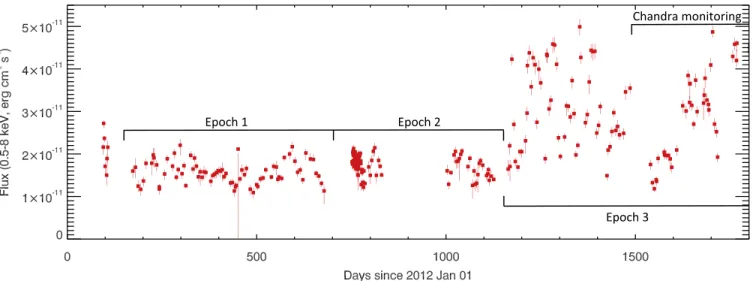
Figure2shows theflux as a function of the number of days since 2012 January 1. While the X-ray emission remained at (1–2)×10−11erg cm−2s−1 for much of the period covered,
the activity increased up to ∼5×10⁻¹¹erg cm−2s−1 after ∼1150 days and for the rest of the period due to a flaring episode from X-1(Brightman et al.2016b).
In order to investigate the periodic signal and any possible variations in phase or period, we split the data into three epochs of approximately the same size. Epoch 1 ranges from 150 to 700 days where the Swift/XRT monitoring was homogeneous and theflux was low. Epoch 2 ranges from 700 to 1150 days, where the Swift/XRT data included a period of intense monitoring of the supernova 2014J (Fossey et al. 2014) and
a gap of ∼200 days, and again the flux was low. In their analysis of the same Swift/XRT data, Qiu et al. (2015)
excluded the SN 2014J data to avoid contamination from the supernova. However, as Kong et al.(2016) pointed out, the
supernova was not detected in the X-rays below 10 keV (FX< 2.6 × 10⁻¹⁵erg cm−2s−1, Margutti et al. 2014), so we
use all of these data in our analysis. Epoch 3 ranges 1150–1800 days, where, again, the monitoring was homogeneous but the flux was high.
We conducted Lomb–Scargle (LS; Lomb 1976; Scargle
1982) periodogram analysis on these three epochs. We search
over periods from 10 to 1000 days with 104 independent frequencies. The resulting periodograms are presented in Figure 3. Periodic signals that peak at 61.0 days and 56.5 days are found in epoch 1 and epoch 2, respectively, but no such strong peak is found from epoch 3. The 61.0 day and 56.5 day periods are consistent with the 62.0±3.3 and 54.6±2.1 day periods detected by Qiu et al. (2015),
determined to each be coming from different sources, either X-2, X-3, or X-4. However, since we detect these different
Figure 1.On-axis Chandra image of the ULXs in M82(obsID 16580), with the four sources of interest marked with green“+” and labeled.
periodicities in different epochs, we assume they come from the same source(e.g., Kong et al.2016). Qiu et al. (2015) also did
not detect any significant periodicity from X-1, which agrees with our non-detection of periodicity during theflaring episode of epoch 3.
We carry out epoch folding of the Swift/XRT data in the two epochs over their respective periods to determine the average flux profile of the signals. We assign each Swift/XRT data point a phase and average the data over 8 phase bins. The resulting profiles of the modulations are presented in Figure4, where T0 corresponds to 2012 January 1. The error bars
represent the 1σ spread in the Swift/XRT data. Since the data from the two epochs have been folded on different periods but with the same T0, it appears as if a phase shift has occurred, but
this is not necessarily the case.
3.Chandra Data Analysis
The majority of the Chandra data analyzed here were all taken during 2016 (Cycle 17) as part of a systematic
Figure 2. Swift/XRT 0.5–8 keV observed flux of M82 during the period 2012–2016. We split these data into three epochs (see the labels) for timing analysis. We also mark the period over which the Chandra data were taken, which was contemporaneous with the Swift/XRT monitoring.
Figure 3.Lomb–Scargle periodograms of the Swift/XRT data during the periods 150–700 days (left), 700–1150 days (middle), and 1150–1800 (right). Periodic signals that peak at 61.0 days and 56.5 days are found for thefirst two epochs, but no signal is detected during the final one, during which X-1 is flaring and our Chandra monitoring took place.
Figure 4.Meanflux profiles of the 61.0 day (black filled squares) and 56.5 day (red empty squares, shifted by +0.01 in phase for clarity) signals detected in Swift/XRT monitoring during epoch 1 and epoch 2, respectively, with 1σ error bars calculated from epoch folding. T0corresponds to 2012 January 1. Two
monitoring program on M82. The program consisted of 12 individual observations taken at approximately monthly intervals. We additionally use three archival observations taken in the two years preceding the monitoring campaign to increase the baseline of our analysis. Full details are listed in Table 1. All 2016 observations were taken with ACIS-I at the optical axis with only a 1/8th sub-array of pixels on chip I1 or I3 turned on, depending on the roll angle. The ULXs at the center of M82 were placed 3 5 off-axis to smear out the PSF enough to mitigate the effects of pileup, but not so much as to cause significant blending of the PSFs. The sub-array of pixels was used to decrease the readout time of the detector to 0.4 s, further mitigating the effects of pileup.
Due to the off-axis smearing of the PSF and the varying roll angles we use the ACIS_EXTRACT (AE; Broos et al. 2010)
software to determine the spectral extraction regions. AE extracts spectral information for each source from each individual observation based on the shape of the local PSF,
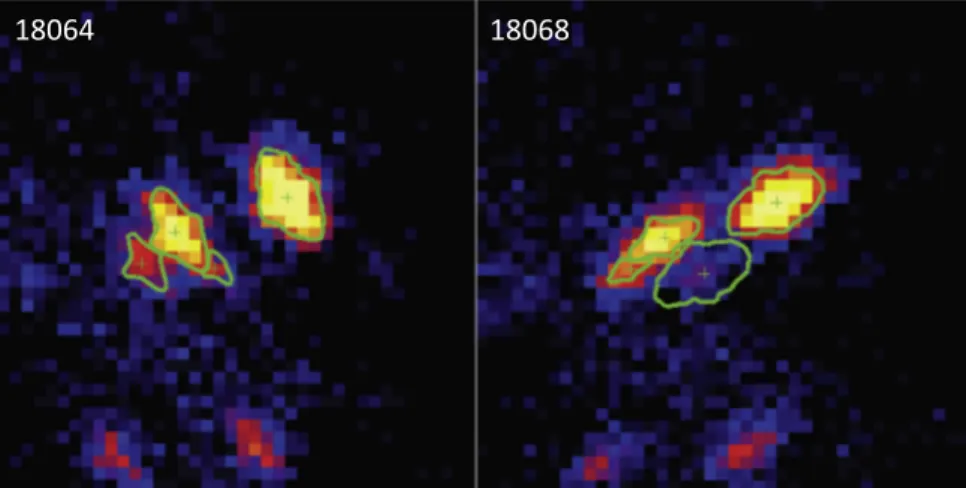
which varies significantly as a function of position on the detector. We use the known source positions, astrometrically correcting the images by eye (typical shifts of <1″). AE also resizes extraction regions in the case of crowded source positions such that they do not overlap, as is the case for M82. Where possible, we use regions where 90% of the PSF has been enclosed at 1.5 keV. Figure5 shows an example of two observations with differing roll angles and the extraction regions used that account for the shapes of the PSF at their respective positions. Background spectra are extracted from an events list that has been masked of all the point sources using regions containing at least 100 counts. We use AE version 2014 August 29, which calls onCIAOversion 4.7 andCALDB
version 4.6.5.
We follow the same spectralfitting method as for the Swift/ XRT data, grouping the spectra with a minimum of one count per bin, but in the 0.5–8 keV range appropriate for Chandra. Wefit the spectra with a simple absorbed power law and use a cflux component to calculate the observed 0.5–8 keV flux of each source. We plot thesefluxes in Figure 6 with their 90% uncertainties.
As done for the Swift/XRT data, we conducted a LS periodogram analysis of the 2014–2016 Chandra data. We search over periods of 30–300 days, a narrower range of periods than in the Swift/XRT analysis since the cadence of the Chandra monitoring is longer and the duration is shorter. We plot these LS periodograms in Figure 7. The most prominent peak in any of the periodograms is in that of X-2, at 63.8 days with a FWHM of 12.5 days.
To get an indication if the results obtained from the Lomb– Scargle periodogram can be independently confirmed, we fit the data with an alternative method, using a Gaussian process model. We use the implementation of these models, called celerite, in the celerite Python package10 (Foreman-Mackey et al. 2017). In the figures in this section, we show
the results of thefitting of these models on the Chandra data of all four sources.
Theflux of X-1 and X-2 spans multiple orders of magnitude. In order to make the code run on the same kind of quantities it
Figure 5.Example Chandra images of the ULXs in M82 from our observing campaign showing the extraction regions used(obsIDs 18064 and 18068). These have been determined by theACIS_EXTRACTsoftware, which calculates the shape of a region enclosing 90% of the local PSF at the source position. These are then rescaled depending on their proximity to nearby sources. The scale and orientation are the same as those in Figure1.
Table 1 Chandra Observational Data
ObsID Date Start Time Exposure
(1) (2) (3) (4) 17578 2015 Jan 16 13:40:00 10.0 16023 2015 Jan 20 00:26:16 10.0 17678 2015 Jun 21 02:45:09 10.0 18062 2016 Jan 26 19:44:49 25.1 18063 2016 Feb 24 00:37:06 25.1 18064 2016 Apr 5 16:04:41 25.1 18068 2016 Apr 24 20:02:13 25.1 18069 2016 Jun 3 22:10:58 25.1 18067 2016 Jul 1 23:18:08 26.1 18065 2016 Jul 29 07:50:01 25.1 18073 2016 Aug 19 08:49:59 40.1 18066 2016 Sep 3 10:11:06 25.1 18070 2016 Oct 8 00:39:30 25.1 18071 2016 Nov 3 07:26:45 25.1 18072 2016 Dec 1 09:35:57 25.6 Note.Details of the 12 Chandra observations of M82 taken in 2016 used in our analysis, plus 3 older observations, ordered by date. Column(1) gives the obsID, column(2) gives the date of the observation, column (3) gives the start time of the observation, and column(4) gives the total exposure time in ks.
10
Here we use the same convention used by Foreman-Mackey et al.(2017),
where italic indicates the model and monospace indicates the software library. The library can be found athttp://celerite.readthedocs.io/en/stable/.
was designed for, we normalize the fluxes using a magnitude scale defined as −2.5 log10(FX/10−10erg cm−2s−1), where FX
is the X-ray flux of the source in the 0.3–10 keV band. The exact choice of the referenceflux does not influence the results. The procedure we follow here is the following. We fit the data to a celerite model with a single peaked component, initially set at 60 days but leaving it free to vary between 20 and 500 days. After an initial fit, we sample the posterior distribution of the parameters with a Monte Carlo Markov Chain in order to verify how stable the initial solution is. If the 60 day period is a statistical fluctuation, we expect the final MCMC step to show no evidence of it.
In celerite, these quasi-periodic components are modeled as Single Harmonic Oscillator terms and their power density
spectrum is w p w w w w w = - + ( ) ( ) ( ) S S Q 2 , 1 0 04 2 02 2 02 2 2
whereω0is the characteristic frequency of the oscillator, Q is the
quality factor, and S0is defined so that wS( 0)= 2 pS Q0 2. Q measures how “peaked” is a component in the power spectrum: the quality factor is an estimate of the number of oscillations that are made before losing coherence. Thus, higher Q values indicate longer-lasting oscillations.
We follow the first example in Foreman-Mackey et al. (2017), using our data instead of the simulated data. We adapt
the Jupyter notebook used in the original paper to produce
Figure 6. Chandra0.5–8 keV observed fluxes of the four bright sources in the center of M82 during 2016. The error bars show the uncertainty in the flux at the 90% level, which may be smaller than the data points.
Figure 7.Lomb–Scargle periodograms of the four brightest point sources in the center of M82 from the 2014–2016 Chandra data (black lines). The dashed lines mark the 61.0 day and 56.5 day periods detected from Swift/XRT monitoring.
Figure4in that paper. Wefind the best-fit values of Q, S0, and
ω0by minimizing a log likelihood function, as explained in the
celerite manual and by Foreman-Mackey et al. (2017). The
initial priors for the parameters are: 3<log Q<15, with starting value Q=1000 so that we are looking for actual long-lasting oscillations; period 25 days<P < 100 days, starting value 30 days(arbitrary, far from 60); log(S0) between −15 and
15, practically unconstrained. Optionally, we can add a stochastic noise component, withQ=1 2 (fixed, to mimic a 1/f-like noise component, as per Foreman-Mackey et al.
2017), and the other parameters −15<log SN<15 and
−15<log ωN<15. The minimization is performed using
the L-BFGS-B method, as implemented inscipy.
Finally, we run an MCMC sampler using theemcee library, in order to estimate some meaningful intervals for the parameters by sampling the posterior distribution, using the appropriate log-probability for the celerite process. We create 5000 samples of the parameters after a burn-in phase where we throw away the first
500 steps. Due to the high number of results pegged at the lower limit of the period, we discard all results for periods<20 days.
To estimate the noise levels, and to assess the significance of these results, we use two methods. First, we randomize the observing times and maintain theflux values and their errors, doing this 1000 times; then, we calculate the confidence limits from the 84% and 97.5% percentiles(equivalent to 68% and 95% confidence levels or 1σ and 2σ). Second we only scramble the flux measurements, which has the effect of retaining any imprint of the observing strategy. Again, we use the same percentiles above to evaluate the 1σ and 2σ levels.
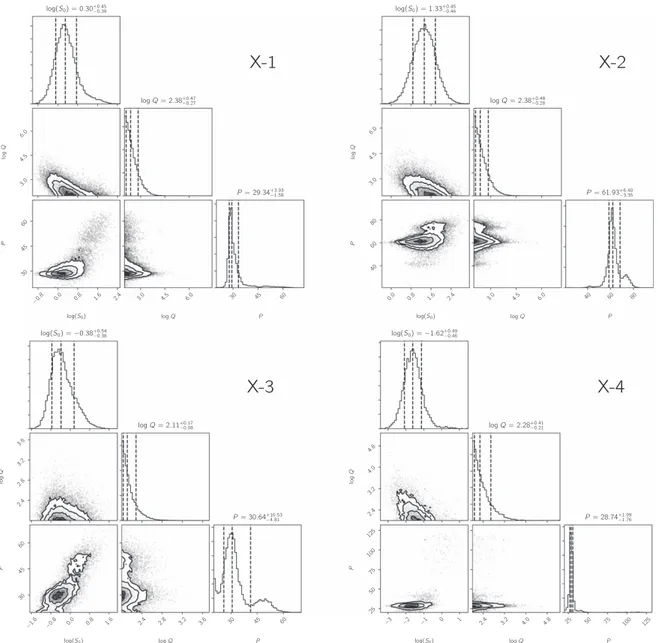
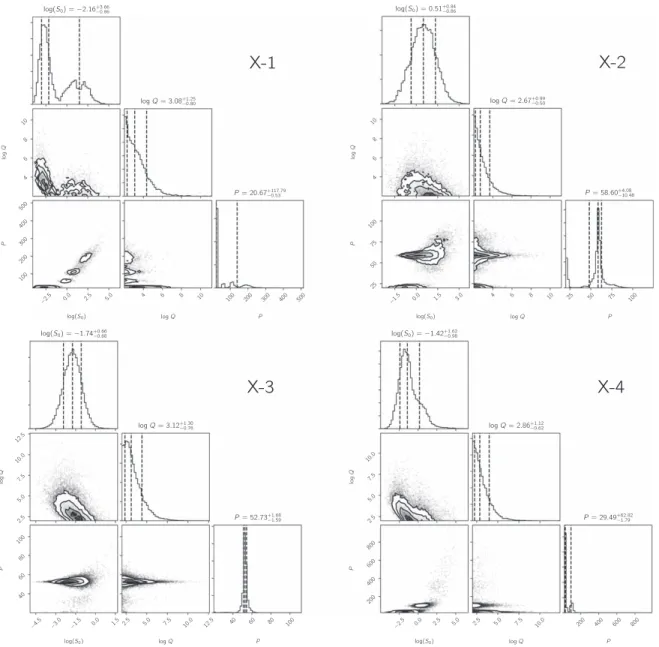
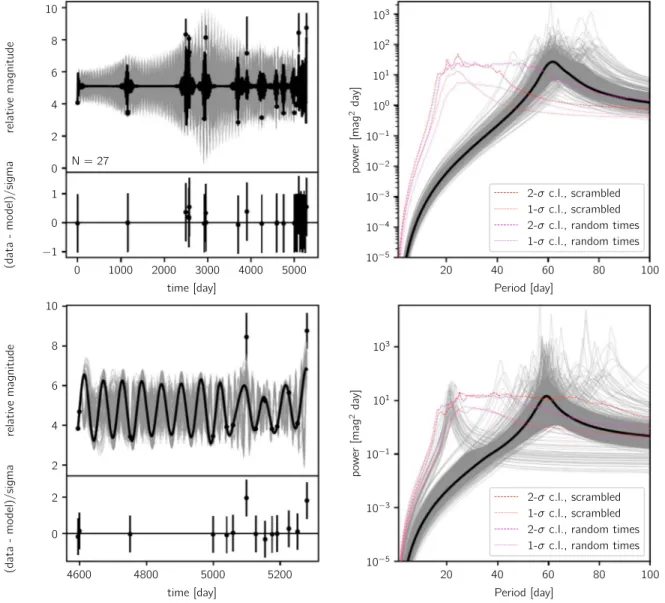
The results of the parameter distributions are reported in Figures 8 and 9, on the whole data set and on the last 1000 days, respectively. The parameters are highly correlated to each other and the posterior distribution is not regular. A period of ∼60 days appears invariably in the first best fit for X-2 and not for the other sources, and remains as a peaked feature in the posterior distribution as well. Figure10shows the best-fit light
Figure 8.Posterior probability distributions for the parameters of the celerite model. The histograms along the diagonal show the marginalized posterior distributions for the single parameters. Contours show the 1σ, 2σ, and 3σconfidence intervals for each pair of parameters. The quoted uncertainties correspond to the 16% and 84% percentiles of the marginal distributions.
curve and best-fit power spectrum for X-2, again for the whole data set and on the last 1000 days, respectively. The noise levels from both methods as calculated above are also plotted, which shows that the∼60 day signal from X-2 is in excess of the 2σ levels estimated from both. Approximately, we can say that the period found in X-2 is ∼(60 ± 10) d (1σ) in both the whole data set and the last 1000 days of data. The distribution of best periods is far from symmetric, with strong correlations with the other parameters.
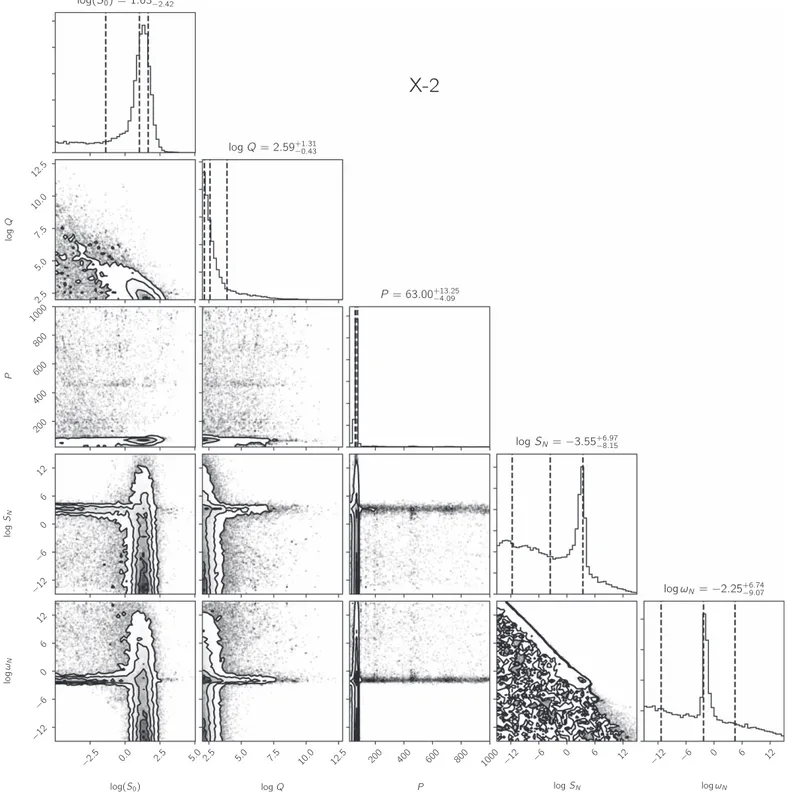
Note that the scatter of residuals in Figures10and11is lower than the error bars, which is an indication that this model is probably an overkill, it is trying to overfit the data. Therefore, it comes as no surprise that adding a stochastic noise component creates a bimodal situation, where the peak at 60 days appears where the amplitude of the stochastic noise component has a very low amplitude, and vice versa(Figure12).
Nonetheless, as can be seen in all plots in this section, X-2 is the only source where the peak around 60 days isfitted on the whole history of the source and on the time-filtered data, while in all other cases this narrow feature sets at different frequencies or does not appear at all in the whole data set.
This is confirmed by the posterior distribution sampling done in the MCMC.
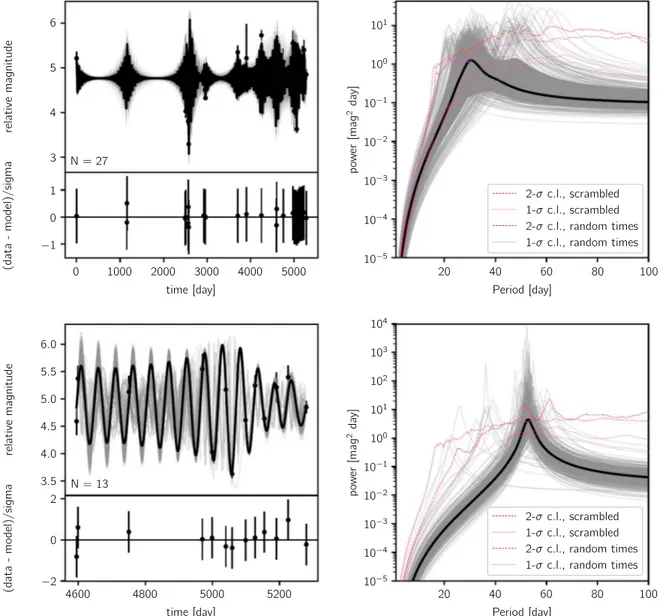
Curiously enough, whenfiltering for the last 1000 days of data, a peak also appears in X-3(Figure11) close to 53 days.
Note, however, that the amplitude of the oscillation in the light curve of X-3 is lower than that of X-2. This may or may not be an effect of the point-spread function of X-2 partially overlapping with X-3 (See Figure 5) and affecting the flux
measurement. Since the periods are slightly different, and there is no obvious correlation between the fluxes measured in the two sources, we leave this to future analysis. X-1, X-3, and X-4 also exhibit a possible component at 30 days, below 2σ. If real, we are prone to attribute it to X-1, because the source is so bright that it might be influencing the flux measurements of these nearby and much weaker sources.
4. Is X-2 Responsible for the Periodic Modulation Seen by Swift/XRT?
The∼60 day periodic signal that we detect from X-2 in the 2016 Chandra data is similar to the 61.0 day and 56.5 day
periodic signals detected by Swift/XRT from 2012–2104. However, during 2016, when X-1 was highly active, no periodic signal is detected from Swift/XRT, which is dominated by the flux from X-1, so a comparison of contemporaneously detected signals is not possible. We instead compare the average flux profiles of the signals detected by Swift/XRT that we calculated in Section 2 to the observed Chandrafluxes of X-2.
We allow for a change in normalization of the signal, which both accounts for an intrinsic change in normalization and for the integratedfluxes of the other X-ray sources included in the Swift/XRT data that cannot be spatially resolved and which vary over time. The change in normalization is accounted for by taking the average flux profiles and subtracting off a constant. We vary the constant between (0–2)×10−11erg cm−2s−1 in steps of 2×10⁻¹³erg cm−2s−1. We also allow for any possible phase changes that are known to occur. For each value of the constant subtracted off, we cycle through phase space in steps of one day.
For eachflux and phase value we test the goodness of fit of the derived profile of the observed periodic signal to the
observed Chandrafluxes of X-2 using χ2statistics. Since both quantities have uncertainties, we add these together; however, they are dominated by the uncertainty in theflux profile. We do this for the flux profiles of the signals found in epoch 1 and epoch 2.
We find that for epoch 1 the minimum χ2 (χ2=2.4 for 10 degrees of freedom) is found when a constant flux of 1.3×10⁻¹¹erg cm−2s−1is subtracted and the phase has been shifted by 31 days (a phase shift of ∼0.5). For epoch 2, the minimum χ2 (χ2=6.5 for 10 degrees of freedom) is found when a constantflux of 1.5×10⁻¹¹erg cm−2s−1is subtracted and the phase is shifted by+52 days or −4 days. We show these mean profiles with the best-fitting flux subtracted and phase shift applied in Figure13. From the χ2values and this figure, we find that the flux variability profile of X-2 we observe in 2016 is fully consistent with the periodic signal seen by Swift/XRT, with a change in phase.
We also test if the observed Chandrafluxes of X-1, X-3, or X-4 could also account for the observed modulation. Carrying out the same profile fitting that we conducted for X-2, we find that the mean profile also compares well with the Chandra data
Figure 10.Best-fit solution of the celerite modeling of the light curve of X-2 done on Figures8and9,(top) on the full data set and (bottom) limited to the last 1000 days of observations. On the left, we plot the light curve and the prediction from the Gaussian process model. On the right, we plot the power spectrum. The black line indicates the initialfit of the power spectrum and the light curve. The gray, semi-transparent lines indicate 300 random realizations of the Gaussian process, simulated in the MCMC.
on X-3. However, since no periodicity around 60 days is detected in the LS periodogram of these data (only a peak around 20–30 days is seen; Figure7), we find it unlikely that
X-3 is the source of the signal. The periodogram of X-1 also presents a peak at∼60 days that is just above the noise curve; however, because no similar peak is detected in the Swift/XRT data of epoch 3, where X-1 is dominating the flux, we also consider it unlikely that X-1 is the source of the signal. This is in agreement with Qiu et al.(2015), who found no periodicity
originating from the region around X-1. While they could not determine exactly which source the signal did originate from due to the lack of spatial resolution of Swift/XRT, our new Chandra data conclusively point to X-2 as the origin.
M82 had been observed by Chandra on many previous occasions since its launch in 1999 prior to our new monitoring campaign. These data were described and analyzed in Brightman et al.(2016a). They consisted of a heterogeneous mix of exposure
times, off-axis angles, and instrumental setup, and were taken at irregular intervals, and thus making them inconducive to a search for periodicities. Our new data have an advantage over the archival data in that they consist of a homogeneous data set taken regularly at intervals with the same instrumental setup. While we
do not detect a peak around 60 days in an LS test of the archival data, the more sophisticated auto-regression analysis shows that the periodicity is stable over the 17 yr of observations(Figure10).
We show the long-term light curve of our data combined with the archival data in Figure 14. This shows that the flux ranges exhibited by the archival data were very similar to those of our new data. The dashed lines mark the maximum and minimumflux levels observed in our new data, and the old data almost all fall inside this range, with the exception of three data points that appear to lie above the maximumflux. However, these data were subjected to the effects of pileup, hence theflux may have been overestimated. See Brightman et al.(2016a) for
more details. Alternatively, however, it was during one of these epochs that the pulsations werefirst detected (at ∼5500 days), so the increased brightness at this time could have come from the pulsed component that has not been detected since (M. Bachetti et al. 2019, in preparation).
We also run afit to the profile of the Swift/XRT profile on the long-term light curve in the same way as described above. Since the data are spread over 16 yr, and phase changes are likely to have occurred, we limit this analysis to a period over which nine observations were take over the period of∼1.3 yr,
from 2009 April–2010 August. We show the fit in Figure14. This shows that for our new data, the long-term Chandrafluxes of M82 X-2 can likewise be fully described by the periodically modulated Swift/XRT flux profile.
5. Implications for the ULX Pulsar
We have unambiguously identified the ULX pulsar M82 X-2 as the source of the∼60 day periodicity originating from M82, first discovered by RXTE (Kaaret et al.2006) and confirmed by
Swift/XRT (Qiu et al.2015) from a systematic monitoring by
Chandra. From the Chandra monitoring data, which extended over a period of ∼1 yr, we find the period to be 63.8±0.6 days. Since the orbital period of the system has been determined to be 2.5 days(Bachetti et al. 2014), the 63.8 day
period must be super-orbital in origin. The modulations are roughly sinusoidal, with a peak-to-trough amplitude of ∼5×10⁻¹²erg cm−2s−1. The Chandra minimum and
max-imumfluxes correspond to a factor ∼100 variation in flux. The period of the super-orbital flux modulation from M82 X-2 bears a striking similarity to the periods of the flux
Figure 12.Same as Figure8, but adding a“red noise” component with =Q 1 2 . There is a clear bimodality: if the red noise component is strong, the oscillatory component is damped, and vice versa. This argues further against the combination of two sources of variability in the data set.
modulations observed from the other ULX pulsars, NGC7793P13, where the period is 65.1 days (Hu et al.
2017) and NGC5907ULX1, where the period is 78.1 days
(Walton et al.2016). However, while in these systems the flux
is only observed to vary by a factor of ∼2–3, the flux from M82 X-2 varies by a factor that is far larger. Furthermore, both NGC7793P13 and NGC5907ULX1 exhibit “off” states where their fluxes are significantly lower than expected given an extrapolation of the periodic signal (Motch et al. 2014; Walton et al. 2015, 2016; Fürst et al. 2016). We find no
evidence for any additional off states from M82 X-2 that lower than those caused by the super-orbital modulations.
Super-orbital periods are known in several other well-studied neutron star binary systems, such as Her X-1(Tananbaum et al.
1972), LMC X-4 (Lang et al. 1981) and SMC X-1 (Gruber &
Rothschild1984). In most cases, a precessing warped accretion
disk model is the favored one, where the variations in intensity are caused by the warp in the accretion disk periodically occulting the neutron star opposed to by projection effects, as discussed above. The super-orbital flux variations from these neutron star binaries are quite similar to those observed in M82 X-2. For example, for LXC X-4 the variations have a period of
30 days, are roughly sinusoidal in shape, and vary by a factor of up to 60, dropping to zero during the minima.
One test of the warped accretion disk model for M82 X-2 is the expectation of strong spectral variations with flux. In Brightman et al. (2016a) we explored the dependence of the
absorption and spectral slope on the observed luminosity; however, we did notfind any strong evidence for a dependence of either on the luminosity. This was made challenging, however, since at its lowestfluxes, the brightness of X-2 is at a similar level as the local background produced by bright diffuse emission, making it difficult to get good spectral constraints.
Fortuitously, a 120 ks on-axis observation of M82 was made in 2009(obsID 10543) in which X-2 was at its minimum flux. Since the on-axis PSF is less than 1″, this observation gives us the best opportunity to study the spectral shape of X-2 at this low flux due to the low background inclusion. We found that the spectral shape was remarkably similar to that of the high state (e.g., obsID 5644), with Ghigh=1.42-+0.050.05 and Glow=1.20-+0.640.57. We show the spectra in Figure 15. We therefore find it highly unlikely that the flux variations are caused by occultations.
Middleton et al. (2018) invoked the precession of an
accretion disk induced by the Lense–Thirring precession of a large scale-height accretion flow, to explain the long-term
Figure 13.2016 Chandra 0.5–8 keV light curve (green points) of X-2 compared to the meanflux profile of the 61.0 day signal (top, black solid line) and 56.5 day signal (bottom, black solid line) detected in Swift/XRT monitoring. For the 61.0 day signal a constantflux of 1.3×10⁻¹¹erg cm−2s−1has been subtracted and a phase shift of 31 days has been applied. For the 56.5 day a constantflux of 1.5×10⁻¹¹erg cm−2s−1has been subtracted and a phase shift of 52 days has been applied. The hatched regions in both panels represent the 1σ spread in the Swift/XRT flux profiles.
Figure 14.Top: 1999–2016 Chandra 0.5–8 keV light curve (green points) of X-2. The dashed lines represent the maximum and minimumfluxes that we observed during the 2016 monitoring campaign. This shows that with the exception of three observations, the flux ranges observed in 2016 were representative of the long-term range. Bottom: zoomed-in view of the nine observations taken in the period 2009 April–2010 August, with the best-fit Swift/XRT flux profile overlaid.
periodicflux modulations seen in ULX pulsars. Here projection effects rather than occultation effects are invoked to explain them. Furthermore, for NGC5907ULX-1, Fürst et al. (2017)
found evidence for spectral variations as a function of super-orbital phase, which were attributed to a precessing accretion disk where the angle between our line of sight and the axis of the accretion disk changes. However, a precessing disk would require very large changes in inclination angle(i.e., from face-on to edge-face-on) to cause the variations of almost two orders of magnitude seen from M82 X-2.
While the precession of the disk itself may not be the cause of the variations, precessing of a beamed component might. For example, Dauser et al.(2017) conducted Monte-Carlo
simula-tions of the large scale-height disk that is expected to form from super-critical accretion, and found that geometrical beaming by a small conical opening and precession can describe the observed flux variations NGC5907ULX-1. This model can produce aflux boost by a factor of 100. However, this scenario needs veryfine tuning, as it requires half-opening angles of the flow of 5° or less and a line-of-sight viewing angle that is very similar to the opening angle such that the flux drops dramatically when the beamed component precesses out of the line of sight. Furthermore, accretion flow models at high accretion rates have found that the disk always remains slim (H/R < 1), precluding such thick accretion disks (H/R > 1, Beloborodov 1998; Lipunova 1999; Poutanen et al. 2007; Lasota et al. 2016).
Some previous works have interpreted theflux profile of X-2 to be bimodal, with“high” and “low” states possibly related to the propeller effect(e.g., Tsygankov et al.2016). However the
propeller effect is related to changes in the accretion rate, and since the flux modulation is periodic, it is hard to understand how changes in the accretion rate can be periodic unless they are related to the binary orbit, which is both highly circular and at 2.5 days is far shorter than the 63.8 day periodic modulation. Conversely, Dall’Osso et al. (2016) interpreted the observed
fluxes from X-2 as being a continuous distribution, though their magnetically threaded disk model that describes the disk transitioning from being radiation-pressure-dominated at high fluxes to being gas-pressure-dominated at low fluxes. However, again the emission according to their model depends on accretion rate, which is hard to reconcile with the long-timescale periodicity. Furthermore, spectral changes would be expected as a function of luminosity.
6. Summary and Conclusions
We have presented results on a systematic monitoring campaign of M82 with Chandra, with the goal of unambiguously determining the source of the∼60 day periodic signal detected by RXTE and Swift/XRT. From a simple Lomb–Scargle period-ogram analysis and a more sophisticated auto-regressive moving average analysis of theflux variations from the four bright point sources at the center of M82, wefind that only the ULX pulsar, X-2, exhibits a signal at or around 60 days, from both the monitoring data and the longer-term archival data. We therefore confirm that this is the source of the well known periodicity from M82. We constructed a meanflux profile of the Swift/XRT signal and compare to the Chandrafluxes from X-2 and find that the observed Chandrafluxes from X-2 can fully explain the Swift/ XRT flux profile once the other sources included in the Swift/ XRT PSF and a change of phase are accounted for. The flux modulations with a ∼60 day period are at far larger timescales than the binary orbit and must therefore be super-orbital in origin. Theflux varies by a factor of ∼100 from minimum to maximum, with no evidence for spectral variations. We discuss several possible mechanisms to produce these observations, but none of these are capable of fully explaining them all.
We thank the anonymous referees and the statistics referee for their critical reviews and input on this paper, which improved it greatly. We would also like to thank Matthew Graham for valuable insight and discussion. M. Bachetti acknowledges support from the Fulbright Scholar Program and A. Zezas acknowledges funding from the European Research Council under the European Union’s Seventh Framework Programme (FP/2007–2013)/ERC grant Agreement No. 617001. This project has received funding from the European Union’s Horizon 2020 research and innovation program under the Marie Sklodowska-Curie RISE action, grant agreement No. 691164(ASTROSTAT). The scientific results reported in this article are based on observations made by the Chandra X-ray Observatory. Support for this work was provided by the National Aeronautics and Space Administration through Chandra Award Number GO6-17080X issued by the Chandra X-ray Center, which is operated by the Smithsonian Astro-physical Observatory for and on behalf of the National Aeronautics Space Administration under contract NAS8-03060. This research has made use of software provided by the Chandra X-ray Center (CXC) in the application package
CIAO. We also acknowledge the use of public data from the Swift data archive.
Facilities: Chandra(ACIS), Swift (XRT). ORCID iDs
Murray Brightman https://orcid.org/0000-0002-8147-2602
Fiona A. Harrison https://orcid.org/0000-0003-2992-8024
Matteo Bachetti https://orcid.org/0000-0002-4576-9337
Yanjun Xu https://orcid.org/0000-0003-2443-3698
Felix Fürst https://orcid.org/0000-0003-0388-0560
Dominic J. Walton https://orcid.org/0000-0001-5819-3552
Andrew Ptak https://orcid.org/0000-0001-5655-1440
Andreas Zezas https://orcid.org/0000-0001-8952-676X
References
Bachetti, M., Harrison, F. A., Walton, D. J., et al. 2014,Natur,514, 202
Beloborodov, A. M. 1998,MNRAS,297, 739
Figure 15.Comparison of the spectral shape of X-2 at its maximumflux (blue) and minimumflux (black). The spectral shape is very similar, as are the derived parameters
Harrison, F. A., Craig, W. W., Christensen, F. E., Hailey, C. J., & Zhang, W. W. 2013,ApJ,770, 103
Hu, C.-P., Li, K. L., Kong, A. K. H., Ng, C.-Y., & Chun-Che Lin, L. 2017,
ApJL,835, L9
Israel, G. L., Belfiore, A., Stella, L., et al. 2017a,Sci,355, 817
Israel, G. L., Papitto, A., Esposito, P., et al. 2017b,MNRAS,466, L48
Kaaret, P., Simet, M. G., & Lang, C. C. 2006,ApJ,646, 174
Karino, S., & Miller, J. C. 2016,MNRAS,462, 3476
2007,MNRAS,377, 1187
Qiu, Y., Liu, J., Guo, J., & Wang, J. 2015,ApJL,809, L28
Scargle, J. D. 1982,ApJ,263, 835
Tananbaum, H., Gursky, H., Kellogg, E. M., et al. 1972,ApJL,174, L143
Tsygankov, S. S., Mushtukov, A. A., Suleimanov, V. F., & Poutanen, J. 2016,
MNRAS,457, 1101
Walton, D. J., Fürst, F., Bachetti, M., et al. 2016,ApJL,827, L13
