THE ASTROPHYSICAL JOURNAL SUPPLEMENT SERIES
Journal
234
The 3CR
Chandra Snapshot Survey: Extragalactic Radio Sources with 0.5<z<1.0
F. Massaro1,2,3 , V. Missaglia4, C. Stuardi1,3, D. E. Harris5,11 , R. P. Kraft5 , A. Paggi5 , E. Liuzzo6, G. R. Tremblay5,7 , S. A. Baum8,9, C. P. O’Dea8,10 , B. J. Wilkes5 , J. Kuraszkiewicz5, and W. R. Forman5
1
Dipartimento di Fisica, Università degli Studi di Torino, via Pietro Giuria 1, I-10125 Torino, Italy 2
Istituto Nazionale di Fisica Nucleare, Sezione di Torino, I-10125 Torino, Italy 3
INAF-Osservatorio Astrofisico di Torino, via Osservatorio 20, I-10025 Pino Torinese, Italy 4
Department of Physical Sciences, University of Napoli Federico II, via Cinthia 9, I-80126 Napoli, Italy 5
Smithsonian Astrophysical Observatory, 60 Garden St., Cambridge, MA 02138, USA 6
Istituto di Radioastronomia, INAF, via Gobetti 101, I-40129, Bologna, Italy 7
Yale Center for Astronomy and Astrophysics, Physics Department, Yale University, PO Box 208120, New Haven, CT 06520-8120, USA 8
University of Manitoba, Dept. of Physics and Astronomy, Winnipeg, MB R3T 2N2, Canada 9
Center for Imaging Science, Rochester Institute of Technology, 84 Lomb Memorial Dr., Rochester, NY 14623, USA 10
School of Physics & Astronomy, Rochester Institute of Technology, 84 Lomb Memorial Dr., Rochester, NY 14623, USA Received 2017 March 6; revised 2017 August 15; accepted 2017 September 20; published 2018 January 12
Abstract
This paper presents the analysis of Chandra X-ray snapshot observations of a subsample of the extragalactic sources listed in the revised Third Cambridge radio catalog(3CR), previously lacking X-ray observations and thus observed during Chandra Cycle 15. This data set extends the current Chandra coverage of the 3CR extragalactic catalog up to redshift z=1.0. Our sample includes 22 sources consisting of 1 compact steep spectrum source, 3 quasars(QSOs), and 18 FR II radio galaxies. As in our previous analyses, here we report the X-ray detections of radio cores and extended structures (i.e., knots, hotspots, and lobes) for all sources in the selected sample. We measured their X-ray intensities in three energy ranges, soft(0.5–1 keV), medium (1–2 keV), and hard (2–7 keV), and we also performed standard X-ray spectral analysis for brighter nuclei. All radio nuclei in our sample have an X-ray counterpart. We also discovered X-ray emission associated with the eastern knot of 3CR 154, with radio hotspots in 3CR 41, 3CR 54, and 3CR 225B, and with the southern lobe of 3CR 107. Extended X-ray radiation around the nuclei 3CR 293.1 and 3CR 323 on a scale of few tens of kiloparsecs was also found. X-ray extended emission, potentially arising from the hot gas in the intergalactic medium and/or due to the high-energy counterpart of lobes, is detected for 3CR 93, 3CR 154, 3CR 292, and 3CR 323 over a scale of a few hundred kiloparsecs. Finally, this work also presents an update on the state-of-the-art of Chandra and XMM-Newton observations for the entire 3CR sample.
Key words: galaxies: active– radio continuum: galaxies – X-rays: general
1. Introduction
Since the early 60s, the ensemble of extragalactic sources listed in the Third Cambridge radio catalog (3C) has represented one of the most attractive samples to study the physics of radio-loud active galactic nuclei(AGNs). Originally created using radio observations performed at 159 MHz(Edge et al.1959), and subsequently at 178 MHz (Bennett1962), the
3C catalog went through two main revisions later in the 80s (see, e.g., Laing et al.1983; Spinrad et al.1985).
Since then, a vast suite of observations became available from the radio to optical wavelengths, thus enriching the multifrequency database necessary to carry out broadband analyses. Radio images with arcsecond resolution for almost all 3CR extragalactic sources are already present in the NRAO Very Large Array(VLA) Archive Survey (NVAS)12and in the MERLIN13 archives (see, e.g., Giovannini et al. 2005). At
higher frequencies, Spitzer (see, e.g., Werner et al. 2012; Dicken et al.2014), in particular for high-redshift sources (see
also Haas et al.2008; Leipski et al.2010), and Hubble Space
Telescope observations cover more than 90% of the 3CR
extragalactic catalog (see e.g., Madrid et al. 2006; Privon et al. 2008; Tremblay et al. 2009; Hilbert et al. 2016). In
addition, near-infrared observations are also available for a significant fraction of the 3CR objects (see, e.g., Baldi et al. 2010). Recently, the Herschel Space Observatory also
observed several 3CR sources, mostly focusing on the higher-redshift ones, (see e.g., Podigachoski et al. 2015; Westhues et al. 2016). Moreover, a dedicated spectroscopic campaign
was carried out with the Telescopio Nazionale Galileo to provide a detailed optical classification and to study their nuclear emission (Buttiglione et al. 2009, 2011). All these
observations make the extragalactic 3CR catalog an ideal sample to investigate AGN nuclear properties, extended radio structures, such as jet knots, hotspots and lobes, and/or their large-scale environments (see e.g., Ineson et al. 2013; Chiaberge et al.2015).
However, although most of the 3CR extragalactic radio sources were observed thanks to extensive X-ray campaigns carried out with Chandra, XMM-Newton, and Swift(see ,e.g., Hardcastle & Worrall2000; Harvanek et al.2001; Evans et al.
2006; Hardcastle et al.2006; Balmaverde et al.2012; Wilkes et al.2013; Maselli et al.2016, and references therein), until Cycle 9 the Chandra archive covered only up to∼60% of the 3CR extragalactic sample(see, e.g., Massaro et al.2015, for a recent review), while the others, such as XMM-Newton, covered less than one-third of the entire catalog. Thus, we
© 2018. The American Astronomical Society. All rights reserved.
11
Dan Harris passed away on 2015 December 6th. His career spanned much of the history of radio and X-ray astronomy. His passion, insight, and contributions will always be remembered. A significant fraction of this work is one of his last efforts.
12http://archive.nrao.edu/nvas/ 13
started our Chandra snapshot survey to ensure that all 3CR extragalactic sources have at least an exploratory X-ray observation, with an angular resolution similar to those at lower energies, available to the astronomical community. Adopting a step-wise strategy, we requested observations in narrow redshift, z, ranges, resulting in modest proposals for each cycle to minimize the impact on the Chandra schedule. To date, all the 3CR sources with z<1 have at least a snapshot observation (i.e., less than 20 ks total exposure time) available in the Chandra archive (Massaro et al. 2010,
2012, 2013) and several of them inspired follow up X-ray
observations on interesting objects(see e.g., Hardcastle et al.
2010,2012; Dasadia et al.2016, to name a few examples). Here, we present the analysis of the Chandra snapshot observations approved during Cycle 15, including all 3CR radio sources lying between z=0.5 and z=1 that were previously unobserved by Chandra.
The paper is organized as follows. The update of the ongoing Chandra campaign of the 3CR sources is described in Section 2 together with some details on the current sample. A brief overview of the data reduction procedures is given in Section 3, while results are described in Section4. Then, in Section5we present our summary and conclusions. Finally, in the Appendix, we show X-ray images with radio contours overlaid for all the sources in the current sample(AppendixA)
together with the updated summary of the Chandra observa-tions for the entirety of the 3CR extragalactic catalog (AppendixB).
Unless otherwise stated, we adopt cgs units for numerical results and we also assume a flat cosmology with H0= 69.6 km s−1Mpc−1, W =M 0.286, and W =L 0.714 (Bennett et al. 2014). Spectral indices, α, are defined by flux
density, Sn µn-a.
2. State-of-the-art of the 3CR Extragalactic Chandra Snapshot Survey
The revised 3C extragalactic catalog includes 298 sources (Spinrad et al.1985). We have already analyzed and published all
the data collected to date for the Chandra observations carried out in Cycles 9, 12, and 13 for a total of 75 sources (Massaro et al.2010,2012,2013), and an additional 140 objects, listed in
the Chandra archive, were also presented, adopting the same data reduction procedures(Massaro et al.2011,2015). Several subsets
of the 3CR sample have also been observed by other groups
(e.g., Wilkes et al. 2013; Kuraszkiewicz et al. 2017). Table 1
summarizes the references for the Chandra observations of the 3CR extragalactic sources already analyzed and published as part of this compilation.
In our previous archival analyses we excluded seven sources, namely 3CR 66A(e.g., Abdo et al.2011), 3CR 71 (alias NGC
1068; e.g., Brinkman et al.2002), 3CR 84 (alias NGC1275 or
Perseus A; e.g., Fabian et al.2003), 3CR 186 (Siemiginowska
et al. 2010), 3CR 231 (alias M82; e.g., Griffiths et al.2000),
3CR 317(alias Abell 2052; e.g., Blanton et al.2009), and 3CR
348(alias Hercules A; e.g., Nulsen et al.2005), since each of
these source has accumulated an exposure time of greater than 80 ks, and has been discussed extensively in the literature. In addition, we also did not re-analyze: 3CR 236, 3CR 326, 3CR 386, since the PI of these observations is currently carrying out the analysis(M. Birkinshaw 2017, private communication).
The Chandra archive now includes all the 3CR extragalactic sources up to z=0.5 (i.e., 150 sources), with the only exceptions being those objects for which spectroscopic observations, performed after the last revision(Spinrad et al. 1985), reported
different redshift estimates, namely: 3CR 27, at z=0.184, 3CR 69 at z=0.458 (Hiltner & Roeser 2009), and 3CR 93 at
z=0.357, as confirmed by Ho & Minjin (2009). The present
analysis extends the Chandradatabase up to z=1.0, including 22 more targets. During these Cycle 15 3CR snapshot observations, we also observed 3CR 142.1 and 3CR 277, for which the redshift reported in the literature(Hewitt & Burbidge1991) updates the
earlier estimates from Spinrad et al. (1985). These two sources,
together with 3CR 93, belong to the sample of 22 targets analyzed in the present work. Chandra snapshot observations of 3CR 27 and 3CR 69 were proposed and obtained in subsequent observing cycles(Stuardi et al.2017).
Of the 298 3CR extragalactic sources, 25 are still unidentified, lacking the optical counterpart and/or an optical spectroscopic observation necessary to unveil their nature. We recently observed 21 of these 25 targets with Swift snapshot observations, discovering X-ray counterparts for 11 of them, but even using optical data available thanks to the instruments on board the Swift satellite, we could not discern and/or confirm their extragalactic nature(see Maselli et al.2016for all details).
A summary table on the state-of-the-art of the Chandra observations for all the 3CR extragalactic sources, including detections of extended components: jet knots, hotspots, lobes, and
The AO9 sample includes 3CR 346, which was re-observed in Cycle 12 because during Cycle 9 its Chandra observation was affected by high background(see Massaro et al.2010, for details).
bThe redshift ranges for both the archival and the XJET samples are unbounded w.r.t. selection(see alsohttps://hea-www.harvard.edu/XJET/for more details on the database).
X-ray emission from the hot intergalactic medium present in galaxy groups/clusters, is reported in AppendixB.
3. Data Reduction and Data Analysis
Data reduction and analysis procedures adopted for all the Chandra observations presented here were extensively described in our previous papers, thus only a brief overview is reported in the following. We adopted the same procedures, since ourfinal aim is to create a uniform database for the entire 3CR extragalactic survey once all the sources listed therein will be observed by Chandra.
We followed the standard procedure described in the Chandra Interactive Analysis of Observations (CIAO) threads14 to perform our data reduction, and we used CIAO v4.7 with the Chandra Calibration Database(CALDB) version 4.6.2. The log of Chandra observations is reported in Table2.
3.1. X-Ray Photometry
We initially generated level two event files using the
acis process events_ _ task and filtering for grades 0,2,3,4,6. We checked the absence of high background intervals,
inspecting the light curves extracted for each data set, but this never occurred. We aligned the X-ray position of each core with that of the radio to perform the astrometric registration (see, e.g., Massaro et al. 2011, for details). The source 3CR 292 has been observed twice with Chandra (obsID 16065 and obsID 17488, with exposure times of ∼4 ks and∼8 ks, respectively). In this case, a merged event file was created using the CIAO routine REPROJECT_OBS, thus reprojecting event files to the reference coordinates of the deeper observation(i.e., obsID 17488).
Then we created flux maps in the X-ray energy ranges, 0.5–1 keV (soft), 1–2 keV (medium), 2–7 keV (hard), taking into account exposure time and effective area. In our procedure, as previously done, we used monochromatic exposure maps set to the nominal energies of 0.75, 1.4, and 4 keV for the soft, medium, and hard bands, respectively. Allflux maps were converted from units of counts s−1cm−2to cgs units by multiplying each event by the nominal energy of each band. However, we made the necessary correction to recover the observed erg cm−2s−1, when performing X-ray photometry (see, e.g., Massaro et al. 2009a,
2009b, for details).
We measured observedfluxes for all the X-ray detected nuclei and extended components. This was done by choosing a region of size and shape appropriate to the observed X-ray emission and
Table 2
Source List of the Chandra AO15 Snapshot Survey
3CR Class R.A.(J2000) Decl.(J2000) z kpc scale DL NH mv S178 Chandra Obs. Date
name (hh mm ss) (dd mm ss) (kpc/arcsec) (Mpc) cm−2 Jy Obs. ID yyyy mm dd
34 FR II—HERG 01 10 18.542 +31 47 19.51 0.69 7.191 4236.3 5.50e20 21 11.9 16046 2014 Sep 25
41 FR II—HERG 01 26 44.325 +33 13 10.96 0.794 7.586 5035.7 5.09e20 21 10.6 16047 2014 Sep 03
44 QSO 01 31 21.647 +06 23 43.14 0.66 7.058 4011.6 3.18e20 22 7.9 16048 2014 Jun 14
54 FR II—HERG 01 55 30.258 +43 45 59.06 0.8274 7.693 5298.7 7.80e20 22 8.8 16049 2014 Jun 15
55 FR II—HERG 01 57 10.539 +28 51 39.70 0.735 7.374 4578.4 5.38e20 22 21.5 16050 2014 Jun 15
93 QSO 03 43 29.996 +04 57 48.60 0.358 5.059 1924.5 1.15e21 18.1 9.9 16051 2014 Oct 10
107 FR II—HERG 04 12 22.620 −00 59 32.69 0.785 7.555 4965.3 8.42e20 22 10.8 16052 2014 Sep 02
114 FR II—LERG 04 20 22.243 +17 53 56.97 0.815 7.654 5200.7 1.61e21 22 6.5 16053 2014 Sep 02
142.1 FR II 05 31 29.334 +06 30 26.90 0.4061 5.476 2233 1.79e21 21 19.4 16054 2014 Aug 16
154 QSO 06 13 50.139 +26 04 36.64 0.580 6.654 3426.3 3.47e21 18.0 23.1 16055 2014 Aug 13
169.1 FR II—HERG 06 51 14.816 +45 09 28.56 0.633 6.930 3811.7 9.30e20 20.5 7.3 16056 2014 Aug 16
217 FR II—HERG 09 08 50.6 +37 48 19 0.898 7.892 5863.9 1.68e20 22 11.3 16057 2014 Jun 13
225B FR II—HERG 09 42 15.396 +13 45 50.49 0.582 6.665 3440.7 3.45e20 19 21.3 16058 2014 Oct 18
237 FR II-CSS 10 08 00.0 +07 30 16 0.877 7.836 5694.5 1.89e20 21 20.9 16059 2014 Oct 31
247 FR II—HERG 10 58 58.973 +43 01 24.66 0.750 7.430 4693.7 8.79e19 21.5 10.6 16060 2014 Sep 26
272 FR II 12 24 28.5 +42 06 36 0.944 8.003 6238.6 2.23e20 22 8 16061 2015 Mar 01
277 FR II 12 51 43.6 +50 34 25 0.414 5.540 2284.7 1.04e20 20 7.5 16062 2015 Mar 03
277.2 FR II—HERG 12 53 33.330 +15 42 31.18 0.767 7.492 4825.2 1.70e20 21.5 12 16063 2015 Apr 07
288.1 QSO 13 42 13.267 +60 21 42.79 0.9610 8.041 6378.3 1.75e20 18.1 9 16064 2014 Jun 08
292 FR II—HERG 13 50 41.852 +64 29 35.86 0.713 7.287 4410.4 1.66e20 20.7 10.1 16065a 2014 Sep 12
293.1 FR II 13 54 40.519 +16 14 43.14 0.709 7.271 4380.0 1.82e20 21 9.2 16066 2014 Jun 05
323 FR II 15 41 45.594 +60 15 34.03 0.6790 7.143 4153.6 1.49e20 21 8.4 16067 2014 Apr 30
Note.Column(1): the 3CR name. Column (2): the “class” column contains both a radio descriptor (Fanaroff–Riley class I or II), Compact Steep Spectrum (CSS) and the optical spectroscopic designation, LERG,“Low Excitation Radio Galaxy,” HERG, “High Excitation Radio Galaxy,” and QSO for quasars (see also Perryman et al.1984; Hes et al.1996; Grimes et al.2004, for more details). Columns (3)–(4): the celestial positions listed are those of the radio nuclei that we used to register the X-ray images: right ascension and declination(equinox J2000, see Section3for details). We reported here the original 3CR position (Spinrad et al.1985) of the
sources for which the radio core was not clearly detected. Column(5): redshift z. We also verified in the literature (e.g., NED and/or SIMBAD databases) if new z values were reported after the release of the 3CR catalog. Column(6): the angular to linear scale factor in arcseconds. Cosmological parameters used to compute it are reported in Section 1. Column(7): luminosity distance in Mpc. Cosmological parameters used to compute it are reported in Section 1. Column (8): galactic neutral hydrogen column densities NHalong the line of sight(Kalberla et al. 2005). Col. (9): the optical magnitude in the V band taken from the 3CR catalog (Spinrad
et al.1985). Column (10): S178is theflux density at 178 MHz, taken from Spinrad et al. (1985). Column (11): the Chandra observation ID. Column (12): the date
when the Chandra observation was performed. a
For 3CR 292, two Chandra observations are available with obsID 16065 and 17488, the latter performed in 2014 Nov 21,(see Section4for details).
14
matching the radio structure. We also chose two background regions with the same shape and size so as to avoid X-ray emission from other parts of the source. Theflux for each energy band and region was measured using funtools,15 as in our previous analyses. Uncertainties are computed assuming Poisson statistics(i.e., square root of the number of counts) in the source and background regions. X-ray fluxes, not corrected for the Galactic absorption, but measured for the cores, are reported in Table3, while those for detected jet knots, hotspots, and lobes are given in Table 5. The name of each component (e.g., knot or hotspot) is a combination of one letter indicating the orientation of the radio structure and one number indicating distance from the core in arcseconds.
Since the Chandra native pixel size for the ACIS instrument is 0 492, the data are undersampled, thus to recover the resolution we regridded our images to 1/2, 1/4, or 1/8 of the native ACIS pixel size. This was dictated by the angular size of each radio source and by the number of counts in each source component. For sources of large angular extent, 1/2 or no regridding was adopted(see also Massaro et al.2012,2013, for more details).
Finally, we performed a comparison between radio and X-ray images at similar angular resolution to verify if extended structures in radio sources, such as jet knots, hotspots, and lobes, have an X-ray counterpart. To achieve this goal, we used radio images retrieved from publicly available websites such as that
of the National Radio Astronomy Observatory VLA Archive Survey(NVAS),16NASA Extragalactic Database(NED),17and the(DRAGN)18website, as well as the personal websites of our colleagues.19,20 Image parameters for each radio observation used are given in the figure captions of Appendix A. X-ray fluxes for the high-energy counterparts of the radio nuclei are reported in Table3. 142.1 0.61(0.09) 0.57(0.57) 2.24(0.91) 11.19(3.77) 13.99(3.92) 0.08(0.02) 154 0.947(0.006) 41.35(4.59) 241.5(9.31) 923.47(33.73) 1206.32(35.29) 16.95(0.5) 169.1 0.64(0.08) 2.1(0.94) 0.23(0.51) 18.65(4.98) 20.98(5.1) 0.36(0.09) 217 0.91(0.20) 1.42(1.0) 15.01(2.29) 100.01(10.98) 116.44(11.26) 4.78(0.46) 225B 0.48(0.11) 0.68(0.48) 0.12(0.26) 5.18(2.59) 5.98(2.65) 0.08(0.04) 237 0.84(0.05) 4.11(1.45) 7.0(1.53) 13.76(4.01) 24.87(4.53) 0.97(0.18) 247 0.7(0.06) 0.99(0.7) 3.71(1.25) 36.22(6.61) 40.92(6.77) 1.07(0.18) 272 0.41(0.12) 0.0(0.0) 0.46(0.46) 4.85(2.48) 5.31(2.52) 0.25(0.12) 277 0.84(0.06) 0.33(0.33) 2.2(1.0) 26.81(6.0) 29.34(6.09) 0.18(0.04) 277.2 0.43(0.10) 3.15(1.29) 0.21(0.47) 2.26(2.26) 5.63(2.65) 0.16(0.07) 288.1 0.946(0.08) 76.35(5.65) 114.05(6.1) 236.49(16.45) 426.88(18.43) 20.78(0.9) 292 0.86(0.04) 0.9(0.9) 1.8(1.04) 103.58(14.13) 106.29(14.19) 2.47(0.33) 293.1 0.26(0.10) 0.0(0.0) 0.84(0.6) 1.76(1.24) 2.59(1.38) 0.06(0.03) 323 0.18(0.06) 0.0(0.0) 0.9(0.65) 5.03(2.25) 5.93(2.34) 0.12(0.05)
Notes.Column(1): the 3CR name. Column (2): the Ext. Ratio defined as the ratio of the net counts in the r=2″ circle to the net counts in the r=10″ circular region surrounding the core of each 3CR source. The 1σ uncertainties are given in parenthesis. Column (3): measured X-ray flux between 0.5 and 1 keV. Column (4): measured X-rayflux between 1 and 2 keV. Column (5): measured X-ray flux between 2 and 7 keV. Column (6): measured X-ray flux between 0.5 and 7 keV. Column (7): X-ray luminosity in the range 0.5–7 keV with the 1σ uncertainties given in parenthesis.
a
Fluxes are given in units of 10−15erg cm−2s−1and 1σ uncertainties are given in parentheses. The uncertainties on the flux measurements are computed as described in Section3.
b
Sources with count rates above the threshold of 0.1 counts per frame for which the X-rayflux measurement is affected by pileup (see Massaro et al.2013, and references therein for additional details).
Table 4
Results of the X-Ray Spectral Analysis for the Brighter Nuclei
3CR GX NH,int F c2 dof
93 1.78(−0.08, 0.15) <0.06 <0.91 34.91/25
114 2.06(−0.34, 0.36) 7.21(−2.4, 2.54) L 3.91/7
154 1.85(−0.14, 0.18) 0.61(−0.26, 0.28) <0.92 41.52/39
288.1 1.77(−0.08, 0.09) <0.1 L 16.99/19
Note.Column(1): the 3CR name. Column (2): the X-ray photon indexG .X Column(3): the intrinsic absorption at the source redshift. Column (4): the fraction offlux falling into the pileup region. Column (5): thec value divided2 by the degrees of freedom.The quoted statistical uncertainties refer to the 68% confidence level.
15 https://github.com/ericmandel/funtools 16http://archive.nrao.edu/nvas/ 17 http://ned.ipac.caltech.edu/ 18 http://www.jb.man.ac.uk/atlas/ 19http://3crr.extragalactic.info 20 http://www.slac.stanford.edu/~teddy/vla3cr/vla3cr.html
3.2. X-Ray Spectral Analysis
We performed spectral analysis for the X-ray counterparts of radio cores of those sources with more than 400 counts to determine their X-ray spectral indices a , the presence orX absence of significant intrinsic absorption, and the role played by mild pileup in artificially hardening the spectrum.
The spectral data were extracted from a 2″ aperture for photometric measurements, using the CIAO routine
SPECEX-TRACT, thereby automating the creation of count-weighted
response matrices. Background spectra were extracted in nearby circular regions of radius 10″ not containing obvious sources. The source spectra were then filtered in energy between 0.5 and 7 keV and binned to allow a minimum number of 30 counts per bin to ensure the use of the Gaussian statistic. We used the SHERPA21modeling andfitting package to fit our spectra. For each source we adopted two models: (1) a redshifted power law with Galactic and intrinsic photoelectric absorption components, and (2) the same model with an additional pileup component using the
JDPILEUP Chandra CCD pileup model developed by
Davis(2001).
Prior tofitting, the Galactic hydrogen column density and the source redshift werefixed at the measured values for each source. When considering the first (1) fitting model, the two main variable parameters—namely the intrinsic absorption (NH(z)) and X-ray photon index Γ—were allowed to vary in a first pass fit, but subsequently stepped through a range of possible physical values to explore the parameter space, determine 68% confidence intervals, and quantify the degree to which NH(z) and Γ are degenerate.
We have also explored the possible effect of pileup on our sources by adding a JDPILEUP22 component to our baseline model (2). We left the parameters of the JDPILEUP model fixed to their default values, with the exception of ALPHA
(the probability of a good grade when two photons pile together) and F (the fraction of flux falling into the pileup
region). In no case were we able to constrain the value of
ALPHA since it was usually degenerate with F and/or the
intrinsic absorption, so we decided to freeze it to its default value of 1. The value ofFwas left free to vary between 0.85
and 1, and was constrained in two cases. The results of spectralfitting are given in Table4.
4. Results 4.1. General
We detected the X-ray counterpart of all radio cores in our sample and we measured theirfluxes, adopting a circular region of 2″ centered on the radio position used for the astrometric registration. All the results of our X-ray photometry, i.e., nuclear X-rayfluxes in the three different bands (see Section3),
together with their X-ray luminosities, are reported in Table3, while X-ray images for the whole selected sample are presented in Appendix A. In Table 3, we also report the values of the “extended emission” parameter, computed as the ratio of the total number of counts in a circular region of radius r=2″ circle to that of a circle of radius r=10″, both centered on the radio position of each 3CR source (i.e., Ext. Ratio “Extent Ratio”). This ratio is close to unity for unresolved (i.e., point-like) sources, since the on-axis encircled energy for 2″ is ;0.97, and only a small increase is expected up to 10″. Thus, parameter values significantly less than 0.9 indicate the presence of extended emission around the nuclear component (e.g., Massaro et al.2010,2013). In our sample this situation
clearly occurs for 3CR 107, 3CR 293.1, and 3CR 323. Of the 22 sources, 4 of them, namely 3CR 93, 3CR 114, 3CR 154, and 3CR 288.1, show X-ray nuclei with more than 400 counts within a circular region of 2″ radius. Thus, according to our previous works, we performed a basic X-ray spectral analysis for them. Their spectra are consistent with a mildly absorbed power law withabsorption consistent with the Galactic value (Kalberla et al. 2005). 3CR 93 and 3CR 154
show a fraction of pileup of 10%; however, their fits do not improve significantly when including a jdpileup spectral component23. Results of the spectral analysis are reported in Table4, and the quoted statistical uncertainties refer to the 68% confidence level.
We also discovered X-ray emission associated with three hotspots in three different sources; their X-ray fluxes are reported in Table 5 together with detection significances, all above 3σ, computed assuming a Poisson distribution for the
Table 5
X-Ray Emission from Radio Extended Structures(i.e., Knots and Hotspots)
3CR Component Class Counts F0.5–1 keVa F1–2 keVa F2–7 keVa F0.5–7 keVa LX
name (cgs) (cgs) (cgs) (cgs) (1042erg s−1) 41 s11.3 h 6(0.1) 0.56(0.56) 0.55(0.55) 4.7(2.7) 5.8(2.8) 17.5(8.5) 54 s9.3 h 3(0.4) 0.0(0.0) 0.91(0.52) 0.0(0.0) 0.91(0.52) 3.05(1.74) 107 s5.0 l 11(1.5) 0.62(0.62) 1.3(0.8) 3.9(2.3) 5.9(2.5) 17.3(7.2) 154 e33.0 k 8(0.9) 0.0(0.0) <0.24 6.3(2.6) 6.6(2.6) 9.2(3.7) 225B w2.0 h 4(0.1) 0.0(0.0) 0.79(0.58) 0.69(0.69) 1.5(0.9) 2.1(1.3)
Note.Column(1): the 3CR name. Column (2): the component name (e.g., knot or hotspot) is a combination of one letter indicating the orientation of the radio structure and one number indicating the distance from the core in arcseconds. Column(3): the component class: “h”=hotspot, “k”=knot, “l”=lobe. Column (4): the total counts in the photometric circle together with the average of the eight background regions, in parentheses, both for the 0.5 to 7 keV band. Column(5): measured X-rayflux between 0.5 and 1 keV. Column (6): measured X-ray flux between 1 and 2 keV. Column (7): measured X-ray flux between 2 and 7 keV. Column (8): measured X-ray flux between 0.5 and 7 keV. Column (9): X-ray luminosity in the range 0.5 to 7 keV, with the 1σ uncertainties given in parentheses. a
Fluxes are given in units of 10−15ergcm−2s−1and 1σ uncertainties are given in parentheses. The uncertainties on the flux measurements were computed as described in Section3.
21http://cxc.harvard.edu/sherpa 22
background. The X-ray counterpart of a radio knot in the 3CR 154 eastern lobe and the counterpart of the whole southern radio lobe of 3CR 107 were also found (see Table 5 for details).
Of the 22 3CR sources in our sample, 3 lie within an optically known galaxy cluster, namely: 3CR 34, 3CR 44, and 3CR 247 (Spinrad et al. 1985) and to search for possible
X-ray emission due to the hot gas permeating the intergalactic medium around the radio structure, we adopted the following procedure for all our targets. We measured the total number of counts in a circular region with diameter equal to the total extent of the radio source and we subtracted those counts within circular regions of 2″ corresponding to the radio nucleus and/or to background sources lying within the larger circle. Then, assuming a Poisson distribution for the background events, we computed the probability of obtaining the measured value given the expected number of counts in the background.
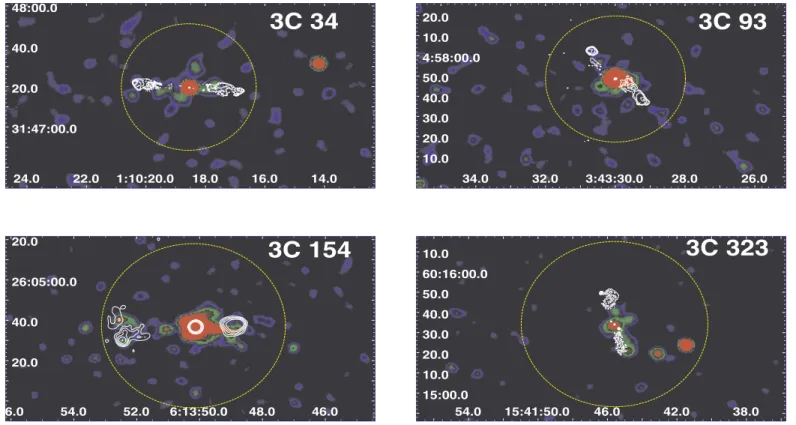
We detected an excess of X-ray photons, above 3σ significance, around the radio structures of 3CR 93, 3CR 154, and 3CR 323, on a scale of a few hundred kiloparsecs as shown in Figure1. Such X-ray extended emission could be due to the presence of hot gasfilling their large-scale X-ray environment (see Figure 1), but it could also be contaminated by the
radiation arising from the lobes of these FR II radio galaxies,
which would be aligned with their large-scale radio structure. These scenarios are indistinguishable due to the low number of counts available, but we tend to favor the former (i.e., the presence of hot gas in the intergalactic medium) since the peaks of the X-ray surface brightness do not appear to be coincident with those of the radio intensity(i.e., hotspots in the lobes). We also found a marginal detection(i.e., 2σ significance) of X-ray emission from the group/cluster around 3CR 34 (see also Figure1). For this source we do not claim that the extended
X-ray emission could be associated with the radio lobes because it lies in a galaxy-rich large-scale environment (McCarthy et al. 1995). Then we also discovered extended
X-ray emission for 3CR 292 on scale of hundred of parsecs(see Figure 2) above 3σ significance. Here, an excess of X-ray
photons is also found to be associated with the northern hotspot/lobe, but it is consistent with a 3σ fluctuation of the X-ray diffuse background (more details are given in the following section). A specific analysis to search for galaxy groups or cluster signatures surrounding the 3CR sources observed during the Chandra snapshot survey is out of the scope of this paper and will be presented in a forthcom-ing work.
Finally, the X-ray images with radio contours overlaid for all the sources in the current sample are shown in AppendixA.
Figure 1. ChandraX-ray images for 3CR 34(top left), 3CR 93 (top right), 3CR 154 (bottom left), and 3CR 323 (bottom right) in the energy range 0.5–7 keV. Eventfiles have not been regridded. Images are all smoothed with a Gaussian function of 8-pixel kernel radius. The five radio contour levels (white) overlaid on the Chandra image were computed starting at 0.2, 0.4, 2, and 0.3 mJy/beam, increasing by a factor of 2, respectively. The radio maps adopted to perform the comparison with the X-ray images are the same used for the registration and shown in AppendixA. A circular region of similar size to the radio structure, centered at the position of the radio cores and having radii of 30″ for 3CR 34 and 3CR 93 and 40″ for 3CR 154 and 3CR 323, respectively, is marked with a dashed yellow line. An excess of X-ray counts, greater than 2σ for 3CR 34 and greater than 3σ for the others, is detected. This could be due to the presence of hot gas filling their large-scale X-ray environments, but it could also be contaminated by the radiation arising from the lobes of these FR II radio galaxies being aligned with their large-scale radio structure.
4.2. Source Details
3CR 34. This is an FR II radio galaxy at z=0.69 and is optically classified as a high-excitation line radio galaxy (HERG; Mullin et al. 2006). It lies near the center of a
compact cluster of galaxies(McCarthy et al.1995), appearing
as one of the reddest members and surrounded by fainter companions. There is a double hotspot in the western lobe. Best et al.(1997) reported the detection of a strong jet-cloud
interaction at 120 kpc from the core and HST images also show a narrow region of blue emission oriented along the radio axis and directed toward a radio hotspot. In the Chandra observation analyzed here we only detected the X-ray core. We tested the presence of diffuse X-ray emission due to the intergalactic medium of the known galaxy cluster where 3C 34 lies according to the procedure previously described. We found an X-ray excess of about 3σ significance (see Figure1)
where the number of counts in an annular region of radii 2″ and 30″, centered on the radio core position, is 90, compared with 45.7 expected background counts in that region. We also estimated the luminosity of the X-ray extended emission, LX, adopting an annular region of inner radius 2″ and outer radius 30″, centered on the position of the 3CR 34 radio nucleus, to exclude the nuclear contribution of the central radio galaxy. Our estimate is LX=(5.2±2.2)×1043erg s−1. We note that this LX estimate, as in the following cases of 3CR 93, 3CR 154, 3CR 292, and 3CR 323, is an upper limit on the X-ray luminosity of the hot gas in the intergalactic medium, since there could be a possible contamination due to the lobe X-ray emission.
3CR 41. This is an FR II radio galaxy with z=0.79, classified as a narrow emission line radio galaxy. In the radio image at 8.45 GHz there is no detection of a jet in the northern lobe, while extended radio emission associated with the jet pointing toward the southeastern hotspot is detected (Mullin et al.2008, see e.g.). Both radio lobes are also visible even at 8.45 GHz. At higher energies, in our Chandra snapshot observations, the southern hotspot is detected, as well as the core of the radio galaxy.
3CR 44. This quasar, with a radio morphology similar to that of an FR II radio galaxy, is at z=0.66 and is associated with a galaxy cluster visible in the optical image(O’Dea et al.2009).
Kharb et al. (2008) reported the hint of a jet-like structure
extending toward the southern hotspot in the 5 GHz radio map, while the HST image shows this radio galaxy to be either composed of two structures oriented north–south, or, more likely, bisected by a dust lane running east–west (McCarthy et al. 1997). We clearly detected the nuclear emission in the
X-rays and we also found an excess of X-ray counts associated with the northern lobe but at<3σ significance.
3CR 54. This is an FR II radio galaxy at redshift z=0.8274. The lobe morphology on the southern side of the source is more extended than the northern one(Kharb et al.2008). In the
HST image, the galaxy has close companions and the source appears extended toward the southwest side, but it is unclear if it is a bridge, a tidal tail, or a jet feature(McCarthy et al.1997).
In the X-ray image the radio core is clearly detected, together with the southern hotspot.
3CR 55. This is an FR II radio galaxy at z=0.735 and is optically classified as a narrow emission line radio galaxy. The radio core is detected in the X-rays, while the two hotspots are not.
3CR 93. This is a z=0.358 quasar with a lobe-dominated radio morphology(see, e.g., Bogers et al.1994). In the optical
image, available in the HST archive, 3CR 93 has a host galaxy with∼3″ diameter (Lehnert et al.1999). In the X-ray image the
core is clearly detected with more than 1000 counts but there is no detection of hotspots. X-ray spectral analysis of the nuclear emission shows a power-law spectrum with absorption consistent with the Galactic column density. Significant extended X-ray emission on a scale of hundreds of kiloparsecs was found around 3CR 93 with a significance above 3σ (see Figure1). The number of counts in an annular region of radii
2″ and 30″, centered on the radio core position, is 114, while those expected for the same region in the background is 45.4. The X-ray luminosity of the extended emission, LX, estimated adopting an annular region of inner radius 2″ and outer radius 30″, centered on the location of 3CR 93, as previously done for 3CR 34, is LX=(2.3±0.5)×1043erg s−1.
3CR 107. This FR II—HERG radio galaxy lies at z=0.785 (McCarthy et al.1997). In our Chandra snapshot observation
we clearly detected the nuclear emission as well as X-ray extended emission associated with the southern lobe (see Figure3and Table5), as also indicated by the low value of the
“ext ratio” in Table3.
3CR 114. This FR II radio galaxy is at z=0.815, showing fairly weak emission lines in its optical spectrum that led to a LERG classification (Strom et al. 1990). A faint compact
nucleus with several clumps within the few arcseconds is observed at radio frequencies and a jet-like feature appears on the northern side in the 1.4 GHz image (Kharb et al. 2008),
while single hotspots are detected both in the southern and in the northern lobes. Strom et al. (1990) claimed that this radio
galaxy could lie in the core of a rich, distant cluster with some signatures of a merger, on the basis of their optical observations. In the X-ray image the nucleus is detected, but there is no evidence of hotspots and no signatures of X-ray emission from the intracluster medium were found.
3CR 142.1. This is a double radio source (i.e., FR II morphology) at z=0.4061. In the radio there are two clear extended radio lobes with a radio bridge showing a constant
Figure 2. ChandraX-ray image for 3CR 292 in the energy range 0.5–7 keV. The merged event file has been created by combining both observations available in the archive (obsID 16065 and obsID 17488, ∼4 ks and ∼8 ks exposure time, respectively). The X-ray image has been smoothed with a Gaussian function of 8-pixel kernel radius. Thefive radio contour levels, black at 1.4 GHz and cyan at 8.5 GHz, overlaid on the Chandra image, were computed starting at 8 mJy/beam and 0.4, increasing by a factor of 2 and 4, respectively. The radio map at 1.4 GHz is not registered because the radio core is undetected.
spectral index (Kharb et al. 2008; O’Dea et al. 2009). In the
X-ray image only the radio nucleus is detected.
3CR 154. This is a nearby lobe-dominated quasar (Bogers et al.1994) at z=0.58 (Sokolovsky et al.2011) appearing as a
point-like source in the HST optical image. In the Chandra snapshot observation, only the relatively bright radio core is detected, for which X-ray spectral analysis was performed. As in 3CR 34 and 3CR 93, 3CR 154 shows extended X-ray emission on a kiloparsec scale, detected above the 5σ level of confidence, measured adopting the same method previously described(see Figure1). We measured 243 X-ray photons in a
annular region of radii 2″ and 40″, centered on the location of the radio core, while 70.1 are expected in the background region. This X-ray extended emission has a luminosity LX=(2.2±0.3)×1044erg s−1, measured using an annular region of inner radius 2″ and outer radius 40″, centered on the location of radio nucleus of 3CR 154. In the eastern lobe we found an association between the peak of the radio and the X-ray intensities for a radio knot lying at 33″ from the nucleus (see marked region in Figure4). Given this spatial coincidence,
this excess of X-ray photons is probably due to the high-energy counterpart of the radio extended structure. On the other hand, the southern knot in the same eastern lobe does not show a correspondence between the radio and the X-ray emissions (∼1 5 offset), indicating that this high-energy emission could be linked to the hot gas in the intergalactic medium.
3CR 169.1. This classical FR II radio galaxy is at z=0.633. There is no detection of the jet and/or of the hotspots in the radio map at 8 GHz (Kharb et al. 2008). Harvanek &
Hardcastle (1998) classified this source as a narrow emission
line radio galaxy according to its optical spectrum. In the X-ray
snapshot image the nucleus is detected but there is no detection of the extended radio structure.
3CR 217. This is an FR II radio galaxy with narrow emission lines at z=0.898. In the radio image at 8 GHz there are no jet signatures, in either the eastern or the western lobes (Mullin et al.2008), and only the western lobe is detected. In the X-ray
band the radio core is detected but the Chandra image is not registered because we were not able to precisely locate its position. Only a single photon is associated with the western hotspot being undetected in the X-rays.
3CR 225B. This is a FR II radio galaxy at z=0.582, optically classified as a narrow emission line galaxy. It only shows hotspots within its radio lobes(Mullin et al. 2008). In
the X-ray there is a hint of diffuse emission near the nucleus but no detection for the two hotspots. We note that the nearby radio source 3CR 225A is also in the field of view of the Chandra snapshot observation on a nearby CCD, but we did not detect any signature of X-ray emission arising from this radio object.
3CR 237. This is the only compact steep spectrum (CSS) radio source in our sample. It shows an FR II radio morphology and is at z=0.877. The radio source size is less than 2″ (i.e., less than ∼15 kpc at z=0.877) and it has a clear X-ray counterpart.
3CR 247. This is an FR II radio galaxy at z=0.75, showing two hotspots on both the eastern and the western sides, optically classified as a narrow emission line radio galaxy. The host galaxy associated with the radio source 3C247 lies in a very crowded field. In the HST optical image it appears as a symmetrical central galaxy with a close companion lying about 0.8 arcsec to the south. Two nearby galaxies also lie within the envelope of the infrared emission (see e.g., Best et al. 1998; Best 2000). Radio spectral aging analysis of this source has
yielded an age of 3–5 million years, corresponding to a hotspot advance velocity of about 0.1c (Liu et al. 1992). In the
Chandra X-ray image the radio core and the northern hotspot are detected.
3CR 272. This is a classical double FR II radio source at z=0.944 showing a relatively faint nuclear component with
Figure 4. ChandraX-ray image for 3CR 154, centered on its eastern lobe, in the energy range 0.5–7 keV. The image has been smoothed with a Gaussian function of 8-pixel kernel radius. Radio contour levels, overlaid on the Chandra image, were computed using radio maps at 1.4 and at 8.46 GHz, starting at 1 and 2 mJy/beam and increasing by a factor of 2 and 4, respectively. A circular region of 4″ radius, marked with a red dashed line, was used to measure the X-rayflux of the eastern knot. The southern radio knot, in the eastern lobe, has an offset of 1 7 between the peak of the radio surface brightness and the X-ray one. This second excess of X-ray photons could be due to diffuse hot gas in the large-scale environment.
Figure 3. ChandraX-ray image for 3CR 107, centered on its southern lobe, in the energy range 0.5–7 keV. The image has been smoothed with a Gaussian function of 5-pixel kernel radius. Level radio contours (white) overlaid on the Chandra image were computed starting at 0.2 mJy/beam, increasing by a factor of 2 and drawn using the same 4.9 GHz radio map adopted for the registration. The X-ray flux of the southern lobe was measured using the yellow elliptical region drawn in thefigure. Here there is spatial coincidence between the excess of X-ray photons and the lobe radio structure.
respect to the two hotspots at radio frequencies. Its optical spectrum shows a typical HERG spectrum with high ionization emission lines(Strom et al.1990). There is nothing to report in
the Chandra snapshot image other than the core detection. 3CR 277. This is a giant FR II radio galaxy at z=0.414 (Strom et al.1990), optically classified as a low excitation type
radio galaxy (i.e., LERG). At 1.4 GHz, the core and a jet-like structure are detected in the eastern lobe. Both radio lobes show double hotspots in high-resolution radio images (see, e.g., Harvanek & Hardcastle 1998). According to McCarthy et al.
(1997) the source reveals a basic double morphology, with the
nuclear component slightly offset from the geometrical center. In the X-ray image the radio core is detected, while neither double hotspot has an X-ray counterpart.
3C 277.2. This FR II radio galaxy at z=0.767 is optically classified as a narrow-line emission galaxy. It has a clear jet-like component in the southern lobe that is closer to the radio core but no signatures in the X-rays.
3CR 288.1. This is a lobe-dominated QSO lying at z=0.961 with a clear point-like optical counterpart (Gendre & Wall 2008). In the X-ray image the nucleus is clearly
detected and given the high number of photons with respect to the majority of the other targets, we also performed its spectral analysis, finding its X-ray spectrum to be consistent with an absorbed power law (see Table 4). Extended emission on a
kiloparsec scale seems to be present around the core (see Table 3), but no evidence of a galaxy cluster or a group of
galaxies is present in the optical images.
3CR 292. This is narrow-line FR II radio galaxy at redshift 0.713. Mullin et al. (2006) reported the detection of the two
hotspots and the core in the radio map at 8.45 GHz but apart from the core, none of these features are detected in the X-rays. Adopting the same procedure as in previous cases, we found that 3CR 292 shows extended X-ray emission(more than 3σ detection significance) detected on a kiloparsec scale and potentially due to the presence of hot gas in the intergalactic medium (see Figure 1). The number of X-ray
photons measured in an annular region of radii 2″ and 75″, centered on the radio core position, is 525, while those
expected in the background, for the same area, is 364.3, where both X-ray counts have been measured using the merged eventfile. We estimated an X-ray luminosity for the extended emission of LX=(2.5±0.7)×1044erg s−1, using the same annular region. Belsole et al. (2004) reported the X-ray
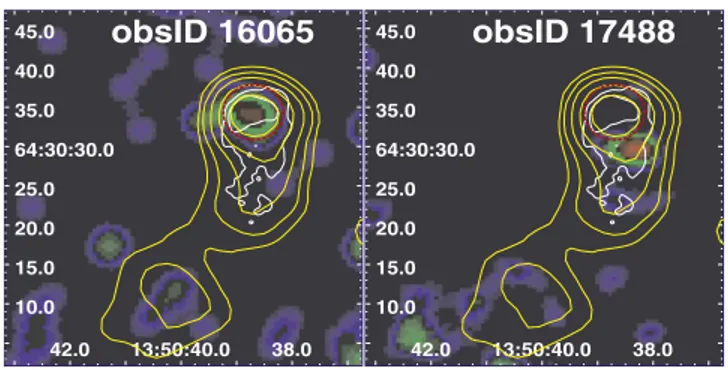
detection of radio lobes in an XMM-Newton observation and as previously stated in the merged event file, we clearly detected an excess of X-ray photons corresponding to the location of the northern hotspot. However, as shown in Figure 5, in a circular region of 3 5 radius, centered on the northern hotspot, we measured 5 X-ray counts in the ∼4 ks Chandra observation (i.e., obsID 16065), but only 1 in the deeper one(i.e., obsID 17488, ∼8 ks exposure time). Then, in the latter observation, the peak of the radio surface brightness is not coincident with the X-ray excess. Since this radio structure lies in a large-scale environment permeated by X-ray emission from the hot intergalactic medium, we measured the level of the X-ray background of the∼4 ks observation within 75″ from the radio core and excluding the nuclear X-ray emission. We found that, over the same area (i.e., circle of 3 5 radius), the expected number of counts is 1.5±1.2 (obsID 16065), thus this X-ray excess is consistent with a 3σ fluctuation of the diffuse X-ray background. A deeper investigation will be necessary to distinguish between X-ray emission associated with the hotspot and that of the intergalactic medium. Variability on a monthly timescale has been excluded because the hotspot size, even if being relatively compact with respect to the lobe structure, covers a region of∼25 kpc.
3CR 293.1. This faint FR II radio galaxy is at z=0.709. Its radio structures, i.e., the nucleus and both hotspots, are barely detected in the radio image available to us at 4.9 GHz and the comparison with the X-ray image indicates that the radio core is detected with possible extended X-ray emission around it (see Table3).
3CR 323. This is a FR II radio galaxy at z=0.679. McCarthy et al. (1997) pointed out that the outer lobes are
irregular and rather different in structure, the northern one undergoing a sharp bend to the east and ending in what may be a hotspot. In the X-ray we only detected the nucleus and there is also significant X-ray extended emission surrounding it both on scales of few a tens and ∼300 kpc (above 5σ significance), potentially due to its intergalactic medium(see Figure1). There
are 329 X-ray photons in an annular region of radii 2″ and 75″, centered on the radio core position, while 269.3 background photons are expected in this region. In this case the number of X-ray counts within a circular region of 2″ positioned on two point-like sources lying on the western side of 3CR 323 were also subtracted from the X-ray photons measured within the annular region. This does not affect the significance of the detection of the X-ray extended emission since only 8 and 20 photons were measured for the 2 nearby objects. We estimated an X-ray luminosity of LX=(4.7±1.6)×1043erg s−1for the extended emission surrounding 3CR 323; this was measured over an annular region of inner radius 2″ and outer radius 21″, centered on the location of its radio core. A lower value of the outer radius for the annular region has been chosen to avoid contamination due to the presence of nearby foreground/ background X-ray point-like sources.
Figure 5. ChandraX-ray images for 3CR 292, centered on its northern lobe, in the energy range 0.5–7 keV. The left image corresponds to the Chandra observation with a shorter exposure time(obsID 16065, ∼4 ks), while the right panel corresponds to the deeper one(obsID 17488 ∼8 ks of exposure time). Both images have been smoothed with a Gaussian function of 8-pixel kernel radius. Thefive radio contours levels, yellow at 1.4 GHz and white at 8.5 GHz, overlaid on the Chandra image, were computed starting at 8 and 0.4 mJy/beam, increasing by a factor of 2 and 4, respectively. An elliptical region, marked with a red dashed line, was used to compute the X-rayflux of the northern lobe and it is also shown.
field of view of a nearby source (i.e., 3CR 255B) observed during these Cycle 15 observations, but its radio core is not detected in the X-rays.
The main aims of the 3CR Chandra snapshot survey are:(i) to search for X-ray emission from jet knots, hotspots, and lobes; (ii) to study the nuclear emission of their host galaxies; and (iii) to investigate their environments at all scales, aiming to discover new galaxy groups/clusters via the X-ray emission of the intergalactic medium.
In the present work, the basic source parameters for the newly acquired Chandra data are presented. We createdflux maps for all the X-ray snapshot observations and compared them with radio images to search for the high-energy counterparts of extended radio structures (i.e., jet knots, hotspots, lobes). We measured their X-ray intensities in three energy ranges, namely the soft, medium, and hard bands, for all radio cores and hotspots detected in the X-rays. Then, for the nuclei brighter than 400 X-ray photons, measured in a circular region of 2″ radius in the 0.5–7 keV energy range, we also performed X-ray spectral analysis showing nuclear spectra that were all consistent with a simple power-law model, with an eventual mild intrinsic absorption in a single case.
We found X-ray emission arising from three hotspots in 3CR 41, 3CR 54, and 3CR 225B. We also report the discovery of extended X-ray emission, on a scale of tens of parsecs, around the radio nuclei of 3CR 107 and 3CR 293.1, with that of the former source being due to the X-ray counterpart of the southern radio lobe. Three sources in our sample are members of optically known galaxy groups/clusters: 3CR 41, 3CR 44, and 3CR 247. In the last two cases we did not detect X-ray emission arising from the intergalactic medium, while a marginal detection(i.e., 2σ) was found for 3CR 34. Moreover, we discovered extended X-ray emission on a scale of few hundreds of kiloparsecs around the radio structures of 3CR 93, 3CR 154, 3CR 292, and 3CR 323, all above 3σ significance. Then, for 3CR 154, we also detected the X-ray counterpart of a knot in the eastern radio lobe at 33″ distance from the nucleus.
Finally, we highlight that a table summarizing the state-of-the-art of the X-ray (i.e., Chandra and XMM-Newton) observations carried out to date is reported at the end of the present manuscript (see Appendix B). Chandra detections are
all based on both our current and previous analysis and represent an update with respect to previous works, while those regarding XMM-Newton, shown here for thefirst time, are only based on a literature search.
We thank the anonymous referee for useful comments that led to improvements in the paper. F. M. is indebted to M. Murgia for useful discussions. Support for this work was provided by the
grants GO1-12125A, GO2-13115X, and GO4-15097X. G.R.T. acknowledges support from the National Aeronautics and Space Administration (NASA) through Einstein Postdoctoral Fellow-ship Award Number PF-150128, issued by the Chandra X-ray Observatory Center, which is operated by the Smithsonian Astrophysical Observatory for and on behalf of NASA under contract NAS8-03060. This work was also supported by contributions of European Union, Valle D’Aosta Region and the Italian Minister for Work and Welfare. This work was partially supported by the Smithsonian Astrophysical Observatory. The National Radio Astronomy Observatory is operated by Associated Universities, Inc., under contract with the National Science Foundation. This research has made use of data obtained from the High-Energy Astrophysics Science Archive Research Center (HEASARC) provided by NASA’s Goddard Space Flight Center; the SIMBAD database operated at CDS, Strasbourg, France; the NASA/IPAC Extragalactic Database (NED) operated by the Jet Propulsion Laboratory, California Institute of Technology, under contract with the National Aeronautics and Space Administration. We used TOPCAT27 (Taylor2005) for the preparation and manipulation of the tabular
data and the images. SAOImage DS9 were used extensively in this work for the preparation and manipulation of the images. SAOImage DS9 was developed by the Smithsonian Astrophysical Observatory.
Facilities: VLA, MERLIN, CXO(ACIS).
Appendix A Images of the Sources
For all the 3CR sources in our sample, radio morphologies are shown here as contours superposed on the regridded/ smoothed X-ray eventfiles (see Figures6–27). The full width
half maximum(FWHM) of the Gaussian smoothing function and the binning factor are reported in the figure captions. X-ray event files were limited to the 0.5–7 keV band and rebinned to change the pixel size with a binning factor “f ” (e.g., f=1/4 produces pixels 4 times smaller than the native ACIS pixel of 0 492). The labels on the color bar for each X-ray map are in units of counts/pixel. We included in each caption also the radio brightness of the lowest contour, the factor (usually 2 or 4) by which each subsequent contour exceeds the previous one, the frequency of the radio map, and the FWHM of the clean beam. Figures appear so different from each other mainly because of the wide range in angular size of the radio sources.
24 http://archive.nrao.edu/nvas/ 25 http://ned.ipac.caltech.edu/ 26http://www.jb.man.ac.uk/atlas/ 27 http://www.star.bris.ac.uk/∼mbt/topcat/
Figure 7.X-ray image of 3CR 41 for the energy band 0.5–7 keV. The event file has been regridded to 1/8 of the native pixel size (i.e., 0 492). The image has been smoothed with a Gaussian of FWHM=7″. The radio contours (black) were computed using a 8.5 GHz radio map and start at 0.125 mJy/ beam, increasing by factors of four.
Figure 8.X-ray image of 3CR 44 for the energy band 0.5–7 keV. The event file has been regridded to 1/8 of the native pixel size (i.e., 0 492). The image has been smoothed with a Gaussian of FWHM=5″. The radio contours (black) were computed using a 8.4 GHz radio map and start at 0.25 mJy/beam, increasing by factors of four. The radio core is weak but is detected in our 8.4 GHz radio image; thus, the Chandra image is registered.
Figure 6.X-ray image of 3CR 34 for the energy band 0.5–7 keV. The event file has been regridded to 1/8 of the native pixel size (i.e., 0 492). The image has been smoothed with a Gaussian of FWHM=7″. The radio contours (black) were computed using a 4.9 GHz radio map and start at 0.125 mJy/beam, increasing by factors of four.
Figure 9.X-ray image of 3CR 54 for the energy band 0.5–7 keV. The event file has been regridded to 1/8 of the native pixel size (i.e., 0 492). The image has been smoothed with a Gaussian of FWHM=7″. The radio contours (black) were computed using a 8.4 GHz radio map and start at 0.25 mJy/beam, increasing by factors of four.
Figure 10.X-ray image of 3CR 55 for the energy band 0.5–7 keV. The event file has been regridded to 1/4 of the native pixel size (i.e., 0 492). The image has been smoothed with a Gaussian of FWHM=5″. The radio contours (black) were computed using a 4.8 GHz radio map and start at 0.125 mJy/beam, increasing by factors of four.
Figure 11.X-ray image of 3CR 93 for the energy band 0.5–7 keV. The event file has been regridded to 1/8 of the native pixel size (i.e., 0 492). The image has been smoothed with a Gaussian of FWHM=7″. The radio contours (black) were computed using a 8.5 GHz radio map and start at 0.3 mJy/beam, increasing by factors of four.
Figure 12.X-ray image of 3CR 107 for the energy band 0.5–7 keV. The event file has been regridded to 1/4 of the native pixel size (i.e., 0 492). The image has been smoothed with a Gaussian of FWHM=7″. The radio contours (black) were computed using a 4.9 GHz radio map and start at 0.125 mJy/ beam, increasing by factors of four.
Figure 13.X-ray image of 3CR 114 for the energy band 0.5–7 keV. The event file has been regridded to 1/8 of the native pixel size (i.e., 0 492). The image has been smoothed with a Gaussian of FWHM=7″. The radio contours (black) were computed using a 4.9 GHz radio map and start at 1.0 mJy/beam, increasing by factors of four.
Figure 14.X-ray image of 3CR 142.1 for the energy band 0.5–7 keV. The eventfile has been regridded to 1/4 of the native pixel size (i.e., 0 492). The image has been smoothed with a Gaussian of FWHM=7″. The radio contours (black) were computed using a 8.5 GHz radio map and start at 0.4 mJy/beam, increasing by factors of four.
Figure 15. X-ray image of 3CR 154 for the energy band 0.5–7 keV. The event file has been regridded to 1/4 of the native pixel size (i.e., 0 492). The image has been smoothed with a Gaussian of FWHM=5″. The radio contours (black) were computed using a 8.5 GHz radio map and start at 1 mJy/beam, increasing by factors of four.
Figure 16.X-ray image of 3CR 169.1 for the energy band 0.5–7 keV. The event file has been regridded to 1/4 of the native pixel size (i.e., 0 492). The image has been smoothed with a Gaussian of FWHM=7″. The radio contours (black) were computed using a 8.4 GHz radio map and start at 0.25 mJy/beam, increasing by factors of four.
Figure 17. X-ray image of 3CR 217 for the energy band 0.5–7 keV. The event file has been regridded to 1/8 of the native pixel size (i.e., 0 492). The image has been smoothed with a Gaussian of FWHM=5″. The radio contours (black) were computed using a 8.5 GHz radio map and start at 0.3 mJy/beam, increasing by factors of four. Since there is only a marginal detection of the radio nucleus, the X-ray image has not been registered.
Figure 18.X-ray image of 3CR 255B for the energy band 0.5–7 keV. The event file has been regridded to 1/8 of the native pixel size (i.e., 0 492). The image has been smoothed with a Gaussian of FWHM=7″. The radio contours (black) were computed using a 8.4 GHz radio map and start at 0.3 mJy/beam, increasing by factors of four.
Figure 19.X-ray image of 3CR 44 for the energy band 0.5–7 keV. The event file has been regridded to 1/8 of the native pixel size (i.e., 0 492). The image has been smoothed with a Gaussian of FWHM=7″. The radio contours (black) were computed using a 14.9 GHz radio map and start at 4.8 mJy/beam, increasing by factors of four. Given the small source size, the X-ray image has not been registered.
Figure 20.X-ray image of 3CR 247 for the energy band 0.5–7 keV. The event file has been regridded to 1/4 of the native pixel size (i.e., 0 492). The image has been smoothed with a Gaussian of FWHM=7″. The radio contours (black) were computed using a 4.9 GHz radio map and start at 1.2 mJy/beam, increasing by factors of four.
Figure 21.X-ray image of 3CR 272 for the energy band 0.5–7 keV. The event file has been regridded to 1/4 of the native pixel size (i.e., 0 492). The image has been smoothed with a Gaussian of FWHM=2″. The radio contours (black) were computed using a 4.86 GHz radio map and start at 0.8 mJy/beam up to 0.08 Jy/beam. Since there is only a marginal detection of the radio nucleus, the X-ray image has not been registered.
Figure 22.X-ray image of 3CR 277 for the energy band 0.5–7 keV. The event file has been regridded to 1/2 of the native pixel size (i.e., 0 492). The image has been smoothed with a Gaussian of FWHM=2″. The six radio contours (black) were computed using a 1.4 GHz radio map and start at 2 mJy/beam up to 0.08 Jy/beam (linear scale).
Figure 23.X-ray image of 3CR 277.2 for the energy band 0.5–7 keV. The event file has been regridded to 1/4 of the native pixel size (i.e., 0 492). The image has been smoothed with a Gaussian of FWHM=2″. The eight radio contours (black) were computed using a 1.4 GHz radio map and start at 0.2 mJy/beam up to 0.2 Jy/beam. Since there is only a marginal detection of the radio nucleus, the X-ray image has not been registered.
Figure 24.X-ray image of 3CR 288.1 for the energy band 0.5–7 keV. The event file has been regridded to 1/8 of the native pixel size (i.e., 0 492). The image has been smoothed with a Gaussian of FWHM=5″. The radio contours (black) were computed using a 8.4 GHz radio map and start at 2.0 mJy/beam, increasing by factors of four.
Figure 25.X-ray image of 3CR 292 for the energy band 0.5–7 keV (obsID 17488). The event file has been regridded to 1/4 of the native pixel size (i.e., 0 492). The image has been smoothed with a Gaussian of FWHM=5″. The radio contours(black) were computed using a 8.5 GHz radio map and start at 0.3 mJy/beam, increasing by factors of four.
Figure 26.X-ray image of 3CR 292 for the energy band 0.5–7 keV. The event file has been regridded to 1/4 of the native pixel size (i.e., 0 492). The image has been smoothed with a Gaussian of FWHM=5″. The radio contours (black) were computed using a 4.9 GHz radio map and start at 0.15 mJy/beam, increasing by factors of two.
Appendix B
The Status of theChandra X-Ray 3CR Observations Here, we present the current status of the Chandra and XMM-Newton observations for the entire 3CR catalog (see Table6).
While Chandra X-ray observations have been uniformly re-analyzed, as reported in our previous investigations, all the XMM-Newton information provided here is based on a literature search(see e.g., Croston et al.2005; Belsole et al.2007; Croston et al. 2008; Laskar et al. 2010; Shelton et al. 2011; Ineson et al. 2013; Mannering et al. 2013; Ineson et al. 2017, and references therein for more details).
For all 3CR sources, we report their classification using the following labeling: radio galaxies (RG), according to the Fanaroff & Riley criterion (Fanaroff & Riley 1974); quasars
(i.e., QSRs); Seyfert galaxies (Sy), and BL Lac objects (BL). We also indicate as “UNID” those sources which, lacking
optical spectroscopy, remain unidentified. We include a column reporting the radio morphology for the radio galaxies (FR I versus FR II types) and indicating those objects that also show the radio structure of:(i) CSS or X-shaped (XS) radio sources or(ii) have been classified in the literature as wide-angle tailed or narrow-angle tailed radio galaxies (WAT and NAT, resepctively). We also devoted a column to the optical classification of radio galaxies, distinguishing them as HERG or LERG. The most updated value of the redshift z is also reported and we used a “cluster flag” to label sources that belong to a known galaxy group/cluster. We considered sources belonging to a galaxy-rich large-scale environment those for which there is a known optical group/cluster reported in the literature and/or those for which there is an archival X-ray observation confirming the presence of hot gas in the intergalactic medium.
Figure 27.X-ray image of 3CR 292 for the energy band 0.5–7 keV. The event file has been regridded to 1/4 of the native pixel size (i.e., 0 492). The image has been smoothed with a Gaussian of FWHM=7″. The radio contours (black) were computed using a 8.4 GHz radio map and start at 0.25 mJy/beam, increasing by factors of four.
16.0 0.405 RG FRII HERG L e;h;l L c-x
17.0 0.219685 QSO L L L k L c
18.0 0.188 RG FRII L L e L c
19.0 0.482 RG FRII LERG yes h;igm L c-x
20.0 0.174 RG FRII HERG L L L c-x
21.1 ? UNID L L L L L x
22.0 0.936 RG FRII L L L L c
27.0 0.184 RG FRII HERG L L L c
28.0 0.19544 RG FRI LERG yes igm igm c-x
29.0 0.045031 RG FRI LERG yes k;igm L c
31.0 0.017005 RG FRI LERG yes k igm c-x
33.0 0.0597 RG FRII HERG yes h:l l;igm c-x
33.1 0.181 RG FRII HERG L L L c
33.2 ? UNID L L L L L x
34.0 0.69 RG FRII HERG yes igm L c
35.0 0.067013 RG FRII LERG yes e;l l;igm c-x
36.0 1.301 RG FRII HERG L L L c
40.0 0.018 RG FRI-WAT LERG yes igm igm c-x
41.0 0.795 RG FRII HERG L h L c
42.0 0.39598 RG FRII HERG L L L c-x
43.0 1.459 QSO CSS L L L L c
44.0 0.66 QSO L L yes L L c
46.0 0.4373 RG FRII HERG yes L igm c-x
47.0 0.425 QSO LDQ L L h;l L c
48.0 0.367 QSO CSS L L L L c
49.0 0.23568 RG FRII-CSS HERG L L L c
52.0 0.29 RG FRII-XS HERG yes h L c
54.0 0.8274 RG FRII HERG L h L c
55.0 0.7348 RG FRII HERG L L L c-x
61.1 0.18781 RG FRII HERG L h L c-x
63.0 0.175 RG FRII HERG L L L c
65.0 1.176 RG FRII HERG L e;h L c-x
66.0A ? BLL BL L yes L L c-x
66.0B 0.021258 RG FRI-XS LERG yes k igm c-x
67.0 0.3102 RG FRII-CSS L L L L c-x
68.1 1.238 QSO L L L L L c
68.2 1.575 RG FRII HERG L e;h L c
69.0 0.458 RG FRII HERG L L L c
71.0 0.003793 SEY L Sy2 L L L c-x
75.0 0.023153 RG FRI-WAT LERG yes igm igm c-x
76.1 0.032489 RG FRI LERG yes igm igm c-x
78.0 0.028653 RG FRI LERG L k L c
79.0 0.2559 RG FRII HERG yes L igm c-x
83.1 0.025137 RG FRI-NAT LERG yes k;igm igm c-x
84.0 0.017559 RG FRI LERG yes igm igm c-x
86.0 ? UNID L L L L L
88.0 0.030221 RG FRI LERG yes k;igm igm c-x
89.0 0.13981 RG FRI-WAT LERG yes igm L c
91.0 ? UNID L L L L L
93.0 0.35712 QSO L L L e L c
93.1 0.243 RG FRII-CSS HERG yes L L c
98.0 0.030454 RG FRII-XS HERG L l l c-x
99.0 0.426 SEY L Sy2 L L L c
103.0 0.33 RG FRII L L L L c
Table 6 (Continued)
3CR z Class Radio Optical Cluster Chandra XMM-Newton X-ray
Name Morph. Class Flag Detections Detections Obs.
107.0 0.785 RG FRII HERG L l L c
109.0 0.3056 RG FRII HERG L h;l L c-x
111.0 0.0485 RG FRII L L k;h L c-x
114.0 0.815 RG FRII LERG L L L c
119.0 1.023 QSO CSS L L L L c
123.0 0.2177 RG FRII LERG yes h;igm L c
124.0 1.083 RG FRII HERG L e L c
125.0 ? UNID L L L L L
129.0 0.0208 RG FRI-NAT L yes k;igm igm c-x
129.1 0.0222 RG FRI L yes igm igm c-x
130.0 0.109 RG FRI-WAT L L igm L c
131.0 ? UNID L L L L L
132.0 0.214 RG FRII LERG yes L L c-x
133.0 0.2775 RG FRII HERG L L L c
134.0 ? UNID L L L L L
135.0 0.12738 RG FRII HERG yes L L c
136.1 0.064 RG FRII-XS HERG L e L c 137.0 ? UNID L L L L L 138.0 0.759 QSO CSS L L L L c 139.2 ? UNID L L L L L 141.0 ? UNID L L L L L 142.1 0.4061 RG FRII L L L L c 147.0 0.545 QSO CSS L L L L c 152.0 ? UNID L L L L L
153.0 0.2769 RG FRII LERG yes L L c-x
154.0 0.58 QSO L L L e;k L c 158.0 ? UNID L L L L L 165.0 0.2957 RG FRII LERG L e L c 166.0 0.2449 RG FRII LERG L L L c 169.1 0.633 RG FRII HERG L L L c 171.0 0.2384 RG FRII HERG L e L c-x 172.0 0.5191 RG FRII HERG L L L c 173.0 1.035 QSO CSS HERG L L L c
173.1 0.2921 RG FRII LERG yes h;l L c
175.0 0.77 QSO L L L L L c
175.1 0.92 RG FRII HERG L L L c
180.0 0.22 RG FRII HERG L L L c
181.0 1.382 QSO L L L h L c
184.0 0.994 RG FRII HERG yes l igm c-x
184.1 0.1182 RG FRII HERG yes L L c
186.0 1.06551 QSO CSS L yes igm L c
187.0 0.465 RG FRII LERG L e;l L c
190.0 0.24639 QSO CSS L L L L c
191.0 1.96810 QSO L L L k;l L c
192.0 0.05968 RG FRII-XS HERG yes l igm c-x
194.0 1.184 RG FRII HERG L L L c
196.0 0.87063 QSO L L L L L c
196.1 0.198 RG FRII LERG yes igm L c
197.1 0.12825 RG FRII HERG yes L L c
198.0 0.08145 RG FRII HERG yes L L c
200.0 0.458 RG FRII LERG yes k;l L c
204.0 1.112 QSO L L L L L c-x
205.0 1.53154 QSO L L L L L c-x
207.0 0.68038 QSO LDQ L yes k;l igm c-x
208.0 1.11151 QSO L L L L L c
208.1 1.02 QSO L L L L L c-x
210.0 1.169 RG FRII HERG yes e;h igm c-x
212.0 1.04931 QSO LDQ L L e;h L c
213.1 0.19405 RG FRI-CSS LERG yes e;h L c
215.0 0.41106 QSO L L yes k;l L c-x
216.0 0.67002 QSO L L L L L c
217.0 0.8975 RG FRII HERG L L L c
225.0B 0.58 RG FRII HERG L h L c
226.0 0.8177 RG FRII L L L L c
227.0 0.086272 RG FRII HERG L h L c
228.0 0.5524 RG FRII HERG L e;h L c
230.0 1.487 RG FRII HERG L L L c 231.0 0.000677 RG FRI LERG L L L c-x 234.0 0.184925 RG FRII HERG L h L c-x 236.0 0.1005 RG FRII LERG L L L c 237.0 0.877 RG FRII-CSS L L L L c 238.0 1.405 RG FRII HERG L L L c 239.0 1.781 RG FRII L L L L x 241.0 1.617 RG FRII L L L L c-x
244.1 0.428 RG FRII HERG yes e L c-x
245.0 1.027872 QSO L L L k L c
247.0 0.7489 RG FRII HERG yes L L c
249.0 1.554 QSO L L L L L x 249.1 0.3115 QSO L L L L L c-x 250.0 ? UNID L L L L L L 252.0 1.1 RG FRII L L L L c 254.0 0.736619 QSO LDQ L L e;h L c 255.0 1.355 QSO L L L L L c 256.0 1.819 RG FRII L L L L c 257.0 2.474 QSO L L L L L x
258.0 0.165 RG FRI-CSS LERG yes L L c
263.0 0.646 QSO LDQ L L h L c
263.1 0.824 RG FRII L L L L c
264.0 0.021718 RG FRI LERG yes k igm c-x
265.0 0.811 RG FRII L L h;l L c
266.0 1.275 RG FRII L L L L c-x
267.0 1.14 RG FRII L L L L c
268.1 0.97 RG FRII L L h L c
268.2 0.362 RG FRII L yes e;h L c-x
268.3 0.37171 RG FRII L L L L c
268.4 1.402200 QSO L L L L L c-x
270.0 0.007378 RG FRI LERG yes k igm c-x
270.1 1.528432 QSO L L L L L c
272.0 0.944 RG FRII L L L L c
272.1 0.003392 RG FRI LERG yes k L c-x
273.0 0.158339 QSO CDQ L L k L c-x
274.0 0.0043 RG FRI LERG yes k;igm igm c-x
274.1 0.422 RG FRII HERG L e l c-x
275.0 0.48 RG FRII LERG yes L L c
275.1 0.5551 QSO LDQ L L k;h;l L c 277.0 0.414 RG FRII L L L L c 277.1 0.31978 QSO L L L L L c 277.2 0.766 RG FRII HERG L L L c-x 277.3 0.085336 RG FRII HERG L L L c 280.0 0.996 RG FRII L yes k;h;l L c-x 280.1 1.667065 QSO L L L l L
284.0 0.239754 RG FRII HERG yes L igm c-x
285.0 0.0794 RG FRII HERG L l L c
286.0 0.849934 QSO L L L L L c
287.0 1.055 QSO L L L L L c-x
287.1 0.2156 RG FRII HERG L h L c
288.0 0.246 RG FRI LERG yes igm L c