1
Alma Mater Studiorum – Università di Bologna
DOTTORATO DI RICERCA IN
Mercati e Intermediari Finanziari
Ciclo XXIV
Settore Concorsuale di afferenza: 13 / B4
ECONOMIA DEGLI INTERMEDIARI FINANZIARI E FINANZA AZIENDALE
Settore scientifico disciplinare SECS – P/11
ECONOMIA DEGLI INTERMEDIARI FINANZIARI
TITOLO TESI
L’IMPATTO DELLA RICERCA E SVILUPPO SUL
VALORE DELLE IMPRESE IN EUROPA
(The impact of R&D on firm value across Europe)
Presentata da: ANDI DUQI
Coordinatore Dottorato
Relatore
GIUSEPPE TORLUCCIO
GIUSEPPE TORLUCCIO
3
Contents
Table Index 5
Abstract 7
1. Introduction 8
2. Considerations about research and development activities at the firm level
12
2.1 Definition and delimitation of R&D activity 12
2.2 The accounting regime of R&D expenditures 13
3. Theoretical background 16
3.1 The impact of R&D on firm market value, the hedonic model 17
3.2 The impact of R&D on firm market value, the accounting based model 19
3.3 The potential mispricing effect of R&D on stock returns 21
3.4 The moderating role of other variables in the market valuation of R&D 28 4. The effect of R&D on firm value; the model, descriptive statistics and eeeempirical results 35 4.1 The residual income model 35 A. The model, research questions and variables 35
B. Sample selection 40 C. Descriptive statistics and empirical results 41
4.2 The accounting based model 52
A. The model, research questions and variables 52
B. Sample selection 54 C. Descriptive statistics and empirical results 55 5. The effect of R&D on stock returns; the model, descriptive statistics and
eeeempirical results 67
4
5.2 Descriptive statistics and preliminary empirical results 71
5.3 R&D and portfolio abnormal returns 76
5.4 R&D expenditures and systematic risk 79
5.5 Overall variability for R&D intensive firms 84
5.6 Robustness checks: Using a measure of R&D stock in cross-section
eeeeeeregressions
86
5.7 Robustness checks: The modulating effect of the industry sector on R&D
eeeeeemispricing
87
Thesis conclusions and final remarks 93
Appendix 94
5
Table Index
Table 1- Descriptive statistics by country, years 2001-2007 44 Table 2 - Pearson correlation coefficients 45 Table 3 - Distribution of firm-year observations per industry and for the period 2001-2007
46
Table 4 - Panel FE estimates of the relationship between FV and independent variables
47
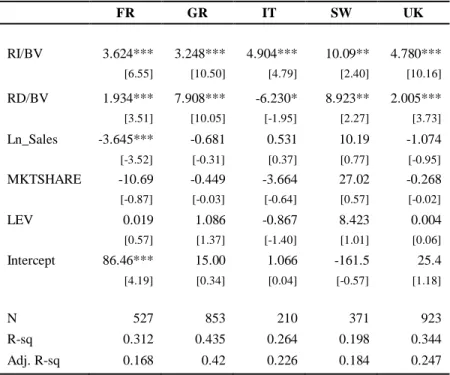
Table 5 - Panel FE estimates for testing the relationship between the dependent variable FV = (MV-BV)/BV and different sets of independent variables
49
Table 6 - Panel FE estimates for testing the relationship between the dependent variable FV = (MV-BV)/BV and independent variables
51
Table 7 - Panel FE estimates of the relationship between and most important independent variables
53
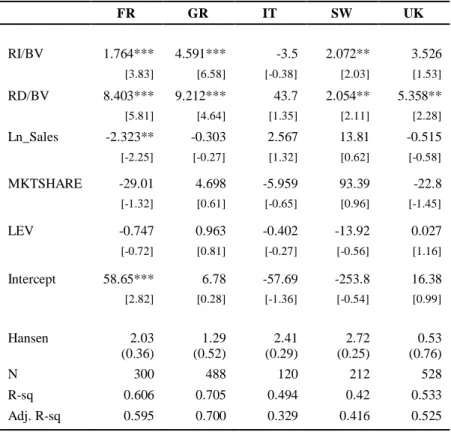
Table 8 - IV-GMM estimates of the relationship between FV and most
important independent variables 54
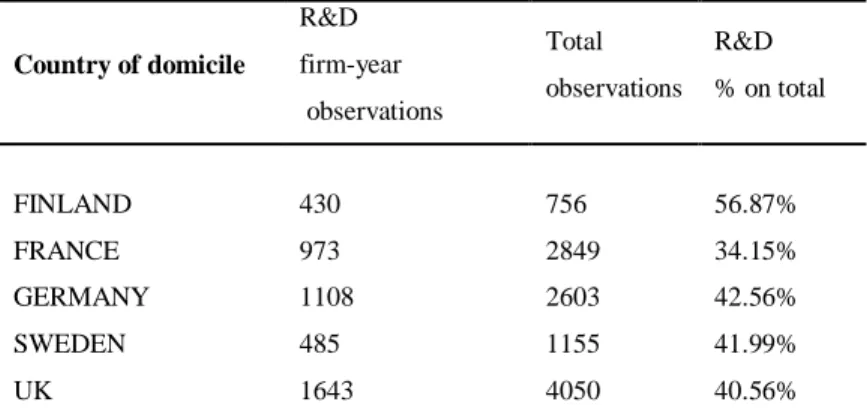
Table 9 - R&D firm-year observation and total firm–year observations per
country over the years 2000-2009 58
Table 10 - Descriptive statistics by country, years 2000-2009 58 Table 11 - Pooled cross section estimates and panel FE estimates for testing the relationship between the dependent variable (MV-BV)/BV and different
independent variables 60
Table 12 - Instrumental variable estimates via 2SLS and GMM methodology for testing the relationship between the dependent variable (MV-BV)/BV and
different independent variables 61
Table 13 - Heckman probit regression for estimating the probability that reported R&D is positive and OLS regression for estimating the impact of R&D on firm value including the effect of the Heckman coefficients
64
Table 14 - OLS estimates of the impact between some firm and country
indicators and the dependent variable (MV-BV)/BV 66
6 Table 16 - Descriptive statistics for firms that performed R&D over the period
1999-2009 compared with non-R&D firms. 74
Table 17 - Mean values of RD/ME, BM and size per industry. 75 Table 18 - Descriptive statistics of RD/ME for the period 1999-2009. 76 Table 19 - Cross-sectional regressions of monthly future stock returns on
RD/ME
77
Table 20 - Excess returns for R&D-sorted portfolios 79 Table 21 – Risk-adjusted returns on portfolios sorted on RD/ME 82 Table 22 - Cross-sectional regressions of monthly future stock volatility on
RD/ME
85
Table 23 - Cross-sectional regressions of monthly future stock returns on the R&D capital to ME ratio
87 Table 24 - Cross-sectional regressions of monthly future stock returns on the
RD/ME ratio per sector based on firm R&D intensity
89
Table 25 - R&D and one year sector excess returns 90
Appendix
Table 1 - Gross domestic expenditure on R&D as a percentage of GDP, 1999 and 2009. Cross-country comparison
96
Table 2 – R&D expenditure by performing sectors as a percentage of GERD (Gross domestic expenditure on R&D), year 2009. Cross-country comparison
97 Table 3 – ICB sector classification. Sector and Subsector breakdown 98 Table 4 – Equity market indexes used in this thesis 103 Table 5 – Risk free rates for testing Fama and French (1993) model 104
7
Abstract
In this thesis the impact of R&D expenditures on firm market value and stock returns is examined. This is performed in a sample of European listed firms for the period 2000-2009. I apply different linear and GMM econometric estimations for testing the impact of R&D on market prices and construct country portfolios based on firms’ R&D expenditure to market capitalization ratio for studying the effect of R&D on stock returns.
The results confirm that more innovative firms have a better market valuation, investors consider R&D as an asset that produces long-term benefits for corporations. The impact of R&D on firm value differs across countries. It is significantly modulated by the financial and legal environment where firms operate. Other firm and industry characteristics seem to play a determinant role when investors value R&D. First, only larger firms with lower financial leverage that operate in highly innovative sectors decide to disclose their R&D investment. Second, the markets assign a premium to small firms, which operate in hi-tech sectors compared to larger enterprises for low-tech industries.
On the other hand, I provide empirical evidence indicating that generally highly R&D-intensive firms may enhance mispricing problems related to firm valuation. As R&D contributes to the estimation of future stock returns, portfolios that comprise high R&D-intensive stocks may earn significant excess returns compared to the less innovative after controlling for size and book-to-market risk. Further, the most innovative firms are generally more risky in terms of stock volatility but not systematically more risky than low-tech firms. Firms that operate in Continental Europe suffer more mispricing compared to Anglo-Saxon peers but the former are less volatile, other things being equal. The sectors where firms operate are determinant even for the impact of R&D on stock returns; this effect is much stronger in hi-tech industries.
8
1. Introduction
The aim of this Ph.D. dissertation is to study the impact of research and development expenditures (hereafter R&D) on stock market value, on the overall and systematic risk of this type of investment and on firm stock returns for a sample of European firms. In the last 30 years this topic has attracted the attention of numerous scholars all over the world.
The benefits of innovation in terms of sales growth, market value increase are drawn by the seminal work of Schumpeter (1934, 1942). He introduced the term “creative destruction” and postulated that the economic change revolves around innovation, entrepreneurial activities and market power and sought to prove that the innovation-originated market power could provide better results than the invisible hand & price competition. Schumpeter argued that technological innovation often creates temporary monopolies, allowing abnormal profits that would soon be competed away by rivals and imitators; these temporary monopolies are necessary to provide the incentive necessary for firms to develop new products and processes (Schumpeter, 1942).
Other studies in the following of the past century posit that knowledge management activities are fundamental for guarantying firm survival in the long term. Firms’ success depends on the availability of specific knowledge which is not possessed and difficult to be accomplished by other competitors (Nelson and Winter, 1982; Sicca, 1998; Sobrero and Torrisi, 2007). Firms’ intangible assets are superior to tangible ones because they contain the necessary requisites (knowledge) in order to have a sustainable advantage in the long term (Gabrielli, 2006). The key role of the intangibles for firms has inspired the knowledge
based theory (Zack, 1999) which identifies in the creation, accumulation and use of
knowledge the main functions of the modern firm (Krogh et al. 2000).
Drawing on these theories there is a large body of research which considers knowledge management inside the firm as a key success factor which creates competitive advantage, and boosts firm performance. Many empirical studies have tried to capture the relation between innovation which is powered by knowledge and growth at a micro or a macro level. Firm growth is influenced or influences a set of other specific performance indicators like firm productivity, firm value and firm earnings.
R&D is the main activity inside the firm which contributes to the creation and preservation of innovation. Hence, it’s the main input indicator that has been used in the
9 literature for testing the link between innovation and growth or innovation and firm performance. If we consider R&D as an input in the innovation creation process inside the firm, then there must be other output indicators that can be related and influenced by it. Prior research has individuated different firm level variables that can assume this role. These can be scientific publications from members of firm R&D department (Oriani, 2004); number of registered patents (Hall et al. 2000), number of citations on the registered patents (Bloom and Van Reenen, 2002); new products or processes, firm productivity or firm economic or financial performance.
Griliches (1981) was one of the first authors that tried to measure the link between R&D as a proxy for innovation and firm performance by introducing a closed form model, the so-called hedonic model. It permitted to capture the value relevance of R&D, which creates intangible capital for the firm and thus positively impacts firm value. After Griliches (1981) several empirical studies have found that investors consider R&D expenditures as value relevant for the firm, which means that, when R&D is disclosed, it is associated with investors’ valuation of the firm and has a significant effect on firm’s stock price or firm performance (Wyatt, 2008). This literature in turn, includes two main strands: one focusing upon the impact of R&D on productivity (Griliches, 1995, Mairesse and Mohen, 1996; Hall, 2009) and the other on market valuation (Cockburn and Griliches 1988; Chauvin and Hirschey, 1993; Hall, 1993b; Sougiannis, 1994; Stark and Thomas, 1998; Toivanen et al. 2002; Conolly and Hirschey, 2005; Pindado et al. 2010).
There is another research mainstream which has emphasized a significant relationship between R&D and expected stock returns (Lev and Sougiannis, 1996; Chan et al. 2001; Chambers et al. 2002; Dedman et al. 2009). This correlation has been attributed to a possible mispricing effect due to the failure of investors to correctly estimate the effects of R&D on the future firm cash flows or secondly, to a different risk-pattern of the investments in R&D compared to tangible assets.
The difficulty in evaluating the present value of R&D investments can be due to different factors. R&D-intensive firms generally have few tangible assets, the future benefits from R&D programs are far from assured and cash flows from these projects are difficult to evaluate (Aboody and Lev, 2000; Chan et al. 2001; Kothari et al. 2002). This may lead to a problem of undervaluation of the net value of these expenditures if long term
10 benefits of R&D are not considered exhaustively, or overpricing, if investors inflate the market value of R&D-intensive firms being too optimistic about firm growth related to R&D activity (Al-Horani et al. 2003; Chiao et al. 2008). Second, under U.S. and International GAAP, R&D costs are completely expensed in the year when they are incurred, unless a clear connection between part of these costs and a hypothetic future product for sale can be demonstrated1. Investors can erroneously produce high multiples of these firms if they fail to correct accounting variables for long term benefits of R&D. They can also be misled by the past performance of stocks assigning excessive preference to past winners which can suffer momentum reversals in the future (Lakonishok et al. 1994; Chan et al. 2001).
The risk-pattern approach draws from the seminal work of Fama and French (1992), which suggest that measures of firm size and book-to-market ratio (BM) are able to capture part of the firm’s risk that the CAPM is not able to explain. Other authors have evidenced in successive research that the overall predictive power of the Fama and French model increases when a R&D variable is added to it (Lev and Sougiannis, 1996). R&D projects may contribute sensibly to firm business risk or systematic risk in a way that may not be totally attributed to size and book-to-market ratio; hence, adjusting realized returns only for the former factors is unlikely to completely control for firm risk (Chambers et al. 2002a).
Recently, several contributions in the literature have tried to assess how the effect of the national financial and legal environment affects the market value of R&D investment. Innovation projects are the main drivers for firm growth, and the way they are financed and valued by investors may depend on the predominance of a direct or indirect intermediation model. The results on this topic are still not conclusive. Bae and Kim (2003) notice that the R&D impact on market value is stronger for a sample of Japanese firms compared to US firms, perhaps due to a “corporate myopia” typical of a market-based country where stock markets value positively short-term earnings compared to a bank-based country like Japan. However, Booth et al. (2006) provide evidence that the link between R&D and market value is stronger when the portion of equity financing in a country exceeds bank loan financing, and usually this happens in market-based intermediation systems.
1
11 The novelties of this study are mainly three: First, there is scarcity of research examining the effect of R&D on firm value for Continental Europe firms. The last two decades have witnessed a sensible growth of the number of firms which invest in R&D expenditures in these countries. Research and development is perceived as a strong value driver by European Institutions, local policy makers and corporations2. In 1995 the EU published the Green Paper on Innovation. It stressed the necessity that institutions in Europe should increment their capacity to invest in research and development. Moreover, the book enhanced the role of innovation for sustainable economic growth in the long term.
In March 2010 the European Commission presented its ten-year strategy by promoting smart and sustainable growth for the Community members, Europe 2020. It followed the
Lisbon Agenda (2000) whose adoption did not yield the desired outcomes. The new agenda
puts innovation in the center of all economic policies for economic growth. All country members have agreed to raise the EU R&D ratio to GDP up to 3% for that year and to increase efforts for promoting R&D by private owned corporations. Actually, OECD statistics show that this ratio is below 2% in EU countries against 2.8% for the US and 3.4% for Japan. Many countries including Italy actually invest less the 1.5% of their GDP in R&D, with a very low incidence of R&D from non-state owned corporations (Table 1 and 2 in the Appendix).
Second, I show in Section 4.1 that there exists a strong connection between R&D, sector R&D intensity, firm size and firm market value. Previous research has generally tested the impact of R&D on market value at the firm level after controlling for firm size and industry dummies (Chauvin and Hirschey, 1993; Booth et al. 2006). I follow a different approach, as I study the effect of industry on the value relevance of R&D by sorting firms in three groups according to their propensity to innovate. This variable is often used in the entrepreneurship literature for dividing industrial sectors in two regimes; the former is guided by creative destruction while the latter by creative accumulation. The first is characterized by technologies with high opportunities, low appropriability and low cumulativeness (Breschi et al. 2000). Industries subjected to this regime tend to have low barriers and new firms dominate the innovation activities of the industry. The other type is
2
Lisbon Strategy (European Union agenda for promoting innovation, “learning economy” and social and environmental renewal in the EU)
12 characterized by creative accumulation technology. The experienced incumbent and larger firms have innovative comparative advantages compared to new entries.
I hypothesize that investors take into consideration the industry sector in a similar pattern when they have to assess the value relevance of innovation activities, which is indirectly related to the industry level of R&D intensity. Moreover, it seems that firm size modulates this relationship because smaller firms are more able to reap benefits from innovation in determinate sectors, while larger firms have more advantages in others. As far as I know, this issue had not been tackled in the previous literature.
Third, to the best of my knowledge, this the first study that examines the impact of R&D on stock returns in European financial markets. I apply different models for testing whether in these countries there is a potential mispricing of R&D and whether this is due to systematic risk not accounted by other empirical models.
The correct valuation of the R&D impact on stock returns across Europe can help investors to designing future investment strategies. It can also give managers and regulators useful insights on the long term benefits of R&D on stock prices and returns, which can be translated in more macroeconomic growth e social allocative efficiency. Moreover, the relationship between innovation and price variability is investigated together with the possibility that excess returns are due to industry sectors.
In order to explore the impact of R&D in market value, in this study I adopt an accounting based model based on Edwards-Bell-Ohlson residual income model (Ohlson, 1989). I extend this model for capturing various firm and country characteristics in order to analyze the relationship between R&D firm expenditures and the market value. The mispricing of R&D investment and the presence of excess returns in more innovative firms are studied by the Fama and French (1992, 1993) risk models which are also used for assessing the importance of R&D in predicting stock volatility.
The results show that R&D is positively related to firm value, although this relationship is modulated by different firm and country factors like firm size, the industrial sector where firms operate and the legal and financial environment of the country of domicile. On the other hand I find that more R&D intensive firms experience generally higher returns in the future, higher variability which indicates that R&D investment is perceived as more risky by investors. However the results are not homogeneous across different countries.
13 The thesis is structured as follows: in Section 2 several issues related to firm R&D activity are explained. In section 3 the theoretical background for the different approaches is evidenced. In sections 4 and 5 the two main methodologies together with sample description and empirical evidence are presented. Conclusions and final remarks follow.
14
2. Considerations about research and development activities at the firm
level
2.1 Definition and delimitation of R&D activity
Many authors have offered definitions and have tried to set some boundaries of R&D activity inside the firms. However, many of these definitions have proved to be questionable and arbitrary. For example, Gambardella (1995) considers R&D as the firm function which is specialized in the generation, development and experimentation of technological innovation. He focuses in the innovation process and assigns this function only to the R&D function inside the firm. However, there also other divisions inside the firm which can innovate and secondly, innovation is not merely technological (Piccaluga, 1996).
Actually, researchers refer to the Frascati Manual for R&D definition. It was published in 1964 e periodically revisited by the OECD. The manual contains recommendations about gathering data on R&D activity in OECD country members. According to this manual, R&D comprises creative work undertaken on a systematic basis in order to increase the stock of knowledge, including knowledge of man, culture and society, and the use of this stock of knowledge to devise new applications. The term R&D covers three activities: basic research, applied research and experimental development. Basic research is experimental or theoretical work which is undertaken primarily to acquire new knowledge of the underlying foundation of the phenomena and observable facts, without any particular application or use in view. Basic research can be further on subdivided in pure basic research and oriented research. The former is carried out for the advancement of knowledge, without seeking long-term economic or social benefits or making any effort to apply the results to practical problems or to transfer the results to sectors responsible for their application. Oriented research is carried out with the expectation that it will produce a broad base of knowledge likely to form the basis of the solution recognized or expected, current or future problems or possibilities.
Applied research is original investigation undertaken in order to acquire new knowledge. It is, however, directed primarily towards a specific practical aim or objective. Applied research is undertaken either to determine possible uses for the findings of basic research or to determine new methods or ways of achieving specific and predetermined
15 objectives. It involves considering the available knowledge and its extension in order to solve particular problems. In the business enterprise sector, the distinction between basic and applied research is often marked by the creation of a new project to explore promising results of a basic research program.
The results of applied research are intended primarily to be valid for a single or limited number of products, operations, methods or systems. Applied research gives operational form to ideas. The knowledge or information derived from it is often patented but may be kept secret.
Experimental development is systematic work, drawing on existing knowledge gained from research and/or practical experience, which is directed to producing new materials, products or devices, to installing new processes, systems and services, or to improving substantially those already produced or installed. R&D covers both formal R&D in R&D units and informal or occasional R&D in other units. In the social sciences, experimental development may be defined as the process of translating knowledge gained through research into operational programs, including demonstration projects undertaken for testing and evaluation purposes.
Although the manual tries to set definite boundaries to different forms of research, it is difficult in practice for firms to correctly delimitate activities comprised in basic research and activities that can be defined as applied research. Small firms encounter difficulties in splitting costs and assigning them to the R&D voice. These can be payroll, overhead costs and costs for materials. These issues can influence the disclosure of R&D expenditures and the correct adoption of the accounting rules to them.
2.2. The accounting regime of R&D expenditures
Current economic literature considers R&D as a long-term investment that may generate benefits over multiple years. Hence, R&D should be treated as investment in plant and long-term equipment, capital expenditures (Lev and Sougiannis, 1999). However, it seems that this is not the rationale for accounting treatment of R&D in the USA, where, from 1974 it has been compulsory to write off all R&D expenses according to GAAP accounting rules, and also to completely disclose them for the benefit of investors. This is
16 due to the fact that regulators have the belief that the benefits deriving from R&D activity are highly uncertain and no bank would accept them as collateral in a borrowing contract like they normally do for tangible assets like plant and equipment (Damodaran, 2009).
In Europe, the situation until 2004 has been somewhat more varied. The accounting rules were differentiated mainly between basic research on the one side and development expenses on the other. The former investments were generally expensed, whereas for development projects capitalization were allowed if certain conditions were met; these basically concerned the possibility that the firm could demonstrate a link between the expenses and a marketable product or service.
Accounting systems in Europe are different from one another and inspired by different social and historical foundations. France and Germany practice code-law and have a “macrouniform, government-driven and tax-dominated” accounting system (legal compliance model), whereas the accounting system in the UK is more “micro, fair, judgmental and commercially driven” (Zhao, 2002). Empirical studies have provided evidence that accounting earnings have higher quality in common-low than code-law countries (Ball et al. 1998).
R&D accounting in Germany is inspired by a desire for prudential accounting, which is related to the importance of banks in the German system. Banks are major stakeholders in almost every big listed corporation. The law does not require the disclosure of R&D, but only “recommends” it. German tax authorities are very reluctant to permit R&D capitalizing even when future benefits could be clearly defined, as they are inspired by a prudential accounting policy.
In Sweden, companies rarely disclosed R&D expenditures before the 1990s. However, under strong pressure from trade unions the situation changed during the last years of the 20th century, when most firms began to disclose their investment in R&D. The accounting rules in Sweden are driven by a strong commitment to taxation policy, so capitalization is strongly discouraged, except under stringent and almost impossible conditions.
In the UK there was no requirement until 1989 for companies to disclose their expenditures in R&D, so many did not. After 1985 a general debate took place concluding with the adoption of the SSAP 13 in 1989. This accounting principle recommended the disclosure of R&D for firms meeting certain size thresholds. Stoneman and Toivanen
17 (2001) provide evidence that the adoption of SSAP 13 produced a large increase in the disclosure of R&D expenditures for all classes of firms. The accounting treatment of R&D requires the complete expensing of basic research and permits capitalization of development expenditure if certain circumstances are met.
Since 2005, all European listed firms have adopted the IAS - IFRS accounting principles for their financial statements, in an effort towards harmonization of accounting treatments across the continent. Under this perspective, there have been few changes for basic research costs, which continue to be totally expensed. Development expenditures can still be capitalized, but now this rule is somewhat more detailed, as the firm should provide proof that this expense creates an intangible asset that will produce specific goods or services available for sale (IAS 38.57). Due to the difficulty of the application of this rule, there is evidence that listed firms completely expense R&D in the year it is incurred (Damodaran, 2009). Disclosure has still not become compulsory (Hall and Oriani, 2006).
18
3. Theoretical background
3.1. The impact of R&D on firm market value, the hedonic model
The hedonic model stems from the seminal works of Griliches (1981) and others. The main advantage of the model is that it doesn’t require for researchers to directly measure the benefit of the investment in R&D in terms of economic performance (earnings growth) or a specific output (firm total productivity). This could be difficult in practice because first, data would not cover a long enough time in order to enable precise measurement of the total effect. Second, occasionally long and uncertain lags between the investment in innovation and its output would mean that a researcher might have to wait a certain amount of time to see the effects in firm productivity (Hall, 2000). Instead, the model relates the valuation placed by the financial markets on a firm’s assets to its R&D expenditure. This relies on the fact that listed companies are considered bundles of assets (tangibles and intangibles), whose values are determined every day by financial investors. In equilibrium, the market valuation of any asset results from the interaction between firms’ demand for investment and the market supply of capital for that specific asset (Hall and Oriani, 2006). The market value can be represented as a linear function of its assets:
= ( , , )
where Ait is the book value of tangible assets, Kit is the replacement value of the firm’s technological knowledge and Iit is the replacement value of the other intangible assets. If we consider assets as purely additive, the market value of the firm can be expressed as a linear function of these assets:
= ( + + )
where qt is the average market valuation coefficient of a firm’s total assets (reflecting the differential risk and monopoly position of the firms in the sample) and sigma are returns to scale (which usually are assumed equal to one). So the hedonic model treats the firm as a good whose characteristics are its tangible and intangible assets. In the log form the previous model can be expressed as:
(1)
19
log ( ) = log + (1 + ⁄ + ⁄ )
The ratio Vit/Ait can be assumed as a proxy for Tobin’s q, the ratio of the market value of tangible assets to their physical value (Hall and Oriani, 2006). This equation permits to value the impact of a euro invested in innovation on the market value of the firm at a certain point in time.
The initial empirical results from adopting this approach were originated from US data. This was due to the fact that US accounting principles from 1974 required a complete expensing and disclosure of R&D investment, so there exists a broad database and highly efficient financial markets that have permitted highly significant inference. The seminal work of Griliches (1981) was followed by other contributions like Pakes (1985) which finds that unexpected changes in R&D are associated with large changes on the market value of the firm. Jaffe (1986) evidences that firms that invest intensively in R&D, experience greater benefits in terms of market value if they operate in sectors which are also R&D intensive. Cockburn and Griliches (1988) show an interaction between effectiveness measures of the innovation appropriability regime and the market valuation of the firm’s R&D share, confirming that it significantly affects the expected returns from the R&D activity. Hall (1993a and 1993b) finds that the effect of R&D on stock market value fell sharply during the decade 1980-1990 due to different factors like the fall of private rate of return to R&D capital, the increase of the depreciation rate of R&D assets, more myopic financial markets which discounted R&D at a much higher rate or the takeover era which took place during the ‘80ies. Chauvin and Hirschey (1993) provide evidence that R&D and advertising have positive and consistent influence on the market value of the firms especially for high-tech firms. Megna and Klock (1993) continue the exploratory analysis of Cockburn and Griliches (1988), looking for complementary information to determine whether the measures of intangible capital contribute significantly to the change in Tobin's q. They focus on the semiconductor segment of the electronics industry and the strategic importance that intangible capital assumes in this area. Their findings, analyzing eleven registered companies in the Compustat database for the period 1972-1990, suggest that intangible capital contributes to the change in Tobin's q,
20 but substantial differences remain in the q ratio in the reference field, as shown by the firm-specific effects. The stock of R&D and the stock of patents have a positive and significant impact.
Outside the US this model has been used for British data because even in the UK from 1989 accounting rules imposed firm to expense R&D in the year it was incurred with few exceptions for development expenditures (Stark and Thomas, 1989). Stoneman and Bosworth (1994) estimate a model very similar to that of Hall (1993b) using a balanced panel of 180 UK companies over the period 1984-1992. The main difference is the omission of advertising expenses and the use of the variables for patents and investment in physical capital. The results suggest that R&D and patents have a positive impact on market value, in general, with R&D affecting it more strongly than patents. Toivanen et al. (2002) realize a cross-section and panel analysis of a set of UK listed companies for the period 1989-1995. The two techniques show a positive and statistically positive coefficient for the R&D expenditure, but it widely varies without a specific trend from year to year, in contrast to what was observed by Hall (1993b) for U.S. firms.
Blundell et al. (1999) examine the relationship between technological innovations, market share and market value of 340 listed companies in the United Kingdom from 1972 to 1982. They find a positive and significant effect of market share on the number of commercialized innovations and patents, although they note that more competition in the industry tends to stimulate innovative activity. In addition, they find that the innovation impact on market value is greater for firms with higher market shares.
Hall and Oriani (2006) adopt the hedonic model for a cross-country comparison of the market valuation of R&D. The results evidence a positive and a robust valuation of R&D by the stock market for the German and French samples although the valuation of the R&D investments in the cross section is substantially greater for UK firms. From the perspective of the financial investors, this means that a currency unit spent in R&D by a company in the United Kingdom has on average an impact whose magnitude is nearly three times bigger than in France and Germany. However the paper evidences how the markets value R&D less than the unity and the trend has been decreasing over time.
21
3.2 The impact of R&D on firm market value, the accounting-based model
The accounting-based model derives from the contributions of Ohlson (1989, 1995) and others. It is based on the classical valuation model which reveals equity price to be the present value of future abnormal earnings (Rees, 1997). According to this model:
, = , + ∑ , / ∏ (1 + , )
Where MVi,t is the market value of firm i at time t, BVi,t is the book value of firm i at time t, RIi,t+τ is the residual income of firm i at time t+τ, ki,t+n is the risk-adjusted cost of capital for firm i at time t+n and E ( . ) is the expectations operator. The main novelty of the model is that the present market value is a function of current book value plus the present value of expected abnormal income (Green at al. 1996). As expectations about residual income are formed at time t, we have:
, ( , , , 1)
i t i t i t i t
RI k BV
Where πi,t is a measure of income (operating earnings after taxes usually). After assuming that future residual incomes can be modeled as declining at a rate δ > 0, we can model them as:
, / (1 + , ) =
1 −
+ ,
This is consistent with competitive markets where the initial advantage which permits in the beginning earning rates superior to the cost of capital k, is eroded at a fixed rate.
The right hand of equation (4) expresses the value in excess of book value of assets in place. Previous research has evidenced that the impact of R&D on market value can be reflected indirectly through earnings (Sougiannis, 1994). Past R&D expenditures have a significant effect in explaining residual income because they influence the tangible investments made by the firm. Only current R&D expenditures influence the present firm market value once we include in the equation the residual income variable. The latter captures the effect of past R&D expenditures that are currently producing benefits for the
(4)
(5)
22 firm via the existing assets. These arguments suggest a modification of the basic residual income model:
, = , + , + , + ,
Usually all variables in the above model are scaled by a size variable like the replacement value of total assets in order to avoid heteroskedasticity problems (Pindado et al. 2010). Other deflators have also been used like sales (Hirschey, 1985), number of shares (Rees 1997), opening market value (Lo and Lys, 2000), closing market value (Stark and Thomas, 1998). Rearranging, the final residual income model would be the following:
( , − , )/ , = , / , + , / , + ,
Further extensions of the model by other researchers have substituted the residual income variable with earnings before exceptional and extraordinary items. Dividends have also been added due to their signaling role (Bhattacharya, 1979). Akbar and Stark (2003) introduce the concept of net shareholders cash flows which comprise net dividends to shareholders and capital contributions from them. So, a new version of the accounting-based model after deflating all variables by closing book value of assets in order to reduce heteroskedasticity would be the following (Hughes, 2008):
( , − , )/ , = , / , + , / , + , / , + , / , + ,
Where Ei,t are earnings of firm i at time t, Di,t are firm dividends for year t, CCi,t are capital contributions from shareholders and stock buybacks.
Previous research has applied these models mainly on UK data. Green et al. (1996) collect data for UK listed firms for years 1990, 1991 and 1992. The results do not show a convincing significance of the R&D variable on firm market value. The R&D coefficient is positive and significant at the 5% level for 1990 and significant at the 10% level for 1991 and 1992. Stark and Thomas (1998) provide stronger evidence; they do not restrict the sample as Green et al. (1996) only to firms which report R&D expense. The results are
(7)
(8)
23 much more positive in favour of the value relevance of R&D expense, with the coefficients on all the annual cross-sections and the pooled data being positive and significant at the 5% level. Furthermore, the actual increases in explanatory power associated with the addition of R&D expense into the firm value equation are sizeable enough to be noticed not merely statistically.
Akbar and Stark (2003) use all non-financial UK firm-year observations for which data is available from 1990 to 2001. Estimates of the R&D loading in pooled cross-section regressions are significant for all deflators (book value, sales, number of shares and opening book value). The empirical results support the hypothesis that the capital markets treat R&D expenditures as a long term investment.
Hughes (2008) uses a sample of UK firms for the period 1990-2005. She finds a significant positive effect of R&D on firm market value after correcting the model for endogeneity problems which are relevant in panel data. Dedman et al. (2009) confirm the previous results with respect to the value relevance of research and development. The coefficients for R&D are positive and significant. They are also robust to the choice of the deflator.
Booth et al. (2006), Pindado et al. (2010), Duqi et al. (2011) and Appolloni et al. (2011) offer some preliminary evidence that R&D can be considered value-relevant even in Continental Europe. They use sample of European firms and modulate the R&D effect by control variables like firm size, firm free cash flows, growth rate of equity and loan markets. The empirical results show that the R&D effect is always positive and strongly significant.
3.3 The potential mispricing effect of R&D on stock returns
Although the aforementioned contributions evidence that R&D is value relevant there are also many studies which report that R&D is often mispriced by investors. They fail to correctly price the benefits of R&D on stocks’ future cash flows causing a share over- or undervaluation.
The mispricing effect can be due to the failure by investors to correctly value the long term benefits of R&D or to their failure to correct their discount rate when valuing these
24 expenditures. The first error mainly is due to accounting rules while the second concerns the non-diversifiable risk pattern of R&D.
Under U.S. and International GAAP, R&D costs are completely expensed in the year when they are incurred, unless a clear connection between part of these costs and a hypothetic future product for sale can be demonstrated. The potential mispricing role of different accounting regimes has been subject of a long debate among researchers. This issue followed the compulsory disclosure and complete expensing of R&D in the US from 1974 and in the UK from 1989. As pointed out before, it is common belief that parts of R&D should be capitalized due to their similarity with long term assets. Following this approach some studies have suggested that financial reporting can be improved in favour of a less conservative policy that requires R&D costs to be capitalized (Lev and Zarowin, 1999). This policy change, it is argued, would make summary accounting measures such as earnings and net assets more comparable across R&D-intensive and non-R&D-intensive firms, and therefore more useful to investors.
Empirical evidence from US and UK firms suggest that capitalizing and amortizing does help in explaining share prices. Aboody and Lev (1998) examine accounting options in the US software industry which permit the capitalization of some costs. They report that these capitalized costs are correlated with equity values conditional on other elements of reported earnings and book values, again suggesting that managers may use their discretion to improve financial reporting. However their results are not conclusive as, they find that only 25% of software development costs are capitalized.
Lev and Sougiannis (1996) report that, after controlling for reported accounting numbers, incremental R&D asset and amortization expense measures constructed from the publicly available history of R&D expenditures are cross-sectionally correlated with observed share prices. Chambers et al. (2002b) find that capitalizing and amortizing R&D costs is capable in principle of producing economically significant financial reporting benefits. Their results also suggest that realizing these benefits will require granting substantial discretion to managers over the choice of costs to be capitalized and the rate at which these costs are expensed. As a result, these benefits will depend on the extent to which managers have incentives to use this discretion opportunistically, and the ability of
25 corporate governance mechanisms and the audit process to place reasonable bounds on such behavior.
Kothari et al. (2002) find that R&D investments generate more uncertain future benefits compared to capital expenditures. The coefficient on current R&D expenditures is about three times that of the coefficient in current capex. Givoly and Shi (2008) observe that capitalization is associated with lower underpricing of the stock on the first day of trading. The authors interpret this as evidence that capitalizers are subject to less uncertainty about the success of their software investments.
Oswald (2008) studies how the choice of capitalizing versus expensing is associated with the value-relevance of book value and earnings for a sample of UK. He adjusts firm accounting earnings to reflect what they would have been if capitalization of development expenditures had been adopted. The results suggest that firms’ exercise of discretion over the accounting treatment of development expenditures are consistent with the notion that firms acted to increase the value relevance of earnings and book value.
Reassuming, many authors have tried to assess if investors consider R&D expenditures as an asset or a simple annual cost. Sougiannis (1994), Lev and Sougiannis (1996), Hall (2000) among others point out that this is the case. The question whether there is mispricing or not due to annual expensing remains an opened question. Chambers et al. (2002b) suggest that permitting more discretion allows managers to give more information to the market thus allowing better allocation efficiency. However, the evidence by now does not permit to say that capitalizers perform better in terms of market share than expensers. Moreover, there is some recent research that evidences how the choice to capitalize or expense is due to the R&D growth rate relative to firm profitability (Lev et al. 2005). They find that companies with a high growth rate of R&D relative to their profitability (typically, early life-cycle companies) report conservatively (expense R&D), while firms with a low R&D growth rate relative to profitability (mature companies) tend to report aggressively (capitalize R&D). The authors find misevaluation evidence which is consistent with well-established behavioral finance findings and, in particular, with the heuristic of representativeness that makes investors view patterns in reported data as representative about future patterns and thus overreact.
26 The risk-pattern approach draws on the seminal work of Fama and French (1992). Their paper aimed to test the validity of the Capital Asset Pricing Model (CAPM) of Sharpe (1964), Lintner (1965) and Black (1972). The authors begin with assessing that this model does not explain stock returns and it contains several contradictions. The first one is the size effect first indicated by Banz (1981). He finds that market equity (ME) adds to the explanation of the cross section of average returns provided by market βs. It seems that returns on small stocks are too high given their β estimates, while returns on large stocks are too low. Bhandari (1988) reports that average returns are related to leverage too, although this source of risk should be captured by market β. Stattman (1980), Rosenberg et al. (1985) and Chan et al. (1991) find that average returns on US and Japanese stocks are positively related to the ratio of a firm’s book value of common equity to its market value. Basu (1983) show that earnings price ratios (E/P) help explain the cross section of average returns on US stock even when size and β are included in the regression.
Drawing from these “anomalies” of the CAPM, Fama and French (1992) build an empirical model for capturing different sources of risk that are not captured by β estimates for years after 1963. They include in this model a proxy for size (Market capitalization,
ME), to-market ratio (BM), earnings to price ratio (E/P) and leverage (Assets to book-value of equity, A/BE). After offering empirical evidence that beta cannot explain stock
returns when stocks are grouped by pre-ranked betas, they show that the new added variables are strongly significant in predicting share returns. So, size negatively impacts stock returns as bigger firms usually are less risky than smaller ones. The book-to-market ratio captures the distress risk of the firm and is strongly related to firm economic fundamentals. High BM firms (a low share price relative to book value of equity) tend to have low and persistent earnings on assets, while low BM firms are associated with high earnings.
After Fama and French (1992), a broad literature is developed which aims to test size and especially the book-to-market ratio as predictors for future returns assuming that if assets are priced rationally, variables like those must proxy for sensitivity to common risk factors in returns. Fama and French (1993) bring forward this approach and identify three main factors that are able to explain the future excess stock returns, i.e., a market factor
27 (β), a size variable (SMB) and a book-to-market variable (HML). Firms with high BM ratios tend to have low and persistent earnings on assets.
The book-to-market effect is also related to value and growth investing strategies. There is evidence that value strategies (based on high BM, low E/P stocks) outperform growth strategies (low BM, high E/P stocks). This is carried out by “contrarian” investors which bet against “naïve” strategies that tend to overreact to good news and bad news. Naïve investors tend to get overly-excited about stocks that have done very well in the past so these glamour stocks get overpriced (De Bondt and Thaler, 1985). Lakonishok et al. (1994) offer more empirical support to this point of view. They use a sample of US firms from 1963 to 1990 and find that value stocks outperform growth stocks due to a persistent overestimation of future earnings of glamour stock by investors relative to value stocks. They do not find any different risk pattern among the two classes of stocks.
Fama and French (1995, 1996) provide an economic foundation to their three factor model. The rationale is that if stocks are priced rationally then size and book-to-market patterns in returns must be explained by the behavior of earnings. They find that high BM firms tend to be distressed and they have low ratios of earnings to book values of equity for at least 11 years around portfolio formation. Low BM stocks instead, are associated to strong and persistent earnings. Again, the authors offer evidence that the “contrarian” model offer by Lakonishok et al. (1994) can be explained by the three factor model (Fama and French 1996).
Following these contributions, a number of subsequent studies examine the effect of the BM ratio on stock prices even outside the US. The results are not univocal. Kothari and Schanken (1997) find a positive link in a time-series pattern between BM and future stock returns. Pontiff and Schall (1998) find that the predictive ability of the book-to-market ratio is related to the ability of book value to forecast future cash flows. They assess that the BM ratio can be a proxy of a discount rate. Same results are evidenced by Clubb and Naffi (2007) for the UK market. However Gregori et al. (2001) provide evidence for the UK that when portfolios are formed in a two-way classification (size and BM) the Fama and French (1993) model does not explain all the variation in cross-section returns.
28 The evidence offered mainly for US and UK data suggests that the CAPM alone cannot explain several anomalies observed in stock returns. Size and book-to-market ratio seem to add strength to predictive models; investing strategies based on underperforming stocks like high BM stocks seem to gain abnormal returns not justified by the classic market model. Inspired by the new risk-approach introduced by Fama and French (1992, 1993) other authors have opened a new point of view based on intangibles and especially R&D. These studies assess that introducing a measure of R&D in the Fama and French model helps in predicting future stock returns. The main reason seems to be that R&D is a new non-diversifiable source of risk and if investors do not consider it properly, stock prices could be under or overvalued. In their seminal paper, Lev and Sougiannis (1996) find that when a measure of R&D stock is included in the Fama and French model, the model’s overall predictive ability of future stock returns greatly increases. The authors give an interesting explanation of this fact in Lev and Sougiannis (1999). It seems that the book-to-market ratio, which is a corner stone in Fama and French (1992, 1993) captures all the firm growth options, and thus it might be substituted by a measure of R&D stock, which is a primary driver of innovation and thus, firm growth. Low BM companies usually are R&D intensive and high BM ones have low R&D investment. The return premium that investors ask is sensibly higher for basic research, which is more risky than development expenditures, indicating a clear compensation for higher risk in R&D projects.
Chan et al. (2001) consider a sample of US firms for the period 1975-1995 and they find no evidence of mispricing for high-R&D firms compared to low-tech ones. Their results do not support a direct link between R&D spending and future stock returns. However when they measure R&D intensity relative to the market value of equity, the most innovative stocks perform significantly better than the less innovative. The authors argue that this performance may be due to the fact that RD/ME highly ranked stocks generally tend to be past losers, whose managers are optimistic about the firm’s future prospects. Financial markets tend to be sluggish in revisiting their past expectations.
The mispricing pattern is defended also by papers which study unexpected changes in R&D investment or new R&D program announcements. Chan et al. (1990) study the stocks’ response to 95 announcements of increased R&D. High-technology firms that announce increases in R&D spending experience positive abnormal returns on average,
29 whereas announcements by low-technology firms are associated with negative abnormal returns. Moreover, in cross-sectional analyses they find that firms with higher R&D intensity than the industry average experience larger stock-price increases only for high-tech industries. Eberhart et al. (2004) examine a sample of US firms in the period 1951-2001, which unexpectedly increase their R&D expenditures by a significant amount. The authors find consistent evidence of a misreaction, as manifested in the significantly positive abnormal stock returns that the sample firms’ shareholders experience following these increases. They also find consistent evidence that sample firms experience significantly positive long-term abnormal operating performance following their R&D increases. These results suggest that R&D increases are beneficial investments, and that the market is slow to recognize the extent of this benefit which is proof of investor under-reaction.
Chambers et al. (2002a) admit that there exists a potential mispricing of R&D expenditures but this occurs because investors fail to correctly value long term benefits of R&D. R&D intensive firms have excess returns that persist over time after controlling for size and BM ratio; these returns have a higher level of variability compared to firms that are not R&D intensive. The investors do not take into consideration the different riskiness of R&D firms.
Outside the US, the correct valuation of R&D has been studied for the UK market by Al-Horani et al. (2003) and Dedman et al. (2009). The former present evidence that the cross-section of UK expected stock returns is positively related to R&D activity, after controlling for size and BM effect. Dedman et al. (2009) extend the work of Al-Horani et al. (2003) studying the three-factor model of Fama and French (1993) in cross-industry portfolios. The effect of the R&D variable has a positive effect on stock returns for 13 out of 20 industrial portfolios, evidencing that it can be a useful factor in pricing assets. They also confirm that investors are not misled by the fact that R&D expenditures are expensed in the year when they are incurred, because they consider R&D as an asset. Moreover, the
RD/ME ratio can subsume the BM ratio as Lev and Sougiannis (1999) predict.
Recently, Ciftci et al. (2011) take into consideration a very large sample of US stocks with positive R&D from 1979 through 1997. They sort firms in two groups according to their R&D industry benchmark intensity, low R&D-intensive and high R&D-intensive
30 firms. First, they find that high R&D firms have lower return variability. This is consistent with the fact that top innovators mitigate the risk of research by diversifying their R&D investments even through joint ventures and alliances (Szwejczewski et al. 2006). Second, high R&D-intensive firms earn excess returns in the short term, whereas low R&D firms do not. In the long term returns of both groups converge, reflecting common business and information risk factors. This indicates a mispricing problem for the top group. In summary, high industry-adjusted R&D intensive firms suffer from undervaluation in the short term, but they can mitigate this pattern if managers decide to disclose sensible information about the long term benefits of R&D projects.
Xu and Zhang (2004) and Nguyen et al. (2010) find no evidence of abnormal returns related to R&D effect for Japanese firms; they find no undervaluation of R&D investments except for the post-bubble period (1993-2000). Chiao and Hung (2005) and Chiao et al. (2008) study the Taiwan stock market; they highlight an evident mispricing of R&D expenditures, which persists for up to three years, especially for firms operating in the electronics sectors.
3.4 The moderating role of other variables in the market valuation of R&D
The market valuation of R&D can be modulated by several firm and country characteristics. For example, prior literature has always assessed the importance of a firm’s size in performing innovation and in the market valuation of R&D investment. This coincides with the Schumpeterian view suggesting that larger firms are more able to perform R&D investment for several reasons (Schumpeter, 1939). R&D projects are risky and larger firms are more able to secure funds for financing these projects because size is related to internally generated cash flows (Schumpeter, 1942). Moreover, larger firms can better diversify their activities and can spread the risk over a large number of R&D projects, they can benefit from greater access to capital markets (Scherer and Harhoff, 2000) or they have the possibility of achieving a long-run competitive advantage due to greater market power (Galbraith, 1952; Arrow, 1962).
More recently, several authors have related the modulating effect of firm size to the impact of R&D on firm value. R&D should be better appreciated by financial markets for
31 larger firms as they can reap benefits from innovation more successfully than SME-s (Toivanen et al. 2002; Connolly and Hirschey, 2005).
There are also contributions in the literature which cast doubts on the Schumpeterian view. They notive that among performers of R&D, the number of innovation outputs such as number of patents or amount of innovation per dollar of R&D decline with firm size (Bound et al. 1984; Pavitt et al. 1987; Acs and Audretsch, 1990, 1991; Van Dijk et al. 1997). A very low rate of hierarchical governance structure and a less bureaucratic environment allow a higher responsiveness to innovative opportunities by small firms and new entrants in the market (Link and Bozeman, 1991).
Firm market share is hypothesized to be another important factor for moderating the effect of R&D on firm value but this relationship remains controversial. Blundell et al. (1999) posit that dominant firms tend to have higher rates of R&D and innovate more. Firms with higher market share tend to commercialize more innovative products, thus benefiting more of the innovation process in terms of a better market valuation. Pindado et al. (2010) confirm these results; the higher the market share of the firm, the more effective the R&D spending and, therefore, the higher the market valuation. The authors justify this with the fact that R&D spending yields some supranormal profits for each dollar sold; hence, the overall benefits will be greater as the market share rises. However Toivanen et al. (2002) for a sample of UK firms find no evidence that firms with higher market share can better internalize the gains from R&D.
The industrial sector is another relevant key variable when we deal with innovation and firm size. Some industries should take advantage of small firm innovation, while others foster innovation activity in large corporations (Ortega-Argilés et al. 2009). Cohen and Klepper (1996) suggest by theoretical and empirical evidence a modulating effect of the sector where firms operate for the R&D – size relationship. They posit that this relation is weaker for industries where innovations are more saleable, more product-driven than process-driven, and where prospects for rapid growth due to innovation are stronger.
Other authors study this phenomenon from the point of view of technological trajectories (Nelson and Winter, 1982; Malerba and Orsenigo, 2000). Technological opportunities and appropriability conditions affect the dynamics of market structure and innovation investment (Levin et al. 1985; Cohen et al. 1990). It is thus plausible that larger
32 firms can better benefit from innovation in sectors with high entry barriers and lower technological opportunities, while smaller firms can succeed in entrepreneurial sectors (Ortega-Argilés et al. 2009). Acs and Audretsch (1991) find that hi-tech firms show no increasing returns to firm size in generating innovative output. They relate their results to the fact that firms operating in these sectors can benefit from small increments to existing knowledge in order to produce innovative output, while low-tech firms should invest in a substantial addition to the existing knowledge.
Another strand of research draws from the seminal work of Himmelberg and Petersen (1994). In this paper, the authors offer empirical evidence that sector innovativeness is crucial even when firms’ financial constraints for investing in R&D are investigated. Small firms operating in hi-tech sectors are more likely to rely mainly on internal finance because they face financial constraints from outside investors. Bond et al. (1999) examine the cash flow sensitivity of investment in fixed capital and R&D for firms located in UK and Germany. They find that cash flow is not significant in explaining the propensity to invest in R&D in both countries. In the UK cash flow does matter more for the investment decisions in fixed capital for non-R&D firms than it does for R&D firms. These results indicate that hi-tech UK firms face a higher wedge between the costs of internal and external finance than German firms. UK firms experience more financial constraints when they have to finance long-term investments in R&D. In the same spirit, other important contributions study this topic for European countries (Bah and Dumontier, 2001; Muller and Zimmerman, 2008; Ughetto, 2008; Torluccio, 2008).
In the literature, there have been few contributions which have connected the impact of R&D on market value with firm sector; these papers have concentrated on non-European data. Chauvin and Hirschey (1993) test R&D value relevance for US firms belonging to three commonly accepted hi-tech sectors and to three low-tech sectors. The results show that R&D coefficients are higher for the former group. Chiao and Hung (2005) find that electronics firms gain abnormal returns, compared to non-electronics firms, in the Taiwan context in the three-year period that follows new R&D announcements.
The results from the contributions listed above show that the industry where firms operate is important when several issues related to firm R&D are investigated, such as the optimal firm size, in order to have the greatest benefits in the sector or financial constraints