Development and Validation of a Self-Administered
Multidimensional Prognostic Index to Predict Negative
Health Outcomes in Community-Dwelling Persons
Alberto Pilotto,1Nicola Veronese,1Katerin Leslie Quispe Guerrero,1Sabrina Zora,1 An L.D. Boone,2 Matteo Puntoni,3 Angela Giorgeschi,1Alberto Cella,1Ines Rey Hidalgo,2 Yves-Marie Pers,4Alberto Ferri,1 Jose Ramon Hevia Fernandez,5and Marta Pisano Gonzalez6on behalf of the EFFICHRONIC Consortium.Abstract
The multidimensional prognostic index (MPI) is a comprehensive geriatric assessment (CGA)-based tool that
ac-curately predicts negative health outcomes in older subjects with different diseases and settings. To calculate the MPI
several validated tools are assessed by health care professionals according to the CGA, whereas self-reported
infor-mation by the patients is not available, but it could be of importance for the early identification of frailty. We aimed to
develop and validate a self-administered MPI (SELFY-MPI) in community-dwelling subjects. For this reason, we
enrolled 167 subjects (mean age
= 67.3, range = 20–88 years, 51% = men). All subjects underwent a CGA-based
assessment to calculate the MPI and the SELFY-MPI. The SELFY-MPI included the assessment of (1) basic and
instrumental activities of daily living, (2) mobility, (3) memory, (4) nutrition, (5) comorbidity, (6) number of
medi-cations, and (7) socioeconomic situation. The Bland–Altman methodology was used to measure the agreement
between MPI and SELFY-MPI. The mean MPI and SELFY-MPI values were 0.147 and 0.145, respectively. The mean
difference was
+0.002 – standard deviation of 0.07. Lower and upper 95% limits of agreement were -0.135 and
+0.139, respectively, with only 5 of 167 (3%) of observations outside the limits. Stratified analysis by age provided
similar results for younger (£65 years old, n = 45) and older subjects (>65 years, n = 122). The analysis of variances in
subjects subdivided according to different year decades showed no differences of agreement according to age. In
conclusion, the SELFY-MPI can be used as a prognostic tool in subjects of different ages.
Keywords:
all-cause mortality, risk factor, multidimensional prognostic index, self-assessment, comprehensive
geriatric assessment, socioeconomic analysis
Introduction
C
urrent geriatric medicine is paying increasing at-tention to the identification of reliable mortality prog-nostic tools to improve clinical decision-making in diagprog-nostics and therapeutics and to tailor appropriate interventions for the older frail patient.1The prognosis of older subjects is strongly related to the presence of multimorbidity and to other factors, includ-ing physical, cognitive, biological, and social issues.2In this context, a comprehensive geriatric assessment (CGA) seems to be capable to effectively explore all these domains and it is currently used to determine the prognosis of frail older persons.3,4Unfortunately, a recent systematic review of the
1
Department of Geriatric Care, Orthogeriatrics and Rehabilitation, EO Galliera Hospital, National Relevance and High Specialization Hospital, Genova, Italy.
2
FICYT Foundation for Applied Scientific Research and Technology in Asturias, Oviedo, Spain.
3
Scientific Coordination Unit, EO Galliera Hospital, Genova, Italy.
4
Clinical Immunology and Osteoarticular Diseases Therapeutic Unit, Rheumatology Department, Lapeyronie University Hospital, Montpellier, France.
5Health Promotion Service, Public Health General Directorate, Principality of Asturias, Spain. 6
SESPA, Health Service of the Principality of Asturias, Oviedo, Spain.
ª Alberto Pilotto et al., 2018; Published by Mary Ann Liebert, Inc. This Open Access article is distributed under the terms of the Creative Commons Attribution Noncommercial License (http://creativecommons.org/licenses/by-nc/4.0/) which permits any noncommercial use, distribution, and reproduction in any medium, provided the original author(s) and the source are cited.
Mary Ann Liebert, Inc. DOI: 10.1089/rej.2018.2103
most common prognostic tools in geriatric medicine iden-tified very few mortality prognostic indices that meet the requirements of accuracy and calibration for their possible use in different settings.5
The multidimensional prognostic index (MPI)6 has been identified as a well-calibrated tool with a good discrimination and accuracy for short- and long-term mortality, both in hospital and community settings.7 The MPI is the only available prognostic tool based on information obtained from a CGA that explores not only health-related aspects, but also functional, cognitive, and nutritional domains, as well as co-habitation status, using standardized and extensively validated rating scales.6Several studies showed that the MPI can predict short- and long-term mortality and other negative health out-comes in subjects with several chronic conditions, including heart failure,4 chronic kidney disease,8 diabetes mellitus,9 gastrointestinal diseases,10 neurological diseases,11 cancer,12 and dementia.13
However, the self-perception of health status is another important aspect to consider. Self-assessment instruments have been validated in different contexts (e.g., self-reported body mass index)14and have been widely used in epidemi-ological research, particularly as screening tools, because of their practicality, range, speed, and low cost.15In this regard, self-perception of frailty allows expanded screening for this syndrome, to have an important tool for the early diagnosis of frailty itself.16Nevertheless, we have limited data on self-reported tools to assess frailty in older people17 and the available ones are mainly based on the criteria proposed by Fried et al., which may identify physical frailty only.18
At the same time, robust evidence exists on the great influence of social determinants on health and the devel-opment of chronic diseases. Many research articles have demonstrated that socioeconomic and cultural differences can produce short- and long-term inequalities in health care and self-care behavior, both essential dimensions for the prevention and management of chronic conditions.19 The MPI, differently from the common tools for assessing frailty in older people, is able to include all these relevant aspects.6 Given this background, the aim of this study was to de-velop a self-administered MPI (SELFY-MPI) for community-dwelling subjects. Moreover, we aimed to validate the SELFY-MPI compared with the standard MPI, that is, cal-culated after a CGA by a health care professional.
Methods
Study design and population
This study is an observational study conducted between December 2017 and April 2018 according to the World Medical Association’s 2008 Declaration of Helsinki, the guidelines for Good Clinical Practice, and the Strengthening the Reporting of Observational Studies in Epidemiology (STROBE) guidelines.20
This research was performed in the context of the ongoing project/joint action ‘‘738127/EFFICHRONIC,’’ which has received funding from the European Union’s Health Pro-gramme (2014–2020).’’ The project EFFICHRONIC aims to provide evidence on the positive return of investment and cost-efficiency of the application of the Chronic Disease Self-Management Programme in five different European countries (France, Italy, Spain, The Netherlands, and United
Kingdom) with a particular focus on the health, medical, social, cultural, and economic factors linked with a higher burden of chronic disorders in Europe (http://effichronic.eu). Inclusion criteria were subjects (1) who attended the outpatient clinics of the Galliera Hospital, (2) without acute and emergency clinical conditions, (3) who are living in community, (4) who are capable to provide an informed consent (as decided by the research evaluating the partici-pant) or have the availability of a proxy for informed con-sent, (5) who are willing to participate in the study, and (6) who have had a complete CGA by a health care professional. The Ethical Committee of the Liguria Region, Genoa, Italy approved this study. Informed consent was given by participants who underwent initial evaluation, and/or their proxies, for their clinical records to be used in this study. All patient records and personal information were anonymized before the statistical analysis.
Multidimensional prognostic index
The MPI was calculated with the information from eight different domains of the CGA as previously reported6:
1. Functional status was evaluated through the Katz’s activities of daily living (ADL) index,21which defines the level of independence in six daily personal care activities (bathing, toileting, feeding, dressing, conti-nence, and transferring in and out of bed or chair). 2. Independence was measured by means of the Lawton’s
instrumental activities of daily living (IADL)22 scale, which assesses independence in eight activities that are more cognitively and physically demanding than the ADL, that is, managing finances, using a telephone, taking medications, shopping, using transportation, preparing meals, doing housework, and washing. 3. Cognitive status was determined through the short
por-table mental status questionnaire,23a 10-item question-naire investigating orientation, memory, attention, calculation, and language.
4. Comorbidity was examined using the cumulative illness rating scale (CIRS),24a five-point ordinal scale (score 1– 5) to estimate the severity of pathology in each of 13 systems, including cardiac, vascular, respiratory, eye-ear-nose-throat, upper and lower gastrointestinal, he-patic, renal, genitourinary, musculoskeletal, skin, ner-vous system, endocrine-metabolic, and psychiatric disorders. Based on the ratings, the comorbidity index (CIRS-CI) score, which reflects the number of con-comitant diseases, was derived from the total number of categories in which moderate or severe levels (grade from 3 to 5) of disease were identified (range from 0 to 13). Comorbidities were descriptively reported using the International Classification of Disease, 10th version.25 5. Nutritional status was investigated with the Mini
Nu-tritional Assessment Short Form (MNA-SF),26which includes information on (i) anthropometric measures (body mass index and weight loss), (ii) neuropsycho-logical problems and recent psychoneuropsycho-logical stress, (iii) mobility, and (iv) decline in food intake.
6. Risk of developing pressure sores was evaluated through the Exton-Smith Scale, a five-item question-naire determining physical and mental condition, ac-tivity, mobility, and incontinence.27
7. Medication use was defined according to the Anatomical Therapeutics Chemical Classification code system (ATC classification) and the number of drugs used by patients was recorded. Patients were defined as being on medi-cation if they were taking any of the drugs included in the ATC classification at the moment of study inclusion. 8. Cohabitation status included living alone, in an
insti-tution, or with family members.
For each domain, a tripartite hierarchy was used,6that is, 0= no problems, 0.5 = minor problems, and 1 = major problems, based on conventional cutoff points derived from literature for the singular items. The sum of the calculated scores from the eight domains was divided by 8 to obtain a final MPI risk score ranging from 0= no risk to 1 = higher risk of mortality. The MPI requires between 15 and 25 minutes for its complete ex-ecution and the results can be automatically obtained through the MPI calculator software downloadable from the www .mpiage.eu website. For this study, the MPI was calculated after a trained health care professional performed a CGA.
Self-administered-MPI
Similarly to the domains of the MPI,6 the SELFY-MPI considered the following domains:
1. Functional status assessed through the Barthel ADL28 scale that includes the ability in feeding, bathing, per-sonal hygiene, dressing, fecal and urinary continence, and toilet use. This scale can be self-administered.29 2. Mobility assessed through the Barthel Mobility28scale
that includes transfer from bed to chair or wheelchair, walking and going up and down the stairs. This scale can be self-administered.29
3. Independence by means of the Lawton’s IADL22scale, as reported earlier. It is also possible to self-administer this scale.30
4. Cognitive status assessed through the self-administered cognitive screening test (test your memory).31 It is a validated 10-task cognitive test exploring several do-mains, including memory, semantic knowledge, and vi-suospatial skills. The score ranges from 0 to 50, higher scores indicating better cognitive function.31
5. Nutritional status investigated with the MNA-SF,26as reported in the previous paragraph. A validated self-administered MNA-SF was used.32
6. Number of medications.
7. Comorbidity: CIRS comorbidity is the number of health problems/diseases that are so severe to require chronic drug therapies in 13 aspects of health.25CIRS can be consequently self-assessed by reporting health prob-lems/diseases that require medications for their treat-ment.
8. Socioeconomic variables were assessed through the self-administered Gijon’s social-familial evaluation scale, with a maximum score of 25 points. Scores be-tween 10 and 14 indicate being at social risk and scores >15, social problems.33The Gijon scale considers
so-cioeconomic variables, exploring (i) household com-position, (ii) the net monthly household income, (iii) housing and personal needs, (iv) social relationships, and (v) social support of the subject.
Similarly to the MPI,6a tripartite hierarchy was used and reported in Table 1. The sum of the calculated scores from the eight domains was divided by 8 to obtain a final SELFY-MPI risk score ranging from 0= no risk to 1 = high risk of mortality. The median (interquartile range [IQR]) time re-quired to complete the SELFY-MPI was 16 minutes (range from 9 to 36 minutes).
Statistical analysis
Main descriptive statistics were absolute and relative (%) frequencies; mean; standard deviation (SD); median; and minimum, maximum, and IQR. Mean differences were tested using the paired sample t-test. Although scatter plots are an excellent way of examining the correlation between two outcomes, it is an insensitive method to assess the agreement between two continuous measures. In this regard, we adopted the Bland–Altman plot (BAP)34 methodology, which provi-des an objective measure (95% limits of agreement) and a visual representation (plot of the difference vs. the mean of the two measures) of the level of agreement between two different measures. To detect possible differences in the level
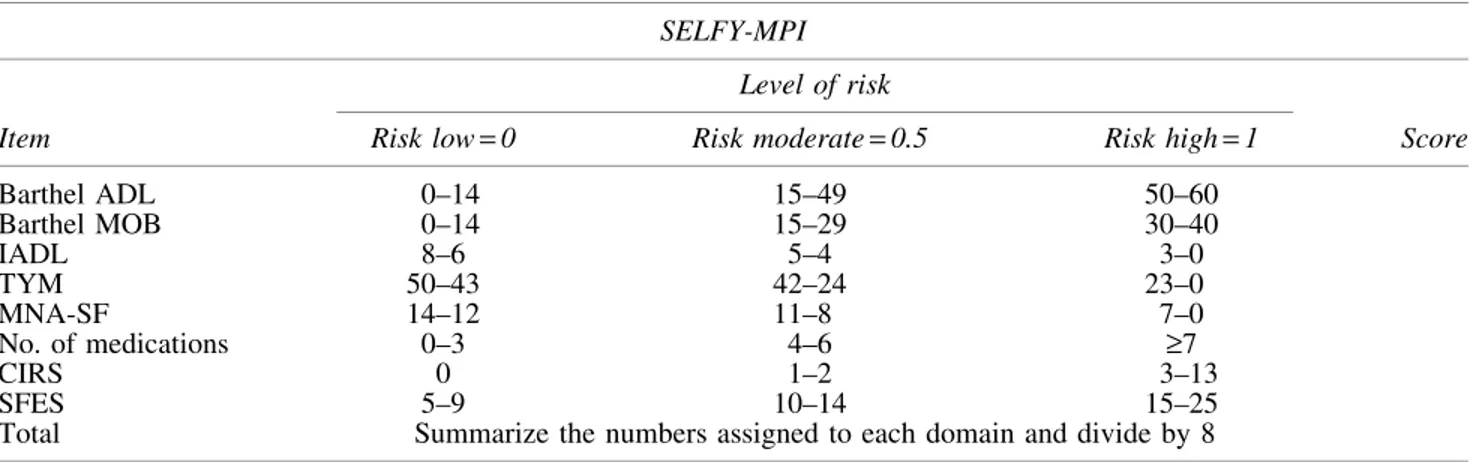
Table1. Domains of the Self-Administered-MPI and Its Scoring SELFY-MPI
Item
Level of risk
Risk low= 0 Risk moderate= 0.5 Risk high= 1 Score
Barthel ADL 0–14 15–49 50–60 Barthel MOB 0–14 15–29 30–40 IADL 8–6 5–4 3–0 TYM 50–43 42–24 23–0 MNA-SF 14–12 11–8 7–0 No. of medications 0–3 4–6 ‡7 CIRS 0 1–2 3–13 SFES 5–9 10–14 15–25
Total Summarize the numbers assigned to each domain and divide by 8
ADL, activities of daily living; CIRS, Cumulative Illness Rating Scale; IADL, instrumental activities of daily living; MNA-SF, Mini Nutritional Assessment Short Form; MOB, mobility; MPI, multidimensional prognostic index; SELFY-MPI, self-administered MPI; SFES, Gijon’s social-familial evaluation scale; TYM: test your memory.
of agreement by age, we performed a BAP analysis stratified by deciles of age.
We reported two-tailed probabilities, and a p-value of 0.05 was adopted to define nominal statistical significance. All analyses were conducted using the software STATA (version 14.2; StataCorp., College Station, TX).
Results
We enrolled 167 subjects with a mean (SD) age of 67.3 (18.8) years (range: 19–88 years) and a slightly higher prevalence of men (50.9%), as reported in Table 2. In this cohort, mean (SD) MPI and SELFY-MPI values were 0.147 (0.112) and 0.145 (0.118), respectively. The mean differ-ence between MPI and SELFY-MPI values was +0.002 (0.07) ( p= 0.70). No significant differences emerged for any test included in the MPI (details not shown, available upon request).
Hypertension was present in 62/167 patients (= 37.1%), cardiovascular diseases in 27 (= 16.1%), and gastroenteric
con-ditions in 21 (= 12.6%) patients. The other conditions (liver, kidney, and genitourinary conditions) were less frequent.
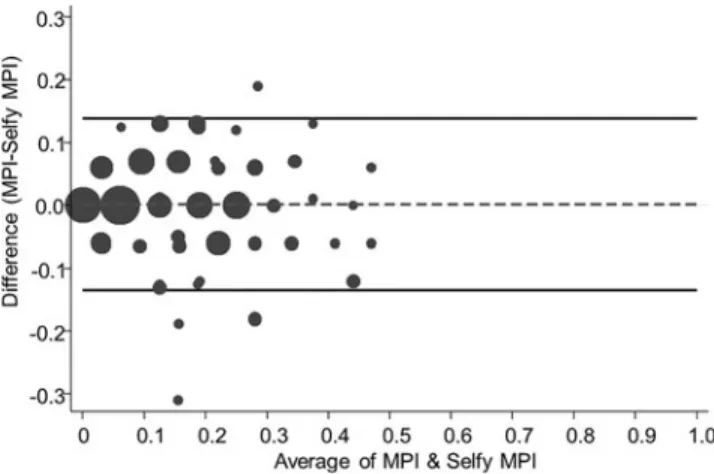
Figure 1 shows the BAPs for the association between the MPI and the SELFY-MPI. Lower and upper 95% limits of agreement were-0.135 and +0.139, respectively, with only 5 of 167 (3.0%) of observations outside the limits.
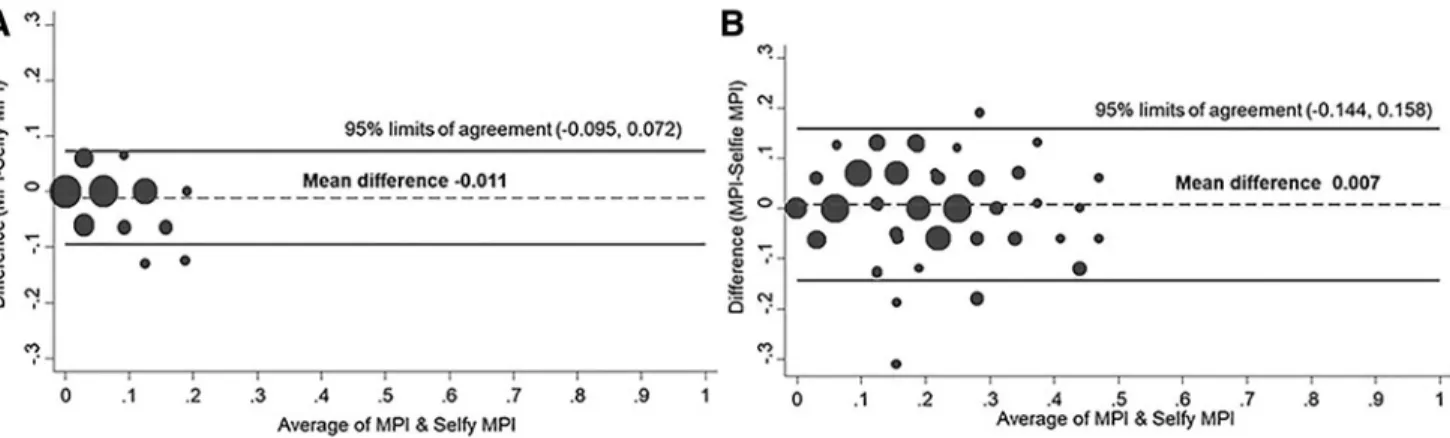
Figure 2 shows the BAPs stratified by age. In 45 subjects aged<66 years, the mean (SD) difference between the MPI and SELFY-MPI values was -0.011 (0.042), with the lower and upper 95% limits of agreement of-0.095 and +0.072. Only 2/ 45 (4.4%) resulted outside of the limits of agreement (Fig. 2A). Similarly, in 122 participants older than 65 years, the mean (SD) difference was 0.007 (0.077) with the lower and upper 95% limits of agreement of-0.144 and +0.158. Five partici-pants (4.1%) were outside the limits of agreement (Fig. 2B).
Finally, as shown in Figure 3, we performed a stratified analysis of agreement among subgroups of patients by dec-iles of age. The line represents the fluctuation of the differ-ence between MPI and SELFY-MPI moving from lower to upper deciles of age; no significant differences between MPI and SELFY-MPI, throughout all the age categories, nor significant interactions or trends with age were detected.
Discussion
In this study, we evaluate a new instrument to assess the MPI through a self-administered tool. The SELFY-MPI showed a strong validity when compared with the standard MPI calculated by a trained health care professional in 167 community-dwelling persons between 19 and 88 years of age. From a methodological point of view, we observed a very small and not clinically significant overestimation (in mean only 0.002 points) between SELFY-MPI and MPI in the sample. In this sense, through the BAPs,34 we showed that the distance between the upper and lower margins is not large enough to be clinically important having, in the sample as a whole, only five persons outside the limits of agree-ment. Finally, the agreement between SELFY-MPI and MPI resulted very similar in people having less or more than 65 years of age, suggesting that our results are not influenced by age, as also further confirmed by the variability around the mean that was constant for the included decades.
The development of prognostic tools that are appropriate for the evaluation of patients with chronic diseases is of great clinical importance, particularly to further consider life ex-pectancy as a relevant factor in weighing the benefits and the burdens of both diagnostic and therapeutic interventions.35–38 In this sense, prognostic indices may result to be important tools to the clinician for the better understanding of appropriate clinical decision-making, in particular in frail and multimorbid adults.2In fact, it is widely known that not to consider prog-nosis in clinical decision-making can lead to poor care.4
The MPI has been developed and validated in a very large cohort of older patients hospitalized for any cause.6Its role was both confirmed in other settings (in institutionalized, community-dwelling subjects, and outpatients) and in pa-tients with different chronic diseases, that is, heart failure, chronic renal failure, diabetes mellitus, liver cirrhosis, de-mentia, and transient ischemic attack.39,40A previous mul-ticenter study involving >2000 hospitalized older patients has reported that the MPI is a more accurate prognostic predictor than three frailty indices commonly used for Table2. Patients’ Characteristics
Age, years Mean (SD) 67.3 (18.8) Median (IQR) 76 (56–79) Min/max 19/88 Gender, n (%) Men 85 (50.9) Women 82 (49.1) MPI Mean (SD) 0.147 (0.112) Median (IQR) 0.13 (0.06–0.19) Min/max 0.0/0.5 SELFY-MPI Mean (SD) 0.145 (0.118) Median (IQR) 0.12 (0.06–0.25) Min/max 0.0/0.5
Difference (MPI)- (SELFY-MPI)
Mean (SD) +0.002 (0.07)
Median (IQR) 0.0 (-0.06–0.06)
Min/max -0.31/0.19
IQR, interquartile range; SD, standard deviation.
FIG. 1. BAP of agreement between MPI and SELFY-MPI. BAP, Bland–Altman plot; MPI, multidimensional prognostic index; SELFY-MPI, self-administered MPI.
mortality in clinical practice.41Finally, the prognostic role of the MPI was also confirmed in older community-dwelling subjects,42suggesting that it can also easily be used in non-hospitalized older people.
However, our work reporting the strong association and validity of the SELFY-MPI compared with the standard MPI adds something more to this important topic. So far, the self-administered tools for assessing frailty and the risk of death described in literature are practically only for screening pur-poses. In a systematic review published in 2012, the authors found a total of 10 instruments screening for frailty in primary health and they concluded that, based on the data available, two instruments are probably suitable, that is, the Tilburg Frailty Indicator and the SHARE Frailty Index.17However, for these two specific instruments, the agreement with a validated scale of frailty was not reported suggesting that more research is needed to confirm the use of these tools in daily clinical practice.17More recently, Morley et al. proposed the fatigue, resistance, ambulation, illnesses, and loss of weight (FRAIL) questionnaire43that is mainly based on the criteria proposed by Fried et al.18 Therefore, as the original score, the FRAIL questionnaire suffers some important shortcomings, including the absence of cognitive status assessment, the fact that it was validated in a specific ethnic minority (i.e., African Americans) and that the scale proposed by Fried et al. investigates frailty only in terms of physical impairment.44Thus, the SELFY-MPI
can add some novel findings in this important topic since, as the MPI, it includes several domains important for frailty such as comorbidity, social aspects, cognition, and functional status. Furthermore, the SELFY-MPI adds a new socioeconomic di-mension to the MPI by means of the Gijon scale. In this way, it can contribute to a holistic approach of patients considering the socioeconomic domain as one of the widely recognized de-terminants of health.
The findings of our study should be interpreted within its limitations. First, the cohort included is relatively small, including 167 participants. Second, the nature of our study is cross-sectional. Even if we found a strong association be-tween SELFY-MPI and MPI, further longitudinal studies are needed to confirm if the SELFY-MPI is able to predict mortality with the same accuracy as the MPI. On the con-trary, among the strengths of our work, we can include the strong validity of this score having only 5 subjects of 167 outside of the limits of agreement and the fact that this tool is extremely quick to do, needing<20 minutes.
In conclusion, the SELFY-MPI can be used as a predic-tive tool having a strong validity when compared with the MPI. These findings were not influenced by age suggesting that this tool can be used indifferently in younger and older people. Future studies are needed to confirm these findings and to verify if the SELFY-MPI has the same accuracy as the MPI in predicting death and other negative outcomes. FIG. 2. BAP of agreement between MPI and SELFY-MPI in people younger (A) and older (B) than 65 years.
Acknowledgment
Funding source: Funding for this study was provided by the project ‘‘EFFICHRONIC 738127,’’ which has re-ceived cofunding from European Union’s Health Pro-gramme (2014–2020). The contents of this article are the sole responsibility of the abovementioned authors and can under no circumstances be regarded as reflecting the po-sition of the European Union. The funding agencies had no role in design or conduct of the study; collection, man-agement, analysis, and interpretation of the data; and preparation, review, or approval of the article. The study was based on administrative data sets, and the participants were not identifiable to the authors.
The members of the EFFICHRONIC Consortium are as follows: Marta Pisano Gonzalez (Health Service of the Principality of Asturias—SESPA, Spain); An L.D. Boone, Ine´s Rey, and Raquel Ochoa Gonzalez (the Foundation for the Promotion in Asturias of applied Scientific Research and Technology—FICYT, Spain); J.R. Hevia Fernandez (Public Health General Directorate, Principality of Asturias— CSPA, Spain); Y.M. Pers, Christian Jorgensen, Valsecchi Verushka, Rosanna Ferreira, Adrien Durand, Cristina Ba-laguer, Ce´line Cardoso, and Manuel Ramos (The University Hospital Center of Montpellier—CHUM, France); Graham Baker, Danni Brown, and Suzanne Lucas (Qismet, Ports-mouth, United Kingdom); S.S. Tan, X. Zhang, P. de Vries, and H. Raat (Erasmus MC University Medical Center, Rot-terdam, The Netherlands); Alberto Pilotto, Sabrina Zora, Al-berto Ferri, AlAl-berto Cella, and Alessandra Argusti (EO Galliera Hospital, Genoa, Italy); Ba´rbara Branchini, and Jorge Garce´s, (University of Valencia, Polibienestar Research Institute— UVEG, Spain).
Author Disclosure Statement
No competing financial interests exist.
References
1. Siontis GC, Tzoulaki I, Ioannidis JP. Predicting death: An empirical evaluation of predictive tools for mortality. Arch Intern Med 2011;171:1721–1726.
2. Gill TM. The central role of prognosis in clinical decision making. JAMA 2012;307:199–200.
3. Pilotto A, Cella A, Pilotto A, et al. Three decades of comprehensive geriatric assessment: Evidence coming from different healthcare settings and specific clinical conditions. J Am Med Dir Assoc 2017;18: 192.e1– 192.e11.
4. Pilotto A, Sancarlo D, Panza F, et al. Multidimensional Prognostic Index based on a comprehensive geriatric as-sessment predicts short-term mortality in older patients with heart failure. Circ Heart Fail 2010;3:191–199. 5. Yourman LC, Lee SJ, Schonberg MA, et al. Prognostic
indices for older adults: A systematic review. JAMA 2012; 307:182–192.
6. Pilotto A, Ferrucci L, Franceschi M, et al. Development and validation of a multidimensional prognostic index for one-year mortality from comprehensive geriatric assess-ment in hospitalized older patients. Rejuvenation Res 2008; 11:151–161.
7. Pilotto A, Gallina P, Fontana A, et al. Development and validation of a multidimensional prognostic index
for mortality based on a standardized multidimensional assessment schedule ( MPI-SVaMA) in community-dwelling older subjects. J Am Med Dir Assoc 2013;14: 287–292.
8. Pilotto A, Sancarlo D, Aucella F, et al. Addition of the multidimensional prognostic index to the estimated glo-merular filtration rate improves prediction of long-term all-cause mortality in older patients with chronic kidney dis-ease. Rejuvenation Res 2012;15:82–88.
9. Maggi S, Noale M, Pilotto A, et al. The METABOLIC Study: Multidimensional assessment of health and functional status in older patients with type 2 diabetes taking oral antidiabetic treatment. Diabetes Metab 2013;39:236–243.
10. Pilotto A, Addante F, D’Onofrio G, et al. The Compre-hensive Geriatric Assessment and the multidimensional approach. A new look at the older patient with gastroen-terological disorders. Best Pract Res Clin Gastroenterol 2009;23:829–837.
11. Sancarlo D, Pilotto A, Panza F, et al. A Multidimensional Prognostic Index (MPI) based on a comprehensive geriatric assessment predicts short- and long-term all-cause mortal-ity in older hospitalized patients with transient ischemic attack. J Neurol 2012;259:670–678.
12. Brunello A, Fontana A, Zafferri V, et al. Development of an oncological-multidimensional prognostic index (Onco-MPI) for mortality prediction in older cancer patients. J Cancer Res Clin Oncol 2016;142:1069–1077.
13. Pilotto A, Polidori MC, Veronese N, et al. Association of antidementia drugs and mortality in community-dwelling frail older patients with dementia: The Role of mortality risk assessment. J Am Med Dir Assoc 2018;19: 162–168.
14. Avila-Funes JA, Gutierrez-Robledo LM, Ponce De Leon Rosales S. Validity of height and weight self-report in Mexican adults: Results from the national health and aging study. J Nutr Health Aging 2004;8:355–361.
15. Barreto Pde S, Greig C, Ferrandez AM. Detecting and ca-tegorizing frailty status in older adults using a self-report screening instrument. Arch Gerontol Geriatr 2012;54:e249– e254.
16. Nunes DP, Duarte YAdO, Santos JLF, Lebra˜o ML. Screening for frailty in older adults using a self-reported instrument. Rev Sau´de Pu´blica 2015;49:2.
17. Pialoux T, Goyard J, Lesourd B. Screening tools for frailty in primary health care: A systematic review. Geriatr Ger-ontol Int 2012;12:189–197.
18. Fried LP, Tangen CM, Walston J, et al. Frailty in older adults: Evidence for a phenotype. J Gerontol A Biol Sci Med Sci 2001;56:M146–M156.
19. Wilkinson RG, Marmot M. Social Determinants of Health: The Solid Facts. Copenhagen, Denmark: World Health Organization, 2003.
20. von Elm E, Altman DG, Egger M, et al. The strengthen-ing the reportstrengthen-ing of observational studies in epidemiology (STROBE) statement: Guidelines for reporting observa-tional studies. J Clin Epidemiol 2008;61:344–349. 21. Katz S, Downs TD, Cash HR, Grotz RC. Progress in
de-velopment of the index of ADL. Gerontologist 1970;10: 20–30.
22. Lawton MP, Brody EM. Assessment of older people: Self-maintaining and instrumental activities of daily living. Gerontologist 1969;9:179–186.
23. Pfeiffer E. A short portable mental status questionnaire (SPMSQ). J Am Geriatr Soc 1975;23:1975.
24. Linn BS, Linn MW, Gurel L. Cumulative illness rating scale. J Am Geriatr Soc 1968;16:622–626.
25. Harris ST, Zeng X, Ross T, Ford L. International classifi-cation of diseases, 10th revision training: What coders are saying. Health Care Manag 2014;33:91–93.
26. Sancarlo D, D’Onofrio G, Franceschi M, et al. Validation of a Modified-Multidimensional Prognostic Index (m-MPI) including the Mini Nutritional Assessment Short-Form (MNA-SF) for the prediction of one-year mortality in hospitalized elderly patients. J Nutr Health Aging 2011;15: 169–173.
27. Bliss MR, McLaren R, Exton-Smith AN. Mattresses for preventing pressure sores in geriatric patients. Mon Bull Minist Health Public Health Lab Serv 1966;25:238–268. 28. Mahoney FI, Barthel DW. Functional evaluation: The
Barthel Index. Md State Med J 1965;14:61–65.
29. Katz PP; for the Association of Rheumatology Health Professionals Outcomes Measures Task Force. Measures of adult general functional status: The Barthel Index, Katz Index of activities of daily living, health assessment ques-tionnaire (HAQ), MACTAR patient preference disability questionnaire, and modified health assessment question-naire (MHAQ). Arthritis Care Res 2003;49(S5):S15–S27. 30. Goeppinger J, Doyle M, Murdock B, et al. Self-administered
function measures: The impossible dream. Arthritis Rheum 1985;28:145.
31. Brown J, Pengas G, Dawson K, et al. Self administered cognitive screening test (TYM) for detection of Alzhei-mer’s disease: Cross sectional study. BMJ 2009;338:b2030. 32. Donini LM, Marrocco W, Marocco C, Lenzi A. Validity of the self- mini nutritional assessment (Self- MNA) for the evalu-ation of nutritional risk. A cross-sectional study conducted in general practice. J Nutr Health Aging 2018;22:44–52. 33. Garcia Gonzalez JV, Diaz Palacios E, Salamea Garcia A,
et al. [An evaluation of the feasibility and validity of a scale of social assessment of the elderly]. Aten Primaria 1999;23: 434–440.
34. Bland JM, Altman DG. Statistical methods for assessing agreement between two methods of clinical measurement. Lancet 1986;1:307–310.
35. Brown AF, Mangione CM, Saliba D, Sarkisian CA. Guide-lines for improving the care of the older person with diabetes mellitus. J Am Geriatr Soc 2003;51(S5):S265–S280. 36. Colon cancer screening (USPSTF recommendation). U.S.
Preventive Services Task Force. J Am Geriatr Soc 2000;48: 333–335.
37. Mottet N, Bellmunt J, Bolla M, et al. EAU-ESTRO-SIOG guidelines on prostate cancer. Part 1: Screening, diagnosis, and local treatment with curative intent. Eur Urol 2017;71: 618–629.
38. Freedman RA, Keating NL, Pace LE, et al. Use of surveil-lance mammography among older breast cancer survivors by life expectancy. J Clin Oncol 2017;35:3123–3130.
39. Pilotto A, Sancarlo D, Daragjati J, Panza F. Perspective: The challenge of clinical decision-making for drug treat-ment in older people. The role of multidimensional as-sessment and prognosis. Front Med 2015;1:61.
40. Pilotto A, Panza F, Ferrucci L. A multidimensional prog-nostic index in common conditions leading to death in older patients. Arch Intern Med 2012;172:594; discussion 594– 595.
41. Pilotto A, Rengo F, Marchionni N, et al. Comparing the prognostic accuracy for all-cause mortality of frailty in-struments: A multicentre 1-year follow-up in hospitalized older patients. PLoS One 2012;7:e29090.
42. Angleman SB, Santoni G, Pilotto A, et al. Multidimensional Prognostic Index in association with future mortality and number of hospital days in a population-based sample of older adults: Results of the EU Funded MPI_AGE Project. PLoS One 2015;10:e0133789.
43. Morley JE, Malmstrom TK, Miller DK. A simple frailty questionnaire (FRAIL) predicts outcomes in middle aged African Americans. J Nutr Health Aging 2012;16:601–608. 44. Theou O, Cann L, Blodgett J, et al. Modifications to the frailty phenotype criteria: Systematic review of the current literature and investigation of 262 frailty phenotypes in the survey of health, ageing, and retirement in Europe. Ageing Res Rev 2015;21:78–94.
Address correspondence to: Alberto Pilotto Department of Geriatric Care, Orthogeriatrics and Rehabilitation Ente Ospedaliero Galliera Hospital National Relevance & High Specialization Hospital Mura delle Cappuccine 14 Genova 16128 Italy E-mail: [email protected] Received: June 29, 2018 Accepted: October 31, 2018