ORIGINAL ARTICLE
Thyroid hormone signaling is associated with physical
performance, muscle mass, and strength in a cohort
of oldest-old: results from the Mugello study
Angelo Di Iorio &Roberto Paganelli &Michele Abate &Giovanni Barassi &
Alex Ireland &Claudio Macchi &Raffaele Molino-Lova &Francesca Cecchi
Received: 22 September 2020 / Accepted: 16 November 2020 # The Author(s) 2020
Abstract Thyroid hormones (THs) play a crucial role in the homeostasis of muscle function, such as myogenesis and energy metabolism, suggesting that the thyroid may be also involved in the entropic pro-cesses of muscle aging. The aim of the present study is to evaluate the effect of TH signaling on physical per-formance, muscle mass, and strength in a cohort of community-dwelling oldest-old subjects (> 90 years). The study population was selected in a rural area of
central Italy (Mugello, Tuscany), and the design was cross-sectional. Four hundred seventy-five subjects (130 males and 345 females) were enrolled, representing about 65% of all the nonagenarians living in the Mugello area. After adjusting for multiple con-founding factors (sex, age, diabetes, and levothyroxine administration), the lowest quartile of FT3/FT4 ratio distribution showed lower physical performance com-pared to the other quartiles (β ± SE: − 0.49 ± 0.12; https://doi.org/10.1007/s11357-020-00302-0
Angelo Di Iorio and Roberto Paganelli contributed equally to this work.
A. Di Iorio (*)
:
R. Paganelli:
M. Abate:
G. Barassi Department of Medicine and Science of Aging, Laboratory of Clinical Epidemiology and Aging, University“G. d’Annunzio” Chieti, University Centre of Sports Medicine, Viale Abruzzo 322, Chieti Scalo, Italye-mail: [email protected] R. Paganelli e-mail: [email protected] M. Abate e-mail: [email protected] G. Barassi e-mail: [email protected] G. Barassi
Thermal Medicine Center of Castelnuovo della Daunia, Foggia, Italy
A. Ireland
Department of Life Sciences, Musculoskeletal Science and Sports Medicine Research Centre, Manchester Metropolitan University,
John Dalton Building, Chester Street, Manchester M1 5GD, UK e-mail: [email protected]
C. Macchi
:
F. CecchiDepartment of Experimental and Clinical Medicine, Università Di Firenze, Largo Brambilla 3, 50100 Florence, Italy
C. Macchi
e-mail: [email protected] F. Cecchi
e-mail: [email protected]
C. Macchi
:
R. Molino-Lova:
F. CecchiIRCCS Fondazione Don Carlo Gnocchi, Via di Scandicci 269, 50143 Florence, Italy
R. Molino-Lova
p < 0.001), whereas the highest quartile of FT3/FT4 ratio was associated with higher skeletal muscle index (β ± SE: 1.11 ± 0.42; p = 0.009). In addition, the lowest quartile of FT4 showed a statistically significant higher handgrip strength (β ± SE: 1.78 ± 0.68; p = 0.009) com-pared to all other quartiles. This study demonstrates that nonagenarians with higher FT3/FT4 ratios had better preserved muscle function, therefore successfully over-coming the imbalance of homeostatic and entropic pro-cesses involved in muscle aging. However, we could not establish a cause-effect relationship due to the cross-sectional design of the study.
Keywords Thyroid hormone signaling . Aging . Oldest-old . Physical performance . Muscle mass . Muscle strength . Rehabilitation
Introduction
In 2050, it is expected that one in six people worldwide will be aged 65 years or over [1]. Aging is a natural process that may present a decline in the functional status of patients and is a common cause of subsequent disability [2]. Musculoskeletal, neurological, circulato-ry, or sensory conditions can lead to a decrease in physical function [3–5].
Longitudinal studies have demonstrated that fat mass increases, whereas muscle mass, strength, and physical performance progressively decline during aging, even if with different rates of progression [6,7]. Several factors have been hypothesized as determinants of those chang-es; among them are diseases, physical inactivity, inflam-mation, malnutrition, reduced metabolic rate, and hor-monal imbalance [8–10]. All these processes may occur as part of a common pathway or may be interrelated, for example, aging people with a lower metabolic rate have a significantly lower level of multiple morbidities, and they are healthier than those with a higher metabolic rate [11]. If reduced metabolism is a protective mechanism, it may explain why people who have lower free triiodo-thyronine (FT3) and free thyroxine (FT4) and also have a lower FT3/FT4 ratio are still alive at an older age [12,
13]. The increase of FT3 production from FT4 due to the action of TSH becomes less pronounced with aging and may be completely lost in the elderly [12]. This could reflect either reduction in deiodinase (DIO) activity with age, and/or development of thyroid hormone resistance with increasing age [14]. In an euthyroid population
(40–69 years) from Korea, low serum FT3/FT4 was found to be a reliable index for low muscle mass and impaired physical performance [15]. Similar results were found in a cohort of centenarians and offspring, where THs levels predict disability, mortality, and cog-nitive level [13]; in another recent work in the same cohort THs, specifically FT3/FT4 ratio, levels were inversely associated with frailty score [16].
Moreover, thyroid hormone off-label supplementa-tion, in euthyroid subjects, was tested in different con-ditions [17], but levothyroxine (LT4) does not reverse the nonspecific symptoms [18].
The aim of the present study is to evaluate the effect of thyroid hormone signaling on physical performance, muscle mass, and strength in a cohort of community-dwelling oldest-old subjects (> 90 years).
Methods
The design of the Mugello study has been described in detail elsewhere [19]. Briefly, the study was designed and conducted by the Department of Experimental and Clinical Medicine, University of Florence, Italy, and by the Don Carlo Gnocchi Foundation (Florence, Italy). The study was performed in the Mugello area, a wide-spread valley northeast of Florence, in the Tuscany region. The study was designed as a cross-sectional survey, and data were collected in 2009.
Samples
Of the 475 subjects (130 men and 345 women) enrolled in the study, representing approximately 65% of the nonagenarians living in the Mugello area, 417 subjects who consented to donate a blood sample and had all the variables of interest were included. A small group of institutionalized nonagenarians were also included. There was no exclusion criterion. The study protocol, which complied with the principles of the Declaration of Helsinki on clinical research involving human subjects, was approved by the Institutional Review Board. All participants, or proxies, signed the informed consent form to be included in the study.
Home interview
A trained interviewer investigated family, medical, and medication history. In particular, family history of
cardiovascular, cerebrovascular, and respiratory dis-eases; cancer; and dementia was obtained. Past and recent medical history was recorded using a semi-structured questionnaire.
Comprehensive geriatric assessment
Some specific geriatric items, such as functional inde-pendence, physical activity level, quality of life, mood, sleep quality, and falls, were assessed.
Clinical assessment
The interview was followed by a general physical and clinical examination with special attention to general and neurological condition, by a semi-structured ques-tionnaire. Anthropometric measures, such as weight, height, ulna length, lower limb length (from the anterior–superior iliac spine to the internal malleolus), abdominal and hip circumference, as well as arm, thigh, and leg circumference, were also recorded.
Body composition
Body composition was assessed by using Body Imped-ance Assessment (BIA) (EFG, Akern, Italy). BIA mea-sures the opposition of body tissues to the flow of a small (less than 1 mA) alternating current by providing two values (resistance and reactance). Muscle mass was calculated using the Sergi equation [20]. Skeletal muscle index (SMI) was obtained from the standardization of the absolute skeletal muscle mass per squared meters, calculated through the Janssen and colleagues equation [21].
Physical performance
The short physical performance battery (SPPB) based on the lower extremity performance tests used in the Established Populations for the Epidemiologic Studies of the Elderly (EPESE) was used here to summarize lower extremity performance [22]. The SPPB consisted of walking speed, ability to stand from a chair, and ability to maintain balance in progressively more challenging positions. A score ranging from zero, representing inability to do the test, to one, representing the highest level of perfor-mance, was calculated from the three physical per-formance tasks. The score in every timed-task was
calculated as the inverse of the percentage, where the worst time is the unity. Lastly, the three mea-sures were added to create a summary physical performance measure ranging from zero (worst) to three (best). This approach for the calculation of the performance was needed since specific age adjusted cutoff points are not available; therefore the classic way to calculate the SPPB score could produce left-skewed data.
Handgrip test
Handgrip strength was measured using a handheld dy-namometer (Hydraulic Dydy-namometer, RO+TEN, Italy). Participants were asked to perform the task twice with each hand. The average of the best result obtained with each hand was used for these analyses.
Blood collection
Finally, about 1 week after the clinical assessment, a nurse collected venous blood samples for routine and special laboratory tests. Serum and plasma aliquots were also stored at− 80° in the biologic bank.
Laboratory tests
Serum levels of thyroid-stimulating hormone (TSH) were measured using an enzyme-linked immunosorbent assay (ELISA), with the WHO First International Ref-erence Standard, and a sensitivity of 0.08 μg/mL; a colorimetric competitive immunoassay was used to measure T3 and T4 with purified protein standard and polyclonal anti-T3 and anti-T4 (Diesse Diagnostica Senese, Chorus fT3, fT4, TSH, Monteriggioni, Siena, Italy); serum creatinine level was assessed using a stan-dard creatinine Jaffe method (Roche Diagnostics, GmbH, Mannheim, Germany), which had an inter-assay coefficient below 2.5%.
Statistical analysis
Cross-sectional characteristics were compared between quartiles of distribution of FT3, FT4, TSH, and FT3/ FT4 ratio, for all the variables of interest; differences among quartiles were evaluated using analysis of vari-ance for continuous variables andχ2test analyses for dichotomous or categorical variables.
To analyze whether statistically significant differ-ences could be found in the mean values of SPPB score, handgrip test, and muscle mass/height squared, between subjects in the THs quartiles of distribution, linear re-gression models were used, adjusting for age and sex.
Lastly, to evaluate the independent but concurrent role of different markers of thyroid signaling hormones on physical performance, strength, and muscle mass, three separate linear regression models were analyzed. Only dummy quartile derived variables were consid-ered, and the different models were adjusted for age, sex, diabetes, and levothyroxine therapy, and variables were not excluded from the model even if they did not reach a statically significant level.
The backward selection was made visually on thep value basis. AIC, R2, and RSSE goodness of fit tests were assessed to discriminate variables better describing the different associations in the parsimonious model [23].
Analyses were conducted using SAS 9.4 (SAS Insti-tute Inc., Cary, NC, USA).
Results
Four hundred seventeen subjects were enrolled in this study; 111 (26.62%) were males, and the mean age of the total population was 93.00 ± 3.16 years, with slightly but significantly younger age in males (M = 92.37 ± 2.66 years; F = 93.22 ± 3.30; p = 0.01).
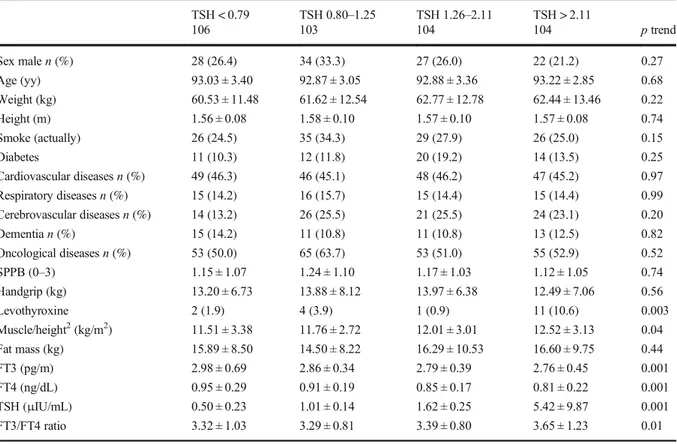
Basic participant characteristics were found to be similar when the variables were analyzed according to TSH levels ranked in quartiles, the only exception being the ratio of muscle mass/height squared ratio, which increased from the lowest quartile to the highest one (p = 0.04) (Table1).
A similar trend was found for distribution in quartiles of the values of serum FT3 (Table2). In this case too, muscle mass/height squared ratio showed a linear in-crease through the different quartiles (Stβ ± SE = 0.11 ± 0.05). An increase of the SPPB score from lowest through highest quartile was also observed (Stβ ± SE =
0.17 ± 0.05).
Table 1 Descriptive of the population enrolled in the Mugello study according to quartiles of TSH (μIU/mL) distribution TSH < 0.79 TSH 0.80–1.25 TSH 1.26–2.11 TSH > 2.11 106 103 104 104 p trend Sex malen (%) 28 (26.4) 34 (33.3) 27 (26.0) 22 (21.2) 0.27 Age (yy) 93.03 ± 3.40 92.87 ± 3.05 92.88 ± 3.36 93.22 ± 2.85 0.68 Weight (kg) 60.53 ± 11.48 61.62 ± 12.54 62.77 ± 12.78 62.44 ± 13.46 0.22 Height (m) 1.56 ± 0.08 1.58 ± 0.10 1.57 ± 0.10 1.57 ± 0.08 0.74 Smoke (actually) 26 (24.5) 35 (34.3) 29 (27.9) 26 (25.0) 0.15 Diabetes 11 (10.3) 12 (11.8) 20 (19.2) 14 (13.5) 0.25 Cardiovascular diseasesn (%) 49 (46.3) 46 (45.1) 48 (46.2) 47 (45.2) 0.97 Respiratory diseasesn (%) 15 (14.2) 16 (15.7) 15 (14.4) 15 (14.4) 0.99 Cerebrovascular diseasesn (%) 14 (13.2) 26 (25.5) 21 (25.5) 24 (23.1) 0.20 Dementian (%) 15 (14.2) 11 (10.8) 11 (10.8) 13 (12.5) 0.82 Oncological diseasesn (%) 53 (50.0) 65 (63.7) 53 (51.0) 55 (52.9) 0.52 SPPB (0–3) 1.15 ± 1.07 1.24 ± 1.10 1.17 ± 1.03 1.12 ± 1.05 0.74 Handgrip (kg) 13.20 ± 6.73 13.88 ± 8.12 13.97 ± 6.38 12.49 ± 7.06 0.56 Levothyroxine 2 (1.9) 4 (3.9) 1 (0.9) 11 (10.6) 0.003 Muscle/height2(kg/m2) 11.51 ± 3.38 11.76 ± 2.72 12.01 ± 3.01 12.52 ± 3.13 0.04 Fat mass (kg) 15.89 ± 8.50 14.50 ± 8.22 16.29 ± 10.53 16.60 ± 9.75 0.44 FT3 (pg/m) 2.98 ± 0.69 2.86 ± 0.34 2.79 ± 0.39 2.76 ± 0.45 0.001 FT4 (ng/dL) 0.95 ± 0.29 0.91 ± 0.19 0.85 ± 0.17 0.81 ± 0.22 0.001 TSH (μIU/mL) 0.50 ± 0.23 1.01 ± 0.14 1.62 ± 0.25 5.42 ± 9.87 0.001 FT3/FT4 ratio 3.32 ± 1.03 3.29 ± 0.81 3.39 ± 0.80 3.65 ± 1.23 0.01 SPPB short physical performance battery. Values are presented as mean ± standard deviation for continuous variables, and n (%) for categorical variables
Table 3 reports the clinical characteristics of the participants according to the FT4 quartile of distribu-tion. A linear trend in age and weight (p = 0.007 and p = 0.02, respectively) was found through the quartiles. A linear relationship was also present for physical perfor-mance (SPPB score Stβ ± SE = − 0.16 ± 0.04) and mus-cle strength (handgrip Stβ ± SE = 0.14 ± 0.04).
Finally, Table4describes the clinical characteristics of the population according to FT3/FT4 ratios subdivided in quartiles. The subjects classified in the lowest quartile were older compared to all other groups, and consequently, dementia and incontinence were slightly more prevalent (p = 0.04; p = 0.05, respective-ly); for the same reason, subjects in this quartile displayed a lower physical performance (p < 0.001), strength (p = 0.04), and muscle mass/height squared ratio (p = 0.04) compared to other quartiles.
Among diseases only diabetes showed higher preva-lence in the FT3/FT4 ratio lowest quartile of distribution (p = 0.002), but no association could be found with other THs.
No differences in the frequency of corticosteroid, anti-hypertensive, inotropic drugs, and methimazole use were found according to THs quartile of distribution (data not shown). Levothyroxine was prescribed, more often to cases in the highest quartile of TSH, compared to all others (10.6% vs 2.3%;p = 0.003, respectively). No association with other THs was found for any drug considered.
In the multivariate analysis, where SPPB score, strength, and muscle mass/height squared ratio were analyzed in different models, according to dummy var-iables derived from FT3, FT4, TSH, and FT3/FT4-ratios for quartile of distribution, and adjusted for age and sex, no changes in the significant differences were found (Table5).
The lowest and the intermediate-lowest quartiles of TSH showed a reduction in muscle mass/height squared ratio, compared to the highest quartile (β ± SE − 1.79 ± 0.78;p = 0.02; β ± SE − 1.64 ± 0.82, respectively). No differences were found for physical performance and strength.
Table 2 Descriptive of the population enrolled in the Mugello study according to FT3 (pg/m) quartiles of distribution FT3 < 2.56 FT3 2.57–2.78 FT 32.79–3.05 FT3 > 3.05 103 100 114 100 p trend Sex male 24 (23.3) 28 (28.0) 31 (27.2) 28 (28.0) 0.85 Age (yy) 93.37 ± 3.73 93.12 ± 3.12 92.75 ± 2.82 92.80 ± 2.92 0.13 Weight (kg) 62.89 ± 13.31 61.77 ± 12.19 60.80 ± 12.38 62.28 ± 12.57 0.61 Height (m) 1.57 ± 0.09 1.58 ± 0.09 1.57 ± 0.09 1.57 ± 0.10 0.33 Smoke (actually) 23 (22.3) 31 (31.0) 35 (30.7) 24 (24.0) 0.07 Diabetes 20 (19.4) 14 (14.0) 16 (14.0) 7 (6.9) 0.08 Cardiovascular diseases 54 (52.4) 44 (44.0) 47 (41.2) 45 (45.0) 0.47 Respiratory diseases 13 (12.6) 13 (13.0) 21 (18.4) 15 (15.0) 0.71 Cerebrovascular diseases 18 (17.5) 24 (24.0) 16 (14.0) 27 (27.0) 0.07 Dementia 13 (12.6) 12 (12.0) 13 (11.4) 12 (12.0) 0.98 Oncological diseases 52 (50.5) 56 (56.0) 66 (57.9) 53 (53.0) 0.85 SPPB (0–3) 0.87 ± 0.97 1.06 ± 1.10 1.35 ± 1.07 1.37 ± 1.01 < 0.001 Handgrip (kg) 12.92 ± 7.95 13.57 ± 6.07 13.20 ± 6.84 13.91 ± 7.39 0.44 Levothyroxine 9 (8.7) 6 (6.0) 3 (2.6) 0 0.07 Muscle/height2(kg/m2) 11.34 ± 2.72 11.98 ± 2.49 12.06 ± 3.44 12.46 ± 3.44 0.04 Fat mass (kg) 17.11 ± 9.87 15.87 ± 9.40 14.73 ± 8.30 16.12 ± 10.03 0.36 FT3 (pg/m) 2.35 ± 0.17 2.67 ± 0.06 2.92 ± 0.08 3.45 ± 0.56 < 0.001 FT4 (ng/dL) 0.85 ± 0.21 0.88 ± 0.22 0.86 ± 0.18 0.93 ± 0.28 0.02 TSH (μIU/mL) 3.51 ± 9.75 1.63 ± 1.23 1.87 ± 3.40 1.52 ± 1.37 0.01 FT3/FT4 ratio 2.98 ± 1.08 3.22 ± 0.77 3.53 ± 0.78 3.92 ± 1.05 < 0.001 SPPB short physical performance battery. Values are presented as mean ± standard deviation for continuous variables, and n (%) for categorical variables
Similarly, lowest and intermediate-lowest FT3 quartiles showed a reduction in the SPPB score, compared to the upper quartile, independently from age and sex (β ± SE − 0.44 ± 0.14; p = 0.002; − 0.29 ± 0.14;p = 0.04, respectively). Physical performance (SPPB score) and strength (handgrip test) were asso-ciated with FT4 lower and intermediate-lower quar-tile, independent of age and sex. No differences among the four quartiles were detectable for muscle mass/height squared ratio.
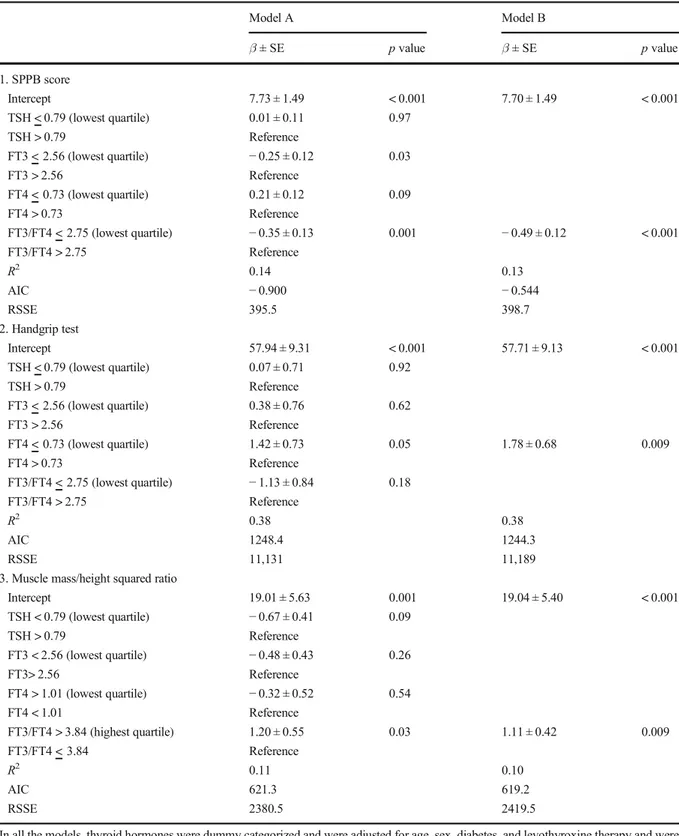
The analysis for the FT3/FT4 ratio confirmed that muscle mass/height squared ratio was lower in low, intermediate-low, and intermediate-high compared to the highest quartile. For physical performance, differ-ences were observed among low and intermediate-low compared to the highest quartile. Finally, in order to evaluate the independent but concurrent role of different markers of thyroid signaling hormones on physical per-formance, strength, and muscle mass, three separate linear regression models were analyzed (Table6parts 1, 2, and 3).
The lowest quartile of FT3/FT4 ratio, independent of age and sex, was the only marker associated with SPPB, accounting for 8% of the 14% of the total variance explained by the model. Moreover, subjects in this lowest quartile (FT3/FT4 ratio < 2.75) showed a mean reduction of physical performance of 0.50 points, com-pared to all other groups (Table6part 1). In the model that analyzes handgrip, lowest quartile of FT4 (values < 0.73 mg/mL) was associated with a significant increase in strength (Table6part 2). Muscle mass/height squared ratio was higher, in the highest quartile (values > 3.84) of the FT3/FT4 ratio (β ± SE = 1.11 ± 0.42; p = 0.009), compared to all other groups (Table6 part 3). All the models were adjusted for age, sex, diabetes, levothyroxine prescription, and the other THs.
Discussion
This study demonstrates that in a cohort of free-living nonagenarian subjects, several measures of physical Table 3 Descriptive of the population enrolled in the Mugello study according to FT4 (ng/dL) quartiles of distribution
FT4 < 0.73 FT4 0.74–0.86 FT4 0.75–1.00 FT4 > 1.00 102 107 105 103 p trend Sex male 29 (28.43) 21 (19.63) 32 (30.48) 29 (28.16) 0.29 Age (yy) 92.57 ± 2.81 92.76 ± 2.93 92.93 ± 3.18 93.76 ± 3.59 0.007 Weight (kg) 64.96 ± 13.18 60.99 ± 11.64 61.14 ± 12.78 60.52 ± 12.43 0.02 Height (m) 1.58 ± 0.09 1.55 ± 0.08 1.58 ± 0.11 1.57 ± 0.09 0.78 Smoke (actually) 30 (29.41) 30 (28.04) 28 (26.67) 25 (24.27) 0.70 Diabetes 13 (12.8) 9 (8.4) 13 (12.3) 22 (21.4) 0.06 Cardiovascular diseases 42 (41.18) 52 (48.60) 52 (49.52) 44 (42.72) 0.55 Respiratory diseases 18 (17.65) 22 (20.56) 14 (13.33) 8 (7.77) 0.04 Cerebrovascular diseases 19 (18.63) 23 (21.50) 19 (18.10) 24 (23.30) 0.78 Dementia 10 (9.80) 19 (17.76) 11 (10.48) 10 (9.71) 0.18 Oncological diseases 60 (58.82) 55 (51.40) 55 (52.38) 57 (55.34) 0.74 SPPB score (0–3) 1.43 ± 1.03 1.27 ± 1.04 1.06 ± 1.10 0.90 ± 1.00 < 0.001 Handgrip (kg) 14.84 ± 7.61 13.22 ± 6.64 13.33 ± 7.83 12.05 ± 5.85 0.01 Levothyroxine 4 (3.96) 5 (4.8) 2 (1.9) 7 (6.8) 0.37 Muscle/height2(kg/m2) 12.72 ± 3.16 12.16 ± 2.61 11.54 ± 3.49 11.81 ± 3.00 0.23 Fat mass (kg) 17.35 ± 10.32 15.27 ± 8.06 15.94 ± 9.32 15.20 ± 9.66 0.25 FT3 (pg/m) 2.80 ± 0.50 2.83 ± 0.39 2.83 ± 0.38 2.93 ± 0.65 0.06 FT4 (ng/dL) 0.64 ± 0.09 0.79 ± 0.04 0.93 ± 0.04 1.16 ± 0.22 < 0.001 TSH (μIU/mL) 3.94 ± 10.18 1.73 ± 1.41 1.40 ± 0.99 1.51 ± 1.91 0.001 FT3/FT4 ratio 4.48 ± 1.11 3.59 ± 0.52 3.05 ± 0.43 2.55 ± 0.50 < 0.001 SPPB short physical performance battery. Values are presented as mean ± standard deviation for continuous variables, and n (%) for categorical variables
performance and muscle fitness are related to thyroid hormone levels. Lower free T3/free T4 ratio is associat-ed with lower SPPB score, and the highest quartile of FT4 with a higher handgrip test result, whereas the lowest FT3/FT4 quartile is correlated with higher mus-cle mass. All these associations were assessed in models demonstrating their independence from potential con-founding factors.
The major finding of this study is the association of low FT3/FT4 ratio and low physical performance, inde-pendent from the concurrent effect of the other THs, in an oldest-old population, bridging the gap of available data.
In the InCHIANTI study, after adjusting for mul-tiple confounders, an association between physical performance and FT3, but not FT4 or TSH, was found [24]. The populations of the InCHIANTI and the Mugello studies were selected in the same region (Tuscany), but in the latter, it is represented only by nonagenarians; the two studies differed also in de-sign, i.e., a cross-sectional design for the Mugello
study and a longitudinal one for the InCHIANTI. Moreover, the FT3/FT4 ratio was not analyzed in the InCHIANTI results. Ceresini et al. found a three-fold increase in the risk of impaired mobility (defined by SPPB < 9) in subjects of the InCHIANTI study with subclinical hyperthyroidism [25]. In a smaller study of fifty-one elderly fit subjects, levels of thy-roid hormones (FT3/FT4 ratio) were correlated with aerobic endurance capacity and strength [26]. Re-cently, Kong et al., in a Korean population aged 40–69 years, demonstrated that a low FT3/FT4 ratio, but not serum FT3 or FT4 alone, was associated with low muscle mass and impaired physical performance [15]. Serum TSH level was shown to be inversely correlated with handgrip strength in a large cross-sectional study in Germany [27]. Other studies failed to detect a relationship between thyrotropin and per-formance in elderly subjects [28]. Recently, two cross-sectional studies of the same cohort of cente-narians demonstrated that THs were associated with frailty, disability, and cognitive status [13, 16]. Table 4 Descriptive of the population enrolled in the Mugello study according to FT3/FT4 ratio quartiles of distribution
FT3/FT4 < 2.75 FT3/FT4 2.76–3.32 FT3/FT4 3.33–3.84 FT3/FT4 > 3.84 102 107 105 103 p trend Sex male 25 (23.81) 35 (32.71) 28 (27.18) 23 (22.55) 0.34 Age (yy) 94.28 ± 3.89 92.64 ± 2.98 92.48 ± 2.48 92.61 ± 2.78 < 0.001 Weight (kg) 60.64 ± 13.39 61.68 ± 11.22 62.32 ± 13.05 62.96 ± 12.68 0.18 Height (m) 1.58 ± 0.09 1.57 ± 0.10 1.57 ± 0.09 1.57 ± 0.08 0.77 Smoke (actually) 20 (19.05) 33 (30.84) 31 (30.10) 29 (28.43) 0.12 Diabetes 26 (24.8) 14 (13.0) 5 (4.9) 12 (11.8) 0.003 Cardiovascular diseases 48 (45.71) 54 (50.47) 47 (45.63) 41 (40.20) 0.51 Respiratory diseases 9 (8.57) 16 (14.95) 15 (14.56) 22 (21.57) 0.10 Cerebrovascular diseases 22 (20.95) 22 (20.56) 21 (20.39) 20 (19.61) 0.97 Dementia 17 (16.19) 5 (4.67) 14 (13.59) 14 (13.73) 0.04 Oncological diseases 51 (48.57) 60 (56.07) 57 (55.34) 59 (57.84) 0.55 SPPB score (0–3) 0.70 ± 0.93 1.20 ± 1.12 1.31 ± 1.02 1.47 ± 1.01 < 0.001 Handgrip (kg) 11.29 ± 6.13 13.98 ± 7.96 14.56 ± 6.75 13.51 ± 7.01 0.04 Muscle (kg) 29.19 ± 8.81 29.20 ± 7.40 28.59 ± 9.08 32.21 ± 9.19 0.08 Muscle/height2(kg/m2) 11.57 ± 3.06 11.89 ± 2.79 11.64 ± 3.21 12.78 ± 3.19 0.04 Fat mass (kg) 15.89 ± 9.98 14.75 ± 7.86 17.86 ± 9.97 15.26 ± 9.46 0.78 FT3 (pg/m) 2.61 ± 0.45 2.80 ± 0.31 2.89 ± 0.38 3.11 ± 0.65 < 0.001 FT4 (ng/dL) 1.11 ± 0.24 0.92 ± 0.11 0.81 ± 0.11 0.68 ± 0.16 < 0.001 TSH (μIU/mL) 1.62 ± 1.96 1.58 ± 1.20 1.86 ± 3.68 3.52 ± 9.66 0.001 FT3/FT4 ratio 2.37 ± 0.29 3.06 ± 0.16 3.59 ± 0.16 4.68 ± 1.00 < 0.001 SPPB short physical performance battery. Values are presented as mean ± standard deviation for continuous variables, and n (%) for categorical variables
Moreover, both the increase of FT4 and the decrease of the FT3/FT4 ratio were associated with lower survival [13]. These data are consistent with the results of our study, since lower level of physical performance, muscle mass reduction, and lower mus-cle strength are components of the frailty phenotype [29]. In addition, a decrease of the SPPB score is a strong predictor of subsequent disability [2] and also
of catastrophic events such as institutionalization or death [22].
Skeletal muscle is a target of thyroid hormone sig-naling, acting on muscle contractility and metabolism, by regulating gene expression in an age-dependent man-ner [30]. Thyroid hormone–converting enzymes (DIO2
and DIO3) locally control the uptake and the activation or inactivation of TH within the skeletal muscle tissue. Table 5 Linear regression analysis, associations of physical performance (SPPB score), strength (handgrip), and muscle mass/height squared ratio with quartiles of distribution of thyroid hormones
SPPB Handgrip Muscle/H2
β ± SE p value β ± SE p value β ± SE p value
A Intercept 9.14 ± 1.48 < 0.001 61.09 ± 9.15 < 0.001 32.78 ± 8.56 < 0.001 TSH < 0.79 − 0.01 ± 0.14 0.95 0.33 ± 0.86 0.70 − 1.79 ± 0.78 0.02 TSH 0.80–1.25 0.05 ± 0.14 0.74 0.32 ± 0.86 0.71 − 1.64 ± 0.82 0.04 TSH 1.26–2.11 0.01 ± 0.14 0.99 1.01 ± 0.86 0.24 − 1.01 ± 0.78 0.20 TSH > 2.11 Reference Age (yy) − 0.08 ± 0.02 < 0.001 − 0.45 ± 0.09 < 0.001 − 0.11 ± 0.09 0.25 Sex (female) − 0.33 ± 0.11 0.004 − 8.33 ± 0.67 < 0.001 − 4.16 ± 0.62 < 0.001 B Intercept 8.96 ± 1.46 < 0.001 62.23 ± 9.11 < 0.001 31.17 ± 8.50 < 0.001 FT3 < 2.56 − 0.44 ± 0.14 0.002 − 0.38 ± 0.86 0.66 − 1.46 ± 0.80 0.07 FT3 2.57–2.78 − 0.29 ± 0.14 0.04 − 0.44 ± 0.88 0.62 − 0.67 ± 0.83 0.42 FT32.79–3.05 − 0.03 ± 0.14 0.84 − 0.68 ± 0.82 0.40 − 0.53 ± 0.78 0.50 FT3 > 3.05 Reference Age (yy) − 0.08 ± 0.02 < 0.001 − 0.46 ± 0.10 < 0.001 − 0.09 ± 0.09 0.30 Sex (female) − 0.33 ± 0.11 0.004 − 8.33 ± 0.67 < 0.001 − 4.01 ± 0.62 < 0.001 C Intercept 8.30 ± 1.48 < 0.001 58.21 ± 9.09 < 0.001 30.35 ± 8.61 < 0.001 FT4 < 0.73 0.44 ± 0.14 0.002 2.57 ± 0.85 0.003 0.78 ± 0.78 0.32 FT4 0.74–0.86 0.32 ± 0.14 0.02 1.62 ± 0.84 0.05 0.55 ± 0.79 0.49 FT4 0.75–1.00 0.09 ± 0.14 0.51 0.61 ± 0.86 0.48 − 0.42 ± 0.79 0.59 FT4 > 1.01 Reference Age (yy) − 0.08 ± 0.02 < 0.001 − 0.43 ± 0.10 < 0.001 − 0.09 ± 0.09 0.30 Sex (female) − 0.36 ± 0.11 0.002 − 8.45 ± 0.66 < 0.001 − 4.10 ± 0.63 < 0.001 D Intercept 7.98 ± 1.47 < 0.001 57.54 ± 9.20 < 0.001 19.48 ± 5.55 < 0.001 FT3/FT4 < 2.75 − 0.67 ± 0.14 < 0.001 − 1.95 ± 0.86 0.03 − 1.14 ± 0.51 0.02 FT3/FT4 2.76–3.32 − 0.31 ± 0.14 0.02 − 0.77 ± 0.84 0.35 − 1.07 ± 0.51 0.03 FT3/FT4 3.33–3.84 − 0.19 ± 0.14 0.17 0.34 ± 0.83 0.35 − 1.11 ± 0.51 0.03 FT3/FT4 > 3.84 Reference Age (yy) − 0.07 ± 0.02 < 0.001 − 0.41 ± 0.10 < 0.001 − 0.06 ± 0.06 0.33 Sex (female) − 0.35 ± 0.11 0.002 − 8.39 ± 0.66 < 0.001 − 1.71 ± 0.39 < 0.001
Table 6 Backward multiple linear regression analysis assessing the association between physical performance, muscle strength, and muscle mass/height squared ratio and thyroid hormone signaling
Model A Model B β ± SE p value β ± SE p value 1. SPPB score Intercept 7.73 ± 1.49 < 0.001 7.70 ± 1.49 < 0.001 TSH < 0.79 (lowest quartile) 0.01 ± 0.11 0.97 TSH > 0.79 Reference FT3 < 2.56 (lowest quartile) − 0.25 ± 0.12 0.03 FT3 > 2.56 Reference FT4 < 0.73 (lowest quartile) 0.21 ± 0.12 0.09 FT4 > 0.73 Reference FT3/FT4 < 2.75 (lowest quartile) − 0.35 ± 0.13 0.001 − 0.49 ± 0.12 < 0.001 FT3/FT4 > 2.75 Reference R2 0.14 0.13 AIC − 0.900 − 0.544 RSSE 395.5 398.7 2. Handgrip test Intercept 57.94 ± 9.31 < 0.001 57.71 ± 9.13 < 0.001 TSH < 0.79 (lowest quartile) 0.07 ± 0.71 0.92 TSH > 0.79 Reference FT3 < 2.56 (lowest quartile) 0.38 ± 0.76 0.62 FT3 > 2.56 Reference FT4 < 0.73 (lowest quartile) 1.42 ± 0.73 0.05 1.78 ± 0.68 0.009 FT4 > 0.73 Reference FT3/FT4 < 2.75 (lowest quartile) − 1.13 ± 0.84 0.18 FT3/FT4 > 2.75 Reference R2 0.38 0.38 AIC 1248.4 1244.3 RSSE 11,131 11,189
3. Muscle mass/height squared ratio
Intercept 19.01 ± 5.63 0.001 19.04 ± 5.40 < 0.001 TSH < 0.79 (lowest quartile) − 0.67 ± 0.41 0.09 TSH > 0.79 Reference FT3 < 2.56 (lowest quartile) − 0.48 ± 0.43 0.26 FT3> 2.56 Reference FT4 > 1.01 (lowest quartile) − 0.32 ± 0.52 0.54 FT4 < 1.01 Reference FT3/FT4 > 3.84 (highest quartile) 1.20 ± 0.55 0.03 1.11 ± 0.42 0.009 FT3/FT4 < 3.84 Reference R2 0.11 0.10 AIC 621.3 619.2 RSSE 2380.5 2419.5
In all the models, thyroid hormones were dummy categorized and were adjusted for age, sex, diabetes, and levothyroxine therapy and were not excluded from the analysis even if they did not reach a statically significant level. Model A saturated model; Model B parsimonious model
Muscle gene expression, phenotype, plasticity, energy turnover, and glucose metabolism are controlled and regulated in a T3-dependent fashion [14]. During aging, changes occurring in the thyroid structure and function affect TH production, metabolism, transport, and action; tissue-specific regulation of deiodinase activities occurs with aging, but TH signaling in the muscle, heart, and brain appears to be unaltered [31].
Recently Franceschi et al., reviewing the complex interrelationship among aging, longevity, and thyroid aging, highlighted how complex and heterogeneous are those traits interactions, particularly in the oldest-old [32]. Moreover, they suggested that similar to inflammaging or to osteoporosis, also those thyroid age–related changes could be part of the “systemic adaptive remodeling” that had the function to prevent or mitigate processes of tissue disruption and degenera-tive changes [33].
Therefore, our results need to be evaluated keeping in mind those two postulates. First, the cross-sectional character of the study does not consider the interaction of lifelong internal and external factors leading to indi-vidual heterogeneity. Second, changes occurring during thyroid aging might be considered adaptive, and not only detrimental.
Collectively this data indicate the FT3/FT4 ratio as a possible marker of muscle aging, even if the action of THs on several target organs and their functions may play a role in modulating physical performance and strength.
To the best of our knowledge, this is the first study assessing the concurrent role of the different THs in a large population of nonagenarians, and showing the relationship of the FT3/FT4 ratio with aging muscle function.
Among the limitations due to the cross-sectional design, this study could only detect associations be-tween TH and markers of muscle aging, and not a causal relationship. Recall bias, frequent in elderly subjects in the Mugello study were overcome with the required presence of the caregiver during the clinical session. Moreover, as suggested by Maggio et al., individual hormones do not operate indepen-dent of each other; rather, one hormonal problem may trigger the onset of another [34, 35], such that associations between individual hormones and health status may result from a wider hormonal dysfunction or from concurrent effects on other physiological systems.
Conclusion
In a population of (free-living) nonagenarians, levels of thyroid hormones have been shown to play a central role in the variation of physical performance and muscle strength, which are key markers of the aging process. We could not establish whether the FT3/FT4 ratio may be a marker of successful aging or just an epiphenome-non of the aging muscle. Longitudinal evaluations are required to verify these findings and elucidate the path-way(s) linking thyroid and muscle function in aging.
Acknowledgments The authors are deeply grateful to partici-pants and their relatives for the kind availability to participate in this survey. The authors are also grateful to the municipalities of the Mugello area for their great support in providing the population registries and to the general practitioners who had in charge study participants for their great help in inviting eligible subjects to participate in the study.
Funding Open access funding provided by Università degli Studi G. D'Annunzio Chieti Pescara within the CRUI-CARE Agreement. The Mugello study was partially supported by the Italian Ministry of Health within the Current Research Program performed at National Research Institutes (IRCCS).
Data availability The Mugello study dataset is not stored in a data repository, but data is available on reasonable request. Compliance with ethical standards The Mugello study proto-col, which complied with the principles of the Declaration of Helsinki on clinical research involving human beings, was ap-proved by the Institutional Review Board (IRCCS Fondazione Don Carlo Gnocchi). All the participants, or their proxies, signed the informed consent form.
Conflict of interest The authors declare that they have no com-peting interests.
Open Access This article is licensed under a Creative Commons Attribution 4.0 International License, which permits use, sharing, adaptation, distribution and reproduction in any medium or format, as long as you give appropriate credit to the original author(s) and the source, provide a link to the Creative Commons licence, and indicate if changes were made. The images or other third party material in this article are included in the article's Creative Com-mons licence, unless indicated otherwise in a credit line to the material. If material is not included in the article's Creative Com-mons licence and your intended use is not permitted by statutory regulation or exceeds the permitted use, you will need to obtain permission directly from the copyright holder. To view a copy of this licence, visithttp://creativecommons.org/licenses/by/4.0/.
References
1. World Population Ageing 2019 Highlights. 2019.
https://doi.org/10.18356/9df3caed-en
2. Guralnik JM, Ferrucci L, Balfour JL, Volpato S, Di Iorio A. Progressive versus catastrophic loss of the ability to walk: implications for the prevention of mobility loss. J Am Geriatr Soc. 2001;49:1463–70.https://doi.org/10.1046 /j.1532-5415.2001.4911238.x.
3. Costanzo L, De Vincentis A, Di Iorio A, Bandinelli S, Ferrucci L, Antonelli Incalzi R, et al. Impact of low muscle mass and low muscle strength according to EWGSOP2 and EWGSOP1 in community-dwelling older people. J Gerontol A Biol Sci Med Sci. 2020;75:1324–30. https://doi. org/10.1093/gerona/glaa063.
4. Bandinelli S, Benvenuti E, Del Lungo I, Baccini M, Benvenuti F, Di Iorio A, et al. Measuring muscular strength of the lower limbs by hand-held dynamometer: a standard protocol. Aging Clin Exp Res. 1999;11:287–93.https://doi. org/10.1007/BF03339802.
5. Ferrucci L, Gonzalez-Freire M, Fabbri E, Simonsick E, Tanaka T, Moore Z, et al. Measuring biological aging in humans: a quest. Aging Cell. 2020;19:e13080.https://doi. org/10.1111/acel.13080.
6. Rossi AP, Bianchi L, Volpato S, Bandinelli S, Guralnik J, Zamboni M, et al. Dynapenic abdominal obesity as a pre-dictor of worsening disability, hospitalization, and mortality in older adults: results from the InCHIANTI study. J Gerontol - Ser A Biol Sci Med Sci. 2017;72:1098–104.
https://doi.org/10.1093/gerona/glw203.
7. Kalyani RR, Metter EJ, Xue Q-L, Egan JM, Chia CW, Studenski S, et al. The relationship of lean body mass with aging to the development of diabetes. J Endocr Soc. 2020;4.
https://doi.org/10.1210/jendso/bvaa043.
8. Stenholm S, Maggio M, Lauretani F, Bandinelli S, Ceda GP, Di Iorio A, et al. Anabolic and catabolic biomarkers as predictors of muscle strength decline: the InCHIANTI study. Rejuvenation Res. 2010;13:3–11. https://doi.org/10.1089 /rej.2009.0891.
9. Maggio M, Ceda GP, Lauretani F, Bandinelli S, Corsi AM, Giallauria F, et al. SHBG, sex hormones, and inflammatory markers in older women. J Clin Endocrinol Metab. 2011;96: 1053–9.https://doi.org/10.1210/jc.2010-1902.
10. Vitale G, Salvioli S, Franceschi C. Oxidative stress and the ageing endocrine system. Nat Rev Endocrinol. 2013;9:228– 40.https://doi.org/10.1038/nrendo.2013.29.
11. Fabbri E, An Y, Schrack JA, Gonzalez-Freire M, Zoli M, Simonsick EM, et al. Energy metabolism and the burden of multimorbidity in older adults: results from the Baltimore longitudinal study of aging. J Gerontol - Ser A Biol Sci Med Sci. 2015;70:1297–303. https://doi.org/10.1093 /gerona/glu209.
12. Strich D, Karavani G, Edri S, Gillis D. TSH enhancement of FT4 to FT3 conversion is age dependent. Eur J Endocrinol. 2016;175:49–54.https://doi.org/10.1530/EJE-16-0007. 13. Ostan R, Monti D, Mari D, Arosio B, Gentilini D, Ferri E,
et al. Heterogeneity of thyroid function and impact of peripheralthyroxine deiodination in centenarians and semi-supercentenarians: association with functional status and
mortality. J Gerontol - Ser A Biol Sci Med Sci. 2019;74: 802–10.https://doi.org/10.1093/gerona/gly194.
14. Salvatore D, Simonides WS, Dentice M, Zavacki AM, Larsen PR. Thyroid hormones and skeletal muscle - new insights and potential implications. Nat Rev Endocrinol. 2014;10:206–14.https://doi.org/10.1038/nrendo.2013.238. 15. Kong SH, Kim JH, Park YJ, Lee JH, Hong AR, Shin CS,
et al. Low free T3 to free T4 ratio was associated with low muscle mass and impaired physical performance in community-dwelling aged population. Osteoporos Int. 2020;31:525–31. https://doi.org/10.1007/s00198-019-05137-w.
16. Arosio B, Monti D, Mari D, Passarino G, Ostan R, Ferri E, et al. Thyroid hormones and frailty in persons experiencing extreme longevity. Exp Gerontol. 2020;138:111000.
https://doi.org/10.1016/j.exger.2020.111000.
17. Jonklaas J, Bianco AC, Bauer AJ, Burman KD, Cappola AR, Celi FS, et al. Guidelines for the treatment of hypothy-roidism: prepared by the American thyroid association task force on thyroid hormone replacement. Thyroid. 2014;24: 1670–751.https://doi.org/10.1089/thy.2014.0028. 18. Irwig MS, Fleseriu M, Jonklaas J, Tritos NA, Yuen KCJ,
Correa R, et al. Off-label use and misuse of testosterone, growth hormone, thyroid hormone, and adrenal supple-ments: risks and costs of a growing problem. Endocr Pract. 2020;26:340–53.https://doi.org/10.4158/ps-2019-0540. 19. Molino-Lova R, Sofi F, Pasquini G, Gori A, Vannetti F,
Abbate R, et al. The Mugello study, a survey of nonagenar-ians living in Tuscany: design, methods and participants’ general characteristics. Eur J Intern Med. 2013;24:745–9.
https://doi.org/10.1016/j.ejim.2013.09.008.
20. Sergi G, De Rui M, Veronese N, Bolzetta F, Berton L, Carraro S, et al. Assessing appendicular skeletal muscle mass with bioelectrical impedance analysis in free-living Caucasian older adults. Clin Nutr. 2015;34:667–73.
https://doi.org/10.1016/j.clnu.2014.07.010.
21. Janssen I, Heymsfield SB, Baumgartner RN, Ross R. Estimation of skeletal muscle mass by bioelectrical imped-ance analysis. J Appl Physiol. 2000;89:465–71.https://doi. org/10.1152/jappl.2000.89.2.465.
22. Guralnik JM, Ferrucci L, Simonsick EM, Salive ME, Wallace RB. Lower-extremity function in persons over the age of 70 years as a predictor of subsequent disability. N Engl J Med. 1995;332:556–62.https://doi.org/10.1056 /NEJM199503023320902.
23. Beal DJ. SAS® code to select the best multiple linear re-gression model for multivariate data using information criteria. SESUG 2005 Proc SouthEast SAS Users Gr, 2005. 24. Ceresini G, Marina M, Lauretani F, Maggio M, Serra MF, Meschi T, et al. Physical performance across the thyroid function values within the normal range in adult and older persons. Aging Clin Exp Res. 2019;31:385–91.https://doi. org/10.1007/s40520-018-0975-0.
25. Ceresini G, Ceda GP, Lauretani F, Maggio M, Bandinelli S, Guralnik JM, et al. Mild thyroid hormone excess is associ-ated with a decreased physical function in elderly men. Aging Male. 2011;14:213–9. https://doi.org/10.3109 /13685538.2011.606514.
26. Emerenziani GP, Izzo G, Vaccaro MG, Quattrone A, Lenzi A, Aversa A. Gender difference and correlation between sexuality, thyroid hormones, cognitive, and physical
functions in elderly fit. J Endocrinol Investig. 2019;42:699– 707.https://doi.org/10.1007/s40618-018-0974-1.
27. Spira D, Buchmann N, Demuth I, Steinhagen-Thiessen E, Völzke H, Ittermann T. Association of thyroid function with handgrip strength: data from the study of health in pomera-nia and the berlin aging study ii. Thyroid. 2019;29:1220–6.
https://doi.org/10.1089/thy.2018.0646.
28. Gussekloo J, Van Exel E, De Craen AJM, Meinders AE, Frölich M, Westendorp RGJ. Thyroid status, disability and cognitive function, and survival in old age. J Am Med Assoc. 2004;292:2591–9. https://doi.org/10.1001 /jama.292.21.2591.
29. Walston J, Bandeen-Roche K, Buta B, Bergman H, Gill TM, Morley JE, et al. Moving frailty toward clinical practice: NIA intramural frailty science symposium summary. J Am Geriatr Soc. 2019;67:1559–64. https://doi.org/10.1111 /jgs.15928.
30. Wang L, Sheng Y, Xu W, Sun M, Lv S, Yu J, et al. Mechanism of thyroid hormone signaling in skeletal muscle of aging mice. Endocrine. 2020. https://doi.org/10.1007 /s12020-020-02428-9.
31. Visser WE, Bombardieri CR, Zevenbergen C, Barnhoorn S, Ottaviani A, Van Der Pluijm I, et al. Tissue-specific sup-pression of thyroid hormone signaling in various mouse
models of aging. PLoS One. 2016;11:e0149941.
https://doi.org/10.1371/journal.pone.0149941.
32. Franceschi C, Ostan R, Mariotti S, Monti D, Vitale G. The aging thyroid: a reappraisal within the geroscience integrated perspective. Endocr Rev. 2019.https://doi.org/10.1210 /er.2018-00170.
33. Calabrese V, Santoro A, Monti D, Crupi R, Di Paola R, Latteri S, et al. Aging and Parkinson’s disease: inflammaging, neuroinflammation and biological remodel-ing as key factors in pathogenesis. Free Radic Biol Med. 2 0 1 8 ; 1 1 5 : 8 0– 9 1 . h t t p s : / / d o i . o r g / 1 0 . 1 0 1 6 / j . freeradbiomed.2017.10.379.
34. Cappola AR, Maggio M, Ferrucci L. Is research on hor-mones and aging finished? No! Just started! J Gerontol - Ser A Biol Sci Med Sci. 2008. https://doi.org/10.1093 /gerona/63.7.696.
35. Maggio M, Cattabiani C, Lauretani F, Ferrucci L, Luci M, Valenti G, Ceda G. The concept of multiple hormonal dys-regulation. Acta Biomed. 2010;81(Suppl 1):19–29. Publisher’s note Springer Nature remains neutral with regard to jurisdictional claims in published maps and institutional affiliations.