Hepatic heparan sulfate is a master regulator of hepcidin
expression and iron homeostasis in human hepatocytes and
mice
Received for publication, December 21, 2018, and in revised form, July 9, 2019 Published, Papers in Press, July 17, 2019, DOI 10.1074/jbc.RA118.007213 X Maura Poli‡1,2, Ferdous Anower-E-Khuda§1, Michela Asperti‡, Paola Ruzzenenti‡, Magdalena Gryzik‡, Andrea Denardo‡,X Philip L. S. M. Gordts¶储, Paolo Arosio‡, and Jeffrey D. Esko§¶
From the‡Department of Molecular and Translational Medicine, University of Brescia, Viale Europa 11, 25123 Brescia, Italy, §Department of Cellular and Molecular Medicine, University of California San Diego, La Jolla, California 92093,¶Glycobiology Research and Training Center, University of California San Diego, La Jolla, California 92093, and the储Department of Medicine, Division of Endocrinology and Metabolism, University of California San Diego, La Jolla, California 92093
Edited by Xiao-Fan Wang
Hepcidin is a liver-derived peptide hormone that controls sys-temic iron homeostasis. Its expression is regulated by the bone morphogenetic protein 6 (BMP6)/SMAD1/5/8 pathway and by the proinflammatory cytokine interleukin 6 (IL6). Proteogly-cans that function as receptors of these signaling proteins in the liver are commonly decorated by heparan sulfate, but the poten-tial role of hepatic heparan sulfate in hepcidin expression and iron homeostasis is unclear. Here, we show that modulation of hepatic heparan sulfate significantly alters hepcidin expression and iron metabolism both in vitro and in vivo. Specifically, enzy-matic removal of heparan sulfate from primary human hepato-cytes, CRISPR/Cas9 manipulation of heparan sulfate biosynthe-sis in human hepatoma cells, or pharmacological manipulation of heparan sulfate–protein interactions using sodium chlorate or surfen dramatically reduced baseline and BMP6/SMAD1/5/ 8-dependent hepcidin expression. Moreover inactivation of the heparan sulfate biosynthetic gene N-deacetylase and
N-sulfo-transferase 1 (Ndst1) in murine hepatocytes (Ndst1f/fAlbCreⴙ) reduced hepatic hepcidin expression and caused a redistribution of systemic iron, leading to iron accumulation in the liver and serum of mice. Manipulation of heparan sulfate had a similar effect on dependent hepcidin expression in vitro and suppressed IL6-mediated iron redistribution induced by lipopolysaccharide in
vivo. These results provide compelling evidence that hepatocyte
heparan sulfate plays a key role in regulating hepcidin expression and iron homeostasis in mice and in human hepatocytes.
Hepcidin is the key peptide hormone regulating systemic iron homeostasis, and it is expressed primarily in the liver. Hep-cidin is produced as a prepropeptide and processed by the con-vertase furin into the mature and active 25-amino acid peptide before being secreted into the circulation. Circulating hepcidin binds ferroportin, the only known cellular iron exporter (1), resulting in its ubiquitination and subsequent degradation, thus preventing dietary iron export from enterocytes and recycled iron from red blood cells degraded by macrophages (2, 3).
A variety of stimuli trigger hepcidin expression, including high tissue and plasma iron levels, inflammation, hypoxia, and erythropoiesis (4). Iron-dependent hepcidin expression is con-trolled primarily through BMP/SMAD signaling, whereas the inflammation-dependent expression is mediated primarily through IL6/JAK/STAT3 signaling (5). BMP63plays a key role
in iron-dependent hepcidin expression, based on the observa-tion that circulating iron levels regulate BMP6 expression and that BMP6 knock-out mice have low hepcidin expression and show severe iron overloading (6, 7). The regulation of BMP6 expression occurs at a transcriptional level in the liver, stimu-lated by an iron-rich diet and suppressed by an iron-free diet (8, 9). It was recently reported that the expression of BMP6 occurs in nonparenchymal cells of the liver, such as Kupffer cells and sinusoidal endothelial cells (10). These cells sense iron levels through an uncertain mechanism and secrete BMP6 to modu-late hepcidin expression in hepatocytes in a paracrine manner. Secreted BMP6 interacts with BMP receptors type I (ALK2 and ALK3) and type II (BMPR2 and ACVR2A) expressed by hepa-tocytes. Various accessory proteins, some of which are specific to hepatocytes (5), include hemojuvelin (HJV), a Glycosylphos-phatidylinositol (GPI)-anchor protein that acts as a BMP co-re-ceptor (11), and the serine protease TMPRSS6 that controls HJV activity (12). Neogenin aids in the formation of the com-plex of HJV-BMPR to promote signaling or to support the
activ-This work was partially supported by Telethon Grant GGP15064 (to M. P.), by Fondazione Cariplo and Regione Lombardia project “New Opportunities and Ways toward ERC” 2014-2256 (to M. P.), and National Institutes of Health Grant GM33063 (to J. D. E.). This work was also supported by short-term EMBO Fellowship ASTF121-2016 (to M. P.) and Fondation Leducq 01CVD16 (to P. L. S. M. G.). The funders had no role in study design, data collection and analysis, decision to publish, or preparation of the manuscript. The authors declare that they have no conflicts of interest with the content of this article. The content is solely the responsibility of the authors and does not necessarily represent the official views of the National Institutes of Health.
Author’s Choice—Final version open access under the terms of the Creative Commons CC-BY license.
This article containsFigs. S1–S4 and Table S1. 1These authors contributed equally to this work.
2To whom correspondence should be addressed. Tel.: 39-030-3717303; E-mail:[email protected].
3The abbreviations used are: BMP6, bone morphogenetic protein 6; ANOVA, analysis of variance; Ext, exostosin; FGF2, fibroblast growth factor 2; FPN, ferroportin; FtL, ferritin L; Hamp, hepcidin; HS, heparan sulfate; HSPG, heparan sulfate proteoglycan; JAK/STAT, Janus kinase/signal transducer of activation; LPS, lipopolysaccharide; qRT-PCR, quantitative RT-PCR; Tbp, TATA-box binding protein; TfR, transferrin receptor; Ndst1, N-deacetylase and N-sulfotransferase 1.
cro
ARTICLE
Author’s Choiceity of TMPRSS6 to cleave HJV and suppress the pathway (13). Recent studies indicate that TMPRSS6 also cleaves ALK2, ALK3, ACVR2, BMPR2, hemochromatosis protein, and only to a lesser extent transferrin receptor-2 (TfR2) (14). Hemochro-matosis protein and TfR2 sense transferrin saturation in the plasma and contribute to the control of the activation of the BMP6/SMAD5 pathway (15).
BMP6 signaling involves activation and phosphorylation of the BMP receptors, followed by phosphorylation of SMAD1/ 5/8, the recruitment of SMAD4, and the translocation of the complex into the nucleus where it binds a response element in the hepcidin promoter (11). Inflammatory signaling, initiated by the release of IL6 by liver macrophages, activates the JAK/ STAT pathway in hepatocytes, resulting in STAT3 phosphory-lation, which then binds the hepcidin promoter and increases hepcidin expression dependent in part on SMAD4 (16). The interaction between the IL6 and BMP6 pathways implies that inhibition of the BMP/SMAD pathway suppresses both iron-dependent and inflammation-iron-dependent hepcidin activation (17).
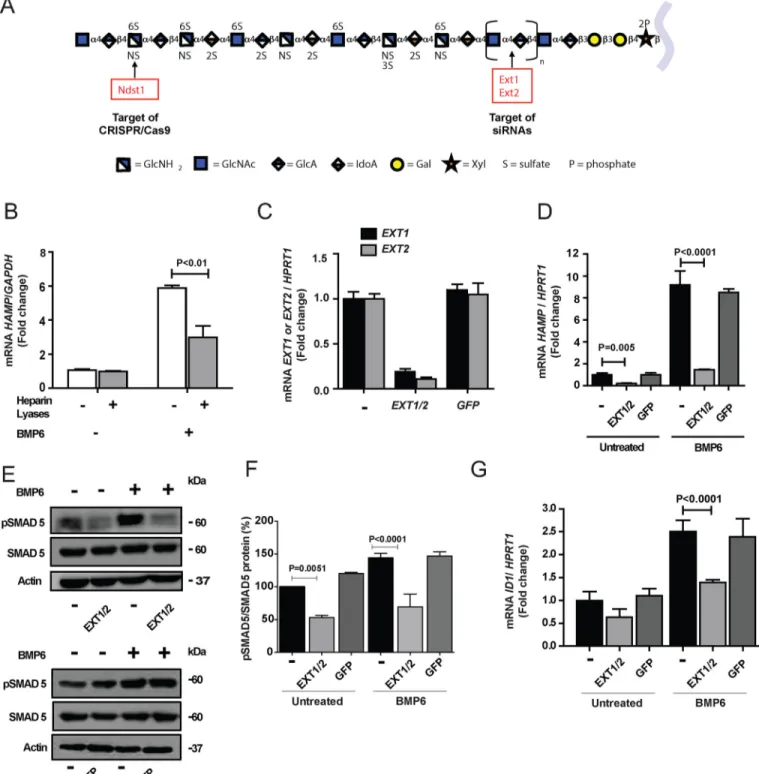
All cells express heparan sulfate proteoglycans (HSPGs), gly-coproteins that contain one or more heparan sulfate (HS) chains (Fig. 1A). Plasma membrane and extracellular matrix HSPGs can act as receptors for cytokines and growth factors, or as co-receptors for signaling complexes on the cell surface (18). In the present study we used a direct approach to examine the role of hepatocyte HS in hepcidin expression and iron homeostasis by genetic and pharmacologic alteration of HS in primary human hepatocytes, human hepatoma cells, murine hepatocytes, and in vivo in mice. The results show that hepatocyte HS is a master regulator of hepcidin expres-sion and iron homeostasis.
Results
Hepcidin expression in human hepatocytes depends on heparan sulfate
To examine if hepcidin expression depends on HS in primary human hepatocytes, we obtained cells through the Liver Tissue Cell Distribution System (see “Experimental Procedures”). BMP6 (50 ng/ml) stimulated 6-fold hepcidin expression, as mea-sured by qPCR of HAMP mRNA, compared with saline-treated cells (Fig. 1B). Partial degradation of cell surface and extracel-lular matrix HS with bacterial heparin lyases decreased HAMP expression significantly, indicating that HS in primary human hepatocytes facilitates BMP6-dependent induction of hepcidin expression (Fig. 1B). Similar results were obtained using hepa-tocarcinoma cells, a model for human hepatocytes (Fig. S1A).
The partial reduction of hepcidin mRNA expression induced by heparin lyase treatment could reflect incomplete removal of HS. To obtain additional evidence that HS regulates hepcidin expression, we silenced EXOSTOSIN 1 (EXT1) and EXT2 in human hepatocarcinoma cells with siRNAs. EXT1 and EXT2 encode components of the co-polymerase that alternately transfer glucuronic acid and GlcNAc units during HS chain elongation (Fig. 1A). Transfection of cells with siRNAs reduced mRNA levels of EXT1 and EXT2 by⬃80–90% (Fig. 1C) and expression of EXT1 and EXT2 proteins (Fig. S1B).
Simultane-ous silencing of EXT1 and EXT2 caused a dramatic reduction of
HAMPmRNA expression in naive cells and after stimulation with BMP6 (Fig. 1D). Silencing of EXT1 and EXT2 also reduced pSMAD5 in unstimulated cells and after stimulation with BMP6 (Fig. 1, E and F). Expression of ID1 (inhibitor of DNA binding protein 1), another marker of the BMP6/SMAD path-way, also was diminished, although not to the same extent (Fig. 1G). Control experiments using siRNA to GFP showed no impact on expression of EXT1, EXT2, HAMP, and ID1, or phos-phorylation of SMAD5 (Fig. 1, C–G). Together, these studies demonstrate that HS strongly regulates hepcidin mRNA expression in human hepatocytes.
Sulfation of HS influences hepcidin expression
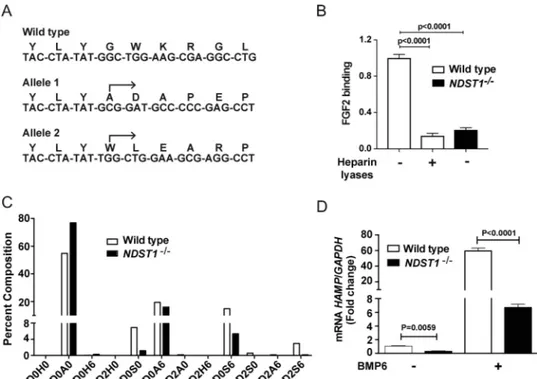
To study how the structure of HS influences hepcidin expres-sion, we inactivated NDST1 in Hep3B cells using CRISPR/Cas9 gene targeting technology. NDST1 initiates the sulfation of HS by N-deacetylation and N-sulfation of a subset of GlcNAc res-idues (Fig. 1A). Downstream processing of the chains by 6-O-sulfation of glucosamine residues and epimerization and 2-O-sulfation of uronic acids depends on prior NDST action. Thus, diminishing NDST1 expression depresses overall sulfation of the chains. A clonal line (NDST1⫺/⫺) was isolated bearing two independent frameshift alleles in exon 1 of NDST1 that caused premature stop codons in both alleles downstream from the frameshift (Fig. 2A). We noted markedly reduced NDST1 mRNA expression (82⫾ 3% reduction in NDST1⫺/⫺compared with WT) (Fig. S1C) and binding of fibroblast growth factor 2 (FGF2) to the mutant, which reflects the loss of cell surface HS, and the extent of reduction occurred similarly in WT cells treated with heparin lyases (Fig. 2B). Isolation of HS from the mutant and depolymerization of the chains into disaccharides showed that NDST1⫺/⫺cells exhibited a decrease of disaccha-rides bearing N-sulfoglucosamine residues (D0S0, D0S6, D2S0, and D2S6) and accumulation of nonsulfated disaccharides (D0A0). Overall N-sulfation of glucosamine residues was reduced by 73%, leading to⬃40% reduction in 6-O-sulfation of glucosamine residues and⬃90% reduction of 2-O-sulfation of uronic acids because of coupling of these downstream reactions to N-sulfation (Fig. 2C). The reduction of sulfation was incom-plete because of expression of NDST2 in the cell line, as observed in other cell types (19 –21). Nevertheless, the reduc-tion in sulfareduc-tion afforded by inactivareduc-tion of NDST1 expression reduced HAMP expression by 70% in the absence of BMP6 and by 90% after stimulation (Fig. 2D).
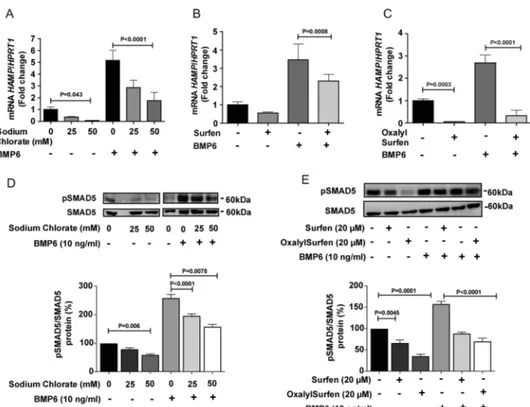
Pharmacological studies also demonstrated the dependence of HAMP expression on sulfation of HS. Sodium chlorate is an inhibitor of the universal sulfate donor 3 ⬘-phosphoadenyl-5⬘-phosphosulfate (PAPS) (22) and blocks sulfation of HS and other macromolecules. Treatment of hepatoma cells with 50 mMsodium chlorate caused a significant suppression of both unstimulated and BMP6-stimulated HAMP expression (Fig. 3A). The addition of 25–50 mMNaCl had no effect on HAMP
expression (Fig. S2A), indicating that the inhibitory effect of sodium chlorate was not because of changes in osmolarity of the medium.
Recently, we reported that surfen olyl-6-carbamide) and oxalylsurfen
olyl-6-oxalylamide) block HS-dependent processes by interfer-ence with protein-HS interactions (23, 24). Surfen reduced basal and BMP6 stimulated HAMP expression in HepG2 cells (Fig. 3B). The effect was greatly magnified in cells treated with the more
potent analog oxalylsurfen (⬎90% inhibition) (Fig. 3C), whereas treatment with the inactive analog hemisurfen had no effect on hepcidin expression (Fig. S2B). Cells treated with these different pharmacological agents showed reduced SMAD5
phosphoryla-Figure 1. Genetic and enzymatic reduction of HS reduces hepcidin expression and SMAD5 phosphorylation in human hepatocytes. A, a model for an
HS chain using the symbol nomenclature for glycans (42). B, primary human hepatocytes were treated for 30 min with a combination of heparin lyases I, II, and III (gray bars) to decrease cell surface and extracellular matrix HS and then stimulated for 6 h with BMP6 (50 ng/ml). HAMP mRNA was measured by qPCR in triplicate. The average values obtained were normalized to GAPDH mRNA and then expressed as -fold change over untreated cells (n⫽ 2). C, EXT1 and EXT2 mRNA expression was silenced in HepG2 cells by transfection of the corresponding siRNAs. As a control, some cells were transfected with siRNA directed to GFP (n⫽ 3). D, HAMP mRNA expression was measured 48 h after silencing of EXT1 and EXT2 (EXT1/2) with or without stimulation by BMP6 (10 ng/ml) during the last 6 h (n⫽ 3). An siRNA targeting GFP served as a negative control. E and F, Western blotting of pSMAD5 and SMAD5 after silencing EXT1/2 or GFP with or without stimulation with 10 ng/ml of BMP6. The bands were quantitated by ImageJ software and the values were normalized to SMAD5 as shown in (F). G, the expression of ID1 mRNA was evaluated 48 h after silencing of EXT1/2 or GFP with or without stimulation by 10 ng/ml BMP6 (n⫽ 3). In C, D, and G, the average values for mRNA expression were normalized to HPRT1 and scaled to the average value obtained from untreated cells.
tion after BMP6 challenge (Fig. 3, D and E). Together these find-ings show that interference with HS sulfation or HS-protein inter-actions results in diminished HAMP expression under basal conditions and after BMP6 stimulation.
Hepatocyte-specific inactivation of Ndst1 in mice reduces hepcidin expression and results in deficient iron homeostasis
As a segue to studying the impact of altering HS on hepcidin expression and iron homeostasis in mice, we obtained primary hepatocytes from control mice (Ndst1f/fAlbCre⫺) and mice
in which Ndst1 was inactivated specifically in hepatocytes (Ndst1f/fAlbCre⫹) (25). Ndst1f/fAlbCre⫹ hepatocytes showed loss of Ndst1 mRNA relative to the housekeeping gene,
TATA-box binding protein(Tbp) (Fig. 4A) and absence of NDST1 pro-tein (Fig. 4B). Inactivation of Ndst1 diminished basal and BMP6-stimulated Hamp expression (Fig. 4C) and SMAD5 phos-phorylation (Fig. 4D). Sulfation of HS is not completely abol-ished in Ndst1f/fAlbCre⫹hepatocytes (26); thus the impact of Ndst1inactivation on Hamp expression in murine hepatocytes was incomplete, but comparable to the reduction in NDST1⫺/⫺ human hepatoma cells (Fig. 2D).
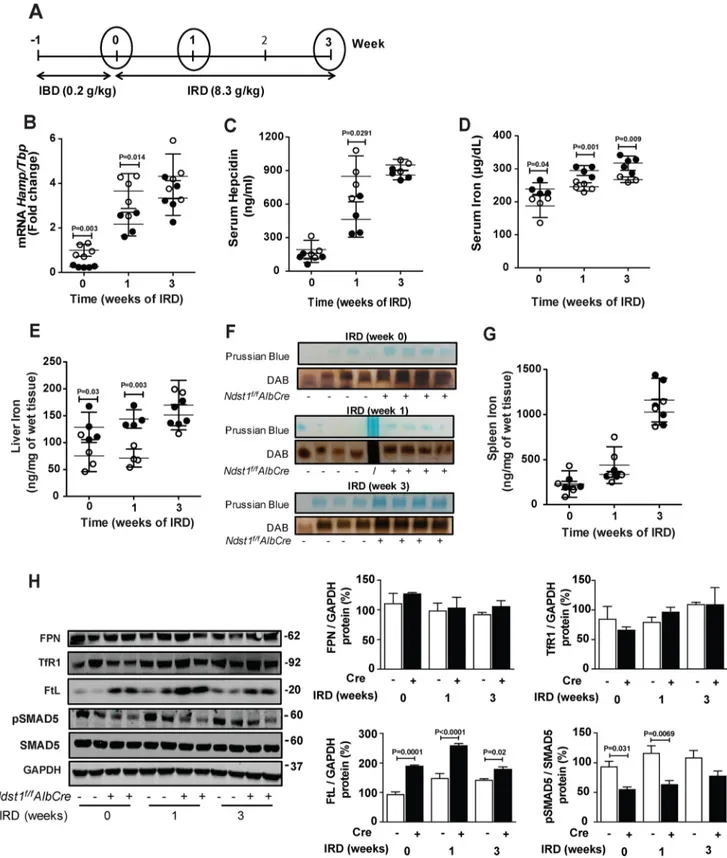
To study the impact of altering hepatic HS on iron metabo-lism in vivo, we measured Hamp mRNA, serum hepcidin, and iron levels in mutant and WT mice fed an iron-balanced diet (0.2 g/kg of carbonyl-iron) and after 1 and 3 weeks on an iron-rich diet (8.3 g/kg of carbonyl-iron) (Fig. 5A). Ndst1f/fAlbCre⫹
mice fed an iron-balanced diet exhibited 4-fold lower hepatic
Hamp mRNA expression than control mice (Fig. 5B, 0 time point). Serum hepcidin did not differ significantly (119 ⫾ 41
versus192⫾ 85 ng/ml) (Fig. 5C, 0 time point). Plasma iron levels were elevated in Ndst1f/fAlbCre⫹mice (240⫾ 20g/dl versus190⫾ 35g/dl, respectively) (Fig. 5D, 0 time point), as was liver iron content (130⫾ 30 ng/mg wet weight versus 76 ⫾ 30 ng/mg wet weight, respectively) (Fig. 5E) and ferritin-iron (Fig. 5F). No difference in spleen iron content was observed (Fig. 5G).
Iron overloading increases BMP6 expression (8, 9), thus pro-viding an in vivo system to study the impact of altering HS in hepatocytes on hepcidin expression. Iron-loading for 1 week greatly enhanced both Hamp mRNA and serum hepcidin in
Ndst1f/fAlbCre⫺ control mice, whereas the effect was
signifi-cantly less in Ndst1f/fAlbCre⫹mice (3.7⫾ 0.8 versus 2.2 ⫾ 0.5)
(Fig. 5B, 1 week). Serum hepcidin showed a similar trend (850⫾ 180 in the mutant versus 460⫾ 160 ng/ml in the control mice) (Fig. 5C). Serum iron levels increased as expected after 1 week of iron-loading, and their levels were consistently higher in the
Ndst1f/fAlbCre⫹mice (290⫾ 15g/dl versus 250 ⫾ 13 g/dl)
(Fig. 5D). Liver iron content was also elevated in the mutant compared with the WT after 1 week (140 ⫾ 17 ng/mg wet weight versus 71⫾ 17 ng/mg wet weight, respectively) (Fig. 5E). After 3 weeks on the iron-rich diet, the values for Hamp mRNA, serum hepcidin, and liver iron remained elevated, but the values for the mutant were similar to the control (Fig. 5, B,
Figure 2. Inactivation of NDST1 in Hep3B cells exhibits reduced hepcidin expression. A, sequence analysis of a region within exon-1 of NDST1 in WT Hep3B
cells and in a cloned cell line obtained by targeting NDST1 by CRISPR/Cas9 (NDST1⫺/⫺). The arrows indicate the start site of the altered DNA sequence in the mutant and the predicted amino acid sequence. Each allele results in a downstream frameshift mutation. B, FGF2 binding to WT and NDST1⫺/⫺Hep3B cells. Loss of NDST1 results in diminished binding of FGF2 to HS. A set of WT cells were treated with heparin lyases I, II, and III (5 milliunits/ml) prior to flow cytometry (n⫽ 3 biological replicates, each performed in duplicate). The data were analyzed using one-way ANOVA with Tukey’s multiple comparison test. C, HS from WT (white bars) and NDST1⫺/⫺(black bars) cells were digested with heparin lyases I, II, and III and the liberated disaccharides were analyzed by LC-MS: D0H6, ⌬UA-GlcNH26S; D2H0,⌬UA2S-GlcNH2; D0A0,⌬UA-GlcNAc; D0S0, ⌬UA-GlcNS; D2H6, ⌬UA2S-GlcNH26S; D0A6,⌬UA-GlcNAc6S; D0S6, ⌬UA-GlcNS6S; D2A0, ⌬UA2S-GlcNAc; D2S0, ⌬UA2S-GlcNS; D2A6, ⌬UA2S-GlcNAc6S; D2S6, ⌬UA2S-GlcNS6S; ⌬UA, 4,5-unsaturated uronic acid (43). Disaccharide analysis was per-formed on a pool of three sets of cells (n⫽ 3 biological replicates that were pooled and analyzed). D, WT and NDST1⫺/⫺cells were incubated with and without BMP6 (50 ng/ml) for 6 h and expression of HAMP mRNA was measured and normalized to GAPDH (n⫽ 2 wells). The data were analyzed using two-way ANOVA with uncorrected Fisher’s least significant difference post hoc test.
C, and E). Serum iron levels remained elevated at 3 weeks in the mutant compared with the WT (Fig. 5D). Ferritin-iron com-plexes also were significantly elevated in liver samples in the mutant compared with the control (Fig. 5F). Spleen iron con-tent rose dramatically with iron loading but showed no differ-ence between control and mutant mice (Fig. 5G).
Analysis of several proteins related to iron storage and metabolism showed that liver ferroportin (FPN) and transferrin
receptor (TfR1) did not differ in mutant and WT animals fed an iron-balanced diet (Fig. 5H, 0 time point). Under these condi-tions, ferritin L (FtL) was significantly elevated in the mutant. Liver pSMAD5 was reduced significantly in the mutant, which tracked with reduced Hamp mRNA expression (Fig. 5B) and a trend toward reduced serum hepcidin (Fig. 5C). Iron loading for 1–3 weeks did not alter expression of FPN or TfR1, but FtL remained elevated in the mutant (Fig. 5H). pSMAD5 remained
Figure 3. Pharmacological interference of HS-protein interactions blocks HAMP expression. A–C, HepG2 cells were treated with (A) the indicated
concentration of sodium chlorate for 3 days (n⫽ 3), (B) 20Mof surfen for 24 h (n⫽ 3), or (C) with 20Mof oxalylsurfen for 24 h (n⫽ 3). BMP6 (10 ng/ml) was added as indicated for the last 6 h of incubation. D, Western blotting of pSMAD5 and SMAD5 after treatment with the indicated concentration of sodium chlorate for 3 days and BMP stimulation. The bands were quantitated by ImageJ software and the values were normalized to SMAD5 (n⫽ 3). E, cells were treated with surfen or oxalylsurfen as indicated and pSMAD5 and SMAD5 were determined by Western blotting (n⫽ 3). A–C, values for mRNA expression were normalized to HPRT1 in the samples and expressed as the -fold change over untreated cells.
Figure 4. Reduction of HAMP expression and pSMAD5 in primary hepatocytes derived from Ndst1f/fAlbCreⴙmice. A, level of Ndst1 mRNA in hepatocytes derived from Ndst1f/fAlbCre⫺(control) and Ndst1f/fAlbCre⫹(mutant) mice. B, level of NDST1 protein. C, level of Hamp mRNA. D, SMAD5 phosphorylation in primary hepatocytes derived from Ndst1f/fAlbCre⫺and Ndst1f/fAlbCre⫹mice treated with different concentrations of BMP6 for 6 h. Densitometry was per-formed using ImageJ and the values were normalized to SMAD5 as indicated (n⫽ 2).
Figure 5. Iron metabolism in Ndst1f/fAlbCreⴙmice is altered. A, control Ndst1f/fAlbCre⫺mice and mutant Ndst1f/fAlbCre⫹mice were fed an iron-balanced diet (IBD) for 1 week (0 time point) and then switched to a iron-rich diet (IRD) for 1 or 3 weeks. B and C, Hamp mRNA (B) and serum hepcidin (C) were analyzed at the indicated time points. RNA expression was normalized to Tbp mRNA expression and the values were scaled to the values for the Ndst1f/fAlbCre⫺control at the 0 time point. D, serum iron was measured at 0, 1, and 3 weeks. E and G, nonheme iron was measured by spectrophoto-metric assay in (E) liver and (G) spleen. F, representative image of Prussian blue stain and DAB enhancement of ferritin-iron in the liver of Ndst1f/fAlbCre⫺ and Ndst1f/fAlbCre⫹mice at 0, 1, and 3 weeks of IRD. H, Western blot analysis of FPN, TfR1, FtL, pSMAD5, and SMAD5. The bands were quantitated with ImageJ and the values of pSMAD5 were normalized to SMAD5. All other band values were normalized to GAPDH (n⫽ 3 mice per group). Each point in B–F represents individual Ndst1f/fAlbCre⫺(open circles) and Ndst1f/fAlbCre⫹(filled circles) mice. Statistical analysis was performed by two-way ANOVA, t test and yielded the indicated p values.
depressed in the mutant (Fig. 5H), consistent with the reduc-tion in Hamp mRNA expression (Fig. 5B). As expected, Id1 expression increased with iron-loading in WT mice, whereas mutant mice exhibited no response, suggesting that BMP6 sig-naling was impaired in the mutant (Fig. S3A). Bmp6 expression in both control and mutant mice trended toward higher levels with iron-loading (Fig. S3B).
Modulation of HS decreases inflammation-induced activation of hepcidin expression
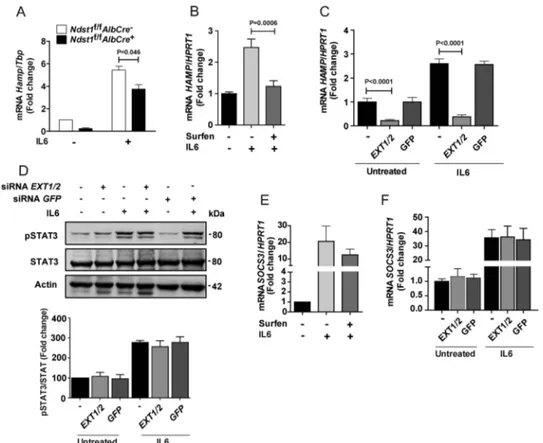
Inflammation also affects hepcidin expression and iron metabolism, mediated primarily through IL6/JAK/STAT3 signaling (5). To evaluate the impact of altering HS on inflammation-mediated activation of hepcidin expression, hepatocytes derived from Ndst1f/fAlbCre⫹ and Ndst1f/f AlbCre⫺animals were exposed to IL6 (50 ng/ml, 6 h). Both unstimulated and IL6-induced Hamp expression was reduced in the mutant (Fig. 6A). To confirm these findings, we treated hepatoma cells with surfen, which reduced IL6-induced stimulation of HAMP expression (Fig. 6B). Simi-larly, siRNA-mediated silencing of EXT1 and EXT2 dimin-ished both baseline and IL6-stimulated HAMP expression, whereas an siRNA directed against GFP had no effect (Fig. 6C). Surprisingly, silencing of EXT1 and EXT2 had no effect on STAT3 phosphorylation (Fig. 6D) or suppressor of
cyto-kine signaling 3 (SOCS3) expression, which is downstream of STAT3 (Fig. 6, E and F). Thus, the IL6 induction of hep-cidin expression depends on HS, but it occurs independently of STAT3 phosphorylation and SOCS3 expression.
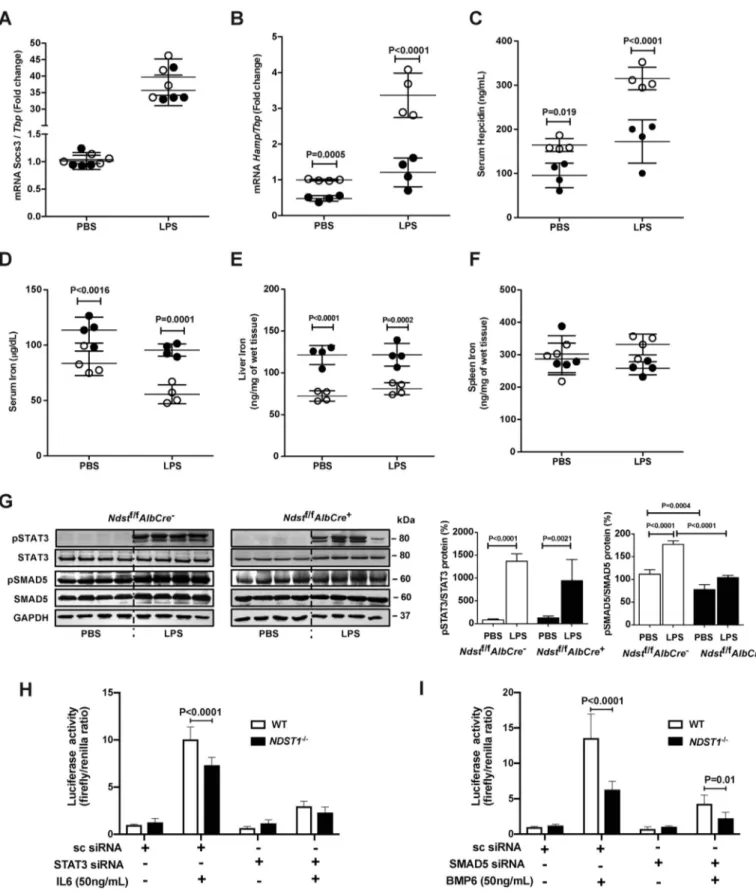
To examine the impact of an inflammatory challenge in
vivo, we injected Ndst1f/fAlbCre⫺and Ndst1f/fAlbCre⫹mice intraperitoneally with lipopolysaccharide (LPS). Previous studies have shown that LPS induces a robust increase in hepatic Socs3 and Hamp mRNA expression as well as a reduction of serum iron levels in mice (27). LPS induced a 30- to 40-fold increase in Socs3 mRNA expression in both
Ndst1f/fAlbCre⫹and Ndst1f/fAlbCre⫺mice (Fig. 7A). In
con-trast, Hamp mRNA expression was reduced nearly 3-fold in
Ndst1f/fAlbCre⫹mice compared with control mice (Fig. 7B).
This trend was mirrored by reduced serum hepcidin in the mutant (Fig. 7C). As expected, the reduced hepcidin level in the mutant after LPS injection was associated with higher serum and liver iron compared with control mice (Fig. 7, D and E). Although there was a trend toward reduced spleen iron in the mutant, the difference was not significant (Fig. 7F), and LPS induced strong STAT3 phosphorylation in both mice strains (Fig. 7G). These findings suggest that hepatic HS also plays a key role in the regulation of IL6-induced hepcidin expression in mice.
Figure 6. HS modulates IL6-induced HAMP mRNA expression in human hepatocytes. A, hepatocytes derived from Ndst1f/fAlbCre⫹and Ndst1f/fAlbCre⫺ mice were treated with IL6 (50 ng/ml, 6 h), and Hamp mRNA was quantitated by qPCR (n⫽ 2). B, HepG2 cells were treated with 20Msurfen, and IL6 (50 ng/ml) was added for 6 h. The cells were collected for HAMP mRNA quantification by qPCR (n⫽ 4–7). C, HepG2 cells were treated with siRNAs to EXT1 and EXT2 or to GFP and after 48 h HAMP mRNA expression was measured. IL6 (50 ng/ml) was added during the last 6 h as indicated. D, Western blot analysis of pSTAT3. The bands were quantitated with ImageJ and expressed relative to STAT3 and then normalized to the values obtained from the untreated control (n⫽ 2–4). E, SOCS3 mRNA expression was measured in HepG2 cells treated with 20Msurfen with and without IL6 (50 ng/ml, 6 h). The values were normalized to HPRT1 expression and scaled to the value obtained in the absence of surfen and IL6 (n⫽ 3). F, HepG2 cells were treated with siRNAs to EXT1 and EXT2 or to GFP and after 48 h SOCS3 mRNA expression was measured. IL6 (50 ng/ml) was added during the last 6 h in some of the cultures. Values for mRNA expression were normalized to HPRT1 in the samples and expressed as the -fold change over the untreated cells (n⫽ 3).
Figure 7. Reduced sulfation of HS in Ndst1f/fAlbCreⴙ decreases Hamp mRNA and plasma hepcidin after LPS injection. Ndst1f/fAlbCre⫹ and Ndst1f/fAlbCre⫺mice were fed an iron-balanced diet for 1 week and then treated with a single intraperitoneal dose of LPS (1 mg/kg). After 6 h, mice were sacrificed. A, liver Socs3 mRNA level was measured and normalized to Tbp mRNA. B, Hamp mRNA was measured in the liver and normalized to Tbp mRNA. C, serum hepcidin was measured before and after LPS treatment. D–F, serum iron (D), nonheme liver iron (E), and nonheme spleen iron (F) were measured by a spectrophotometric assay after PBS or LPS injection. G, hepatic pSTAT3 and pSMAD5 were measured by Western blotting. After quantitation of the bands by Image J, the values were normalized to STAT3 and SMAD5, respectively. H, Hep3B WT and NDST1⫺/⫺cells were transfected with pGL2Hamp-luciferase and pGL2TK-Renilla plasmid along with scrambled siRNA and STAT3 siRNA and stimulated with 50 ng/ml of IL6 for 6 h. Luciferase and Renilla activity were measured. I, Hep3B WT and NDST1⫺/⫺cells were transfected with pGL2Hamp-luciferase and pGL2TK-Renilla plasmid along with scrambled siRNA and SMAD5 siRNA and stimulated with 50 ng/ml of BMP6 for 6 h. Luciferase and Renilla activity were measured. n⫽ 2 biological experiment done in triplicate. The data in each of the panels were analyzed by two-way ANOVA with post hoc Bonferroni multiple comparison test.
The lack of effect of HS on IL6-induced STAT3 signaling suggested that an alternative pathway might be responsible for reduced Hamp expression and serum hepcidin. Evaluation of pSMAD5 in LPS-stimulated WT mice showed a significant increase, suggesting activation of the pathway. In the mutant, baseline of pSMAD5 was reduced as shown inFig. 5H. Impor-tantly, LPS did not stimulate SMAD5 phosphorylation above baseline in the mutant (Fig. 7G). To analyze the effect of hepa-ran sulfate on IL6/STAT3 pathway, we thepa-ransfected WT and NDST1-deficient Hep3B cells with a HAMP-luciferase reporter construct and measured luciferase activity upon stimulation with IL6 with and without siRNA silencing of STAT3. Silencing of STAT3 eliminated the heparan sulfate– dependent regula-tion of IL6-induced HAMP expression as measured by lucifer-ase activity (Fig. 7H). We performed a similar experiment to evaluate the impact of NDST deficiency on BMP6/SMAD5 pathway by siRNA silencing of SMAD5. Silencing of SMAD5 did not diminish BMP6-dependent HAMP expression (Fig. 7I). SMAD5 siRNA and STAT3 siRNA reduced SMAD5 and STAT3 mRNA levels, respectively, compared with scrambled siRNA in both WT and NDST1⫺/⫺cells (Fig. S4, A and B).
Discussion
In this paper, we provide genetic and pharmacological evi-dence for cell autonomous control over hepcidin expression by HS in human and murine hepatocytes. Moreover, the modula-tory effects of HS, demonstrable in cell culture, translate to altered iron homeostasis in vivo based on the accumulation of serum and liver iron in mice bearing a hepatocyte specific alter-ation of HS biosynthesis. Regulalter-ation of the system depends not only on the amount of HS produced, but also on its degree of sulfation and its capacity to interact with heparan sulfate– binding proteins.
The studies reported here provide the first direct evidence that hepatic HS alters iron metabolism. HS affects baseline, BMP6-stimulated, and IL6-stimulated hepcidin expression, suggesting a common underlying mechanism. However, siRNA-mediated reduction of STAT3 expression eliminated HS-dependent reg-ulation of IL6-induced HAMP-luciferase expression, whereas siRNA-mediated reduction of SMAD5 did not eliminate the HS dependence of BMP6 signaling.
The observation that surfen, sodium chlorate, and Ndst1 inactivation depressed hepcidin expression suggests that HS may act as a “ligand” for one or more factors central to iron regulation. Previous studies showed that exogenous heparin, a highly sulfated form of HS, inhibits hepcidin expression in hep-atoma cells and in mice (28 –30). Heparin inhibition of hepcidin expression in cells depends on 2-O-sulfated uronic acids and
N-sulfated/6-O-sulfated glucosamine residues and requires chains of⬎7 kDa (31), or⬃12 disaccharides. Mechanistically, heparin may block the interaction of BMP6 with type I BMP receptors, as both the ligand and the receptor bind to heparin (32–34). In a previous study we showed that the overexpression of heparanase, an endo--D-glucuronidase that cleaves HS,
reduced hepcidin expression and increased liver and serum iron concentration (35). Because heparanase is also involved in various signaling pathways not directly related to HS, this study was inconclusive. The results reported in the present paper
were essential to demonstrate the specific role of hepatic HS in hepcidin expression.
The findings reported here suggest the possibility that endogenous HS serves as a template to support the formation of a signaling complex on the cell surface between BMP6 and one or more BMP receptors. In the liver, this proposed complex might consist of receptors and protein ligands, as well as ancil-lary factors such as hemojuvelin and other co-activators of hep-cidin expression (36). The similar effects of altering HS on BMP6- and IL6-induced hepcidin expression and iron homeostasis deserve further study, especially in light of the observation that altering HS had no effect on SOCS3 expres-sion or STAT3 phosphorylation. Both systems may depend on formation of appropriate signaling complexes containing HS on the plasma membrane. Alternatively, the pathways may converge intracellularly through SMAD5 phosphorylation, that is reduced when the levels of HS are altered, as demonstrated in this study.
HS does not typically occur as free chains, but rather as pro-teoglycans. Thus, identification of the relevant HSPGs in hepa-tocytes would provide additional insight into the composition of the functional signaling complex. Hepatocytes express mul-tiple heparan sulfate proteoglycans, including several mem-brane proteoglycans (syndecans and glypicans), and the extra-cellular matrix proteoglycans perlecan, collagen 18, and agrin (37). Further studies are underway to identify the relevant pro-teoglycan(s) that modulate BMP6-dependent hepcidin expres-sion in cells. LPS induces dramatic proteolytic shedding of syn-decan-1 in the liver (37) but as shown here LPS increases hepcidin levels (Fig. 7), suggesting the participation of other proteoglycans in the regulation of hepcidin expression. The diminished effect of LPS in Ndst1f/fAlbCre⫹mice is consistent
with this idea and raises the possibility that other factors that regulate heparan sulfate proteoglycan expression and/or hepa-ran sulfate composition could impact iron homeostasis. Together, our findings introduce HS as a potential therapeutic target for treating disorders of iron metabolism.
Experimental procedures
Cells
Primary human hepatocytes were obtained from a public repository managed by the University of Minnesota under con-tract from the NIDDK at the National Institutes of Health (Liver Tissue Cell Distribution System). Cells were derived from resected liver sample from a 63-year-old female with a bleeding liver cyst (no chemotherapy history) and seeded in 6-well plates. The human hepatoma cell lines, HepG2 and Hep3B (American Type Culture Collection), were cultured in minimum essential medium (MEM, Gibco, Life Technologies) containing 10% endotoxin-free fetal bovine serum (FBS) (Sigma-Aldrich), 0.04 mg/ml gentamicin (Gibco), and 2 mM L-glutamine (Gibco) at 37 °C under an atmosphere of 5% CO2/
95% air. Mouse hepatocytes were isolated from 10-week-old animals as described previously (38). The cells were counted and seeded at 5 ⫻ 105cells/well in 6-well plate coated with
collagen (2.5 mg/ml in 0.5Macetic acid, Sigma-Aldrich).
Hepatic heparan sulfate regulates hepcidin expression
Pharmacological treatments
Hepatocytes were seeded in 12-well plates (1.5⫻ 105cells/
well) in the presence or absence of different concentrations of sodium chlorate or NaCl (25–50 mM) for 72 h or surfen,
oxalyl-surfen, or hemisurfen for 24 h (24). During the last 6 h, BMP6 (10 –50 ng/ml, R&D Systems), IL6 (50 ng/ml, ReliaTech), or PBS was added. Cells were collected for RNA extraction and evaluated for mRNA expression by qRT-PCR, or protein expression by Western blotting.
siRNA silencing and CRISPR/Cas9 mutagenesis
HepG2 was seeded in 12-well plates (1⫻ 105cells/well) in
MEM with 10% FBS. After 24 h the cells were transfected with siRNA for Ext1 and 2 or GFP siRNA (10 pmol each per well, Sigma-Aldrich) with RNAiMax (Life Technologies) according to the manufacturer’s instructions.
Mutant cell lines lacking GlcNAc N-deacetylase N-sulfo-transferase-1 (NDST1⫺/⫺) were generated using NDST1 guide RNAs designed according to Broad Institute published resources (39) and were synthesized by ValueGene. Guide RNAs (100M) were annealed using T4 polynucleotide kinase
(New England Biolabs) and integrated into vector pSp-Cas9(BB)-2A-Puro (a gift from Dr. Feng Zhang) using T7 ligase (New England Biolabs). The vectors were sequenced by Sanger sequencing to confirm their correct construction and trans-fected into Hep3B cells using Lipofectamine-2000 according to the manufacturer’s instructions. Transfected Hep3B cells were selected with puromycin (3g/ml) and single cell clones were isolated by limiting dilution. Mutations in the targeted region were determined by PCR amplification and Sanger sequencing.
Mice
Ndst1f/fAlbCre⫹ mice were generated and genotyped as described previously (25). Mice were weaned at 3 weeks, main-tained on a 12-hour light/12-hour dark cycle and fed ad libitum with water and standard rodent chow. All animals were housed and bred in vivaria approved by the Association for Assessment and Accreditation of Laboratory Animal Care located in the School of Medicine of UC San Diego, following standards and procedures approved by the UC San Diego Animal Subjects Committee under protocol S99127.
Control Ndst1f/fAlbCre⫺and mutant Ndst1f/fAlbCre⫹mice
(14 weeks old) were maintained on an iron-balanced diet (0.2 g/kg carbonyl-iron; 2Biological Instruments) for 1 week and then switched to an iron-rich diet (8.3 g/kg carbonyl-iron) for 1 or 3 weeks (4 –5 mice per group). To mimic an inflammatory stimulus, mice were treated intraperitoneally with 1 mg/kg lipopolysaccharide (Sigma-Aldrich) and euthanized after 6 h. Blood, liver, and spleen were collected for further analysis.
RNA preparation and qRT-PCR
Total RNA was isolated from tissues or cells using TRIzol Reagent (Ambion), according to the manufacturer’s instruc-tions. cDNA was generated by reverse transcription, using 1g RNA and SuperScript III Reverse Transcriptase kit (Invitro-gen). Samples were analyzed by quantitative RT-PCR (qRT-PCR) using PowerUp SYBR Green Master Mix (Life
Technolo-gies) according to the manufacturer’s instructions. All data are normalized to the expression of the proper housekeeping gene depending on the type of sample; specifically HPRT1 for HepG2, GAPDH for Hep3B, and primary human hepatocytes and Tbp (for murine-derived samples) and expressed by rela-tive quantification method (2⫺⌬⌬Ct). The primers are indicated inTable S1.
Immunoblot analysis and hepcidin ELISA
Mouse tissues or cell extracts were prepared using RIPA buffer (150 mMNaCl, 1% Nonidet P-40, 0.5% sodium deoxy-cholate, 0.1% SDS, 50 mMTris-HCl, pH 8, 50 mMDTT, 0.01
mg/ml leupeptin, and Protease Inhibitor Mixture (Roche)) or using a lysis buffer (200 mMTris-HCl, pH 8.0, 100 mMNaCl, 1
mMEDTA, 0.5% Nonidet P-40, 10% glycerol, 1 mMsodium
fluoride, 1 mMsodium orthovanadate, and cOmplete Protease
Inhibitor Mixture, Sigma-Aldrich). Protein was quantified by BCA assay (Thermo Scientific-Pierce). Samples (40 –50g of protein) were separated by 10 –14% SDS-PAGE and trans-ferred to Hybond-P Membrane (GE Healthcare). The primary antibodies used for immunoblotting were anti-L-ferritin
(Sigma-Aldrich, F5012); anti-GAPDH (OriGene Technolo-gies, TA802519); anti-phospho-SMAD5 (Abcam, RabMab AB92698); anti-phospho-STAT3, anti-SMAD5, anti-STAT3 (from Cell Signaling Technology, 9138S, 9517, and 9139, respectively); anti-actin (OriGene Technologies, TA890010); anti-TfR1 (Invitrogen, 136800); anti-ferroportin (Abnova, Novus Biologicals, NBP1–21502); and anti-EXT1, anti-EXT2, and anti-NDST1 (Santa Cruz Biotechnology, Ext1 Cod. sc-515144, Ext2 sc-514092, NDST1 Cod. sc-374529). After incubation with horseradish peroxidase– conjugated secondary antibod-ies, membranes were developed with SuperSignal West Pico Chemiluminescent Substrate (Thermo Scientific-Pierce) and visualized by imaging (Lycor Odyssey). Densitometric analysis was performed using ImageJ software. Mouse serum hepcidin1 was quantified using Hepcidin Murine-Compete ELISA Kit (Intrinsic LifeSciences) according to the manufacturer’s instructions.
Heparan sulfate analysis by liquid chromatography/mass spectrometry
Heparan sulfate was isolated from the cells as described pre-viously (40). Briefly, 1⫻ 106cells were digested with 0.4g/ml Pronase (Sigma-Aldrich) at 37 °C for 16 h and crude GAGs were isolated by anion exchange chromatography using DEAE-Sephacel (GE Healthcare). The columns were washed with 0.25
MNaCl and the glycosaminoglycans were eluted with 2MNaCl.
Heparan sulfate chains were depolymerized with heparin lyase I, II, and III (2 milliunits/ml of each) and unsaturated disaccha-rides were analyzed using glycan reductive isotope labeling liquid chromatography/mass spectrometry techniques as described elsewhere (40).
Iron quantification and Prussian blue staining
Spleen and liver iron content was determined spectrophoto-metrically as described previously with minor modifications (41). Briefly, 50 mg (wet weight) of tissue was incubated for 18 h at 65 °C in 3MHCl and 0.6MTCA. After centrifugation,
sam-Hepatic heparan sulfate regulates hepcidin expression
ples (10l) of clarified acid extract were added to 240 l of working chromogen reagent in a 96-well plate (1 volume of 0.1% bathophenanthroline sulfonate/1% thioglycolic acid solu-tion, 5 volumes of water, and 5 volumes of saturated sodium acetate). The solutions were then incubated for 30 min at room temperature and the absorbance measured at 535 nm in a plate reader. A standard curve was prepared with a precalibrated solution of FeCl3 (Sigma-Aldrich). Blood was collected and
serum iron was determined with a commercial kit (Serum Iron Kit, Randox Laboratories, Ltd.), according to the manufactu-rer’s instructions.
Liver homogenates were pretreated at 70 °C for 10 min to enrich the thermostable ferritins. Samples (equivalent to 50g of pretreated protein) were loaded on 8% nondenaturing PAGE and electrophoresed for 3 h at 160 V. The gels were washed with water and incubated in 2% ferrocyanide and 2% HCl for 1 h. To enhance the signal, the gels were incubated in 0.025% 3,3 ⬘-di-aminobenzidine (Sigma-Aldrich) and 0.05% H2O2in 20 mM
Tris HCl, pH 7.4, for 15–30 min. The reaction was blocked by washing with tap water.
HAMP promoter activity
Hepcidin promoter activity was measured as described pre-viously (29). Briefly, Hep3B WT and NDST1⫺/⫺ cells were transfected with scrambled, SMAD5, or STAT3 siRNAs, along with pGL2Hamp-luciferase and pGL2TK-Renilla plasmids (Promega). After 24 h, cells were treated with BMP6 (50 ng/ml) or IL6 (50 ng/ml) and incubated for 6 h. Luciferase activities were measured as described (29).
Statistics
Data are shown as mean⫾ S.D. or mean ⫾ S.E. as indicated in the figures. Generally, mRNA expression levels were scaled to control values and exhibited as -fold change or percentage. Comparison of values between untreated or treated cells and between Ndst1f/fAlbCre⫺and Ndst1f/fAlbCre⫹mice was
per-formed by unpaired, 2-tailed Student’s t test or two-way ANOVA. Multiple comparisons were corrected by Tukey’s test (GraphPad Prism Software). Differences were defined as signif-icant for p values⬍ 0.05 or ⬍ 0.001, respectively, and values are shown in the figures.
Author contributions—M. P. and J. D. E. conceptualization; M. P., F. A.-E.-K., and J. D. E. data curation; M. P., P. L. S. M. G., and J. D. E. formal analysis; M. P., F. A.-E.-K., M. A., P. R., M. G., and A. D. investigation; M. P., F. A.-E.-K., P. L. S. M. G., and J. D. E. writing-original draft; M. P., P. L. S. M. G., P. A., and J. D. E. writing-review and editing; P. L. S. M. G., P. A., and J. D. E. supervision.
References
1. Valore, E. V., and Ganz, T. (2008) Posttranslational processing of hepcidin in human hepatocytes is mediated by the prohormone convertase furin. Blood Cells Mol. Dis. 40,132–138CrossRef Medline
2. Ganz, T., and Nemeth, E. (2011) Hepcidin and disorders of iron metabo-lism. Annu. Rev. Med. 62, 347–360CrossRef Medline
3. Nemeth, E., Tuttle, M. S., Powelson, J., Vaughn, M. B., Donovan, A., Ward, D. M., Ganz, T., and Kaplan, J. (2004) Hepcidin regulates cellular iron efflux by binding to ferroportin and inducing its internalization. Science
306,2090 –2093CrossRef Medline
4. Armitage, A. E., Eddowes, L. A., Gileadi, U., Cole, S., Spottiswoode, N., Selvakumar, T. A., Ho, L. P., Townsend, A. R., and Drakesmith, H. (2011) Hepcidin regulation by innate immune and infectious stimuli. Blood 118, 4129 – 4139CrossRef Medline
5. Hentze, M. W., Muckenthaler, M. U., Galy, B., and Camaschella, C. (2010) Two to tango: Regulation of mammalian iron metabolism. Cell 142, 24 –38CrossRef Medline
6. Andriopoulos, B., Jr., Corradini, E., Xia, Y., Faasse, S. A., Chen, S., Grgurevic, L., Knutson, M. D., Pietrangelo, A., Vukicevic, S., Lin, H. Y., and Babitt, J. L. (2009) BMP6 is a key endogenous regulator of hepcidin expres-sion and iron metabolism. Nat. Genet. 41, 482– 487CrossRef Medline
7. Meynard, D., Kautz, L., Darnaud, V., Canonne-Hergaux, F., Coppin, H., and Roth, M. P. (2009) Lack of the bone morphogenetic protein BMP6 induces massive iron overload. Nat. Genet. 41, 478 – 481 CrossRef Medline
8. Kautz, L., Meynard, D., Monnier, A., Darnaud, V., Bouvet, R., Wang, R. H., Deng, C., Vaulont, S., Mosser, J., Coppin, H., and Roth, M. P. (2008) Iron regulates phosphorylation of Smad1/5/8 and gene expression of Bmp6, Smad7, Id1, and Atoh8 in the mouse liver. Blood 112, 1503–1509CrossRef Medline
9. Kautz, L., Besson-Fournier, C., Meynard, D., Latour, C., Roth, M. P., and Coppin, H. (2011) Iron overload induces BMP6 expression in the liver but not in the duodenum. Haematologica 96, 199 –203CrossRef Medline
10. Rausa, M., Pagani, A., Nai, A., Campanella, A., Gilberti, M. E., Apostoli, P., Camaschella, C., and Silvestri, L. (2015) Bmp6 expression in murine liver non parenchymal cells: A mechanism to control their high iron exporter activity and protect hepatocytes from iron overload? PLoS One 10, e0122696CrossRef Medline
11. Babitt, J. L., Huang, F. W., Wrighting, D. M., Xia, Y., Sidis, Y., Samad, T. A., Campagna, J. A., Chung, R. T., Schneyer, A. L., Woolf, C. J., Andrews, N. C., and Lin, H. Y. (2006) Bone morphogenetic protein signaling by hemojuvelin regulates hepcidin expression. Nat. Genet. 38, 531–539
CrossRef Medline
12. Silvestri, L., Pagani, A., Nai, A., De Domenico, I., Kaplan, J., and Cam-aschella, C. (2008) The serine protease matriptase-2 (TMPRSS6) inhibits hepcidin activation by cleaving membrane hemojuvelin. Cell Metab. 8, 502–511CrossRef Medline
13. Enns, C. A., Ahmed, R., and Zhang, A. S. (2012) Neogenin interacts with matriptase-2 to facilitate hemojuvelin cleavage. J. Biol. Chem. 287, 35104 –35117CrossRef Medline
14. Wahedi, M., Wortham, A. M., Kleven, M. D., Zhao, N., Jue, S., Enns, C. A., and Zhang, A. S. (2017) Matriptase-2 suppresses hepcidin expression by cleaving multiple components of the hepcidin induction pathway. J. Biol. Chem. 292,18354 –18371CrossRef Medline
15. Gao, J., Chen, J., De Domenico, I., Koeller, D. M., Harding, C. O., Fleming, R. E., Koeberl, D. D., and Enns, C. A. (2010) Hepatocyte-targeted HFE and TFR2 control hepcidin expression in mice. Blood 115, 3374 –3381
CrossRef Medline
16. Verga Falzacappa, M. V., Casanovas, G., Hentze, M. W., and Muckentha-ler, M. U. (2008) A bone morphogenetic protein (BMP)-responsive ele-ment in the hepcidin promoter controls HFE2-mediated hepatic hepcidin expression and its response to IL-6 in cultured cells. J. Mol. Med. 86, 531–540CrossRef Medline
17. Wang, R. H., Li, C., Xu, X., Zheng, Y., Xiao, C., Zerfas, P., Cooperman, S., Eckhaus, M., Rouault, T., Mishra, L., and Deng, C. X. (2005) A role of SMAD4 in iron metabolism through the positive regulation of hepcidin expression. Cell Metab. 2, 399 – 409CrossRef Medline
18. Xu, D., and Esko, J. D. (2014) Demystifying heparan sulfate-protein inter-actions. Annu. Rev. Biochem. 83, 129 –157CrossRef Medline
19. Ledin, J., Staatz, W., Li, J. P., Götte, M., Selleck, S., Kjellén, L., and Spillmann, D. (2004) Heparan sulfate structure in mice with genetically modified heparan sulfate production. J. Biol. Chem. 279, 42732– 42741
CrossRef Medline
20. Wang, L., Fuster, M., Sriramarao, P., and Esko, J. D. (2005) Endothelial heparan sulfate deficiency impairs L-selectin- and chemokine-mediated neutrophil trafficking during inflammatory responses. Nat. Immunol. 6, 902–910CrossRef Medline
21. Crawford, B. E., Garner, O. B., Bishop, J. R., Zhang, D. Y., Bush, K. T., Nigam, S. K., and Esko, J. D. (2010) Loss of the heparan sulfate sulfotrans-ferase, Ndst1, in mammary epithelial cells selectively blocks lobuloalveolar development in mice. PLoS One 5, e10691CrossRef Medline
22. Baeuerle, P. A., and Huttner, W. B. (1986) Chlorate—a potent inhibitor of protein sulfation in intact cells. Biochem. Biophys. Res. Commun. 141, 870 – 877CrossRef Medline
23. Schuksz, M., Fuster, M. M., Brown, J. R., Crawford, B. E., Ditto, D. P., Lawrence, R., Glass, C. A., Wang, L., Tor, Y., and Esko, J. D. (2008) Surfen, a small molecule antagonist of heparan sulfate. Proc. Natl. Acad. Sci. U.S.A.
105,13075–13080CrossRef Medline
24. Weiss, R. J., Gordts, P. L. S. M., Le, D., Xu, D., Esko, J. D., and Tor, Y. (2015) Small molecule antagonists of cell-surface heparan sulfate and heparin-protein interactions. Chemical Science 6, 5984 –5993CrossRef Medline
25. MacArthur, J. M., Bishop, J. R., Stanford, K. I., Wang, L., Bensadoun, A., Witztum, J. L., and Esko, J. D. (2007) Liver heparan sulfate proteoglycans mediate clearance of triglyceride-rich lipoproteins independently of LDL receptor family members. J. Clin. Invest. 117, 153–164CrossRef Medline
26. Foley, E. M., Gordts, P. L. S. M., Stanford, K. I., Gonzales, J. C., Lawrence, R., Stoddard, N., and Esko, J. D. (2013) Hepatic remnant lipoprotein clear-ance by heparan sulfate proteoglycans and low-density lipoprotein recep-tors depend on dietary conditions in mice. Arterioscler. Thromb. Vasc. Biol. 33,2065–2074CrossRef Medline
27. Kemna, E., Pickkers, P., Nemeth, E., van der Hoeven, H., and Swinkels, D. (2005) Time-course analysis of hepcidin, serum iron, and plasma cytokine levels in humans injected with LPS. Blood 106, 1864 –1866CrossRef Medline
28. Poli, M., Girelli, D., Campostrini, N., Maccarinelli, F., Finazzi, D., Luscieti, S., Nai, A., and Arosio, P. (2011) Heparin: A potent inhibitor of hepcidin expression in vitro and in vivo. Blood 117, 997–1004CrossRef Medline
29. Poli, M., Asperti, M., Naggi, A., Campostrini, N., Girelli, D., Corbella, M., Benzi, M., Besson-Fournier, C., Coppin, H., Maccarinelli, F., Finazzi, D., and Arosio, P. (2014) Glycol-split nonanticoagulant heparins are inhibi-tors of hepcidin expression in vitro and in vivo. Blood 123, 1564 –1573
CrossRef Medline
30. Poli, M., Asperti, M., Ruzzenenti, P., Mandelli, L., Campostrini, N., Mar-tini, G., Di Somma, M., Maccarinelli, F., Girelli, D., Naggi, A., and Arosio, P. (2014) Oversulfated heparins with low anticoagulant activity are strong and fast inhibitors of hepcidin expression in vitro and in vivo. Biochem. Pharmacol. 92,467– 475CrossRef Medline
31. Asperti, M., Naggi, A., Esposito, E., Ruzzenenti, P., Di Somma, M., Gryzik, M., Arosio, P., and Poli, M. (2015) High sulfation and a high molecular weight are important for anti-hepcidin activity of heparin. Front. Pharma-col. 6,316CrossRef Medline
32. Kuo, W. J., Digman, M. A., and Lander, A. D. (2010) Heparan sulfate acts as a bone morphogenetic protein coreceptor by facilitating
ligand-in-duced receptor hetero-oligomerization. Mol. Biol. Cell 21, 4028 – 4041
CrossRef Medline
33. Rider, C. C., and Mulloy, B. (2017) Heparin, heparan sulphate and the TGF- cytokine superfamily. Molecules 22, E713CrossRef Medline
34. Billings, P. C., Yang, E., Mundy, C., and Pacifici, M. (2018) Domains with highest heparan sulfate-binding affinity reside at opposite ends in BMP2/4 versus BMP5/6/7: Implications for function. J. Biol. Chem.
293,14371–14383CrossRef Medline
35. Asperti, M., Stuemler, T., Poli, M., Gryzik, M., Lifshitz, L., Meyron-Holtz, E. G., Vlodavsky, I., and Arosio, P. (2016) Heparanase overexpression duces hepcidin expression, affects iron homeostasis and alters the re-sponse to inflammation. PLoS One 11, e0164183CrossRef Medline
36. Poli, M., Asperti, M., Ruzzenenti, P., Naggi, A., and Arosio, P. (2017) Non-anticoagulant heparins are hepcidin antagonists for the treatment of ane-mia. Molecules 22, E598CrossRef Medline
37. Deng, Y., Foley, E. M., Gonzales, J. C., Gordts, P. L., Li, Y., and Esko, J. D. (2012) Shedding of syndecan-1 from human hepatocytes alters very low density lipoprotein clearance. Hepatology 55, 277–286CrossRef Medline
38. Gordts, P. L., Bartelt, A., Nilsson, S. K., Annaert, W., Christoffersen, C., Nielsen, L. B., Heeren, J., and Roebroek, A. J. (2012) Impaired LDL recep-tor-related protein 1 translocation correlates with improved dyslipidemia and atherosclerosis in apoE-deficient mice. PLoS One 7, e38330CrossRef Medline
39. Ran, F. A., Hsu, P. D., Wright, J., Agarwala, V., Scott, D. A., and Zhang, F. (2013) Genome engineering using the CRISPR-Cas9 system. Nat. Protoc.
8,2281–2308CrossRef Medline
40. Lawrence, R., Olson, S. K., Steele, R. E., Wang, L., Warrior, R., Cummings, R. D., and Esko, J. D. (2008) Evolutionary differences in glycosaminoglycan fine structure detected by quantitative glycan reductive isotope labeling. J. Biol. Chem. 283,33674 –33684CrossRef Medline
41. Roetto, A., Di Cunto, F., Pellegrino, R. M., Hirsch, E., Azzolino, O., Bondi, A., Defilippi, I., Carturan, S., Miniscalco, B., Riondato, F., Cilloni, D., Si-lengo, L., Altruda, F., Camaschella, C., and Saglio, G. (2010) Comparison of 3 Tfr2-deficient murine models suggests distinct functions for Tfr2-␣ and Tfr2- isoforms in different tissues. Blood 115, 3382–3389CrossRef Medline
42. Varki, A., Cummings, R. D., Aebi, M., Packer, N. H., Seeberger, P. H., Esko, J. D., Stanley, P., Hart, G., Darvill, A., Kinoshita, T., Prestegard, J. J., Sch-naar, R. L., Freeze, H. H., Marth, J. D., Bertozzi, C. R., et al. (2015) Symbol nomenclature for graphical representations of glycans. Glycobiology 25, 1323–1324CrossRef Medline
43. Lawrence, R., Lu, H., Rosenberg, R. D., Esko, J. D., and Zhang, L. (2008) Disaccharide structure code for the easy representation of constituent oligosaccharides from glycosaminoglycans. Nat. Methods 5, 291–292
CrossRef Medline