ORIGINAL ARTICLE
Conservation priorities of Iberoamerican pig breeds and their
ancestors based on microsatellite information
O Cortés
1, AM Martinez
2, J Cañon
1, N Sevane
1, LT Gama
3, C Ginja
4,5, V Landi
2, P Zaragoza
6, N Carolino
7,
A Vicente
7,8, P Sponenberg
9and JV Delgado
2for the BioPig Consortium
10Criollo pig breeds are descendants from pigs brought to the American continent starting with Columbus second trip in 1493. Pigs currently play a key role in social economy and community cultural identity in Latin America. The aim of this study was to establish conservation priorities among a comprehensive group of Criollo pig breeds based on a set of 24 microsatellite markers and using different criteria. Spain and Portugal pig breeds, wild boar populations of different European geographic origins and commercial pig breeds were included in the analysis as potential genetic influences in the development of Criollo pig breeds. Different methods, differing in the weight given to within- and between-breed genetic variability, were used in order to estimate the contribution of each breed to global genetic diversity. As expected, the partial contribution to total heterozygosity gave high priority to Criollo pig breeds, whereas Weitzman procedures prioritized Iberian Peninsula breeds. With the combined within- and between-breed approaches, different conservation priorities were achieved. The Core Set methodologies highly prioritized Criollo pig breeds (Cr. Boliviano, Cr. Pacifico, Cr. Cubano and Cr. Guadalupe). However, weighing the between- and within-breed components with FSTand 1-FST, respectively, resulted in higher contributions of Iberian breeds. In spite of the different
conservation priorities according to the methodology used, other factors in addition to genetic information also need to be considered in conservation programmes, such as the economic, cultural or historical value of the breeds involved. Heredity (2016) 117, 14–24; doi:10.1038/hdy.2016.21; published online 30 March 2016
INTRODUCTION
Pig breeds located in the Iberian Peninsula are mainly classified as Mediterranean and Celtic types. Mediterranean-type pigs (generally grouped in the Iberian trunk) include several breeds, sometimes divided into lineages, that display a high degree of phenotypic heterogeneity, even though they show a certain degree of genetic proximity (Gama et al., 2013). Celtic-type pigs derive from northern– central European pig breeds (Royo et al., 2007), and it is documented that Chinese germplasm was introduced in this group in the distant past (McGlone and Pond, 2003). On the other hand, the Mediterranean-type pig is assumed to be the pre-extant type in Iberian Peninsula. Currently, Mediterranean pigs are mainly located in the southwest of the Iberian Peninsula, in a Mediterranean ecosystem traditionally known as‘Dehesa’, whereas Celtic pig types have been raised in the Peninsula’s northern part. The second trip (1493) of Columbus took horses, cattle, sheep, goats and pigs from the Iberian Peninsula to America for thefirst time. The first pigs were taken to Haiti and subsequent arrivals to the American continent favoured their widespread expansion throughout Latin America under a wide range of environmental conditions, thus giving rise to the populations currently known as Criollo pigs. Currently, 17% of the world’s pigs are
located in South America where they are widespread from Mexico to Southern Argentina and from sea level to 4500 m of altitude (Benítez, 2000). Criollo pig breeds are characterized by their sexual precocity, poor reproductive efficiency, long lactations, low weaning weights but a better hardiness than commercial pig breeds (Linares et al., 2011). As a consequence of their distribution in many rural areas under diverse environmental conditions, pig production plays a key role in the social economy as a source of food and income in Latin America. Furthermore, Criollo pig breeds form part of the social traditions that reinforce local communities and their identities. There is a growing awareness of the importance of these breeds in terms of adaptive traits to specific (often extreme) environments and as genetic reservoirs, in addition to their historical or cultural value that plays a key role in the sustainable development of marginal rural areas (Ponzoni, 1997; Oldenbroek, 1999; Ruane, 1999). High levels of genetic diversity decrease the probability of extinction of a breed, as they give the breed a better chance of adapting to environmental and/ or production system changes in the future (Fisher, 1930). It is therefore necessary to implement policies focussed on the conserva-tion of genetic diversity, even more so in cases in which breed viability is threatened by inbreeding derived from reproductive isolation and
1Departamento de Producción Animal, Facultad de Veterinaria, Madrid, Spain;2Departamento de Genética, Universidad de Córdoba, Córdoba, Spain;3CIISA, Faculdade de
Medicina Veterinária, Universidade de Lisboa, Lisboa, Portugal;4Ce3C
—Centro de Ecologia, Evolução e Alterações Ambientais, Faculdade de Ciências, Universidade de Lisboa, Lisboa, Portugal; 5CIBIO-InBIO—Centro de Investigação em Biodiversidade e Recursos Genéticos, Universidade do Porto, Campus Agrário de Vairão, Vairão, Portugal; 6Laboratorio de Genética Bioquímica, Facultad de Veterinaria, Universidad de Zaragoza, Zaragoza, Spain;7Instituto Nacional de Investigação Agrária e Veterinária, I.P. Unidade
Estratégica de Investigação e Serviços de Biotecnologia e Recursos Genéticos Polo de Investigação da Fonte Boa, Vale de Santarém, Portugal;8Escola Superior Agrária, Instituto
Politécnico de Santarém, Vale de Santarém, Portugal and9Regional College of Veterinary Medicine, Virginia Tech, Blacksburg, VA, USA
Correspondence: O Cortés, Departamento de Producción Animal, Facultad de Veterinaria, Universidad Complutense de Madrid, Madrid 28040, Spain. E-mail: [email protected]
10Members of the consortium are listed before the references.
genetic drift. Several strategies have been developed in order to maintain the genetic diversity of a single population or breed. However, when a group of breeds is considered, new problems arise because in order to maintain the global genetic diversity some breeds may have to be prioritized relative to the others. In this context, the choice of a breed/s for conservation depends on its contribution to overall genetic diversity, and the importance of both between- and within-breed genetic variation must be considered and appropriately weighted in conservation decisions, even though the estimation of such contributions is not immediately obvious (Barker, 2001; Toro et al., 2002; Bruford, 2004; Ginja et al., 2013). Weitzman approach (Weitzman, 1992) is often used as a measure of the between-breed genetic diversity to calculate the partial contribution (PC) of each breed to total genetic diversity. This methodology is ultimately based on the pairwise genetic distances between operational taxonomical units. However, this approach, which prioritizes breeds that are more differentiated, has been criticized for not considering within-breed information (Ruane, 1999; Toro et al., 2009). On the other hand, the contribution of within-breed genetic diversity to total diversity could be estimated by the loss or gain of the global heterozygosis when each breed is removed from the metapopulation. Taking into account that both within- and between-components of genetic diversity should be considered to maximize the retention of genetic diversity, various weights applied to each component have been developed (Caballero and Toro, 2002; Piyasatianand Kinghorn, 2003; Olivier et al., 2005). For example, Olivier and Foulley (2005) combined the two compo-nents by weighing Weitzman approach by the degree of breed differentiation (Wright’s fixation index FST (Fisher, 1930) and the
within-breed diversity component, measured as the global loss or gain in heterozygosity when a breed is removed, weighted by 1-FST.
However, a general consensus regarding the appropriate weight and the methodology that better combines both sources of information has not been reached. Notwithstanding the limitations of the above methodologies, different alternatives have been proposed that combine both sources of information based on kinship coefficients. Although initially these methodologies considered genealogical information in the absence of pedigree connections, as is often the case when various breeds are considered, molecular markers have proved efficient to estimate between-breed kinships and, as an extension, they have been used to weigh the contribution of each breed to total genetic diversity (Cañón et al., 2011; Ginja et al., 2013). Eding and Meuwissen (2001) proposed a Core Set methodology with the aim of minimizing the global coancestry of the metapopulation based on molecular marker kinship estimations (MEK). The same authors later proposed two extensions of MEK based on log-linear regressions, obtained with the weighted log-linear model (WLM) or the weighted log-linear mixed model (WLMM) (Eding and Meuwissen, 2001, 2003), using average molecular coancestries (fm) based on allele frequencies (Caballero and Toro, 2002).
Another methodology for combining within- and between-breed information that weights the within-contribution (based on average coancestries of each breed) and between-contribution (based on genetic distances) equally was developed by Caballero and Toro (2002) and Faubel et al. (2004). In spite of the different methodologies proposed, there is no definite recommendation related to the relative importance of the between- and within-components of genetic diversity, and how they should be weighed in establishing conservation priorities.
Several studies have estimated the genetic diversity of pig breeds worldwide (Faubel et al., 2004; Ollivier and Foulley, 2005; Vicente et al., 2008; Burgos-Paz et al., 2013; Gama et al., 2013;
Herrero-Medrano et al., 2013; Ramírez et al., 2014; Revidatti et al., 2014). Among those studies, specific results have been published based on the same set of breeds and microsatellites assessed here, reporting the genetic relationships among Iberian Peninsula pig breeds (Gama et al., 2013) and Criollo pig breeds (Revidatti et al., 2014). In addition, Gama et al. (2013) briefly evaluated conservation priorities among Iberian pig breeds considering the current levels of within- and between-breed genetic diversity. However, a comprehensive analysis in terms of conservation priorities of Criollo breeds is lacking, in spite of their importance in the social economy, where they play a major role as a source of food and income. In the present study, a comprehensive sampling of Criollo pig breeds and their ancestors (Iberian and Commercial pig breeds) were jointly analysed in order to evaluate conservation priorities based on different methodologies that con-sidered either within-breed, or between-breed or both genetic diversity components.
MATERIALS AND METHODS Sampling and genotyping
A total of 1670 samples belonging to 45 populations/breeds from the Iberian Peninsula (Spain and Portugal), Europe (local and commercial breeds) and America were analysed (Supplementary Figure 1 and Table 1). Individual genotypes have been previously reported by Gama et al. (2013) for Iberian Peninsula breeds and by Revidatti et al. (2014) for Criollo pig breeds for a panel of 24 microsatellites recommended for genetic diversity studies by the International Society for Animal Genetics/Food and Agriculture Organization of the United Nations. In addition, wild boar samples from four different European geographic locations (Spain, Portugal, Italy and Poland) that covered the two major mitochondrial DNA haplogroups observed in the continental European wild boars (E1a and E1c) (Scandura et al., 2011) were included in the analysis.
Commercial (Duroc, Pietrain, Large White and Landrace) and the remaining European local pig breeds (Berkshire, Tamworth and Large Black) were genotyped for the same panel of 24 microsatellites used in Gama et al. (2013) and Revidatti et al. (2014): IGF1, S0002, S0005, S0026, S0068, S0090, S0101, S0155, S0178, S0215, S0225, S0226, S0227, S0228, S0355, S0386, SW024, SW072, SW240, SW632, SW857, SW911, SW936 and SW951. Laboratory protocols have been described in detail in Gama et al. (2013) and Revidatti et al. (2014) and allele nomenclature was standardized according to the ISAG (International Society for Animal Genetics) Pig Comparison Test.
All the European pig breeds included in the analysis are officially recognized and are registered in herdbooks except for Negro de Formentera (NFO) and Negro de los Pedroches (NPE). However, the Criollo pig populations analysed are bred under quite different management systems, and most of them are known by their geographical location rather than receiving an official breed recognition. Therefore, the Criollo animals included in our analyses were not enrolled in official herdbooks, but they belong to what is considered the traditional type of the Criollo population that they belong to.
Two different analyses were carried out: (1) each breed was considered as a unit without any grouping; (2) breeds were grouped based on a previous analysis of their genetic relationships (Gama et al., 2013; Revidatti et al., 2014). In this case, Iberian breeds were divided in two groups (Mediterranean and Celtic) based on the neighbour-net drawn from Nei’s DA genetic distance and STRUCTURE results previously reported by Gama et al. (2013). According to their geographic origin, local European pig breeds (Large Black, Berkshire and Tamworth) were included in the Celtic group. Criollo and commercial pig breeds were grouped according to Revidatti et al. (2014) and Martinez (data not shown). Therefore, the breeds analysed were grouped as follows: Celtic group (CT): Chato Murciano (CHM), Berkshire (BRK), Large Black (LBL), Tam-worth (TWR), Malhado de Alcobaça (MAL), Negro Canario (NCA), Celta (CEL) and Bisaro (BIS); Mediterranean group (MD): Manchado de Jabugo (MJA), Euskal Txerria (ETX), Negro de Formentera (NFO), Mangaliça (MAN), Torbiscal (TOR), Retinto (RET), Entrepelado (ENT), Lampiño (LAM), Alentejano (ALE), Negro de los Pedroches (NPE) and Negro Mallorquin (NMA); Commercial 1 (C1): Duroc (DUR); and Commercial 2 (C2): Landrace
(LAN), Large White (LWH), Pietrain (PIE) and Large White × Landrace crosses (LXW). Criollo breeds were grouped in three groups: Criollo A (CA): Mulefoot (MFT), Pampa Rocha (PRC), Caracolero Wet (NEW), Criollo Boliviano (BOL), Criollo El Salvador (SAL), Criollo Pacifico (CCP) and Caracolero Dry (NED); Criollo B (CB): Red Wattle Hog (RWH), Criollo Cubano (CUB), Pelon Mexicano (MEX), Zungo (ZUN), New Mexico (BCS), Criollo Venezolano (VEN) and Criollo Ecuatoriano (ECU); and Criollo C (CC): Guinea Hog (GHO), Criollo Guadalupe (GUA) and Sanpedreño (SPD). Finally, all wild boar samples were included in a single group comprising the following populations: wild boar from Italy (IWB), Spain (SWB), Portugal (PWB) and Poland (EWB).
For a better understanding of the statistical methodologies used, the different approaches were classified as follows: methods that considered (1) between-breed (Weiztman) or (2) within-between-breed (Heterozygosity) genetic diversity; methods that combined (3) Weitzman and Heterozygosity procedures; methods that (4) minimize the overall kinship coefficients (Core Set) and finally a combined approach that considered (5) coancestry (within) and Nei’s genetic distance (between) sources of information.
Weitzman procedure
The Reynold genetic distance (Reynolds et al., 1983) was used in the algorithm described by Weitzman (1992) to calculate the partial contribution (PCWE) of
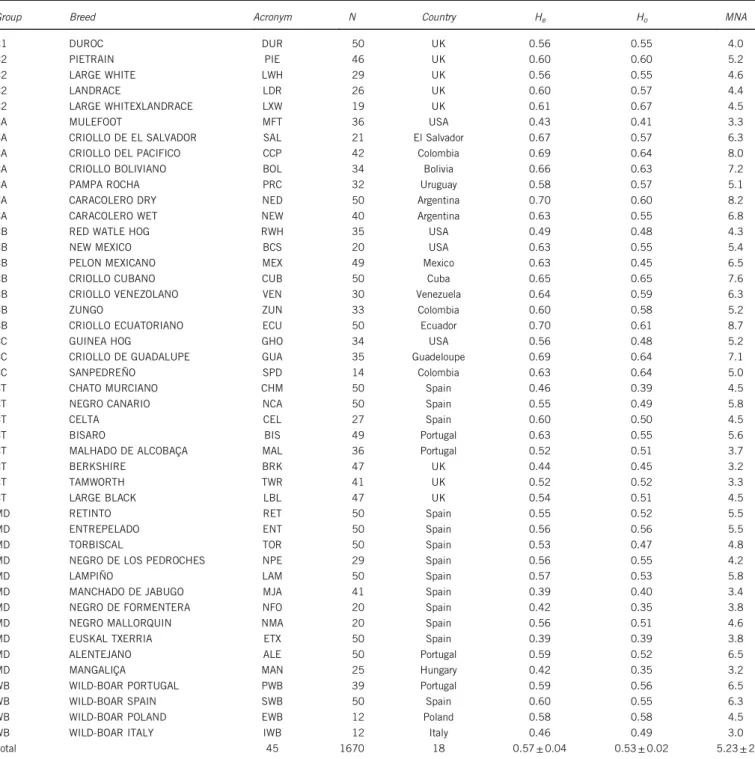
Table 1 Breed groups, breed names, acronyms, number of samples genotyped per breed (N), country of origin, mean observed (Ho) and
expected heterozygosities (He) and mean number of alleles per locus (MNA) estimated with 24 microsatellites in 45 pig breeds
Group Breed Acronym N Country He Ho MNA
C1 DUROC DUR 50 UK 0.56 0.55 4.0 C2 PIETRAIN PIE 46 UK 0.60 0.60 5.2 C2 LARGE WHITE LWH 29 UK 0.56 0.55 4.6 C2 LANDRACE LDR 26 UK 0.60 0.57 4.4 C2 LARGE WHITEXLANDRACE LXW 19 UK 0.61 0.67 4.5 CA MULEFOOT MFT 36 USA 0.43 0.41 3.3
CA CRIOLLO DE EL SALVADOR SAL 21 El Salvador 0.67 0.57 6.3
CA CRIOLLO DEL PACIFICO CCP 42 Colombia 0.69 0.64 8.0
CA CRIOLLO BOLIVIANO BOL 34 Bolivia 0.66 0.63 7.2
CA PAMPA ROCHA PRC 32 Uruguay 0.58 0.57 5.1
CA CARACOLERO DRY NED 50 Argentina 0.70 0.60 8.2
CA CARACOLERO WET NEW 40 Argentina 0.63 0.55 6.8
CB RED WATLE HOG RWH 35 USA 0.49 0.48 4.3
CB NEW MEXICO BCS 20 USA 0.63 0.55 5.4
CB PELON MEXICANO MEX 49 Mexico 0.63 0.45 6.5
CB CRIOLLO CUBANO CUB 50 Cuba 0.65 0.65 7.6
CB CRIOLLO VENEZOLANO VEN 30 Venezuela 0.64 0.59 6.3
CB ZUNGO ZUN 33 Colombia 0.60 0.58 5.2
CB CRIOLLO ECUATORIANO ECU 50 Ecuador 0.70 0.61 8.7
CC GUINEA HOG GHO 34 USA 0.56 0.48 5.2
CC CRIOLLO DE GUADALUPE GUA 35 Guadeloupe 0.69 0.64 7.1
CC SANPEDREÑO SPD 14 Colombia 0.63 0.64 5.0
CT CHATO MURCIANO CHM 50 Spain 0.46 0.39 4.5
CT NEGRO CANARIO NCA 50 Spain 0.55 0.49 5.8
CT CELTA CEL 27 Spain 0.60 0.50 4.5
CT BISARO BIS 49 Portugal 0.63 0.55 5.6
CT MALHADO DE ALCOBAÇA MAL 36 Portugal 0.52 0.51 3.7
CT BERKSHIRE BRK 47 UK 0.44 0.45 3.2
CT TAMWORTH TWR 41 UK 0.52 0.52 3.3
CT LARGE BLACK LBL 47 UK 0.54 0.51 4.5
MD RETINTO RET 50 Spain 0.55 0.52 5.5
MD ENTREPELADO ENT 50 Spain 0.56 0.56 5.5
MD TORBISCAL TOR 50 Spain 0.53 0.47 4.8
MD NEGRO DE LOS PEDROCHES NPE 29 Spain 0.56 0.55 4.2
MD LAMPIÑO LAM 50 Spain 0.57 0.53 5.8
MD MANCHADO DE JABUGO MJA 41 Spain 0.39 0.40 3.4
MD NEGRO DE FORMENTERA NFO 20 Spain 0.42 0.35 3.8
MD NEGRO MALLORQUIN NMA 20 Spain 0.56 0.51 4.6
MD EUSKAL TXERRIA ETX 50 Spain 0.39 0.39 3.8
MD ALENTEJANO ALE 50 Portugal 0.59 0.52 6.5
MD MANGALIÇA MAN 25 Hungary 0.42 0.35 3.2
WB WILD-BOAR PORTUGAL PWB 39 Portugal 0.59 0.56 6.5
WB WILD-BOAR SPAIN SWB 50 Spain 0.60 0.55 6.3
WB WILD-BOAR POLAND EWB 12 Poland 0.58 0.58 4.5
WB WILD-BOAR ITALY IWB 12 Italy 0.46 0.49 3.0
each breed to total genetic diversity. Because of the large number of breeds analysed, the application of Weitzman formula is too computationally intensive and not practical, and hence an approximation described by Garcia et al. (2005) was used when each breed was considered as a unit. Thresholds ranging from 0.5 to 0.25 were used to test the coherence of the results. The threshold corresponds to the coefficient of variation of the diversity matrix. In this procedure, in each iteration, the coefficient of variation is assessed, and if it is lower than the threshold, the approximation is launched; otherwise the exact algorithm is applied. Therefore, the lower the threshold, the more accurate the results will be, at the expense of computation time. A threshold of 0.25 was finally used to assess breed contributions to the overall diversity.
Heterozygosity
Observed and unbiased expected heterozygosities and average number of alleles per locus were obtained with microsatellite toolkit (Park, 2001). The partial contribution (PCHe) of each breed to the total genetic diversity was estimated as
the proportion of heterozygosis lost when each breed or group is removed from the data set.
Weitzman and heterozygosity combined approaches
In afirst set of analyses, PCWEand PCHewere analysed together in order to
assess the contribution of within- and between-breed information to total genetic diversity. Ollivier et al. (2005) proposed an aggregate diversity equation that uses Wright’s FSTto weight between- and within-breed genetic diversities as: PCFST= PCWE× FST+PCHe× (1-FST). F-statistics were estimated according to Weir and Cockerham (1984) using GENETIX 4.05.2 software (Belkhir et al., 1996–2004) In addition, Piyasatian and Kinghorn (2003) suggested an alternative aggregate approximation that gives greater weight to the between-breed component: PC5:1= 0.833 × PCWE+(1− 0.833) × PCHe, and this
proce-dure was also assessed in our data set.
Core Set methodologies
The Core Set methodology of Eding et al. (2002) combines within- and between-breed information with the goal of minimizing the kinship coefficient of the metapopulation. Because of the absence of genealogical data, MEK (Eding and Meuwissen, 2001) and their extensions, that is, the WLM and WLMM, were used (Eding and Meuwissen, 2003). A matrixM containing the average MEK between and within populations is constructed, and the relative contributions of each population are estimated in such a way that the average MEK in the Core Set is minimal. However, because of sampling errors in the relationships matrix, it is possible tofind negative values. In this scenario, an iterative process assigns a zero to the more negative value and recalculates the contributions after removal of that population, until all contributions are equal to or greater than zero. Eding and Meuwissen (2003) described two variations of MEK based on log-linear regression obtained with the WLM, which is designed to further reduce the number of zero contributions, and WLMM, which allows for only one null contribution, and hence it is easier to establish a ranking of all populations for conservation priorities.
Finally, average molecular coancestries based on allele frequencies (fm), estimated as described by Caballero and Toro (2002), were also used. The MEK, WLM and WLMM were estimated following the methodology described in Cañón et al. (2011) that is based on Eding and Meuwissen (2001) for MEK and Eding and Meuwissen (2003) for WLM and WLMM. Partial contributions to the overall genetic diversity for each methodology (PCMEK, PCWLM,
PCWLMM, PCfm) were estimated with a FORTRAN programme developed by
Eding and Meuwissen (2003).
Coancestry and Nei’s genetic distance combined approach
This methodology combined both sources of information but considered other estimations for between- and within-breed genetic diversity than Weitzman and Heterozygosity approaches. Caballero and Toro (2002) and Fabuel et al. (2004) proposed this methodology using the same rationale behind the Core Set method. Based on the definition of diversity as the opposite of average coancestry, they partitioned the coancestry in two components. The within-breed genetic diversity estimated as the average coancestry for each within-breed and the between-breed component estimated as the average minimum Nei’s
distance for each breed to the others. This methodology considers different weights for each population proportionally to the effective or the actual population size, and in the absence of this information, sample sizes can be used. However, under this scenario, the accuracy of the contributions estimated depends on the similarity among the ratio of breed sample size to total sample size and the ratio of breed population size to total population size. These estimates were also calculated ignoring sample sizes, as suggested by Faubel et al. (2004).
RESULTS
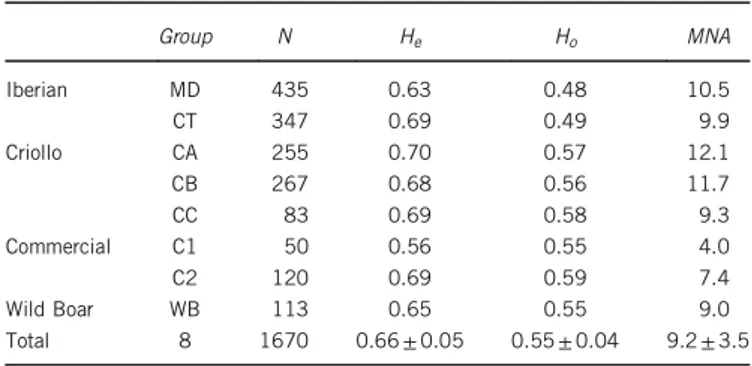
A total of 348 alleles were detected across the 24 autosomal microsatellite markers analysed. The mean number of allele/locus per breed (Table 1) was 5.2± 2, ranging from 3.2 (Mangalica and Berkshire) to 8.7 (Cr. Ecuatoriano). Expected and observed hetero-zygosities by breed (Table 1) ranged from 0.39 to 0.7 and from 0.35 to 0.67, respectively. Generally, Mediterranean and Celtic pig breeds had lower expected and observed heterozygosities than Criollo pig breeds. The mixed origin of the Landrace × Large White population probably explains its high observed heterozygosity. When the pig breeds were grouped in Mediterranean, Celtuc, Criollo, Commercial and Wild Pig categories, the expected heterozygosity values increased because of the reproductive isolation among the breeds grouped; as could be anticipated, the differences among Heand Howere also greater than
in individual pig breeds because of substructuring (Table 2). Weitzman and heterozygosity procedures
The partial contributions of each pig breed to total genetic diversity according to the different thresholds following Weitzman procedure (PCWE) are shown in Table 3. The results show that a total of 17 pig
breeds were prioritized for conservation (contributions greater than 3), mainly consisting of exotic, some Mediterranean and some Celtic pig breeds (represented in bold in Table 3). The second group prioritized for conservation (contributions between 2 and 3) and was formed by seven pig breeds (Landrace, Negro Mallorquin, Wild Boar-Poland, Wild Boar-Portugal, Pietrain, Large White × Landrace, Pampa Rocha and Negro de los Pedroches). The remaining pig breeds had lower PCWE and were of the Criollo type. As expected, the PCHe
showed opposite results to PCWE(Table 3) and, with a few exceptions,
Criollo pig breeds had the highest PCHe. The majority of the
Mediterranean and Celtic pig breeds were not prioritized for conservation under this criterion, and recent well-documented bottlenecks (Gama et al., 2013) could explain their negative estimated PCHevalues.
Table 2 Breed groups, number of samples genotyped per group (N), mean observed (Ho) and expected heterozygosities (He) and mean
number of alleles per locus (MNA) estimated with 24 microsatellites in 8 pig groups Group N He Ho MNA Iberian MD 435 0.63 0.48 10.5 CT 347 0.69 0.49 9.9 Criollo CA 255 0.70 0.57 12.1 CB 267 0.68 0.56 11.7 CC 83 0.69 0.58 9.3 Commercial C1 50 0.56 0.55 4.0 C2 120 0.69 0.59 7.4 Wild Boar WB 113 0.65 0.55 9.0 Total 8 1670 0.66± 0.05 0.55± 0.04 9.2± 3.5
When pig breeds were analysed by group (Table 4), commercial groups (C1 and C2) showed greater PCWE, whereas Criollo groups,
CA and CB had lower contributions to overall diversity. In addition, MD and CT considerably reduced their PCWEas a consequence of
their higher genetic heterogeneity that reduced differences with respect to the other breed groups. On the other hand, CA and C2 had the
highest PCHe(41), whereas a total of three groups had negative PCHe
(MD, C1 and WB).
Overall, the C2 group had both high PCHEand PCWEvalues, even
though these estimates are considered to represent distinct sources of information regarding contributions to global genetic diversity. There-fore, the results indicate that the breeds in this group not only have a Table 3 Contributions of pig breeds to overall genetic diversity according to: Weitzman method (PCWE), proportional variation of expected
heterozygosity (PCHe), aggregate diversity (PCFst), the Piyasatian and Kinghorn equation (PC5:1), marker estimated kinships (MEKs), weighted
log-linear model (WLM), weighted log-linear mixed model (WLMM) and average coancestries (fm)
Group Acronym PCWE PCHe PCWE-PHecombined approaches Core Set
PCFst PC5:1 PCMEK PCWLM PCWLMM fm C1 DUR 3.7 − 0.03 0.74 3.11 0 0.00433 0.027 0.019 C2 LWH 4.5 0.09 1.00 3.77 0.105 0.08 0.035 0.158 C2 PIE 2.2 0.17 0.59 1.88 0 0.01 0.028 0 C2 LDR 2.5 0.28 0.73 2.11 0.055 0.06 0.028 0.093 C2 LXW 2.2 0.32 0.71 1.88 0.063 0 0.030 0.029 CA MFT 4.8 − 0.47 0.61 3.92 0 0 0.010 0 CA PRC 2.1 0.13 0.53 1.74 0 0 0.016 0 CA NED 0.8 0.22 0.34 0.72 0 0 0.021 0 CA BOL 0.9 0.33 0.44 0.78 0 0.20 0.036 0.138 CA SAL 0.3 0.43 0.40 0.32 0 0 0.023 0 CA CCP 0.8 0.59 0.63 0.75 0.206 0.03 0.027 0.074 CA NEW 0.4 0.60 0.55 0.41 0.056 0.01 0.027 0 CB RWH 4.1 − 0.23 0.65 3.34 0 0 0.014 0 CB CUB 0.6 − 0.10 0.03 0.45 0 0.32 0.036 0 CB MEX 0.5 0.18 0.25 0.45 0 0 0.022 0 CB ZUN 1.2 0.18 0.38 1.00 0 0 0.023 0 CB BCS 0.9 0.22 0.37 0.82 0 0.01 0.027 0.086 CB VEN 1.1 0.31 0.46 0.93 0 0.02 0.026 0 CB ECU 0.3 0.56 0.51 0.34 0 0 0.026 0.029 CC GHO 3.7 − 0.02 0.75 3.08 0.102 0.04 0.026 0 CC SPD 1.0 0.27 0.41 0.86 0 0 0.023 0 CC GUA 0.9 0.52 0.59 0.80 0.383 0.10 0.028 0.727 CT CHM 4.5 − 0.49 0.53 3.64 0 0 0.011 0 CT BRK 4.9 − 0.41 0.69 4.05 0 0 0.014 0 CT LBL 4.2 − 0.12 0.76 3.46 0 0.23 0.031 0.01 CT TWR 4.6 − 0.06 0.89 3.81 0.070 0 0.024 0.084 CT MAL 4.0 − 0.04 0.79 3.31 0 0 0.016 0 CT NCA 4.3 0.05 0.91 3.55 0.100 0.00047 0.025 0.100 CT CEL 1.1 0.09 0.31 0.96 0 0 0.021 0 CT BIS 1.0 0.26 0.41 0.86 0 0 0.023 0 MD MJA 4.7 − 0.81 0.32 3.77 0 0 0 0 MD ETX 4.5 − 0.75 0.32 3.59 0 0 0.021 0 MD NFO 4.8 − 0.64 0.47 3.86 0 0 0.011 0 MD MAN 4.6 − 0.61 0.45 3.71 0 0 0.018 0 MD TOR 3.8 − 0.21 0.62 3.16 0 0 0.017 0 MD RET 0.4 − 0.19 − 0.06 0.32 0 0 0.015 0 MD ENT 0.3 − 0.15 − 0.05 0.25 0 0 0.015 0 MD LAM 1.0 − 0.09 0.13 0.78 0 0 0.018 0 MD ALE 0.8 − 0.08 0.10 0.65 0 0 0.017 0 MD NPE 1.6 − 0.06 0.28 1.30 0 0 0.016 0 MD NMA 2.4 0.04 0.52 2.00 0 0 0.016 0 WB IWB 4.9 − 0.40 0.69 4.01 0.205 0.03 0.027 0.096 WB EWB 2.4 − 0.01 0.48 1.98 0 0.02 0.029 0.007 WB PWB 2.0 0.03 0.42 1.63 0 0.05 0.031 0 WB SWB 1.1 0.10 0.31 0.95 0 0 0.023 0
high level of genetic differentiation but also high levels of heterozygosity.
Weitzman and heterozygosity combined approaches
The between-breed component was weighted by the overall FSTvalue
of 0.21 when individual pig breeds were analysed or 0.06 when breed groups were considered.
The linear combinations of between- and within-breed genetic contributions to overall diversity gave conservation priority to the breeds in groups C1 and C2 and some in CT when the PCFstcriterion
was used, but the highest priority was given to Large White, Mulefoot, several CT breeds and IWB when the PC5:1perspective was adopted
(Table 3). Among Criollo breeds, only Mulefoot and Guinea Hog were located in the upper linear combination range of the values estimated. The Negro Canario breed showed high values for both linear combinations, as a consequence of its high PCWEand positive PCHE.
When breed groups are considered (Table 4), the C2 and C1 groups showed the highest values for PCFstand PC5:1, respectively. In spite of
the negative value of C1 group for PCHe, its high PCWE and the
weight given to this component explained the highest value for this group in PC5:1.
Core Set methodologies
The large number of breeds with null contributions to overall genetic diversity when kinship-based methods are used together (PCMEK,
PCWLM, and PCfm) allows that highly prioritized populations can be
easily identified (Table 3). Positive values for the three methods were found in most of the commercial pig breeds. However, the highest individual values for MEK, WLM and fm criteria were obtained for the Criollo breeds Guadalupe, Cubano and Guadalupe, respectively. It is remarkable that all pig breeds in the MD group showed null contributions with the MEK, WLM and fm methodologies. Except for the Mediterranean types, at least one pig breed belonging to each group had positive values for both PCMEK, PCWLM and PCfm. This
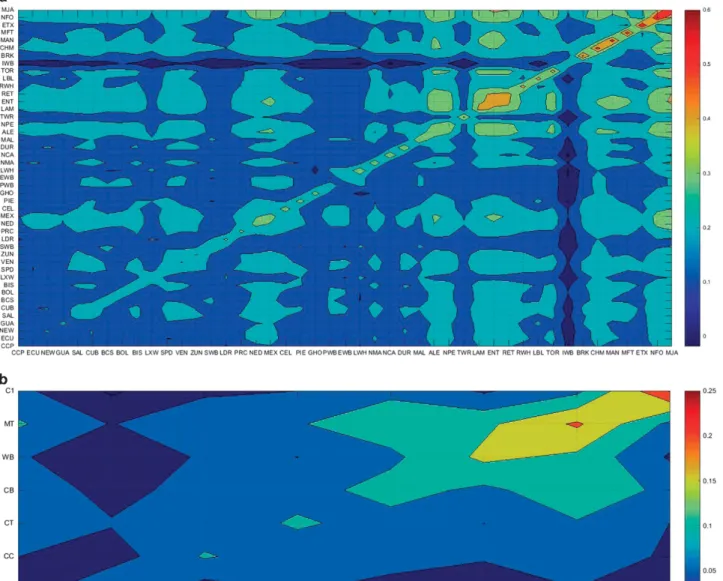
happened specifically for Large White and Landrace in commercial breeds, Pacifico, Caracolero Wet and Guinea Hog in Criollo, Negro Canario in Celtic type pigs and the Italian group of wild boar. Figure 1 shows contour plots of MEKs estimated from individual breeds
(Figure 1a) or breed-group genotypes (Figure 1b). Individual breeds and groups of breeds were sorted according to the average within-marker estimated kinships, with hot colour areas (red) representing higher inbreeding coefficients. In Figure 1a, except for one Criollo breed (Mulefoot), the breeds with higher levels of within-breed kinships belonged to Mediterranean or Celtic types: Berkshire, Chato Murciano, Manchado de Jabugo, Euskal Txerria, Negro de Formen-tera, Mangalica, Lampiño, Entrepelado and Retinto. The contour plot also revealed between-breed kinships and, as expected, Mediterranean pig breeds were the more closely related with each other (green areas in Figure 1a). On the other hand, Lampiño, Entrepelado, Retinto, Manchado de Jabugo and Negro de Formentera were the Mediterra-nean breeds more closely related to their counterparts (light blue). In Figure 1b, the Duroc, Iberian and wild boar groups showed higher within-group kinship levels and, as previously shown (Gama et al., 2013), the Mediterranean and wild boar populations had the highest breed relationships.
The PCWLMMmethodology allows for only one null contribution,
and hence it is easier to establish a ranking of all pig breeds for conservation priorities. Although some individual Criollo breeds, such as Criollo Boliviano and Criollo Cubano, showed high PCWLMM
estimates (0.36), on average the commercial pig breeds had the highest PCWLMM values (Table 3). Overall, three pig breeds (Large
White, Guadalupe and Negro Canario) and the Italian wild boar population showed estimates greater than 0 for the four kinship methodologies.
When breed groups were considered, the C2 group had the highest contribution to overall genetic diversity in the four Core Set methodologies (Table 4).
Coancestry and Nei’s genetic distance combined approach The results of the calculations of breed contributions following the methodology of Caballero and Toro (2002) are shown in Table 5, both considering and ignoring sample sizes (Fabuel et al., 2004).
The Caracolero Wet and Cr. Ecuador had the highest PCWEIGHTED
and PCUNWEIGHTED, respectively, and the five breeds having the
highest contributions with both methodologies were Criollo pig breeds. However, if the sample sizes assumed in the calculations do not reflect the effective population size of each breed in relation to the size of the metapopulation, then those breeds with larger samples could be favoured. In order to avoid the possible misinterpretation that would result in this case, the contribution of each breed was also estimated ignoring sample size, but only minor differences were detected among breeds. It is also arguable whether ignoring sample sizes is much better than considering these to obtain biased contribu-tions (see Fabuel et al., 2004 for an additional discussion).
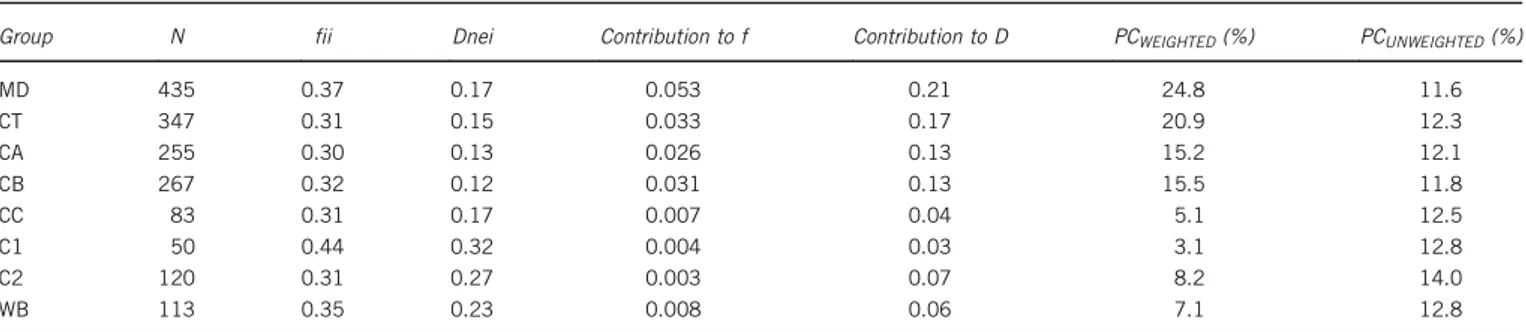
Surprisingly, when pig breeds were grouped, the MD and CT had the highest contribution to overall genetic diversity (Table 6), most probably because of their larger sample sizes. On the other hand, when sample sizes were ignored, MD had the lowest contribution and C2 the highest.
DISCUSSION
The development of livestock species in the American continent had particular characteristics because of the introduction of some domes-ticated farm animals, including pigs, since 1492. Hence, the current pig breeds located in the American continent originated initially from animals introduced by thefirst settlers that over time have adapted to different local environments. In the past few years, the genetic improvement of pig breeds, particularly in Europe and the United States, allowed for a second wave of genetic introgression into Table 4 Contributions of pig groups to overall genetic diversity
according to: Weitzman method (PCWE), proportional variation of
expected heterozygosity (PCHe), aggregate diversity (PCFst), the
Piyasatian and Kinghorn proposition (PC5:1), average coancestries
(fm), marker estimated kinships (MEKs), weighted log-linear model (WLM) and weighted log-linear mixed model (WLMM)
Acronym PCWE PCHe PCWE-PHecombined
approaches Core Set
PCFst PC5:1 PCMEK PCWLM PCWLMM fm MD 9.3 − 1.3 − 0.6 7.5 0 0 0 0 CT 6.6 0.87 1.2 5.6 0 0 0.05 0.02 CA 3.2 1.15 1.3 2.8 0.28 0.23 0.15 0.18 CB 3.5 0.45 0.6 2.9 0 0.05 0.1 0 CC 11.9 0.53 1.2 10.0 0.11 0.19 0.16 0.1 C1 33.7 − 2.3 − 0.1 27.7 0.09 0.05 0.08 0.09 C2 24.0 1.08 2.5 20.2 0.4 0.26 0.24 0.42 WB 14.1 − 0.5 0.4 11.7 0.13 0.22 0.22 0.2
America’s pig populations of commercial and highly selected pig breeds (Food and Agriculture Organization (FAO), 2007). Although the term breed emerged some 200 years ago in Europe, corre-sponding to animals with uniform characteristics, in America the term ‘Criollo’ has a very broad meaning, referring to direct descendants of the animals brought to the New World by the Spaniards and Portuguese, such that, in many cases, animals with a high degree of heterogeneity are grouped under the classification of Criollo. Nevertheless, the actual ancestry of current Criollo pig breeds is not clear, given the influences that pig breeds of several
origins may have had and/or the differences among extant Iberian pig breeds and those that existed centuries ago.
Currently, the conservation of animal genetic resources is uni-versally accepted as a key factor in sustainable development and to respond to changing conditions, including climate change, new or resurgent disease threats, new requirements on human nutrition and changing market demands or societal needs (Hoffman, 2010). In addition, human food demand in developing countries is predicted to rise at a faster rate than the increase in food production. Therefore, the greater the efforts for conservation of animal genetic resources, the
Figure 1 (a) Contour plots of MEKs: Chato Murciano (CHM), Berkshire (BRK), Large Black (LBL), Tamworth (TWR), Malhado de Alcobaça (MAL), Negro Canario (NCA), Celta (CEL) and Bisaro (BIS), Manchado de Jabugo (MJA), Euskal Txerria (ETX), Negro de Formentera (NFO), Mangaliça (MAN), Torbiscal (TOR), Retinto (RET), Entrepelado (ENT), Lampiño (LAM), Alentejano (ALE), Negro de los Pedroches (NPE), Negro Mallorquin (NMA), Duroc (DUR), Landrace (LAN), Large White (LWH), Pietrain (PIE), Large White × Landrace crosses (LXW), Mulefoot (MFT), Pampa Rocha (PRC), Caracolero Wet (NEW), Criollo Boliviano (BOL), Criollo El Salvador (SAL), Criollo Pacifico (CCP), Caracolero Dry (NED), Red Wattle Hog (RWH), Criollo Cubano (CUB), Pelon Mexicano (MEX), Zungo (ZUN), New Mexico (BCS), Criollo Venezolano (VEN) and Criollo Ecuatoriano (ECU), Guinea Hog (GHO), Criollo Guadalupe (GUA) and Sanpedreño (SPD). Wild boar populations were also included: Wild Boar Italy (IWB), Wild Boar Spain (SWB), Wild Boar Portugal (PWB) and Wild Boar Europe (EWB). Hot colour areas (red) representing higher inbreeding coefficients. (b) Contour plots of MEKs of group pigs breeds: Celtic type (CT), Mediterranean type (MT), Commercial group 1 (C1), Commercial group 2 (C2), Criollo group A (CA), Criollo group B (CB) and Criollo group C (CC). Hot colour areas (red) representing higher inbreeding coefficients.
greater the probability of satisfying the predictable increase in human food demands (Hoffman, 2010).
In spite of the fact that the term breed is well accepted as a unit for conservation, funds available for conservation of animal genetic resources are limited, and the criteria used to invest public capital to maintain them may imply the definition of breed conservation priorities. Factors that need to be considered in the definition of such criteria include, in addition to genetic diversity and environmental sustainability aspects, those related to the social, cultural and historical role of breeds (Ruane, 1999; Gandini et al., 2004). Concerning the factors associated with the contribution of a breed to genetic diversity,
there is no consensus on how to weight the between- and within-population components of diversity (Caballero and Toro, 2002; Eding et al., 2002). In principle, maintenance of between-breed genetic diversity should be prioritized if the aim of the breeding programme in a medium-term scenario is to focus on crossbreeding plans. However, in anticipation of possible environmental changes, within-breed genetic diversity could be more important to face unforeseen challenges. In our analyses, the Weitzman and heterozygosity approaches were in accordance with the history of the breeds analysed. As the Weitzman approach favours the between-population diversity component, the more distant breeds were prioritized and, in Table 5 Contributions of pig breeds to overall diversity according to Caballero and Toro (2002) and Fabuelet al. (2004)
Group Acronym Fii Dnei Contribution to f Contribution to D PCWEIGHTED(%) PCUNWEIGHTED(%)
C1 DUR 0.44 0.16 0.0085 0.021 3.0 2.2 C2 PIE 0.40 0.15 0.0070 0.021 2.9 2.3 C2 LWH 0.44 0.21 0.0040 0.013 1.9 2.4 C2 LDR 0.40 0.17 0.0036 0.012 1.7 2.4 C2 LXW 0.39 0.16 0.0026 0.009 1.2 2.4 CA MFT 0.57 0.20 0.0079 0.014 1.9 2.0 CA SAL 0.33 0.10 0.0029 0.010 1.4 2.4 CA CCP 0.31 0.11 0.0051 0.020 2.8 2.4 CA BOL 0.34 0.13 0.0043 0.016 2.3 2.4 CA PRC 0.42 0.14 0.0054 0.014 1.9 2.2 CA NEW 0.30 0.10 0.0061 0.024 3.3 2.4 CA NED 0.37 0.11 0.0064 0.018 2.5 2.3 CB RWH 0.51 0.17 0.0071 0.014 1.9 2.1 CB BCS 0.37 0.13 0.0029 0.009 1.3 2.4 CB MEX 0.37 0.10 0.0078 0.022 3.0 2.3 CB CUB 0.35 0.11 0.0072 0.023 3.2 2.4 CB VEN 0.35 0.11 0.0043 0.014 1.9 2.4 CB ZUN 0.40 0.13 0.0053 0.014 2.0 2.3 CB ECU 0.30 0.09 0.0064 0.024 3.3 2.4 CC GHO 0.44 0.17 0.0055 0.015 2.1 2.3 CC GUA 0.31 0.10 0.0043 0.017 2.3 2.5 CC SPD 0.37 0.12 0.0021 0.006 0.9 2.3 CT CHM 0.54 0.18 0.0109 0.019 2.7 2.0 CT NCA 0.45 0.19 0.0076 0.022 3.1 2.3 CT CEL 0.40 0.13 0.0044 0.012 1.6 2.3 CT BIS 0.37 0.11 0.0075 0.022 3.1 2.3 CT MAL 0.48 0.17 0.0066 0.015 2.1 2.2 CT BRK 0.56 0.20 0.0099 0.018 2.6 2.0 CT TWR 0.48 0.20 0.0071 0.017 2.5 2.2 CT LBL 0.46 0.18 0.0080 0.020 2.8 2.2 MD RET 0.45 0.12 0.0098 0.020 2.8 2.1 MD ENT 0.44 0.11 0.0097 0.020 2.8 2.1 MD TOR 0.47 0.16 0.0094 0.021 2.9 2.1 MD NPE 0.44 0.13 0.0054 0.012 1.7 2.1 MD LAM 0.42 0.12 0.0091 0.021 2.9 2.2 MD MJA 0.61 0.18 0.0106 0.014 2.0 1.8 MD NFO 0.58 0.19 0.0047 0.007 1.0 1.9 MD NMA 0.44 0.15 0.0035 0.008 1.2 2.2 MD ETX 0.61 0.25 0.0108 0.019 2.7 2.0 MD ALE 0.41 0.10 0.0092 0.021 2.9 2.1 MD MAN 0.57 0.20 0.0055 0.009 1.3 2.0 WB PWB 0.41 0.14 0.0063 0.017 2.4 2.3 WB SWB 0.40 0.13 0.0081 0.022 3.0 2.3 WB EWB 0.42 0.15 0.0020 0.005 0.7 2.3 WB IWB 0.55 0.24 0.0022 0.005 0.7 2.2
Average coancestries (fii) and Nei’s genetic distances (DNei), contributions to global coancestry (f) and to average Nei’s distance (D), and proportional contributions (PC) to a pool of maximum genetic diversity weighted and unweighted by sample sizes. Highly prioritized breeds are in bold and shaded dark.
consequence, breeds belonging to the Celtic (CT) and Mediterranean (MD) groups showed the highest PCWE values. However, although
seven of the nine CT breeds had a high PCWE, the MD breeds showed
a high variation in PCWEamong breeds, such that MD breeds with a
well-known influence in Criollo breeds, including Retinto, Entrepe-lado or Lampiño, clearly had a lower PCWEthan those breeds with a
minor influence, such as Euskal Txerria, Negro de Formentera or Mangalica (Burgos-Paz et al., 2013). On the other hand, commercial breeds had an intermediate PCWEwhereas the heterogeneous genetic
origins of Criollo breeds explain their low PCWE. Nonetheless,
Mulefoot and Red Wattle Hog were the only Criollo breeds with high PCWE, probably as a consequence of their strong degree of
between-breed differentiation among Criollo pig breeds, as well as within-breed homogeneity (Revidatti et al., 2014). In contrast, the heterozygosity-based approach prioritized within-population diversity, and hence Criollo breeds had the highest values, except for a few exceptions such as Mulefoot and Red Wattle Hog, in these cases probably as a result of population bottlenecks given their reduced census (http://www.albc-usa.org/cpl/wtchlist.html#pigs). On the other hand, the MD and CT groups had the lowest PCHe, indicating that
their levels of genetic diversity are generally lower than in Commercial and Criollo breeds. These results indicate that, in general, genetically unhealthy breeds (that is, highly inbred or with low heterozygosity) are prioritized under a between-breed genetic diversity criterion, whereas breeds holding higher genetic variability receive the priority under the within-breed criterion. Therefore, depending on the perspective taken, conservation priorities can be argued for or against each option. However, the differences in management of the breeds analysed, where the majority of the Criollo breeds are open to a certain degree of genetic introgression and gene flow, whereas MD, CT and Commercial breeds are closed, may lead to different solutions, by taking into account the breed considered. Thus, although commercial breeds do not require funding for their preservation, because their maintenance is not under threat, the maintenance of highly differentiated breeds within the MD and CT groups is needed to prevent the permanent loss of the genetic diversity that they represent. In Criollo breeds, which have been selected for different environments for several centuries, the preserva-tion of within-breed genetic diversity ensures their ability to cope with environmental changes. Furthermore, the use of systematic cross-breeding programmes with more distant breeds (including MD, CT or Commercial breeds) could probably allow taking advantage of complementarity among breeds, thus achieving high levels of hetero-sis. However, most criteria used for the establishment of conservation priorities will ignore Criollo breeds with low levels of heterozygosity, such as Mulefoot, Red Wattle Hog, Guinea Hog or Cr. Cubano that are characterized by a low census or recent signals of strong
bottlenecks (http://www.albc-usa.org/cpl/wtchlist.html#pigs; Velázquez et al., 1998), but can nevertheless retain important adaptive traits.
Approaches based on minimizing molecular coancestry, which consider both between- and within-breed information, resulted in a very low conservation priority given to all MD breeds and the majority of CT breeds, except Large Black. On the other hand, most commercial breeds had positive contributions to overall diversity, even though their preservation requires less funding support. Still, Criollo breeds generally had the highest contribution values, even though many Criollo breeds had null contributions to overall genetic diversity. Among the Criollo breeds, the Cr. Boliviano, Cr. Pacífico, Cr. Cubano and Cr. Guadalupe were the breeds with higher contributions to overall diversity, but these are also believed to be the ones that may have suffered a greater influence from pigs of Chinese origin (Burgos-Paz et al., 2013).
Under the kinship methodologies, however, breed conservation priorities clearly reflect the genetic structure of the pig breeds analysed. The genetic influence observed in most Criollo pig breeds is expected to derive from breeds of the Iberian Peninsula (Ramírez et al., 2009), and hence the conservation of some Criollo populations should also imply the underlying conservation of the Iberian Peninsula genetic contribution. For this reason, the majority of breeds from the Iberian Peninsula had low contributions, and only three pig breeds belonging to MD or CT (Negro de Formentera, Large Black and Tamworth) had notable contributions to overall diversity, probably because of their island origin (that is, isolated) and reduced genetic influence on Criollo pig breeds. On the other hand, Cr. Guadalupe, Cr. Pacífico and Cr. Cubano had higher contribution values with the kinship metho-dology, probably reflecting a greater influence received from Chinese pigs (Burgos-Paz et al., 2013).
The methodologies presented here to establish conservation prio-rities are based upon the use of neutral genetic markers, but the current availability of high-density single-nucleotide polymorphism (SNP) arrays provides extensive information on polymorphic variation across coding and noncoding genome regions, and increase the precision and accuracy of kinship estimates within and among populations. Their use is also becoming feasible because of the lower genotyping costs, for example, of the Porcine SNP60 Bead-array (Ramos et al., 2009) that has recently been used for comparative studies between European pig breeds (Manunza et al., 2013; Burgos-Paz et al., 2013; Herrero-Medrano et al., 2014). However, there is a well-known ascertainment bias implicit when SNP chips are used in cattle and other livestock species (Albrechtsen et al., 2010; Lachance and Tishkoff, 2013). Furthermore, this bias is even greater when studies involve highly differentiated local populations, for instance, the Criollo pig breeds that are usually not considered in the development of high-density SNP panels.
Table 6 Contributions of group pig breeds to diversity according to Caballero and Toro (2002) and Fabuelet al. (2004)
Group N fii Dnei Contribution to f Contribution to D PCWEIGHTED(%) PCUNWEIGHTED(%)
MD 435 0.37 0.17 0.053 0.21 24.8 11.6 CT 347 0.31 0.15 0.033 0.17 20.9 12.3 CA 255 0.30 0.13 0.026 0.13 15.2 12.1 CB 267 0.32 0.12 0.031 0.13 15.5 11.8 CC 83 0.31 0.17 0.007 0.04 5.1 12.5 C1 50 0.44 0.32 0.004 0.03 3.1 12.8 C2 120 0.31 0.27 0.003 0.07 8.2 14.0 WB 113 0.35 0.23 0.008 0.06 7.1 12.8
Average coancestries (fii) and Nei’s genetic distances (DNei), contributions to global coancestry (f) and to average Nei’s distance (D), and proportional contributions (PC) to a pool of maximum genetic diversity weighted and unweighted by sample sizes.
In addition to genetic information and breed contributions to the conservation of genetic resources, other aspects such as the regional importance of the breed and its social, cultural, environmental and economic impact must also be considered in the final decision for conservation. Pig production is an important source of high-quality protein food and provides income from the sale of animals that contribute directly to support local economies, but also, in many cases, plays an important social and cultural role, especially in traditions that reinforce local identity. These strong interactions among the human community, the breed and the surrounding environment are an integral part of the environmental and social equilibrium of a given region, which is passed through generations, and is a part of local cultural heritage (Ruane, 1999). Moreover, the community will often maintain a wealth of indigenous knowledge on how to sustainably co-manage the animals and the local environment, an example of which is the maintenance of the so-called‘dehesa’ or ‘montado’ for several centuries in the Iberian Peninsula. Therefore, in addition to genetic considerations, the cultural and environmental importance of a breed should also be taken in consideration when defining conservation priorities.
DATA ARCHIVING
Data available from the Dryad Digital Repository: http://dx.doi.org/ 10.5061/dryad.7cq0k.
CONFLICT OF INTEREST
The authors declare no conflict of interest. ACKNOWLEDGEMENTS
We thank the different breeders associations and research groups who kindly provided biological samples used in this study. Members of the CYTED XII-H and CONBIAND networks are thanked for valuable cooperation over the years. Catarina Ginja received funding from the Fundação para a Ciência e a Tecnologia, Portugal, through an Invited Scientist fellowship (Ref. SFRH/BCC/ 52687/2014).
THE BIOPIG CONSORTIUM
Águeda Pons11, AP Ponce Alvarado12, A Sierra Vasquez13,
Begoña Peinado Ramón14, Cecilio Barba Capote15, E Pérez Pineda16,
Inmaculada Martín Burriel17, José Antonio Carril Gonzalez-Barros18,
José Luis Vega-Pla19, JJ Montes-Sánchez20, LA Alvarez21, Maria Inês Carolino22,
Mariano Gómez23, S Llambí24, M Montenegro24, MA Revidatti25
and R Galíndez26
11Serveis de Millora Agrària i Pesquera, Islas Baleares, Spain;12Universidad
Autónoma Juan Misael Saracho de Tarija, Tarija, Bolivia;13ITA Conkal,
Yucatán, México;14Centro de Investigación y Desarrollo Agroalimentario,
La Alberca, Murcia, Spain;15Departamento de Producción Animal,
Universidad de Córdoba, Campus de Excelencia Internacional Agroalimentario ceiA3, Córdoba, Spain;16Universidad de Granma, Bayamo, Cuba;
17Clementina Rodellar: Laboratorio de Genética Bioquímica, Facultad de
Veterinaria, Universidad de Zaragoza, Zaragoza, Spain;18ASOPORCEL, Palacio
de Ferias y Congresos, Lugo, Spain;19Laboratorio de Investigación Aplicada,
Cría Caballar de las Fuerzas Armadas, Córdoba, Spain;20Centro de
Investigaciones Biológicas del Noroeste, La Paz, Baja California Sur, México;
21Universidad Nacional de Colombia, Sede Palmira, Palmira, Valle del Cauca,
Colombia;22Conceição O Sousa, Fátima Santos Silva: INIAV, Vale de
Santarém, Portugal;23Servicio de Ganadería, Diputación Foral de Bizkaia,
Bilbao, Spain;24Departamento de Genética y Mejora Animal, Instituto de
Producción Animal, UDELAR, Montevideo, Uruguay;25Departamento de
Producción Animal, Facultad de Ciencias Veterinarias, Universidad Nacional del Nordeste, Corrientes, Argentina;26Universidad Central de Venezuela,
Maracay, Venezuela
Albrechtsen A, Nielsen FC, Nielsen R (2010). Ascertainment biases in SNP chips affect measures of population divergence. Mol Biol Evol 27: 2534–2547.
Barker JSF (2001). Conservation and management of genetic diversity: a domestic animal perspective. Can J Forest Res 31: 588–595.
Belkhir K, Borsa P, Chikhi L, Raufaste N,, Bonhomme F (1996–2004). GENETIX 4.05, logiciel sous Windows TM pour la génétique des populations. Laboratoire Génome, Populations, Interactions, CNRS UMR 5171. Université de Montpellier II: Montpellier (France).
Benítez W (2000). Los cerdos criollos en America Latina. En: Los cerdos locales en los sistemas de producción tradicionales. Estudio FAO producción y sanidad animal, pp 148–191.
Bruford MW (2004). Conservation genetics of UK livestock: from molecules to manage-ment. In: Simm G, Villanueva B, Towsend S (eds), Farm Animal Genetic Resources. Nottingham University Press: Nottingham, UK, pp 151–169.
Burgos-Paz W, Souza CA, Megens HJ, Ramayo-Caldas Y, Melo M, Lemús-Flores C et al. (2013). Porcine colonization of the Americas: a 60k SNP history. Heredity 110: 321–330.
Caballero A, Toro MA (2002). Analysis of genetic diversity for the management of conserved subdivided populations. Conserv Genet 3: 289–299.
Cañón J, García D, Delgado JV, Dunner S, Gama LT, Landi V et al. (2011). Relative breed contributions to neutral genetic diversity of a comprehensive representation of Iberian native cattle. Animal 5: 1323–1334.
Eding H, Crooijmans RP, Groenen MA, Meuwissen TH (2002). Assessing the contribution of breeds to genetic diversity in conservation schemes. Genet Sel Evol 34: 613–633. Eding H, Meuwissen TH (2001). Marker-assisted estimates of between and within
population kinships from genetic marker data for the construction of core sets in genetic conservation schemes. J Anim Breed Genet 118: 141–159.
Eding H, Meuwissen TH (2003). Linear methods to estimate kinships from genetic marker data for construction of core sets in genetic conservation schemes. J Anim Breed Genet 120: 289–302.
Fabuel E, Barragán C, Silió L, Rodríguez MC, Toro MA (2004). Analysis of genetic diversity and conservation priorities in Iberian pigs based on microsatellite markers. Heredity 93: 104–113.
Fisher RA (1930). The Genetical Theory of Natural Selection. Oxford University Press: Oxford.
Food and Agriculture Organization (FAO) (2004). Measurement of Domestic Animal Diversity – A Review of Recent Diversity Studies. FAO of the United Nations, Commission on Genetic Resources, Working Group on Animal Genetic Resources: Rome, Italy.
Food and Agriculture Organization (FAO) (2007). The State of the World´s Animal Genetic Resources for Food and Agriculture. Commission on the genetic resources for Food and Agriculture Organization of the United Nations: Rome, Italy.
Gama LT, Martínez AM, Carolino I, Landi V, Delgado JV, Vicente AA et al. (2013). Genetic structure, relationships and admixture with wild relatives in native pig breeds from Iberia and its islands. Genet Sel Evol 45: 18.
Gandini GC, Ollivier L, Danell B, Distl O, Georgoudis A, Groeneveld E et al. (2004). Criteria to assess the degree of endangerment of livestock breeds in Europe. Livest Prod Sci 91: 173–182.
Garcia D, Corral N, Canon J (2005). Combining inter- and intrapopulation information with the Weitzman approach to diversity conservation. J Hered 96: 704–712.
Ginja C, Gama LT, Cortés O, Delgado JV, Dunner S, García D et al. (2013). Analysis of conservation priorities of Iberoamerican cattle based on autosomal microsatellite markers. Genet Sel Evol 45: 1–18.
Herrero-Medrano JM, Megens HJ, Groenen AM, Bosse M, Pérez-Enciso M, Crooijmans R (2014). Whole-genome sequence analysis reveals differences in population manage-ment and selection of European low-input pig breeds. BMC Genomics 15: 601. Herrero-Medrano JM, Megens HJ, Groenen AM, Ramis G, Bosse M, Pérez-Enciso M et al.
(2013). Conservation genomic analysis of domestic and wild pig populations from the Iberian Peninsula. BMC Genet 14: 106.
Hoffman I (2010). Climate change and the characterization, breeding and conservation of animal genetic resources. Anim Genet 41: 32–46.
Lachance J, Tishkoff SA (2013). SNP ascertainment bias in population genetic analyses: why it is important, and how to correct it. Bioessays 35: 780–786.
Linares V, Linares L, Mendoza G (2011). Caracterización etnozzotécnica y potencial carnicero de Sus scrofa‘cerdo criollo’ en Latinoamérica. Sci Agropecu 2: 97–110. Manunza A, Zidi A, Yeghoyan S, Balteanu VA, Carsai TC, Scherbakov O et al. (2013).
A high throughput genotyping approach reveals distinctive autosomal genetic signatures for European and Near Eastern wild boar. Plos One 8: e55891.
McGlone J, Pond WG (2003). Pig Production: Biological Principles and Applications. Thomson Delmar Learning: New York.
Oldenbroek JK (1999). Genebanks and the Conservation of Farm Animal Genetic Resources. DLO Institute for Animal Sciences and Health: Lelystad, The Netherlands. Ollivier L, Alderson L, Gandini GC, Foulley JL, Haley CS, Joosten R et al. (2005). An assessment of European pig diversity using molecular markers: partitioning of diversity among breeds. Conserv Genet 6: 729–741.
Ollivier L, Foulley JL (2005). Aggregate diversity: new approach combining within- and between-breed genetic diversity. Livest Prod Sci 95: 247–254.
Park SDE (2001). Trypanotolerance in West African cattle and the population genetic effects of selection. PhD thesis, University of Dublin.
Piyasatian N, Kinghorn BP (2003). Balancing genetic diversity, genetic merit and population viability in conservation programmes. J Anim Breed Genet 120: 137–149.
Ponzoni RW (1997). Genetic resources and conservation. In: Piper LR, Ruvinsky A (eds), The Genetics of Sheep. CAB International: New York, NY, USA, pp 433–466. Ramos AM, Crooijmans RP, Affara NA, Amaral AJ, Archibald AL, Beever JE et al. (2009).
Design of a high density SNP genotyping assay in the pig using SNPs identified and characterized by next generation sequencing technology. Plos One 5: 4.
Ramírez O, Burgos-Paz W, Casas E, Ballester M, Bianco E, Olalde I et al. (2014). Genome data from a sixteenth century pig illuminate modern breed relationships. Heredity 114: 175–184.
Ramírez O, Ojeda A, Tomàs A, Gallardo D, Huang LS, Folch JM et al. (2009). Integrating Y-chromosome, mitochondrial and autosomal data to analyze the origin of pig breeds. Mol Biol Evol 26: 2061–2072.
Revidatti MA, Delgado Bermejo JV, Gama LT, Landi Periati V, Ginja C, Alvarez LA et al. (2014). Genetic characterization of local Criollo pig breeds from the Americas using microsatellite markers. J Anim Sci 92: 4823–4832.
Reynolds J, Weir BS, Cockerham CC (1983). Estimation of the coancestry coefficient: basis for a short-term genetic distance. Genetics 105: 767–779.
Royo LJ, Alvarez I, Fernández L, Pérez-Pardal A, Alvarez-Sevilla A, Godinho R et al. (2007). In: Proceedings of the 6th International Symposium on the Mediterranean Pig: 11–13 October 2007; Messina, ItalyNanni Costa L, Zambonelli P, Russo V (eds): Genetic
Characterisation of Celtic-Iberian Pig Breeds Using Microsatellites. Università di Bologna, Italy, pp 31–34.
Ruane J (1999). A critical review of the values of genetic distance studies in conservation of animal genetic resources. J Anim Breed Genet 116: 317–323.
Scandura M, Iacolina L, Apollonio M (2011). Genetic diversity in the European wild boar Sus scrofa: phylogeography, population structure, and wild x domestic hybridization. Mammal Rev 41: 125–137.
Toro M, Barragán C, Óvilo C, Rodrigañez J, Rodrigez C, Silió L (2002). Estimation of coancestry in Iberian pigs using molecular markers. Conserv Genet 3: 309–320. Toro MA, Fernandez J, Caballero A (2009). Molecular characterization of breeds and its use
in conservation. Livest Sci 120: 174–195.
Velázquez F, Barba C, Pérez-Pineda E, Delgado JV (1998). El cerdo negro criollo cubano: origen, evolución y situación actual. Arch Zootec 47: 561–564.
Vicente A, Carolino M, Sousa M, Ginja C, Silva F, Martinez A et al. (2008). Genetic diversity in native and commercial breeds of pigs in Portugal assessed by microsatellites. J Anim Sci 86: 2496–2507.
Weir BS, Cockerham CC (1984). Estimating F-statistics for the analysis of population structure. Evolution 38: 1358–1370.
Weitzman ML (1992). On diversity. Q J Econ 107: 363–405.