POLITECNICO DI MILANO
FACOLTA DI INGEGNERIA
DELL‘INFORMAZIONE
CORSO DI LAUREA IN INGEGNERIA
DELL‘AUTOMAZIONE
A tool for the integration of FMECA
and diagnostic analysis
Relatore: Ing. Macchi Marco Correlatore: Ing. Luca Fumagalli
Tesi di Laurea di:
Berno Paolo Matr. n. 740495
- 2 -
- 3 -
Contents
Abstract
...10Executive Summary
……….12List of definition
...151.Production systems and maintenance
...171.1.Background
... 171.2. The purpose of the thesis
... 221.3. Structure of the thesis
... 252. FMECA
...262.1. Introduction
...262.1.1. What is FMEA –Failure Modes and Effects Analysis?………27
2.1.2. What is FMECA –Failure Modes Effects and Criticality Analysis? ………27
2.2. FMEA procedure
... 282.2.1.Preparation ... 28
2.2.2.Creating a Block Diagram ... 29
2.2.3.Header of FMEA Form worksheet ... 29
2.2.4.Severity ... 30
2.2.5.Cause of failure mode ... 32
2.2.6.Occurence... 32
2.2.7.Detection ... 33
- 4 -
2.2.9.Actions ... 35
2.3.FMEA/FMECA in this research
... 363.Principal Component Analysis for Fault Detection and Isolation
...373.1.Introduction
... 373.1.1.Statistical approaches ... 38
3.1.2.Artificial Intelligence approaches ... 38
3.1.3.Other approaches ... 40
3.2.PCA modeling
... 403.2.1.Statistics for monitoring
………..
423.3.Conclusion
... 454. CBM-FMECA
...464.1.CBM- Condition based maintenance
... 474.2.Description of relevant background knowledge
... 524.3.Implementation of CBM
... 564.4.FMECA-CBM
... 574.5.Conclusion
... 575.The proposed tool
...615.1.ESA (Electric Signature Analysis)
... 615.2. Aim of the tool
... 645.3. Architecture of the software
... 655.4. Functions and uses of the software
... 655.4.1. Functions implemented for FMECA and CMMS ... 71
- 5 -
5.5. Conclusion
... 776.Case of study
...786.1.The structure of the industrial machine
... 786.2.Mathematical validation of Diagnostic tool
... 846.3.Validation of Diagnostic analysis using the developed software tool
... 566.4.Conclusion
... 867.Conclusion
...877.1.Benefits and limits of using this software
... 88List of figures ...6 List of tables ...8 List of attachments ...9 References ...91 Attachment ...95 Acknowledgements ...117
- 6 -
List of figures
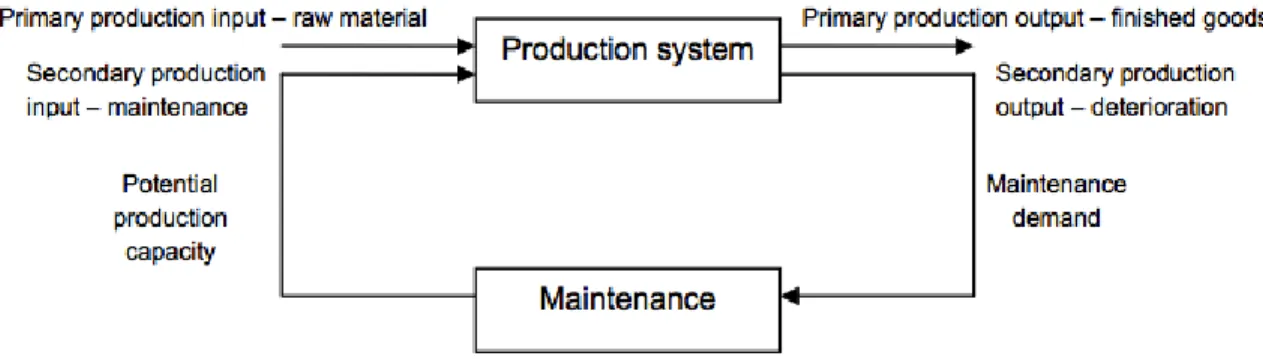
Figure 1:The need and affect of maintenance on a production system. Obviously, additional support functions are necessary in order to run a production system. However, as the Figure visualizes, maintenance plays a vital role in upholding production capacity. (pag. 18)
Figure 2:Overview of different maintenance types.(pag. 19)
Figure 3:The potential failure to failure curve of a ball bearing (pag. 21)
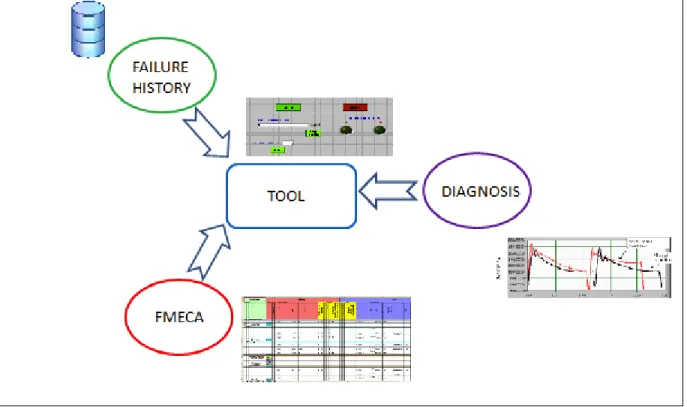
Figure 4: Purpose of thesis: integrate FMECA, DIAGNOSIS and FAILURE HISTORY
(pag.23)
Figure 5:Overview of the project ( pag. 24)
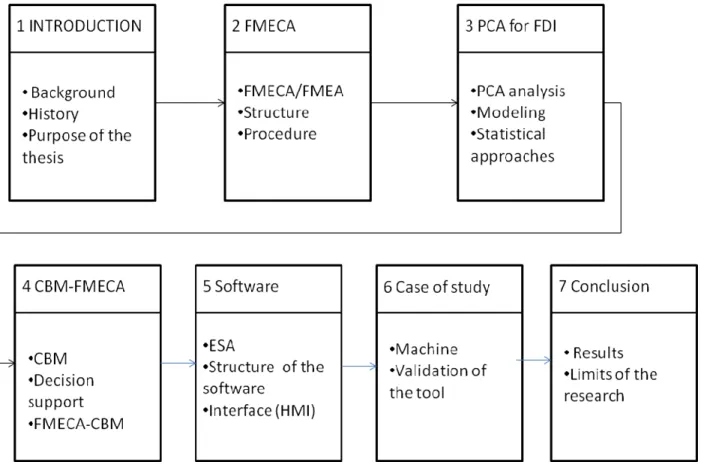
Figure 6:Structure of the thesis (pag. 25)
Figure 7:Graphical representation of PCA and parameters Q and T2 ( pag. 44)
Figure 8: The seven modules in a condition based maintenance system. ( pag. 49) Figure 9: RCM/CBM/CBM+ relationship ( pag. 53)
Figure 10:Data fusion ( pag. 54)
Figure 11:Example of electric signature acquired in condition of a degradation state and in normal condition. ( pag. 62)
Figure 12: The first picture is Kurtosis, the second is Skewness and the last is Crest Factor ( pag. 63)
Figure 13:Integration of FMECA,HMI,CMMS-LIKE and Diagnostic analysis ( pag. 65)
Figure 14:Structure of the software ( pag. 68)
Figure 15:The graphic interface developed through LabView8. ( pag. 70)
- 7 -
Figure 17: The graphic interface where it is possible to load FMECA and CMMS-LIKE databases ( pag. 73)
Figure 18: The graphic interface where it is possible to load values about MDT, MTBF and corresponding value of Severity and Frequency ( pag. 74)
Figure 19: The graphic interface where it is possible to export FMECA and CMMS-LIKE databases( pag. 74)
Figure 20:The graphic interface where it is possible to reset all FMECA and CMMS-LIKE data stored ( pag. 75)
Figure 21:The graphic interface where it is possible to load signatures and where the operator can know if a fault happened through an alarm. ( pag. 75)
Figure 22: The graphic interface where it is shown the identification and the isolation of the fault. In this part of HMI the operator can see not only the code of the component faulted but also the failure mode, the Frequency and the Severity associated. ( pag. 76)
Figure 23:The graphic interface where it is possible to update FMECA using data of CMMS-LIKE( pag. 77)
Figure 24:Picture of the balancing machine used during the project( pag. 78)
Figure 25:The working station( pag. 79)
Figure 26:Example of Matlab PCA analysis( pag. 81)
Figure 27:Plot of optimal reference scores about the third step of working cycle on associated principal component( pag. 82)
Figure 28:Plot of optimal reference scores and of bad reference condition about the third step of working cycle on associated principal component( pag. 83)
Figure 29:Plot of reference scores and of tested signature. In this figure it is possible to see the presence of the score of the signature tested inside the bad reference region( pag. 84)
Figure 30: The graphic interface where it is shown the presence of fault in a signature tested through the red alarm switch on . ( pag. 84)
Figure 31: The graphic interface where it is shown the list of faults diagnosed and their associated parameters (failure mode, frequency and severity) ( pag. 85)
- 8 -
List of tables
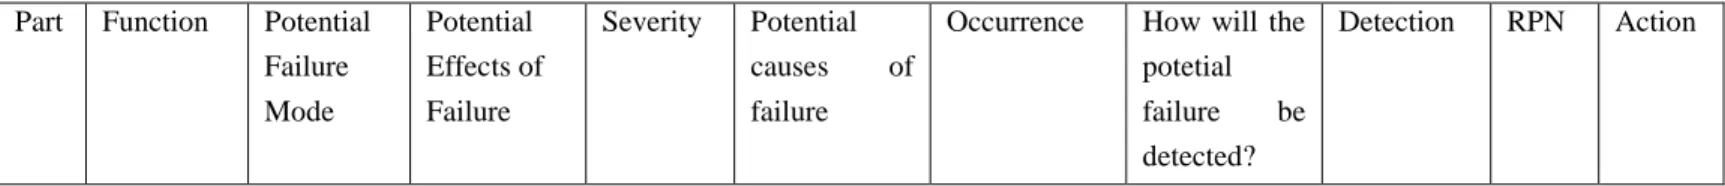
Table1: Header of FMECA(pag. 30)
Table 2:Standard scale to assess the effects of a fault (pag. 32)
Table 3:A common industry standard scale to assess the criticality of a fault(pag. 33)
Table 4:The ranking and different criteria to assess Detection(pag. 35)
Table 5:The computerized/cognitive tasks/activities can be used to explain that condition based maintenance systems as well can have different levels of automation. ( pag. 51)
Table 6:Functions and outputs of HMI(pag. 69)
Table 7:Header of FMECA implemented (pag. 72)
- 9 -
List of attachments
Matlab scripts to obtain reference indices (pag.95)
Matlab scripts to obtain PCA and diagnosis analysis (pag.101) Matlab scripts to obtain updated FMECA (pag.111)
- 10 -
Abstract
La Manutenzione negli anni recenti ha ottenuto spazi sempre più importanti nell‘Ingegneria dei Sistemi, assumendo un ruolo di primo piano già nelle fasi preliminari della progettazione di impianti industriali ed infrastrutture. Questa maturazione nasce dall‘esigenza di abbandonare la vecchia concezione della manutenzione intesa come ―costo necessario‖ da minimizzare durante l‘esercizio del sistema, per pervenire ad una nuova presa di coscienza da parte degli addetti ai lavori e soprattutto dei Manager che oggi riconoscono alla disciplina un ruolo di ―strumento di profitto‖. La presente tesi ha lo scopo di mostrare come sia possibile, partendo da concetti presenti in letteratura riguardanti la gestione della manutenzione, sviluppare un software che riesca a supportare la diagnosi di diverse condizioni operative di una macchina a partire dalla sola firma elettrica, derivabile dalla misurazione dell‘andamento della potenza assorbita nel tempo. Obiettivo principale del software è poi quello di mostrare l‘integrazione della FMECA – un tipico strumento dell‘ingegneria e pianificazione della manutenzione – con l‘analisi diagnostica, allo scopo ultimo di ottenere informazioni sempre aggiornate riguardo a possibili guasti.
Questo permette di validare lo strumento sia come supporto per gli utilizzatori della macchina, in un‘ottica tradizionale di gestione della manutenzione, sia come strumento a supporto di un servizio di manutenzione che può essere offerto dal costruttore della macchina stessa. Inoltre, collegando in maniera stretta la FMECA all‘analisi diagnostica, è possibile dimostrare come sfruttare al meglio i dati del monitoraggio di macchina ai fini dell‘ingegneria di manutenzione e, di più, come rendere ―continue‖ – mentre, cioè, l‘impianto sta funzionando – le analisi che, ad oggi, nel migliore dei casi, vengono fatte con frequenza bassa (es. una FMECA può essere fatta su base annua o addirittura a seguito di specifici episodi come la modifica d‘impianto). Questo stretto legame tra FMECA ed analisi diagnostica è visto, nella letteratura scientifica più recente, come foriero di un miglioramento importante delle attuali pratiche di gestione della manutenzione.
- 11 -
Abstract
In order to be competitive, it is necessary for companies to continuously increase the effectiveness and efficiency of their production processes. Current production strategies demand high availability of production equipment in order to keep low cost and guarantee the customer satisfaction. Therefore, maintenance has gained in importance as a support function for ensuring equipment availability, quality products, on-time deliveries, and plant safety.
Well-performed maintenance implies seeing as few corrective maintenance actions as possible while performing as little preventive maintenance as possible, pursuing always an optimization of maintenance costs. This might seem as a utopia, but during the past decades strategies and concepts have evolved to support this. One of these is condition based maintenance. In condition based maintenance, critical item characteristics are monitored (through, for example, vibration or temperature monitoring) in order to gain early indications of an incipient failure. Research activity shows that condition based maintenance has not been implemented on a wide basis. Therefore, the purpose of this research is to investigate how a condition based maintenance approach can be implemented in an industrial setting. This is done thanks to the development of a method that can integrate FMECA - a typical engineering instrument about maintenance planning - with a failure diagnostic tool.
The software designed can be seen as support for the users of the machine and also as useful instrument for maintenance service, that can be offered by the manufacturers.
- 12 -
Executive Summary
La Manutenzione negli anni recenti ha ottenuto spazi sempre più importanti nell‘Ingegneria dei Sistemi, assumendo un ruolo di primo piano già nelle fasi preliminari della progettazione di impianti industriali ed infrastrutture. Questa maturazione nasce dall‘esigenza di abbandonare la vecchia concezione della manutenzione intesa come ―costo necessario‖ da minimizzare durante l‘esercizio del sistema, per pervenire ad una nuova presa di coscienza da parte degli addetti ai lavori e soprattutto dei Manager che oggi riconoscono alla disciplina un ruolo di ―strumento di profitto‖ che, come tale, deve essere pianificato e progettato, sin dalla concezione del progetto, e quindi approfondito, corretto e migliorato durante tutto il ciclo di vita del sistema.
Questa crescita ha raggiunto livelli di maturazione diversa nei diversi settori industriali: in alcuni settori la disciplina è ormai consolidata (Aeronautico, Spaziale, Nucleare), in molti altri settori ha avuto una rapida crescita negli ultimi anni (trasporti, petrolchimica), in altri ancora è agli esordi ma anche in questi ambiti ci si aspetta nei prossimi anni un consolidamento (manifatturiero, energetico).
Il lavoro di questa tesi si propone di illustrare come sia possibile integrare più strumenti di analisi usati, fino ad oggi, nel campo della manutenzione in maniera separata; la concretizzazione del concetto di integrazione proposto nella tesi si avrà attraverso lo sviluppo di un corrispondente, unico strumento software.
Va detto innanzi tutto che quando si parla di guasto, se ne parla in senso lato includendo non solo i guasti dei componenti hardware (valvole, pompe, trasformatori, …), bensì considerando anche gli errori umani (―guasti‖ dell‘operatore o del manutentore) o errori del software di gestione e controllo (―guasti‖ software), gli eventi esterni ambientali (alluvioni, sismi, incidenti esterni connessi ad attività antropiche, ecc.)
In genere per guasto si intende la perdita di una funzionalità, il mancato soddisfacimento di un obiettivo di impianto, sistema, sotto-sistema o componente.
Al fine di identificare tutti i guasti e le relative conseguenze si procede con un approccio di decomposizione del problema in problemi più semplici. Ad esempio se si sta ragionando in termini strutturali si può pensare di scomporre l‘impianto in diversi sistemi, i sistemi in sottosistemi, i sottosistemi in componenti. Dopo di che si vanno ad esaminare in modo sistematico tutti i modi di guasto dei singoli componenti valutandone le conseguenze a livello locale ma anche sistemico. L‘approccio qui indicato sinteticamente è noto come Failure Mode,
- 13 -
Effect and Criticality Analysis (FMECA) e rappresenta uno degli strumenti implementati nello strumento software sviluppato nel presente lavoro.
L‘obiettivo principale di questo lavoro, infatti, è quello di mostrare come sia possibile integrare la FMECA con un‘analisi diagnostica, per permettere di ottenere informazioni sempre aggiornate riguardo a possibili guasti.
L‘analisi diagnostica è stata sviluppata partendo da un‘analisi approfondita del materiale disponibile in letteratura.
La tecnica implementata è quella della Principal Component Analysis (PCA), un metodo non parametrico per estrarre l‘informazione contenuta in un insieme di dati apparentemente confusi per ridondanza, rumore o inadatto riferimento.
L‘utilizzo della PCA in questo contesto consiste nel riconoscere se il dato corrente di funzionamento (es. di una macchina o equipaggiamento industriale) rientra in una partizione precedentemente definita come normale sulla base di dati ottenuti precedentemente. Se al contrario il dato corrente se ne discosta, verrà segnata un‘anomalia al sistema di supervisione, attraverso l‘interfaccia grafica sviluppata.
Il segnale analizzato all‘interno di questo lavoro si riferisce alla potenza assorbita, graficata nel dominio del tempo. Questo tipo di informazione è legata al concetto di firma elettrica.
Attraverso l‘implementazione congiunta della FMECA e dell‘analisi diagnostica è stato così possibile sviluppare un tool in grado non solo di riconoscere la presenza di un modo di guasto, ma anche di isolarlo rispetto al componente degradato, identificarlo con precisione e mostrarne la severità all‘operatore che utilizza lo strumento.
Lo strumento software proposto è stato sviluppato utilizzando due ambienti commerciali molto diffusi in ambito industriale: LabView 8.5 e Matlab2010.
Con il primo si è potuta ottenere un‘interfaccia grafica (figura sotto) mentre con il secondo si sono gestiti i calcoli matematici e le varie funzioni su cui si basa l‘analisi diagnostica legata alla PCA.
- 14 -
Lo strumento così ottenuto è stato quindi testato attraverso alcune prove svolte su una macchina utensile, con la quali è stato possibile validarlo.
Questo software è da considerarsi come supporto sia per gli utilizzatori della macchina, in un‘ottica tradizionale di gestione della manutenzione industrale, sia come strumento a supporto di un servizio di manutenzione che può essere offerto dal costruttore della macchina stessa.
- 15 -
List of definitions
Term Description
Condition based maintenance Preventive maintenance based on performance and/or parameter monitoring and the subsequent actions
Condition based maintenance system A system that uses performance and/or parameter monitoring to determine (and if possible schedule) maintenance actions autonomously or in interactions with other systems or humans
Conditional probability of failure The probability that a failure will occur in a specific period provided that the item concerned has survived to the beginning of that period
Corrective maintenance Maintenance carried out after fault recognition and intended to put an item into a state in which it can perform a required function
Diagnosis Fault recognition and identification
Failure Termination of the ability of an item to perform a required function
Failure consequence The way in which a failure mode or a multiple failure matters
Failure effect What happened when a failure mode occurs Failure mode A single event that causes a functional
failure
Fault State of an item characterized by inability to perform a required function, excluding the inability during preventive maintenance or other planned actions, or due to lack of external resources
- 16 -
Item Any part, component, device, subsystem, functional unit, equipment or system that can be individually considered.
Maintenance Combination of all technical, administrative and managerial actions during the life cycle of an item intended to retain it in, or restore it to, a state in which it can perform the required function.
Monitoring Activity, performed either manually or automatically, intended to observe the actual state of an item
Potential failure A potential failure is an identifiable physical condition which indicates a functional failure is imminent
Predetermined maintenance Preventive maintenance carried out in accordance with established intervals of time or number of units of use but without previous condition investigation.
Predictive maintenance Condition based maintenance carried out following a forecast derived from the analysis and evaluation of significant parameters of the condition of the item. Preventive maintenance Maintenance carried out at predetermined
intervals or according to prescribed criteria and intended to reduce the probability of failure or degradation of functioning of an item.
- 17 -
1
Production systems and maintenance
This chapter attempts to summarise the recent research and developments in diagnostics of mechanical systems implementing maintenance.
It presents theory and definitions regarding production and manufacturing systems, failure, faults and maintenance.
1.1 Background
Increased productivity is a key issue for manufacturing companies to stay competitive on a global market. Success, and even survival, in manufacturing requires continuous development and improvement in the way products are being produced.
The production systems of today are often guided by a complex production strategy and it is increasingly important that production is available to meet customer demand. As the trends of the new production strategies also imply working with fewer inventories, the production systems become even more vulnerable to unplanned unavailability.
Good product design is of course essential for products with high reliability. However, no matter how good the product design is, products deteriorate over time since they are operating under certain stress or load in the real environment, often involving randomness.
Maintenance as production support, has thus become very important to ensure equipment availability, quality products, on-time deliveries and plant safety. Even so, maintenance is still considered a cost center in many companies[ref.2].
Maintenance as a support function in production systems has been valued as a critical role and even as a prerequisite. This, of course, also implies that maintenance must be performed effectively, in other words, the correct maintenance action should be taken at the proper time.
- 18 -
Figure 1. The need and effect of maintenance on a production system.
Obviously, additional support functions are necessary in order to run a production system. However, as the Figure visualizes, maintenance plays a vital role in upholding production capacity.
According to Simeu-Abazi and Sassine (2001), the prime target of maintenance should be to ensure the system function of production equipment. Further, maintenance should provide the right parameters of: cost, reliability, maintainability, and productivity, for any automated manufacturing system.
Various approaches to performing maintenance exist. Also, various definitions of maintenance have been suggested through the years, the common point being that they have moved away from the traditional perception of maintenance to repair broken items. Maintenance is defined as a: ―Combination of all technical, administrative, and managerial actions during the life cycle of an item intended to retain it in, or restore it to, a state in which it can perform the required function.‖
Indeed, until the advent of CNC machines maintenance was largely unplanned, it took place when a breakdown occurred. There is no doubt that it was inefficient. The machine could be out service at the most incovenient times, there had to be a larger invetories of work in progress in case of breakdown and a breakdown crew had to be always available.
The development of CNC machines with the possibility of unmanned production certainly was one issue that caused a review of maintenance strategies.
It is well known in the companies that maintenance can be performed in two major types: corrective maintenance and preventive maintenance. Both of the traditional maintenance types are widely used in practically all industrial sectors [ref.15].
- 19 -
Figure 2. Overview of different maintenance types
Corrective maintenance, similar to repair work, is undertaken after a breakdown or when obvious failure has been located. Corrective maintenance is defined as: Maintenance carried out after fault recognition and intended to put an item into a state in which it can perform a required function. For repair work, some modeling approaches are available. With minimal repair, the failed item is only restored to its functioning state and the item continues as if nothing has happened. If the item instead is replaced by a new component of the same type, or if it is restored to an ―as good as new‖ condition, the failure rate will decrease to the level of when the item was just put into use.
For failures on critical functions, corrective maintenance has to be performed immediately. However, for failures that have no or little consequence on the comprehensive system function, the maintenance can be deferred in time to a better-suited occasion.
Conversely, preventive maintenance has been defined as: Maintenance carried out at predetermined intervals or according to prescribed criteria and intended to reduce the probability of failure or the degradation of the functioning of an item.
Preventive maintenance is divided into two types, predetermined maintenance and condition based maintenance.
Predetermined maintenance is scheduled and planned without the occurrence of any monitoring activities. The scheduling can be based on the number of hours in use, the number of times an item has been used; the number of kilometers the items has been used, according to prescribed
- 20 -
dates, and so on. Predetermined maintenance is best suited to an item that has a visible age or wearout characteristic and where maintenance tasks can be made at a time that for sure will prevent a failure from occurring.
In this strategy the machine is operated until a predetermined time when maintenance is carried out. The strategy has some advantages: it allows planning of maintenance resources, planning of the timing of downtime and planning for replacement.
Its main disadvantage lies with the value placed upon the predetermined time between maintenance procedures. It leads to possibly unnecessary downtime of the machine and the oversupply of replacement elements at scheduled maintenance periods.
Planning maintenance intervals based on age are not always the best approach; other alternatives should then be consulted. Although many failures are not related to age, most of them give incipient warnings that they are in the process of failing (Moubray, 1997). Thus, even if the great majority of machine tool users are still practising planned schedule maintenance, some users is wishing to implement condition based maintenance, that is the other preventive maintenance type.
Condition based maintenance does not utilize predetermined intervals and schedules [11]. Instead, it monitors the condition of items in order to decide on a dynamic preventive schedule. Condition based maintenance is based on measuring of working data, on monitoring of variables that describe the degrade of equipment.
These measurements should allow the prediction of the time to failure for all elements and thus allow maintenance to be planned before any elements fail.
The need for condition based maintenance was revealed as early as in the 1960‘s through a study performed during the development of the preventive maintenance program for the Boeing 747. The study purpose was to determine the failure characteristics of aircraft components. The study was, at the request of the Department of Defense (USA), documented and published by Nowlan and Heap in 1978 [ref.23].
Condition based maintenance can be described in different way. A first attempt to explain it, can be through the description of the ―Potential failure to Failure curve, P-F curve (see Figure). Consulting the P-F curve for a particular failure mode can give indications about what type of on-condition task is Appropriate [ref.24]. Obviously, in order to be effective, on-condition tasks must be performed in intervals shorter than the P-F interval.
- 21 -
Moubray defines an on-condition task as: ―A scheduled task used to determine whether a potential failure has occurred.‖, and further divides the on-condition techniques into four categories:
• condition monitoring technologies, • techniques based on product quality, • primary effects monitoring techniques, and
• inspection techniques based on the human senses.
Figure 3.The potential failure to failure curve of a ball bearing
Often, different potential failure conditions can precede a failure mode. The P-F interval of these potential failure conditions can vary a great deal, choosing more than one potential failure condition as a warning can be a good idea. As an example, an incipient ball bearing failure might start with changes in high frequency vibration characteristics, followed by increasing particle content in lubricating oil, audible noise, and, finally, heat builds up in the bearing caps [ref.27].
- 22 -
Failures in production systems can create many inconveniences. It is possible to list possible problems resulting from system failure, all of which can generate massive costs [ref.28]:
• lost production time, • volume of lost production,
• mass of harmful chemicals into the environment, • lost customers,
• warranty payments,
• cost of mobilization of emergency resources, and • insurance cost
A production system generates value when being utilized productively, and obviously costs money in an unproductive state.
1.2 The purpose of the thesis
The aim of this project is to develop a cheap diagnostic tool that can control the health of an industrial machine. The main idea of this research it to link the main aspects of maintenance in an unique software, based on LabView 8.5 and Matlab 2009.
The idea is to link diagnostic analysis with FMECA (Failure modes, effects and criticality analysis) and the analysis of failure history.
- 23 -
Figure 4. Purpose of thesis: integrate FMECA, DIAGNOSIS and FAILURE HISTORY
In fact, a good diagnosis and proper knowledge of failure history and plant criticality allow maintenance to be more accurate in analyzing the problems occurring on the production system. The reasons and the technique implemented to obtain this interaction will be explained in detail in the next chapters.
The project tries to analyze different fault conditions that could happen on an industrial machine (see case study used for validation that is presented in chapter 6).
- 24 -
Figure 5. Overview of the project
Diagnosis, based on Principle component analysis (P.C.A), starts with the analysis of electrical power signal characteristics (E.S.A), acquired from industrial machine.
The reason of linking diagnosis with FMECA is based on the idea to have good indicators about severity and probability of diagnosed failure. Using these parameters, in fact the maintenance operator can understand how the failure is dangerous for the plant and she/he can decide if it is needed to make maintenance or postpone it. The particular aspect of this tool is the possibility to update FMECA according to the faults in a ―real time‖ way.
In fact when a failure is found, it is added to a list of history of failure (CMMS). From these data, such as breakdown date and time duration of breakdown, it is possible to compute some parameters that are used to update regularly the indicators of FMECA.
Summarizing, the goal of this tool is therefore:
to add important technical information about failure to diagnosis. to obtain relevant information from the failure history.
- 25 -
1.3 Structure of the thesis
The thesis is divided into 6 chapters. The present Chapter 1 contains the introduction, with a background and problem discussion, followed by the purposes of the research. Chapters 2 and 3 contain a theoretical framework. Chapter 2 introduces the structure of FMECA and why it is important in a maintenance problem. Meanwhile, Chapter 3 introduces the development of a Fault Detection and Isolation (FDI) system based on an adaptive Principal Component Analysis (PCA) algorithm. Chapter 4 presents what is discussed in literature about interaction between Diagnosis and FMECA through reference of papers.
Chapter 5 and 6 present the industrial machine of the case study and describes the project, the implementation method and the software. Chapter 7 presents a discussion of the conclusions and suggestions on future research.
- 26 -
2
FMECA
This chapter attempts to analyze FMECA in all its parts: what FMECA, the procedure, the structure, etc.
2.1 Introduction
Traditionally, reliability has been achieved through extensive testing and use of techniques such as probabilistic reliability modeling. These are techniques done in the late stages of development. The challenge is to design in quality and reliability early in the development cycle of a product.
Therefore engineers introduced Failure Modes and Effects Analysis (FMEA). FMEA is a methodology for analyzing potential reliability problems early in the development cycle where it is easier to take actions to overcome these issues, thereby enhancing reliability through design. FMEA is used to identify potential failure modes, determine their effect on the operation of the product, and identify actions to mitigate the failures. A crucial step is anticipating what might go wrong with a product. While anticipating every failure mode is not possible, the development team should formulate as extensive a list of potential failure modes as possible.
The early and consistent use of FMEA in the design process allows the engineer to design out failures and produce reliable, safe, and customer pleasing products. FMEA does also capture historical information for use in future product improvement.[ref.16]
In this project it is used FMECA, an evolution of FMEA. The FMECA is composed of two separate analyses, the FMEA and the Criticality Analysis (CA). The FMEA must be completed prior to performing the CA. It provides the added benefit of showing a quantitative ranking of system and/or subsystem failure modes. The Criticality Analysis allows the analysts to identify reliability and severity related with particular components or systems. In this chapter how it is possible to complete FMEA analysis is presented, thus providing the basis from which perform FMECA.
- 27 -
2.1.1 What is FMEA - Failure Modes and Effects Analysis?
The National Aeronautics and Space Administration (NASA) define FMEA as a forward logic (bottom-up), tabular technique that explores the ways or modes in which each system element can fail and assesses the consequences of each of these failures. For them FMEA is a useful tool for cost and benefit studies to implement effective risk mitigation and countermeasure.
For Wikipedia, the free online encyclopedia, Failure Mode and Effect Analysis is a method that examines potential product or process failures, evaluates risk priorities, and helps determine remedial actions to avoid identified problems. It is an integral part of any ISO 9000 compliant quality system.
All these definitions have some terms in common. There is always a system and an examination of potential failures. After that follows an assessment of the identified failures [ref.4].
So, it is possible to define Failure Mode and Effects Analysis like an analysis technique which facilitates the identification of potential problems in the design or process by examining the effects of lower level failures.
Recommended actions or compensating provisions are made to reduce the likelihood of the problem occurring, and mitigate the risk, if in fact, it does occur.
The FMEA team determines, by failure mode analysis, the effect of each failure and identifies single failure points that are critical. It may also rank each failure according to the criticality of a failure effect and its probability of occurring ( SAE J1739, section 5 POTENTIAL FAILURE
MODE AND EFFECTS ANALYSIS FOR TOOLING & EQUIPMENT).
2.1.2 What is FMECA - Failure Modes Effects and Criticality Analysis?
The next step in the FMEA evolution was FMECA. FMECA is an acronym for Failure Modes and Effects Criticality Analysis. The American Society for Quality define it as a procedure that is performed after a failure mode effects analysis to classify each potential failure effect according to its severity and probability of occurrence [ref.7].
- 28 -
FMECA is used to support a number of different engineering activities. These include:
▪ Reliability Analyses – The FMECA should identify areas of greatest concern from a
logistic and / or safety viewpoint. Such areas should then be targeted for possible design changes which may for instance improve reliability.
▪ Maintainability Analyses – The FMECA often records and / or highlights areas of the
design which require some form of scheduled maintenance activity.
▪ Testability Analyses – FMECA often includes a detailed analysis of detection methods
including any Built In Test (BIT).
▪ Safety Analyses – failure mode criticality results will often feed into the Fault Tree
Analyses (FTA).
2.2 FMEA/FMECA Procedure
There are several different approaches to do a Failure Modes and Effects Analysis. One possible way is described in the following paragraph.
2.2.1 Preparation
Before undertaking an FMEA it is essential to undertake certain preparatory steps. The scope will depend on the complexity of the system being studied. First we have to define the system and its mission which should be analyzed. After that a description of the operation of the system has to be performed. And in the next steps the failure categories and the environmental conditions should be identified and described.
We start with describing the product or process and its function. An overall understanding of the product or process is very important. This understanding simplifies the process of analysis by helping the engineer identify those product/process uses that fall within the intended function and which ones fall outside. It is important to consider both intentional and unintentional uses since product failure often ends in litigation, which can be costly and time consuming.
- 29 -
2.2.2 Creating a Block Diagram
In the next step we are creating a Block Diagram of the product or process. This diagram shows major components or process steps as blocks connected together by lines that indicate how the components or steps are related. The diagram shows the logical relationships of components and establishes a structure around which the FMEA can be developed. The block diagram should always be included with the FMEA form.
2.2.3 Header of the FMEA Form worksheet
In this step we have to use a table like table n.1. If items are components, list them in a logical manner under their subsystem/assembly based on the block diagram.
After that we have to identify Failure Modes. A failure mode is defined as the manner in which a component, subsystem, system, process, etc. could potentially fail. A failure mode in one component can serve as the cause of a failure mode in another component. Each failure should be listed in technical terms.
At this point the failure mode should be identified whether or not the failure is likely to occur. Looking at similar products or processes and the failures that have been documented for them is an excellent starting point.
Then, it is needed to describe the effects of those failure modes. For each failure mode identified the engineer should determine what the ultimate effect will be. A failure effect is defined as the result of a failure mode on the function of the product/process as perceived by the customer. They should be described in terms of what the customer might see or experience should the identified failure mode occur.
- 30 -
The customer is to see as internal as well as external one. Some examples of failure effects are e.g. injury to the user, inoperability of the product or process, degraded performance, noise, etc.
Part Function Potential Failure Mode Potential Effects of Failure Severity Potential causes of failure
Occurrence How will the potetial failure be detected?
Detection RPN Action
Table 1.Header of FMECA
2.2.4 Severity
Severity is an assessment of the seriousness of the effect and refers directly to the potential failure mode being studied. The Customer in process FMEA is both the internal and where appropriate, external Customer. The severity ranking is also an estimate of how difficult it will be for the subsequent operations to be carried out to its specification in Performance, Cost, and Time. The Ranking and suggested criteria are listed in table n.2.
A common industry standard scale uses 1 to represent no effect and 10 to indicate very severe with failure affecting system operation and safety without warning. The intent of the ranking is to help the analyst determine whether a failure would be a minor nuisance or a catastrophic occurrence to the customer. This enables the engineer to prioritize the failures and address the real big issues first.
Effect
Criteria
Severity of Effect
Rank
None No effect 1
Very minor Minor disruption to production line
A portion of the product may have to be reworked. Defect not
noticed by average customers; cosmetic defects.
2
Minor Minor disruption to
production line.
A portion of the product may have to be reworked. Defect
noticed by average
- 31 -
customers; cosmetic defects.
Very low Minor disruption to production line.
The product may have to be sorted and reworked. Defect
noticed by average customers; cosmetic defects.
4
Low Some disruption to
product line.
100% of product may have to be reworked. Customer has
some dissatisfaction. Item is fit for purpose but may have
reduced levels of performance.
5
Moderate Some disruption to product line.
A portion of the product may have to be scrapped. Customer
has some dissatisfaction. Item is fit for purpose but may have
reduced levels of performance
6
High Some disruption to
product line.
Product may have to be sorted and a portion scrapped.
Customer dissatisfied. Item is useable but at reduced levels of
performance.
7
Very high Major disruption to production line.
100% of product may have to be scrapped. Loss of primary
function. Item unusable. Customer very dissatisfied
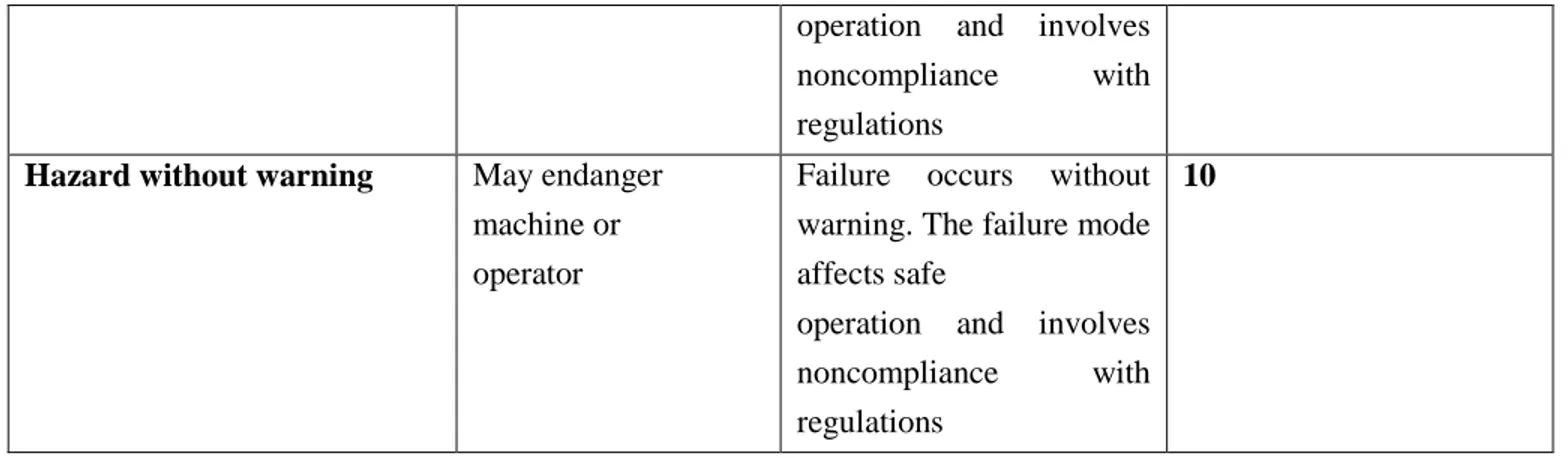
8
Hazard with warning May endanger machine or operator.
Failure occurs with warning. The failure mode affects safe
- 32 -
operation and involves noncompliance with regulations
Hazard without warning May endanger machine or operator
Failure occurs without warning. The failure mode affects safe
operation and involves noncompliance with regulations
10
Table 2.Standard scale to assess the effects of a fault
2.2.5 Causes of failure mode
Identify the causes for each failure mode. A failure cause is defined as a design weakness that may result in a failure. The potential causes for each failure mode should be identified and documented. The causes should be listed in technical terms and not in terms of symptoms. Examples of potential causes include improper torque applied, Improper operating conditions, too much solvent, improper alignment, excessive voltage etc.[18]
2.2.6 Criticality analysis: Occurrence
The Occurrence is the assessment of the probability that the specific cause of the Failure mode will occur. A numerical weight should be assigned to each cause that indicates how likely that cause is (probability of the cause occurring).
For that failure history is helpful in increasing the truth of the probability. Therefore historical data stored in databases can be used and questions like the following are very helpful to solve this problem.
What statistical data is available from previous or similar process designs? Is the process a repeat of a previous design, or have there been some changes?
- 33 -
Is the process design completely new?
Has the environment in which the process is to operate changeable? Have mathematical or engineering studies been used to predict failure?
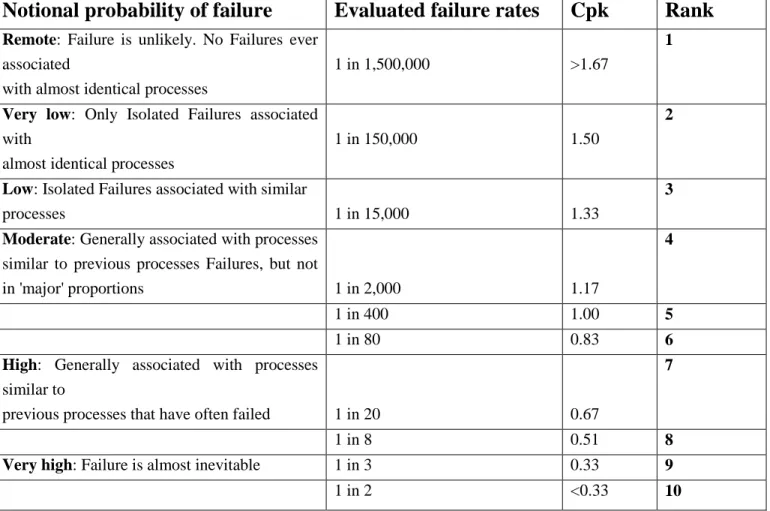
A common industry standard scale uses 1 to represent unlikely and 10 to indicate inevitable. The Ranking and suggested criteria are can seen in table n.3.
Notional probability of failure
Evaluated failure rates
Cpk
Rank
Remote: Failure is unlikely. No Failures ever
associated
with almost identical processes
1 in 1,500,000 >1.67
1
Very low: Only Isolated Failures associated
with
almost identical processes
1 in 150,000 1.50
2
Low: Isolated Failures associated with similar
processes 1 in 15,000 1.33
3 Moderate: Generally associated with processes
similar to previous processes Failures, but not
in 'major' proportions 1 in 2,000 1.17
4
1 in 400 1.00 5
1 in 80 0.83 6
High: Generally associated with processes
similar to
previous processes that have often failed 1 in 20 0.67
7
1 in 8 0.51 8
Very high: Failure is almost inevitable 1 in 3 0.33 9
1 in 2 <0.33 10
Table 3. A common industry standard scale to assess the criticality of a fault
2.2.7 Detection
Here we have to distinguish between two types of detection. On one hand we have to identify Current Controls (design or process).
- 34 -
Current Controls (design or process) are the mechanisms that prevent the cause of the failure mode from occurring or which detect the failure before it reaches the Customer. The engineer should now identify testing, analysis, monitoring, and other techniques that can or have been used on the same or similar products/processes to detect failures. Each of these controls should be assessed to determine how well it is expected to identify or detect failure modes.
After a new product or process has been in use previously undetected or unidentified failure modes may appear. The FMEA\FMECA should then be updated and plans made to address those failures to eliminate them from the product/process.
The other thing is to assess the probability that the proposed process controls will detect a potential cause of failure or a process weakness. Assume the failure has occurred and then assess the ability of the Controls to prevent shipment of the part with that defect. Low Occurrence does not mean Low Detection - the Control should detect the Low Occurrence. Statistical sampling is an acceptable Control. Improving Product and/or Process design is the best strategy for reducing the Detection ranking - Improving means of Detection still requires improved designs with its subsequent improvement of the basic design. Higher rankings should question the method of the Control. The ranking and suggested criteria are shown in table n.4.
Detection
The likelihood the Controls will detect a Defect
Rank
Almost Certain Current controls are almost certain to detect the Failure Mode. Reliable detection controls are known with similar processes.
1
Very High Very High likelihood the current controls will detect the Failure Mode.
2
High High likelihood that the current controls will detect the Failure Mode.
3
Moderately High Moderately high likelihood that the current controls will detect the Failure
Mode.
4
Moderate Moderate likelihood that the current controls will detect the Failure Mode.
5
Low Low likelihood that the current controls will detect the Failure Mode
6
Very Low Very Low likelihood that the current controls will detect the Failure Mode
- 35 -
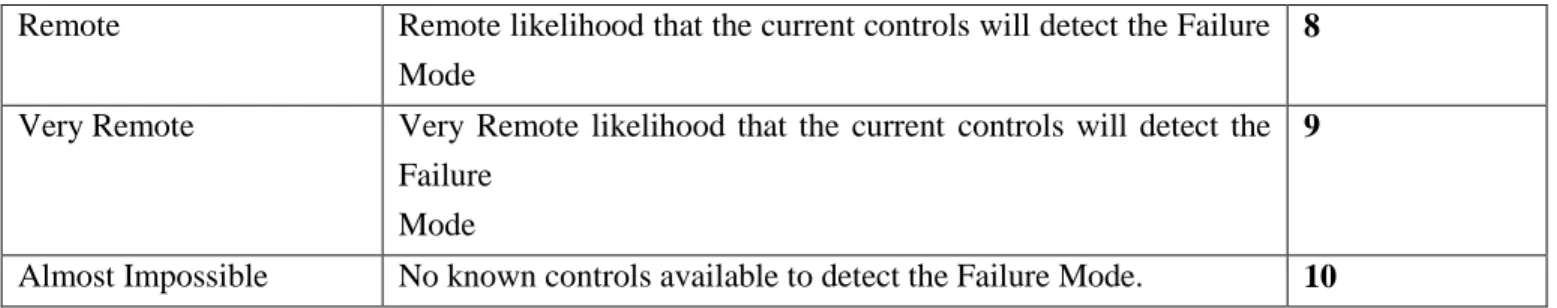
Remote Remote likelihood that the current controls will detect the Failure Mode
8
Very Remote Very Remote likelihood that the current controls will detect the Failure
Mode
9
Almost Impossible No known controls available to detect the Failure Mode. 10 Table 4. The ranking and different criteria to assess Detection
2.2.8 Risk Priority Numbers (RPN)
The Risk Priority Number is a mathematical product of the numerical Severity, Probability, and Detection ratings:
RPN = (Severity) x (Probability) x (Detection)
The RPN is used to prioritize items than require additional quality planning or action.
2.2.9 Actions
Determine Recommended Action(s) to address potential failures that have a high RPN. These actions could include specific inspection, testing or quality procedures; selection of different components or materials; de-rating; limiting environmental stresses or operating range; redesign of the item to avoid the failure mode; monitoring mechanisms; performing preventative maintenance; and inclusion of back-up systems or redundancy.
After that we have to assign Responsibility and a Target Completion Date for these actions. This makes responsibility clear-cut and facilitates tracking.
Update the FMECA as the design or process changes, the assessment changes or new information becomes known [ref.6]-[ref.4]-[ref.3].
- 36 -
2.3 FMEA/FMECA in this research
Strengths of FMECA include its comprehensiveness, the systematic establishment of relationships between failure causes and effects, and its ability to point out individual failure modes for corrective action in design of an equipment / machine. Main weaknesses include the extensive labor required, the large number of trivial cases considered, and the inability to deal with multiple-failure scenarios or unplanned cross-system effects such as sneak circuits.
Failure Modes, Effects, and Criticality Analysis is however an excellent hazard analysis and risk assessment tool, but it suffers from the above mentioned limitations. Therefore, FMECA should be used in conjunction with other analytical tools when developing reliability estimates.
Another main reason for which people do not fully utilize the FMEA/FMECA result is that they do not know how and when to link the FMEA/FMECA information with the process control functions in the industrial plant.
In this work one possible link between FMEA/FMECA in conjunction with other analytical tools based on diagnosis is analyzed and validated through a software tool in the context of maintenance of a machine tool.
More precisely, through FMEA/FMECA, we can have some important parameters like severity and probability of a failure. It is possible to use these parameters for example to show in real time to a technical operator the seriousness of a fault that is occurring.
Severity and probability will be linked to quantitative measures like mean down time associated to a failure and mean time between failures, so to allow a further automatic generation of FMECA indicators.
Moreover one can use information from historical failure to update FMEA/FMECA, in the next chapters all these links will be analyzed with more details.
- 37 -
3
Principal Component Analysis for Fault
Detection and Isolation
This chapter describes the development of a Fault Detection and Isolation (FDI) system based on an adaptive Principal Component Analysis (PCA) algorithm, used to compare the current machine operation state with a “good behaviour” model based on a preliminary set of data.
3.1 Introduction
A progressing fault in machinery will affect certain parameters, such as vibration, noise, temperature, debris, etc. In machinery diagnostics it is essential to analyze external relevant information such as vibrations to judge the condition of internal components, which are usually inaccessible without dismantling the machines. In this work, an electric signal is used to detect incipient faults and the proposed tool is tested in the case proposed in Chapter 6.
Machine fault diagnostics is a procedure of mapping the information obtained in the measurement space and/or features in the feature space to machine faults in the fault space. This mapping process is also called pattern recognition. Traditionally, pattern recognition is done manually with auxiliary graphical tools such as power spectrum graph, phase spectrum graph, cepstrum graph, AR spectrum graph, spectrogram, wavelet scalogram, wavelet phase graph, etc. However, manual pattern recognition requires expertise in the specific area of the diagnostic application. Thus, highly trained and skilled personnel are needed. Therefore, automatic pattern recognition is highly desirable. This can be achieved by classification of signals based on the Information and/or features extracted from the signals. In the following sections, different machine fault diagnostic approaches are discussed with emphasis on statistical approaches and artificial intelligent approaches.
- 38 -
3.1.1 Statistical approaches
A common method of fault diagnostics is to detect whether a specific fault is present or not based on the available condition monitoring information without intrusive inspection of the machine. This fault detection problem can be described as a hypothesis test problem with null hypothesis H0: Fault A is present, against alternative hypothesis H1: Fault A is not present. In a concrete fault diagnostic problem, hypotheses H0 and H1 are interpreted into an expression using specific models or distributions, or the parameters of a specific model or distribution. Test statistics are then constructed to summarize the condition monitoring information so as to be able to decide whether to accept the null hypothesis H0 or reject it.
Cluster analysis, as a multivariate statistical analysis method, is a statistical classification approach that groups signals into different fault categories on the basis of the similarity of the characteristics or features they possess. It seeks to minimise within-group variance and maximise between-group variance. The result of cluster analysis is a number of heterogeneous groups with homogeneous contents: there are substantial differences between the groups, but the signals within a single group are similar.
A natural way of signal grouping is based on certain distance measures or similarity measure between two signals. These measures are usually derived from certain discriminant functions in statistical pattern recognition. Commonly used distance measures are Euclidean distance, Mahalanobis distance, Kullback–Leibler distance and Bayesian distance.
Baydar [ref. 8] investigated the use of an another multivariate statistical technique known as principal component analysis (PCA) for analysis of the time waveform signals in gear fault diagnostics, and this approach (used in this thesis) is discussed in the next paragraph 3.2.
3.1.2 Artifical Intelligence approaches
AI techniques have been increasingly applied to machine diagnosis and have shown improved performance over conventional approaches. In practice, however, it is not easy to apply AI techniques due to the lack of efficient procedures to obtain training data and specific knowledge, which are required to train the models. So far, most of the applications in the literature just used experimental data for model training. In the literature, two popular AI technique for machine
- 39 -
diagnosis are artificial neural networks (ANNs) and expert systems (ESs) . Other AI techniques used include fuzzy logic systems, fuzzy–neural networks (FNNs), neural–fuzzy systems and evolutionary algorithms (EAs). An ANN is a computational model that mimics the human brain structure. It consists of simple processing elements connected in a complex layer structure which enables the model to approximate a complex non-linear function with input and multi-output. A processing element comprises a node and a weight. The ANN learns the unknown function by adjusting its weights with observations of input and output. This process is usually called training of an ANN. There are various neural network models, each one with its pros and contras.
The ANN models usually use supervised learning algorithms which require external input such as the a priori knowledge about the target or desired output. For example, a common practice of training a neural network model is to use a set of experimental data with known (seeded) faults. This training process is supervised learning. In contrast to supervised learning, unsupervised learning does not require external input. An unsupervised neural network learns itself using new information available.
In contrast to neural networks, which learn knowledge by training on observed data with known inputs and outputs, ESs utilize domain expert knowledge in a computer program with an automated inference engine to perform reasoning for problem solving. Three main reasoning methods for ES used in the area of machinery diagnostics are rule-based reasoning, case-based reasoning and model-based reasoning.
ESs and neural networks have their own limitations. One main limitation of rule-based ESs is combinatorial explosion, which refers to the computation problem caused when the number rule increases exponentially as the number of variables increases. Another main limitation is consistency maintenance, which refers to the process by which the system decides when some of the variables need to be recomputed in response to changes in other values. Two main limitations of neural networks are the difficulty to have physical explanations of the trained model and the difficulty in the training process. Obviously, combination of both techniques would significantly improve the performance.
In condition monitoring practice, knowledge from domain specific experts is usually inexact and reasoning on knowledge is often imprecise. Therefore, measures of the uncertainties in knowledge and reasoning are required for ES to provide more robust problem solving. Commonly used uncertainty measures are probability, fuzzy member functions in fuzzy logic theory and belief functions in belief networks theory.
- 40 -
Neural networks and ESs have also been combined with other AI techniques to enhance machine diagnostic systems.
3.1.3. Other approaches
Another class of machine fault diagnostic approaches is the model-based approaches. These approaches utilize physics specific, explicit mathematical model of the monitored machine. Based on this explicit model, residual generation methods such as Kalman filter, parameter estimation (or system identification) and parity relations are used to obtain signals, called residuals, which is indicative of fault presence in the machine. Finally, the residuals are evaluated to arrive at fault detection, isolation and identification. Model-based approaches can be more effective than other model-free approaches if a correct and accurate model is built. However, explicit mathematical modelling may not be feasible for complex systems since it would be very difficult or even impossible to build mathematical models for such systems. Various model-based diagnostic approaches have been applied to fault diagnosis of a variety of mechanical systems such as gearboxes , bearings , rotors and cutting tools .
The information provided by these methods was shown to be very helpful to having more precise fault identification along with evaluating the confidence of a diagnostic decision.
Petri nets, as a general purpose graphical tool for describing relations existing between conditions and events, have recently been applied to machine fault detection and diagnostics.
3.2 PCA modeling
Principal component analysis is one of the most popular statistical methods, for extracting information from measured data, which finds the directions of significant variability in the data by forming linear combinations of variables.
Consider a data matrix X Є Rnxm containing n samples of m process variables collected under
normal operation.
This matrix must be normalized to zero mean and unit variance with the scale parameter vectors and s as the mean and variance vectors respectively. Next step to calculate PCA is to construct the covariance matrix R:
- 41 -
and performing the SVD decomposition on R:
(2) where is a diagonal matrix that contains in its diagonal the eigenvalues of R sorted in decreasing order ( ). ). Columns of matrix V are the eigenvectors of R. The transformation matrix P Є Rmxa is generated choosing a eigenvectors or columns of V
corresponding to a principal eigenvalues. Matrix P transforms the space of the measured variables into the reduced dimension space.
(3)
Columns of matrix P are called loadings and elements of T are called scores. Scores are the values of the original measured variables that have been transformed into the reduced dimension space. Operating in equation (3), the scores can be transformed into the original space.
(4) The residual matrix E is calculated as:
(5) Finally the original data space can be calculated as:
(6)
It is very important to choose the number of principal components a, because TPT represents the
principal sources of variability in the process and E represents the variability corresponding to process noise. There are several proposed procedures for determining the number of components to be retained in a PCA model as:
- 42 -
a) The SCREE procedure. It is a graphical method in which one constructs a plot of the eigenvalues in descending order and looks for the knee in the curve. The number of selected components are the components between the high component and the knee. b) Cumulative Percent Variance (CPV) approach. It is a measure of the percent variance
(CPV(a) ≥ 90%) captured by the first a principal components is adopted:
(7) c) Cross validation. [8]
3.2.1 Statistics for monitoring
Having established a PCA model based on historical data collected when only common cause variation are present, multivariate control charts based on Hotelling‘s T2 and square prediction
error (SPE) or Q can be plotted. The monitoring can be reduced to this two variables (T2 and Q) characterizing two orthogonal subsets of the original space. T2 represents the major variation in the data and Q represents the random noise in the data. T2 can be calculated as the sum of squares of a new process data vector x:
(8) where is a squared matrix formed by the first a rows and columns of .
The process is considered normal for a given significance level a if:
(9)
where is the critic value of the Fisher-Snedecor distribution with n and n-a degrees of freedom and α the level of significance. α takes values between 90% and 95%. T2 is based on the first a principal components so that it provides a test for derivations in the latent variables that are of greatest importance to the variance of the process. This statistic will only detect an
- 43 -
event if the variation in the latent variables is greater than the variation explained by common causes.
New events can be detected by calculating the squared prediction error SPE or Q of the residuals of a new observation. Q statistic, is calculated as the sum of squares of the residuals. The scalar value Q is a measurement of goodness of fit of the sample to the model and is directly associated with the noise:
(10) With:
(11) The upper limit of this statistic can be computed as the next form:
(12) With:
(13) where cα is the value of the normal distribution with α the level of significance.
When an unusual event occurs and it produces a change in the covariance structure of the model, it will be detected by a high value of Q.
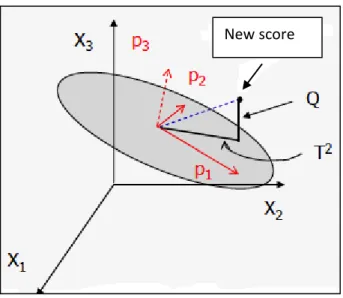
In the figure below it is possible to see in a graphic representation the two statistical parameter : T2 and Q.
- 44 -
Figure 7. Graphical representation of PCA and parameters Q and T2
To implement a monitoring and fault detection system based on PCA, it is necessary to consider two tasks:
OFF-LINE
1. Acquire training data which represents normal process operations. 2. Scale the training data and obtain the scale parameter vectors 1x and s. 3. Carry out SVD to obtain PCA model.
4. Determine the number of principal components and the upper control limits for
T2 and Q statistics. ON-LINE
1. Obtain the next testing sample x, and scale it using the scale parameter vectors
and s.
2. Evaluate the T2 and Q statistics using the obtained PCA model. If one of these
exceeds the upper limit, this measurement is considered an alarm. If there are some consecutive established number of alarms, an uncommon event has occurred.
3. Repeat from step 2.[ref.3]-[ref.8]
- 45 -
3.3 Conclusion
PCA, explained in this chapter, is used in this project to detect a machine failure using Electric Signature Analysis (ESA).
It is decided to use ESA, because in this research detection starts from characteristic features of the time waveform signals as descriptive statistics such as:
- mean peak,
- peak to-peak interval, - standard deviation, - crest factor,
- skewness index, - kurtosis index
The indicators are taken from a previous research activity, during a project that involves companies and Politecnico di Milano about the use of Electric Signature Analysis (ESA).
Using PCA, it is then possible to extract information from these data, and then to detect failure with multivariate control charts based on Hotelling‘s T2 and square prediction error (SPE). This procedure is implemented in Matlab code and integrated in the project with Labview8.5, as explained in Chapter 5.
- 46 -
4
CBM-FMECA
This chapter gives a litterature overview about Condition-based maintenance (CBM), namely the part related with diagnostic analysis, and its links with FMECA.
In literature, there is a great amount of contributions analyzing and proposing different maintenance processes and their applications using a myriad of technologies. From this plenty of diversified information, some authors have made the effort of classifying the maintenance processes and, in this way, contribute to structuring this discipline.
For example, Levrat et al (2008) determine four classes of possible maintenance applications: for strategy, for diagnosis and prognosis, for maintenance policy assessment and maintenance scheduling, and for deployment and implementation.
The proposed tool (showed in next Chapter 5) should contribute to the following (with respect to the categories mentioned by Levrat et al.(2008)): the CBM module has to do with diagnosis and prognosis, the FMECA module could support the maintenance scheduling and finally.
More oriented to the content management, Karim et al (2009) summarise and classify the multiples industrial and academic artefacts than can be used to the maintenance information exchange, useful for systems integration. These information exchange standards are classified in Maintenance Specific Contributions (like S1000D, MIMOSA, PROTEUS, etc) and in Generic Contributions (like XML, ISO 10303 and ISO 15531).
![Figure 8. The seven modules in a condition based maintenance system[ref-26].](https://thumb-eu.123doks.com/thumbv2/123dokorg/7525027.106404/49.918.185.727.112.607/figure-seven-modules-condition-based-maintenance-ref.webp)
![Table 5. The computerized/cognitive tasks/activities can be used to explain that condition based maintenance systems as well can have different levels of automation.[ref.9]](https://thumb-eu.123doks.com/thumbv2/123dokorg/7525027.106404/51.918.86.789.109.824/computerized-cognitive-activities-explain-condition-maintenance-different-automation.webp)
