UNIVERSITÀ DEGLI STUDI DELLA TUSCIA DI VITERBO
DIPARTIMENTO PER L’INNOVAZIONE NEI SISTEMI BIOLOGICI,
AGROALIMENTARI E FORESTALI
Corso di Dottorato di Ricerca in Ecologia Forestale
XXVI ciclo
Statistical analyses and techniques
for forest volume estimation and stand structural classification
using airborne laser scanner data
SSD AGR/05
Chiara Torresan
Coordinator
Prof. Paolo De Angelis
Advisor
Dr. Gianfranco Scrinzi Co-advisor
Prof. Piermaria Corona
“The scenes in our life resemble pictures in a rough mosaic; they are ineffective from close up, and have to be viewed from a distance if they are to seem beautiful...." Arthur Schopenhauer
Abstract
Forests represent an important environmental and economic resource and an accurate knowledge of the amount of timber volume and their structural features allows efficient forest management strategies on which decision making processes depend.
Airborne laser scanning (ALS) is widely used for the retrieval of detailed information on height and cover of forests at different levels, whether for individual trees, plots, stands or on a nationwide forest scale. Coupling aerial laser scanner data with inventory data provides information on timber volume and forest structural characterization, and improves the precision of forest inventory estimates.
This thesis attempted to provide specific solutions to some problems and objectives encountered by the Forest Service of Trento Province (Northern East of Italy) pertaining to both forest volume estimation at the forest compartment level and area of classification of structure of forest stands.
Volume estimation at stratum level can be obtained from field plots located within, on the contrary volume estimation in portions of strata may be problematic due to the small number or even the absence of plots in those portions. But if a Canopy Height Model (CHM) is available for the whole area under planning, height at pixel level can be used as auxiliary information. A ratio model presuming a proportional relationship between heights and volumes at pixel level was adopted to lead to an estimation. From this model, the volume within any portion was estimated as the proportionality factor estimate multiplied by the total of heights in that portion. This volume estimator was considered from the model-based, design-based and hybrid perspectives, and variances and their estimator were derived under the three approaches. Volume estimator and the model-based, design-based, and hybrid variance estimators were checked by a simulation study performed on a real forest in Val di Sella (South-Eastern of Trento Province), considered as a fixed population in which plots were randomly allocated at each simulation run. Furthermore, volume estimator and the hybrid variance estimator were applied to infer the volume of four forest compartments in the public forest estate of San Martino di Castrozza (North-Eastern of Trento province). The simulation and the case study showed that the bias of the volume estimator derived from the ratio model adopted depends on the similarity of the whole stratum and the portion of stratum in which estimation is performed. In presence of negligible bias, the results from simulation and case study are satisfactory in terms of relative root mean square error and hybrid variance estimates, respectively.
The Forest Service of Trento Province presently uses a structural classification system based on the percentage of basal area in small (or understory), medium (or mid-story), and large (or overstory) trees. The classification in forest structural types is one of the primary goals along with species composition, for forest managers to identify the strata in the process of forest inventory based on stratified sampling. Moreover, the forest structural classification is used during the decision making process.
This dissertation examined the use of CHM-derived metrics to predict one of the twelve forest structure classes of the classification system utilized by the Forest Service. Two approaches to predict size-based forest classifications were evaluated: in the first, supervised classification with both linear discriminant analysis (LDA) and random forest (RF) was attempted; in the second, basal areas of small, medium, and large trees from CHM-derived variables by k-nearest neighbor imputation (k-NN) and parametric regression were predicted, and then classified observations based on their predicted basal areas. Leave-one-out cross-validation was used to evaluate the ability to predict forest structure classes from CHM data and in the case of prediction-based classification approach the performances in predicting basal area were evaluated. The strategies proved moderately successful, being the LDA the techniques with best performance. In general, the prediction of basal areas of understory and overstory trees was the most successful.
An additional study was carried out to assess whether metrics extracted this time from lidar raw point cloud can be exploited to discriminate different forest types through machine learning techniques such as classification trees. This study suggests that the proportion of basal area in diameter size-classes is a valuable parameter to distinguish between different forest structural clusters through clustering analysis. The five airborne laser scanner metrics selected for this study were able to confirm that at least one of the five forest structure patterns identified by the clustering analysis (pole-stage, young, adult, mature, and old forests) is different from the other patterns. The classification tree model built into this study provided moderately satisfactory results in term of classification performance. The binary tree representing the model is clearly interpretable and easily usable by forest technicians in operational contexts.
This dissertation contributed to the body of knowledge that is related to the application of statistical analyses and techniques for forest resources inventory using airborne laser scanner data. Nevertheless, more work is suggested. Future research emphasis could be on how reflectivity from a laser of different wavelengths could be used to discriminate between different types of forest cover. Moreover fusion between lidar data and other image sources could be investigated.
Keywords:
lidar, forest inventory, forest management, standing wood volume estimation, basal area, forest structure classification, statistical methodsAcknowledgments
I would like to thank Dr. Gianfranco Scrinzi for his advice coming from his strong expertise in forest management planning. Thanks to him I learned to doubt everything and to “dissect” the data to ask appropriate questions.
I would like to thank Prof. Piermaria Corona for his accurate and valuable suggestions and for giving me the chance to participate in workshops dedicated to the application of airborne laser scanning in forestry.
I would like to thank Antonio Floris, Fabrizio Clementel, Giacomo Colle, and Sandro Gecele for their willingness to exchange points of view, and for always offering support when needed.
Thanks to Warren Cohen, Yang Zhiqiang, Harold Zald, and Jacob Strunk for their welcome to the Laboratory for Applications of Remote Sensing in Ecology in Corvallis and their kindness during my two-month stay. I would especially like to thank Jacob and Harold because it is through their guidance in writing a paper that I learned the importance of answering basic research questions. Moreover they pushed me to challenge the validity of my own research, until the methods, statistical analyses and results were defensible.
I would like to thank all statisticians with whom I worked for my PhD research activities. Thanks to Sara Franceschi and to Jacob Strunk one more time, for help in the use of R software. Thanks to Joan Valls for time, knowledge, competence and support in learning statistical methodological procedures to conduct research using R software, for providing statistical advice, analytical critiques, and important revisions. Thanks to Prof. Lorenzo Fattorini for instilling the tenacity and perseverance of defending my own thesis.
Thanks to Maria Flora Mangano for helping me learn the rules and secrets about the communication of scientific research.
My most heartfelt to Dr. Amy Schoener for help in revising the English language of this dissertation.
I would also like to thank all people I met at the Forest Monitoring and Management Research Unit in Trento with whom I shared space and time, especially Fabio Pastorella for providing some of the data used in a study carried out within the PhD.
Last but not least, I must express my thanks to my partner Mirco Maistro for his continuous support during these three years. It has been a busy period handling both research activities and growing family, Tina and Emiliano. The future is uncertain but with my partner and his music by my side, I feel on safe ground.
Table of contents
1 Introduction ... 1
1.1 An overview on airborne laser scanning, its products, and accuracy of retrievable information ... 1
1.2 Area-based and individual tree detection approaches ... 6
1.3 ALS-assisted assessment of forest standing volume in Italy ... 8
1.4 ALS-assisted assessment of forest stand structure in Italy... 9
1.5 Research problems and aims of the research activities ... 11
1.6 Structure of the thesis ... 13
1.7 References ... 14
2 Full validation of a linear model based on CHM-derived metrics for timber volume estimation .. ... 19
2.1 Introduction ... 19
2.2 Materials and methods... 20
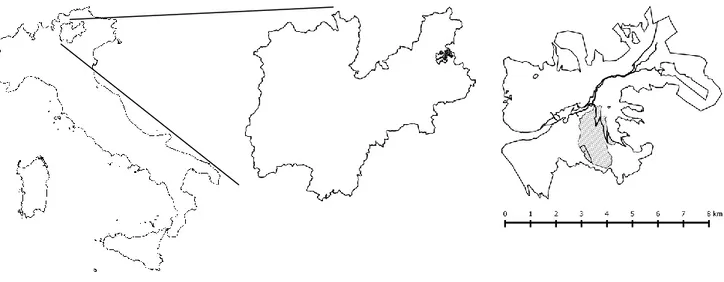
2.2.1 Study area ... 20
2.2.2 Model A development ... 21
2.2.3 Field data collection for volume computation at forest compartment level ... 23
2.2.4 Application of Model A at forest compartment level ... 25
2.3 Results ... 25
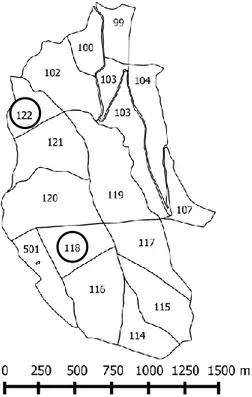
2.3.1 Field-validation of forest compartments boundaries and height-diameter function for two forest compartments... 25
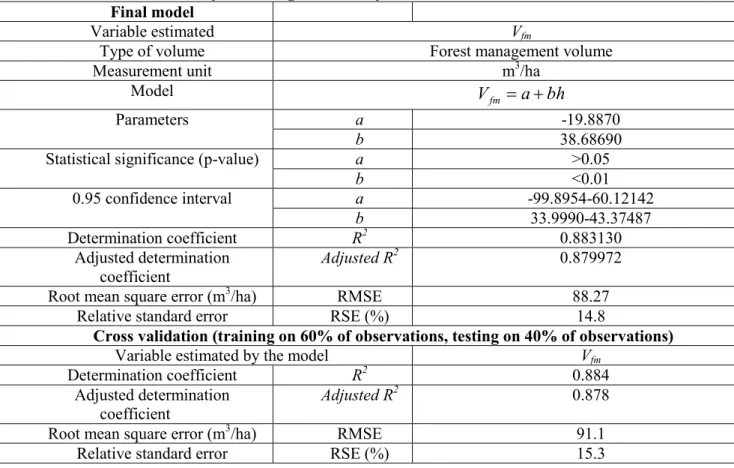
2.3.2 Full validation of Model A... 27
2.4 Discussion ... 27
2.5 References ... 28
3 Volume estimation in forest compartments by exploiting CHM information: model-based, design-based and hybrid inferences ... 29
3.1 Introduction ... 29
3.2 Forest volume estimation strategies ... 32
3.2.1 Preliminary notations ... 32
3.2.2 The ratio model and the volume estimator ... 33
3.2.3 The model based inference ... 35
3.2.4 The design-based inference ... 35
3.2.5 The hybrid inference ... 38
3.3 The simulation study ... 39
3.3.1 Study site and field data collection ... 39
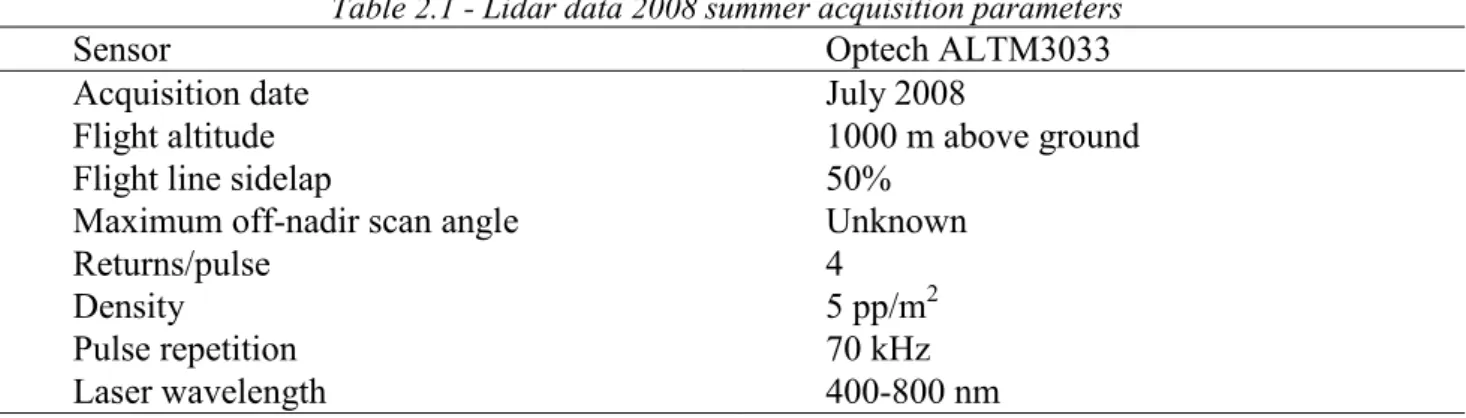
3.3.2 Lidar data ... 40
3.3.3 Simulation procedure ... 41
3.3.4 Results from the simulation study and discussion ... 42
3.4 The case study ... 45
3.4.1 Study site and field data collection ... 45
3.4.2 Lidar data ... 47
3.4.3 The application of hybrid approach ... 48
3.4.4 Results from the case study ... 49
3.5 Discussion ... 50
3.6 References ... 51
4 Classification of forest stand structure using CHM-derived metrics: a comparison among statistical techniques ... 53
4.2 Material ... 54
4.2.1 Study area ... 54
4.2.2 The forest structural classification system used by the Forest Service of Trento Province ... 55
4.2.3 Field data collection and response variables ... 56
4.2.4 Lidar sampling and lidar predictor variables ... 57
4.3 Methods ... 58
4.3.1 Supervised classification approach ... 58
4.3.2 Prediction-based classification approach ... 60
4.3.3 Selection of predictor variables ... 61
4.3.4 Performance statistics ... 61
4.4 Results ... 62
4.5 Discussion ... 66
4.6 References ... 68
5 Classification trees to predict forest structural clusters through lidar metrics extracted from discrete return laser scanner data ... 72
5.1 Introduction ... 72
5.2 Materials ... 73
5.2.1 Study area ... 73
5.2.2 Field data collection ... 73
5.2.3 Forest structural indices from field data ... 75
5.2.4 ALS data acquisition and delivering ... 77
5.2.5 Classification, and normalization of lidar point clouds ... 77
5.2.6 Computation of lidar point cloud metrics ... 80
5.3 Methods ... 82
5.3.1 Overview of the methodological strategy ... 82
5.3.2 Bivariate analysis by means of Pearson and Spearman statistical tests ... 83
5.3.3 Cluster analysis ... 85
5.3.4 Kruskal-Wallis test ... 86
5.3.5 Classification and regression trees (CART)... 87
5.4 Results ... 89
5.4.1 Statistical distribution of dendrometric data and forest structural indices ... 89
5.4.2 The measure of association between lidar predictor variables and response variable . 89 5.4.3 The characteristics of the forest structure patterns ... 92
5.4.4 Classification trees to predict forest structure ... 97
5.5 Discussions ... 100 5.6 References ... 101 6 Conclusion ... 104 6.1 Contributions ... 104 6.2 Limitations... 106 6.3 Future research ... 107 6.4 References ... 108
1
1 Introduction
In this chapter an introduction to the issues of the dissertation is provided. An overview of airborne laser scanning and its products is given. After that, applications of airborne laser scanning to assess forest standing volume and to characterize forest stand structure are delineated. Research problems and aims of this dissertation are illustrated, and finally a short description of dissertation structure is described.
1.1 An overview on airborne laser scanning, its products, and accuracy of retrievable information
Airborne near-infrared lidar is an active remote-sensing technique that provides three-dimensional high-precision measurements of targets in the form of a point cloud (x, y, z, intensity of the backscattered power), based on laser-ranging measurements supported by the position and orientation information derived with use of a Differential Global Positioning System (DGPS) device and an Inertial Measurement Unit (IMU) mounted on an airplane or an helicopter [Yu et al., 2010]. As an active sensing system, the airborne laser scanning (ALS) uses a laser beam as the sensing carrier which is considered as two optical beams, the emitted laser pulse and the received portion of that pulse. One advantage of ALS is that the laser scanners are not dependent on the sun as a source of illumination, and the interpretation of laser scanner data is not hampered by shadows caused by clouds or neighboring objects. This means that laser scanner pulses may travel unimpeded back and forth along the same path through small openings in a forest canopy, providing information about the tree crowns and the forest floor [Wagner et al., 2004].
All airborne laser systems measure the distance between the sensor and the illuminated spot on the ground (Figure 1.1), applying specific ranging principles.
2 In range measurements with laser, two major ranging principles are applied: the pulsed ranging principle, and ranging by measuring the phase difference between the transmitted and the received signal backscattered from the object surface. The former principle is applied when pulsed lasers (also known as discrete return systems) are used: in this case the travelling time (or time of flight) between the emitted and received pulse is recorded, and the range is calculated as the following:
L ct R 2 1 [1.1]
where c is the speed of light, tL is travelling time of a light pulse.
With lasers that continuously emit light and then digitize the full waveform of the backscattered pulse (called continuous wave lasers or full waveform lasers), the phase difference principle is applied, and the range is calculated as the following:
f c R 4 1 [1.2]
where c is the speed of light, f is the frequency of signal emission, and Φ is the phase difference between the received and the transmitted signal.
In the very early lidar discrete return system, the laser scanner recorded at least the round-trip time of the emitted and received pulse. By 2000, commercial systems became capable of recording the time of multiple discrete returns (or echoes) for each transmitted pulse and the reflected intensity for each return. Multiple return lidar systems are very useful in forestry applications: when the laser beam from a multi-return system interacts with a tree canopy, then the first return is usually assumed to arrive from the top of the tree (or where the transmitted laser beam first interacts with the tree canopy). The last return may interact with the ground underneath the tree, although the ability to map the ground is largely dependent on the density of the vegetated canopy. Intermediate returns, perhaps 2nd, 3rd, and 4th, are expected to be caused by tree branches and understory vegetation between the top of the canopy and the ground. The multiple return lidar systems produce an emitted pulse with a dimension (footprint) generally between 10 and 30 cm in diameter from the ground [Næsset, 2002]. For this reason they are called small footprint systems. Nowadays, there is a trend to design laser scanners with laser beams that have smaller and smaller beam divergence: with these sensors the number of multiple returns per emitted pulse will decrease, due to the fact that a smaller surface patch is illuminated [Wagner et al., 2004]. This aspect entails that the information per beam decreases, and classification of returns is only possible in relation to the neighboring echoes. On the ground, the density of pulses may vary from many to few points per square meter.
In the case of full waveform lidar systems, the laser pulses that are returning to the sensor after being back-scattered by targets are sampled at a very high temporal resolution (Figure 1.2): for
3 example, to achieve 10 cm vertical resolution the returning pulse echo has to be sampled at 1.5 GHz.
Figure 1.2 - An example of a 128 sample 8-bit laser scanner waveform, after Maas [2010]
In full waveform lidar systems the digitizer is able to digitize the complete echo waveform and delivers a full intensity profile of the echo of a laser pulse (Figure 1.3).
Figure 1.3 - The multiple echoes and full waveform: (a) discrete pulses, (b) waveform, and (c) digitized waveform, after Beraldin et al. [2010]
Total amount of data to be recorded with this system drastically increases: assuming 40 m tree height and 10 cm waveform resolution, 400 samples have to be stored for each laser pulse. This requires a large memory capacity. The first commercial full-waveform lidar system was introduced in 2004 [Hug et al., 2004]: to record full waveform lidar data, the main commercial manufacturers
4 have added digitization terminals to their systems and increased the storage media capacity [Pirotti, 2011]. In the first applications, the footprint ranged between 10 and 20 m (so they were called large footprint systems), today most commercial systems are small-footprint, typically 0.3 - 1 m diameter at 1000 m altitude of flight [Bretar et al., 2008].
Rapid technological advances have made airborne laser scanning one of the most used technique for the retrieval of detailed information on forests at different levels, ranging in scale from the individual tree, to the plot, to the stand and, finally, to the nationwide forests (when "wall-to-wall" lidar data are available). ALS data has proven superior to the other main optical data used in forest measurements [Hyyppä and Hyyppä, 1999].
By basic processing, lidar returns from the ground are separated from those from above ground targets (classification process). The airborne lidar back-scattered signals can be used in their native form (raw data) or they can be spatially interpolated to produce digital models. Returns from the ground are used to produce Digital Terrain Models (DTM), while above ground returns are used to produce Digital Surface Models (DSM). In areas covered by trees the algebraic subtraction of DTM from DSM corresponds to the Canopy Height Model (CHM), which provides a measure of the height of the upper canopy. The combination of an accurate DTM derived from lidar points and the vertical distributions of lidar points above the estimated surface make it possible to make inferences about vegetation height and canopy cover [Strunk et al., 2012]. These in turn can be used to predict forest attributes like biomass and volume. It should not, however, be assumed that lidar directly provides information about every individual tree (e.g. a tree list) or that lidar-derived height and cover are the same as field measured height and cover [Strunk et al., 2012].
Despite the fact that ALS data can convey a rich summary of forest features due to its ability to determine the heights of forests, it is worth mentioning that the accuracy of retrievable information is highly dependent on both the extrinsic specifications of the ALS survey as well as the ground plot quality data.
For the former aspect, we must consider that the following may affect lidar data for forest measurements:
mission specification (pulse rate, scanning pattern, flying height, airspeed, pulse diameter, etc.);
time of year (leaf-off, leaf-on, snow free, etc.); lidar sensor and data processing;
experience of lidar vendor.
ALS data most commonly used for forestry applications under alpine, temperate and Mediterranean environments are not produced by dedicated flights. Rather, forester technicians
5 generally exploit the canopy height model available at low cost [Clementel et al., 2012] or even at no cost from ALS surveys carried out for other non-forestry purposes (topographic measurements, DTM production, etc.). These surveys are frequently characterized by a relatively low point density per square meter and, additionally, are usually carried out in winter to minimize the noise by vegetation and to ensure a high number of pulses reaching the ground [Kraus and Pfeifer, 1998]. In summer, penetration rates less than 25-30% are normally obtained under forest stands [Kilian et al., 1996]. In the case of deciduous species (i.e. without green foliage during winter), such as those most frequent in temperate and Mediterranean forest environments, penetration rates can significantly be raised by winter surveys [Ackermann et al., 1994]. Thus, commercial ALS flights for DTM production are almost always made between November and March under temperate and Mediterranean environments and even under alpine environments, at least in those areas not permanently covered by snow during that period. On the contrary, the most favorable season to obtain ALS data specifically suitable for forestry applications under temperate and Mediterranean environments is during summer, since in winter only the woody part of the prevalently deciduous canopies generates lidar-significant returns. For example, Clementel et al. [2012] studied the correlation between metrics extracted from a CHM built with airborne laser scanner data collected in summer 2008 summer season and those extracted from a CHM built with airborne laser scanner data collected in winter 2006 in Trento province. They applied map algebra-focal statistical functions to the CHMs (square matrix of 31 m side) before extracting lidar metrics to reduce the effect of the unsystematic spatial displacement between homologous pixel of summer and winter CHM. The results showed a strong correlation (R = 0.98) between summer mean height and winter mean height, but with a significant underestimation of the mean height by the winter CHM. Therefore foresters and researchers in forestry field should use airborne laser scanner data coming from summer flight. Moreover when airborne laser scanning campaigns are being planned, knowing they will utilize such data, they should be asked to be involved in the definition of the terms of contract.
As regards to the second aspect, Reutebuch et al. [2000] suggests that to maximize quality, ground-plot data should be:
collected in plots the geographic position of which reached an accuracy circa equal to the lidar horizontal accuracy (~ ± 1 m);
collected in plots large enough to minimize plot edge effect, but small enough to characterize tree size differences within plots (~ 400-800 m2 circular plot);
collected in plots matching in time the lidar sampling (generally within 1-2 years of lidar acquisition);
6 matched in what is measured by the lidar and on the plot: all stems that make up a significant portion of the above ground canopy (generally down to a 7-10 cm diameter at breast height lower limit, including all species).
In support of the arguments of Reutebuch et al. [2000], Dalponte et al. [2011] investigated the role of positioning error of ground plots and the optimal number of field measurements needed for area-based prediction of stem volume. For their purposes, Dalponte et al. [2011] used lidar data collected in 2007-2008 winter season over an area of more than 6000 km2 in Trento Province (North East of Italy). An ordinary least squares method was used to estimated the volume of 799 plots using 13 predictor variables extracted from airborne laser scanner data. Their results showed that the error due to the position of the plots surveyed by means of a Global Positioning System (GPS) receiver (positioning error of about 10 m) did not significantly influence the prediction accuracy and that the reduction of the number of training samples does not compromise the performance of the prediction model. A sub-sample of only 53 training plots selected using a new proposed method based on genetic algorithms, instead of 534 as in the original dataset, was enough to obtain equally accurate results.
1.2 Area-based and individual tree detection approaches
There are two main approaches to derive forest information from laser scanner data: the area-based approach (ABA), and the individual tree detection approach (ITDA) [Vastaranta et al., 2011]. In the ABA, plot level data are related to ALS data aggregated at plot level to estimate stand attributes [Næsset, 2002]. ABA relates CHM raster pixels or point ALS data to measured plot characteristics to build parametric (e.g. regression) or non-parametric models to predict the forest attributes of interest. In ABA, volume, biomass, diameter at breast height (dbh), basal area, and other parameters measured at plot level, ranging from one hundred up to one thousand square meters, are related to airborne laser scanner data building parametric models. Models built by regression have been shown to explain the majority of the variation in forest stand height, volume, biomass, and basal area [e.g. Næsset, 1997; Hudak et al., 2006; Hollaus et al., 2006; Garcia et al., 2010].
With the methods used in the ITDA [Hyyppä and Inkinen, 1999], individual trees are segmented from the laser point cloud or from the CHM [Vastaranta et al., 2011], and tree level attributes are either determined straight from the point cloud or estimated based on various other ALS features that are extracted for the tree segments [e.g. Hyyppä and Inkinen, 1999; Persson et al., 2002; Leckie et al., 2003; Popescu et al., 2003; Maltamo et al., 2009; Vauhkonen et al., 2010]. Data
7 about each individual tree can then be aggregated to any scale required to create stand-level or ecosystem-level estimates [Akay et al., 2009].
ABA and ITDA are not mutually exclusive estimates, and several authors demonstrated how they can be combined [e.g. Lindberg et al., 2010; Vastaranta et al., 2012].
For the purposes of this thesis, we used an area-based approach to derive forest information from discrete return lidar data. We chose this approach due to the fact that many studies demonstrated that lidar data may provide spatial detail for planning and the optimization of forest management activities [White et al., 2013; Corona et al., 2012; Woods et al, 2011].
In contrast, an analysis of literature on the performance of single-tree detection algorithms highlighted that there is a non-homogeneous trend in tree detection accuracy. Furthermore, the weaknesses and strengths of ITDA methods depend on the types of forest systems in which they are applied, in that forest structure strongly affects the performance of algorithms [Vauhkonen et al., 2011]. Vauhkonen et al. [2011] tested the accuracy of six algorithms developed in Finland, Germany, Norway and Sweden for tree detection by means of airborne laser scanner data in four sites located in Brazil, Germany, Norway, and Sweden. According to their results, the number of trees estimated by the algorithms in proportion to the number of trees actually measured in the field (i.e. detection rate) varied between test sites and ranged from 45.2% (Norwegian algorithm) to 100.7% (German algorithm). On average, the number of trees found by the algorithms corresponded to only 65% of the number of trees measured in field. A considerable difference in the performance of the algorithms applied in the test site located in Germany has emerged in the detection of coniferous and deciduous plots (best detection rate in the case of conifers), while lidar data point density had no clear effect on tree detection. In 2006, an international comparison of individual tree detection and extraction using ALS was carried out within the “Tree Extraction” project organized by EuroSDR (European Spatial Data Research) and ISPRS (International Society for Photogrammetry and Remote Sensing) to evaluate the quality, accuracy, and feasibility of automatic tree extraction methods based on laser scanner data [Kaartinen et al., 2012]. Twelve partners from United States of America, Canada, Norway, Sweden, Finland, Germany, Austria, Switzerland, Italy, Poland and Taiwan participated in the test. The partners were requested to extract trees using the given ALS datasets. The results showed that the extraction method is the main factor affecting achieved accuracy (the percentage of detected trees varied between 25% to 102%) while the laser point density (2 to 8 points per square meter) is a factor that strongly affects marginal crown delineation accuracy [Kaartinen et al., 2012]. It is evident that the accuracy of detection rate will influence the accuracy on volume or biomass estimation. Another weak point of the ITDA is that it entails the development of a height-based dendrometric approach versus a diameter-based
8 dendrometric approach as implemented by Abramo et al. [2007]. Abramo et al. [2007] used the height of detected trees by an ITDA to compute the stem volume of each tree. Practically speaking, the height of each tree extracted from lidar data was used to calculate its diameter using the third-degree polynomial relationship derived from the height-diameter function of each investigated species. This kind of approach does not consider that, when height-diameter function is "overturned", the curve is increasing and upwardly concave, so it tends to reach an asymptote. Thus, reduced variations in height can lead to large differences in diameter size and consequently in volume [Abramo et al., 2007]. As a consequence, the methodology of overturning the height-diameter curve proposed by the authors does not work and does not allow for extrapolation outside of the field where it was originally applied.
This literature review and our preliminary analyses, led to the choice of an area-based approach as the basis of the research presented in this dissertation. For this reason, the description of the state-of-the-art ALS-assisted assessment of forest standing volume and forest stand structure in Italy refers only to the research carried out under an ABA. Moreover, research that integrated lidar data with satellite data were not considered.
1.3 ALS-assisted assessment of forest standing volume in Italy
Since foresters realized the potential of airborne laser scanner data utilization, most research in Italian forestry field became dedicated to the estimation of forest standing volume. The strategy most frequently utilized consist of developing models which can predict forest volume or biomass using ALS-derived statistics calculated in the lidar heights distribution (termed “lidar metrics”). Such metrics can be computed in a lidar point cloud or in CHM.
Corona et al. [2007; 2008] have examined the correlation between volume measured in circular plots of 314 m2 and the sum of the CHM heights (raised to a power) within plots in a temperate broadleaf forest in the Riserva Naturale Stale Bosco della Fontana. The relationship between volume and height has proved to be heteroscedastic and linear through the origin, with a correlation coefficient equal to 0.78. Starting from this finding, Corona and Fattorini [2008] have subsequently proposed a design-based approach for the ABA ALS-assisted estimation of forest standing volume: adopting the height of the upper canopy at pixel level as auxiliary information, a ratio estimator of the total volume may be derived, together with the unbiased estimator of its sampling variance and the corresponding confidence interval. With reference to the above-mentioned broadleaf forest, these authors have shown that the use of ALS data as auxiliary information can give rise to a confidence interval for the estimation approximately between half and two-thirds smaller than that obtained by the direct sampling of field plots. Barbati et al. [2009] have tested the same estimation
9 approach in a coastal Mediterranean pine forest in Tuscany region, finding a correlation coefficient between the volume measured in circular plots of 1256 m2 and the sum of the CHM heights within the plots equal to 0.88.
A study by Fusco et al. [2008] on mesophilous coppice stands in Lombardy region confirms the relationship between the woody biomass and the sum of CHM heights, with a correlation coefficient equal to 0.87.
Extensive ABA research for assessing forest standing volume under alpine environments in Trento province has been carried out by Floris et al. [2010]: these authors developed regression models between the mean height of summer CHM and standing volume measured in sample plots (20 m of radius) in spruce forests of Paneveggio in Trento province to estimate the volume per surface unit. They found that the mean height of CHM pixels with height greater than 2 m can reliably used as predictor variable to estimate forest volume. Floris et al. [2010] model for the prediction of timber volume was able to explain the 88% of variability when externally validated in 60% of observations that contributed to the model development.
Also, under alpine conditions, Tonolli et al. [2011] have analyzed the relationship between the standing volume measured on plots with sizes ranging from 400 m2 to 3600 m2 and metrics obtained from point ALS data: the most explicative metrics resulted in the mean height of the first return and, with much less importance, the median of the heights of the second return. These authors also found that the relationship is significantly influenced by the plot size, with correlation coefficients increasing from 0.7 to 0.8 in the considered plot size range.
Clementel et al. [2012] developed a regression model for the Foresta di Cadino (Trento province) to estimate the volume per hectare using as predictor variable the mean height extracted from the winter CHM of 365 circular plots with radius of 20 m. The resulting determination coefficient was equal to 0.58, the root mean square error equal to 136.34 m3/ha and the relative standard error equal to 26.87% (model's accuracy at plot level).
The results illustrated above demonstrate that methodologies used according an ABA have reached maturity to be used for mapping forest canopy height, volume and biomass under complex environments throughout large areas.
1.4 ALS-assisted assessment of forest stand structure in Italy
The potential of airborne laser scanner data also refers to applications for the assessment of forest stand structure.
First exploitations regarded the production of thematic maps whose goal was characterizing the forests according to indices extracted from the canopy height model built from laser scanner data.
10 Barilotti et al. [2005] described the canopy cover of coniferous-dominated and mixed forests in Friuli Venezia Giulia region (North-East of Italy) by the Laser Penetration Index (LPI), which is the capability of the laser pulses to reach the ground, and hence it is able to express the vegetation cover. Barilotti et al. [2005] observed that LPI is inversely proportional to tree height and stand density, and inversely proportional to the Leaf Area Index (LAI). The correlation between LAI and LPI was highly significant (R = 0.94), evidencing the potential of airborne laser scanner data to be used as input variables of models used in ecology which needed values of leaf area index.
ALS data have been used for forest canopy gap detection, which is relevant to study ecological stand dynamics, to exclude gaps from forested areas to be sampled for forest inventory purposes, and consequently to increase the sampling efficiency. For this purpose, Barbati et al. [2009] have applied the hot-spot analysis to the CHM based on the calculation of the local statistic variable Gi* of Getis-Ord [Getis and Ord, 1992] in a coastal Mediterranean pine forest of Tuscany region. To identify the forest gaps Bottalico et al. [2009] applied the approach proposed by Koukoulas and Blackburn [2004] to the CHM of the same study area but the results were less successful in the smaller gaps identification compared to those obtained applying the hot spot analysis by Barbati et al [2009].
Also Floris et al. [2009] carried out analysis to evaluate forest gaps in a wider study context aimed at producing thematic maps about forest gaps, canopy cover, and canopy roughness. They applied map algebra focal operators (matrix 15 m x 15 m wide) to the CHM of Foresta di Cadino (Trento province). They first performed a binary map (0,1) attributing 1 if the value of the central pixels of the moving window was higher than 5 m (a so called tree-pixel) and then considering no gap each pixel that was surrounded in the neighboring matrix by at least 20% of tree-pixels. The authors produce a canopy cover map attributing to a pixel of CHM the normalized value obtained from the ratio between the tree-pixel and the total number of pixels explored by the matrix. The canopy roughness map was performed assigning to the central pixel of the window the value of standard deviation of the heights in the matrix. These kinds of maps, if appropriately combined, can indicate stratification for forest inventory purposes.
A few authors used lidar data to classify forest structure. Chirici et al. [2013] used ALS metrics and spectral signatures from Indian Remote Sensing (IRS) imageries, extracted for a set of plots in Sicily region (South Italy), as predictor variables to a posteriori classify forest fuel types observed and identified by photo interpretation and fieldwork. We will not consider research integrating lidar data with satellite data in this review.
Torresan et al. [2014] used lidar-derived CHM metrics to predict forest structure types according to the amount of basal area present in understory, mid-story, and overstory trees. The
11 results presented by the authors were obtained through research activities carried out during this PhD work and will be appropriately described in this dissertation.
1.5 Research problems and aims of the research activities
Researches activities carried out during the PhD were aimed at providing specific solutions to forest management problems and desires encountered by the Forest Service of Trento Province (in Italian language named Provincia Autonoma di Trento, PAT). Incidentally, we want to point out that when province is written in capital (i.e. Province) we are referring to the administrative province, while when written in lower case (i.e. province) we are referring to the territory of province.
Trento Province owns and manages 72% of forests presented in the province [De Natale and Pignatti, 2011]: timber sales represent an item which is linked to the Trento Province balance finances, and, therefore, accurate knowledge about the amount of forest resources is very important to make a financial plan. Information about state and changes of forest stands is fundamental for environmental and wood production assessment at various levels of forest management planning [e.g. Schreuder et al., 1993]. At the level of forest estate, information is usually acquired from field inventories which provide estimates for the overall area, and for the strata by which the area is partitioned.
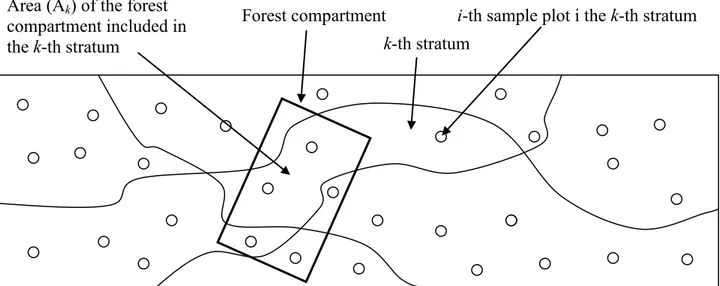
Since 2010, the Forest Service of the Trento Province has changed its inventory system for forest management purposes from full callipering on forest compartment basis to stratified sampling. The Forest Service achieves the sampling process through two phases: the stratification and the out-and-out sampling. In the stratification process the forest is subjectively subdivided into homogeneous sub-populations (the strata). Sampling is done in a number of plots and their location in each stratum is defined. Successively, field inventories allow data collection to update figures at strata and forest estate levels for the estimation of key attributes (standing wood volume, in particular timber volume). But forest compartment is the basic unit for forest management activities (tending of stand, felling, etc.), so the growing stock estimation is needed at forest compartment level. Forest compartments are forest management units, extended 20 ha on average, delineated for operative and harvesting purposes, whose boundaries, as far as possible, are easily detectable in the field (forest roads, streams, power lines, etc.). Considering that the intersection between strata and forest compartments produces the so called portions, at the moment, the volume of a forest compartment is computed as a weighted sum on the portion surfaces of the average volume of each stratum intersecting the forest compartment. This kind of procedure may produce inaccurate estimates due to the small number (or even the absence) of plots within a portion. The scarcity of
12 sampling information within small portions of the survey area is a well-known problem of sample surveys. It is referred to as the small area estimation problem [e.g. Rao, 2005]. Usually the lack of sampling information is recovered by the use of auxiliary information available from other sources [Pfefferman, 2002], in particular from remote sensing. Considering that Forest Service of Trento Province has at its disposal a Canopy Height Model, and considering that CHM represents an effective information source to support forest volume estimation (refer to § 1.3), an objective of the dissertation was to estimate the volume at forest compartment level using the height from CHM as auxiliary information adopting a model supposing a proportional relationship between height and volume at pixel level for driving estimation. In particular we wanted consider the estimation from three points of view: the model-based perspective, the design-based perspective, and the hybrid-perspective and evaluate which is the inference approach that produces the more accurate estimation level. All these aspects are tackled and discussed in Chapter 3.
Another specific need of the Forest Service is the prediction of the structure of forests owned by the Province for mapping on a large scale. The Forest Service of Trento Province presently uses a structural classification system, both in inventory and forest management decision making phases, based on the distribution of basal area in three diameter size-classes. The classification in forest structural types (12 in total) is one of the primary references for forest managers to identify the strata in the stratification process. During the decision making process, forest managers use the forest structural classification system to identify the potential transition of a specific structural type toward another one, and consequently to decide which kind of silvicultural intervention has to be implemented by estimating the potential volume to fell in each tree diameter size-class [Ancel et al., 1999; Scrinzi et al., 2011].
Lidar, as an active remote sensing technology has been used in many studies outside Italy to describe and estimate forest structure in three-dimensions using the raw point cloud to compute a wide range of lidar metrics to predict and map many aspects of forest composition and structure, including basal area [Næsset, 1997; Means et al., 1999; Dubayak et al., 2000; Means et al., 2000; Næsset, 2002; Andersen et al., 2003; Zimble et al., 2003; Riaño et al., 2004; Maltamo et al., 2005; Heurich and Thoma, 2008; Ferraz et al., 2012]. There has been only limited empirical exploration of the potential use of only digital elevation models (DTM and DSM) in forest characterization and classification [Suárez et al., 2012] because it has been typically believed that these two elevation models have limited applications for forestry purposes that require characterization of forest structure. But there are times that the original raw lidar point cloud may be not available. In fact, despite declining costs and increasing coverage, lidar data are still not widely available in all locations for forestry applications, so the ability to use lidar-derived DTMs and DSMs has the
13 potential to improve forest classification and mapping in areas where raw lidar data are otherwise not available.
This dissertation tries to assess whether lidar-derived predictor variables extracted from CHMs can support the classification of the forests in the province of Trento, a domain that is still relatively unexplored and deserving of further attention. Within this general purpose, the specific goal was to compare the performance of supervised classification techniques toward specific methods of basal area prediction in the process of structural classification of the mountain forests. All these aspects are engaged and discussed in the Chapter 4.
Considering that the number of forest types in the forest classification system used by the Forest Service of Trento Province is rather high, we wanted to classify the forests of Trento province on the basis of basal area distribution of understory, mid-story, and overstory trees through an unsupervised procedure. Afterwards we wanted to evaluate if lidar-derived predictor variables extracted from raw data were able to distinguish between the discriminated types by means of learning machine techniques. In particular we wanted to evaluate the performance of classification trees in distinguishing forest stands. The Chapter 4 is dedicated to the description of the processes carried out to achieve these purposes.
To sum up, this thesis attempts to develop statistical analysis and techniques for:
forest volume estimation at forest compartment level using metrics extracted from the CHM as auxiliary information for the local calibration of forest inventory;
classification of structure of forest stands using the CHM and lidar raw data to support forest inventory process (e.g. stratification) and forest management strategies (e.g. definition of silvicultural interventions, identification of habitat requiring protection, identification of habitat with high level of heterogeneity).
1.6 Structure of the thesis
The thesis is organized into six chapters.
The present chapter, after briefly describing the airborne laser scanning technology, highlighted the stat-of-art of ALS-assisted assessment of forest standing volume and stand structure in Italy, pointed out the background and the motivations for this thesis, as well as the objectives.
In the Chapter 2 we provide the results of a study about the comparison of forest volume estimation by the model based on CHM-derived metrics developed by Floris et al. [2010] and by double-entry stem volume equations (based on full callipering and height-diameter functions) at forest compartment level.
14 Chapters 3 is focused on the strategies for the volume estimation at forest compartment level based on a ratio model presuming a proportional relationship between height from CHM and volume at pixel level. The volume estimator and the variance estimators are considered from the model-based, design-based and hybrid inferences.
Chapter 4 is dedicated to the comparison among statistical techniques for the classification of forest stand structure using CHM-derived metrics. In detail we examined the use of lidar-derived CHM metrics to predict forest structure classes according to the amount of basal area present in understory, mid-story, and overstory trees. We evaluated two approaches to predict diameter size-based forest classifications: in the first, we attempted supervised classification with both linear discriminant analysis (LDA) and random forest (RF); in the second, we predicted basal areas of lower, mid, and upper canopy trees from CHM-derived variables by k-nearest neighbor imputation (k-NN) and parametric regression, and then classified observations based on their predicted basal areas.
In Chapter 5 the evaluation of the performance of classification trees for discriminating forest stand structure using lidar point cloud-derived metrics is described.
In the last chapter of the dissertation conclusions on the proposed statistical analysis and techniques for volume estimation and stand structural classification are given. Furthermore, limitations, and future developments of the dissertation are discussed.
1.7 References
Abramo E., Barilotti A., Sepic F., 2007. Dalla dendrometria diametrica alla dendrometria
ipsometrica: stima del volume degli alberi da rilievi laser-scanning. Foresta@ 4(4): 373-385. doi:
10.3832/efor0481-0040373.
Ackermann F., Englich M., Kilian J., 1994. Die Laser-Profil-Befliegung Gammertingen. ZfV 119(5), pp. 264-277.
Akay, A., Oðuz, H., Karas, I., Aruga, K., 2009. Using lidar technology in forestry activities. Environmental Monitoring and Assessment, 151: 117-124. doi: 10.1007/s10661-008-0254-1.
Ancel, P., Wilhelm, M.E., Lacombe, E., 1999. Peuplements forestiers du massif Vosgien;
typologie et sylvicultures. CNPF. pp. 51.
Andersen, H.E., Foster, J.R., Reutebuch, E., 2003. Estimating forest structure parameters on
Fort Lewis Military Reservation using Airborne Laser Scanner (LIDAR) data. Proceedings of the
Second International Precision Forestry Symposium, Seattle, Washington, June 15-17, 2003, pp. 45-53.
Barbati, A., Chirici, G., Corona, P., Montaghi, A., Travaglini, D., 2009. Area-based assessment
of forest standing volume by field measurements and airborne laser scanner data. International
Journal of Remote Sensing. Vol. 30, No. 19, 10 October 2009, pp. 5177–5194. doi: 10.1080/01431160903023017.
Barilotti, A., Turco, S., Napolitano, R., Bressanc, E., 2005. La tecnologia lidar per lo studio
della biomassa negli ecosistemi forestali. Proceedings of 15th Meeting of the Italian Society of
15 Beraldin, J.-A., Blais, F., Lohr, U., 2010. Laser Scanning Technology. In: Vosselman, G., Maas, H.-G. Editors. Airborne and terrestrial laser scanning. Whittles publishing, CRC Press, Taylor & Francis Group, 2010. ISBN 978-1904445-87-6.
Bottalico, F., Montaghi, A., Travaglini, D., 2009. Identificazione dei gaps nella copertura
forestale con dati lidar. Atti 13a Conferenza Nazionale ASITA, Bari, 1-4 Dicembre 2009.
Bretar, F., Chauve, A., Mallet, C., Jutzi, B, 2008. Managing full waveform lidar data: a
challenging task for the forthcoming years. The International Archives of the Photogrammetry,
Remote Sensing and Spatial Information Sciences. Vol. XXXVII. Part B1. Beijing 2008, pp. 415-420.
Chirici, G., Scotti, R., Montaghi, A., Barbati, A., Cartisano, R., Lopez, G., Marchetti, M., McRoberts, R.E., Olsonn, H., Corona, P., 2013. Stochastic gradient boosting classification trees for
forest fuel types mapping through airborne laser scanning and IRS LISS-III imagery. International
Journal of Applied Earth Observation and Geoinformation, 25: 87-97. doi: 10.1016/j.jag.2013.04.006.
Clementel, F., Colle, G., Farruggia, C., Floris, A., Scrinzi, G., Torresan, C., 2012. Estimating
forest timber volume by means of “low-cost” lidar data. Italian Journal of Remote Sensing, 44(1):
125-140. doi:10.5721/ItJRS201244110.
Corona, P., Fattorini, L., 2008. Area-based lidar-assisted estimation of forest standing volume. Canadian Journal of Forest Research, 38(11): 2911-2916. doi: 10.1139/X08-122.
Corona, P., Lamonaca, A., Chirici, G., Travaglini, D., Marchetti, M., Minari, E., Montaghi, A., 2008. Estimation of growing stock of broadleaved forests by airborne laser scanning. pp 39-44. In: Gianelle, D., Travaglini, D., Mason, F., Minari, E., Chirici, G., Chemini, C. (eds.). Canopy analysis and dynamics of a floodplain forest. Rapporti Scientifici, 3. Centro Nazionale per lo studio e la conservazione della Biodiversità Forestale – Bosco della Fontana. Cierre Grafica Editore, Verona, pp. 96.
Corona, P., Cartisano, R., Salvati, R., Chirici, G., Floris, A., Di Martino, P., Marchetti, M., Scrinzi, G., Clementel, F., Travaglini, D., Torresan., C., 2012. Airborne Laser Scanning to support
forest resource management under alpine, temperate and Mediterranean environments in Italy.
European Journal of Remote Sensing, 45: 27-37, doi: 10.5721/EuJRS20124503.
Corona, P., Lamonaca, A., Chirici, G., Travaglini, D., Marchetti, M., Minari, E., Montaghi, A., 2007. Sviluppo di una procedura innovativa per la cubatura del volume della massa legnosa di
fustaie di latifoglie mediante lidar. In: Atti della 11a Conferenza Nazionale ASITA, Torino, 6–9
Novembre, Vol. 1, pp. 767–772.
Dalponte, M., Martinez, C., Rodeghiero, M., Gianelle, D., 2011. The role of ground reference
data collection in the prediction of stem volume with lidar data in mountain areas. ISPRS Journal
of Photogrammetry and Remote Sensing, 66: 787–797.
De Natale, F., Pignatti, G., 2011. Estensione e composizione dei boschi italiani. In: Gasparini, P., Tabacchi, G. (a cura di) 2011 - L’Inventario Nazionale delle Foreste e dei serbatoi forestali di Carbonio INFC 2005. Secondo inventario forestale nazionale italiano. Metodi e risultati. Ministero delle Politiche Agricole, Alimentari e Forestali, Corpo Forestale dello Stato; Consiglio per la Ricerca e Sperimentazione in Agricoltura, Unità di Ricerca per la Pianificazione ed il Monitoraggio e la Pianificazione Forestale. Edagricole, Milano, pp. 99-111.
Dubayah, R.O, Knox, R.G, Hofton, M.A., Blair, J.B., Drake, J.B., 2000. Land surface
characterization using lidar remote sensing. In, Spatial information for land use management, Hill,
M., Aspinall, R.(Eds.), International Publishers Direct, Singapore (2000).
Ferraz, A., Bretar, F., Jacquemound, S., Gonçalves, G., Pereira, L., Tomé, M., Soares, P., 2012.
3-D mapping of multy-layered Mediterranea forest using ALS data. Remote Sensing of
Environment, 121: 210-223. doi: 10.1016/j.rse.2012.01.020.
Floris, A., Clementel, F., Farruggia, C., Scrinzi, G., 2009. Il lidar nella stratificazione tematica
dei soprassuoli forestali: applicazioni in Trentino. Atti 13a Conferenza Nazionale ASITA, Bari, 1-4
16 Floris, A., Clementel, F., Farruggia, C., Scrinzi, G., 2010. Stima su base lidar delle provvigioni
legnose forestali: uno studio per la Foresta di Paneveggio. Rivista Italiana di Telerilevamento,
42(3): 15-32.
Fusco, S., Pflugmacher, D., Kirschbaum, A., Cohen, W., Chiatante, D., Montagnoli, A., 2008.
Uso di dati lidar per stima della biomassa forestale in un bosco misto di latifoglie: un caso studio in Valsassina (LC). Atti 12a Conferenza Nazionale ASITA, L’Aquila, 21-21 Ottobre 2008.
García, M., Riaño, D., Chuvieco, E., Danson, F.M., 2010. Estimating biomass carbon stocks
for a Mediterranean forest in central Spain using lidar height and intensity data. Remote Sensing
of Environment, 114: 816-830. doi: 10.1016/j.rse.2009.11.021.
Getis, A., Ord, K., 1992. The analysis of spatial association by use of distance statistics. Geographical Analysis, 24(3): 189–206. doi: 10.1111/j.1538-4632.1992.tb00261.x.
Heurich, M., Thoma, F., 2008. Estimation of forestry stand parameters using laser scanning
data in temperate, structurally rich natural European beech (Fagus sylvatica) and Norway spruce (Picea abies) forests. Forestry, 81(5): 645-661. doi: 10.1093/forestry/cpn038.
Hollaus, M., Wagner, W., Eberhöfer, C., Karel, W., 2006. Accuracy of large-scale canopy
heights derived from lidar data under operational constraints in a complex alpine environment.
ISPRS Journal of Photogrammetry and Remote Sensing, 60(5): 323-338. doi: 10.1016/j.isprsjprs.2006.05.002.
Hudak, A.T., Crookston, N.L., Evans, J.S., Falkowski, M.J., Smith, A.M.S., Gessler, P.E., Morgan, P., 2006. Regression modeling and mapping of coniferous forest basal area and tree
density from discrete-return lidar and multispectral satellite data. Canadian Journal of Remote
Sensing, 32: 126-138. doi: 10.5589/m06-007.
Hug, C., Ullrich, A., Grimm, A., 2004. A Waveform-Digitizing LIDAR Terrain and Vegetation
Mapping System. In: International Archives of Photogrammetry, Remote Sensing and Spatial
Information Sciences. Vol. 36 (Part 8/W2). Freiburg, Germany, pp. 24-29.
Hyyppä, H., Hyyppä, J., 1999. Comparing the Accuracy of Laser Scanner with Other Optical
Remote sensing data sources for stand attribute retrieval. The photogrammetric journal of Finland,
01/1999, 16: 5-15.
Hyyppä, J., Inkinen, M., 1999. Detecting and estimating attributes for single trees using laser
scanner. Laser Radar Technology and Applications, IV, 3707:57-69.
Kaartinen, H., Hyyppä, J., Yu, X., Vastaranta, M., Hyyppä, H., Kukko, A., Holopaine, M., Heipke, C., Hirschmugl, M., Morsdorf, F., Næsset, E., Pitkänen, J., Popescu, S., Solberg, S., Bernd, M.W., Wu, J.C., 2012. An International Comparison of Individual Tree Detection and Extraction
Using Airborne Laser Scanning. Remote Sens. 2012, 4(4): 950-974. doi:10.3390/rs4040950.
Kilian, J., Haala, N., Englich, M., 1996. Capture and evaluation of airborne laser scanner
data. International Archive of Photogrammetry and Remote Sensing. Volume 31, Part B3, pp.
383-388.
Koukoulas, S., Blackburn, G.A., 2004. Quantifying the spatial properties of forest canopy gaps
using lidar imagery and GIS. International Journal of Remote Sensing, 25(15): 3049-3071. doi:
http://dx.doi.org/10.1080/01431160310001657786.
Kraus, K., Pfeifer, N., 1998. Determination of terrain models in wooded areas with airborne
laser scanner data. ISPRS Journal of Photogrammetry and Remote Sensing, Volume 53, Issue 4,
August 1998, pp. 193-203. doi: 10.1016/S0924-2716(98)00009-4.
Leckie, D., Gougeon, F., Hill, D., Quinn, R., Armstrong, L., Shreenan, R., 2003. Combined
high-density lidar and multispectral imagery for individual tree crown analysis. Canadian Journal
of Remote Sensing, 29(5): 1–17.
Lindberg, E., Holmgren, J., Olofsson, K., Wallerman, J., Olsson, H., 2010. Estimation of tree
lists from airborne laser scanning by combining single-tree and area-based methods. International
17 Maas, H.-G., 2010. Forestry Applications. In: Vosselman, G., Maas, H.-G. Editors. Airborne and terrestrial laser scanning. Whittles publishing, CRC Press, Taylor & Francis Group, 2010. ISBN 978-1904445-87-6.
Maltamo, M., Packalén, P., Yu, X., Eerikäinen, K., Hyyppä, J., Pitkänen, J., 2005. Identifying
and quantifying structural characteristics of heterogeneous boreal forests using laser scanner data.
Forest Ecology and Management, 216: 41-50. doi: 10.1016/j.foreco.2005.05.034.
Maltamo, M., Peuhkurinen, J., Malinen, J., Vauhkonen, J., Packalén, P., Tokola, T., 2009.
Predicting tree attributes and quality characteristics of Scots Pine using airborne laser scanning data. Silva Fennica 43(3): 507-521.
Means, J.E., Acker, S.A., Fitt, B.J., Renslow, M., Emerson, L., Hendrix, C.J., 2000. Predicting
forest stand characteristics with airborne scanning lidar. Photogrammetric Engineering & Remote
Sensing, 66(11): 1367-1371.
Means J.E., Acker S.A., Harding D.J, Blair J.B., Lefsky M.A., Cohen W.B., Harmon M.E., McKee W.A., 1999. Use of large-footprint scanning airborne lidar to estimate forest stand
characteristics in the Western Cascades of Oregon. Remote Sensing of Environment, 67: 298-308.
doi: 10.1016/S0034-4257(98)00091-1.
Næsset E., 1997. Estimating timber volume of forest stands using airborne laser scanner data. Remote Sensing of Environment, 61: 246-253. doi: 10.1016/S0034-4257(97)00041-2.
Næsset, E., 2002. Predicting forest stand characteristics with airborne scanning laser using a
practical two-stage procedure and field data. Remote Sensing of Environment, 80: 88-99. doi:
10.1016/S0034-4257(01)00290-5.
Persson, Å., Holmgren, J., Söderman, U., 2002. Detecting and measuring individual trees
using an airborne laser scanner. Photogrammetric Engineering & Remote Sensing, 68: 925-932.
Pfefferman, D., 2002. Small area estimation – New developments and directions. Int. Stat. Rev, 70(1): 125-143. doi:10.1111/j.1751-5823.2002.tb00352.x.
Pirotti, F., 2011. Analysis of full-waveform lidar data for forestry applications: a review of
investigations and methods. iForest 4: 100-106 [online 2011-06-01] URL:
http://www.sisef.it/iforest/show.php?id=562.
Popescu, S.C., Wynne, R.H., Nelson, R.F., 2003. Measuring individual tree crown diameter
with lidar and assessing its influence on estimating forest volume and biomass. Canadian Journal of
Remote Sensing, 29: 564-577.
Rao, J.N.K., 2005. Small Area Estimation. Wiley. New York. pp. 344.
Reutebuch, S.E., Andersen, H.E., McGaughey, R.J., 2005. Light Detection and Ranging
(LIDAR): An Emerging Tool for Multiple Resource Inventory. Journal of Forestry, 103(6): 286-292.
Riaño D., Valladares F., Condésand S., Chuvieco E., 2004. Estimation of leaf area index and
covered ground from airborne laser scanner (Lidar) in two contrasting forests. Agricultural and
Forest Meteorology, 124: 269-275. doi: 10.1016/j.agrformet.2004.02.005.
Schreuder, H., Gregoire, T., Wood, G., 1993. Sampling methods for multiresources forest
inventory. Wiley, New York. pp. 464.
Scrinzi, G., Clementel, F., Colle, G., Farruggia, C., Floris, A., Torresan, C., 2011. L’inventario
dendromemtrico nella nuova pianificazione forestale aziendale trentina (NPFAT). Provincia
Autonoma di Trento - Servizio Foreste e Fauna, Consiglio per la Ricerca e la Sperimentazione in Agricoltura, pp. 105. ISBN 978-88-7702-322-3.
Strunk, J.L., 2012. Estimation and Modeling of Selected Forest Metrics with Lidar and
Landsat. Thesis for the degree of Doctor of Philosophy in Forest Resources presented on June 14,
2012, pp. 145.
Suárez, J., Fonweban, J., Gardiner, B., 2012. Supporting precision forestry in Great Britain. Earthzine (http://www.earthzine.org/2012/06/22/supporting-precision-forestry-in-great- britain/).
Tonolli, S., Dalponte, M., Vescovo, L., Rodeghiero, M., Bruzzone, L., Gianelle, D., 2011.
Mapping and modeling forest tree volume using forest inventory and airborne laser scanning.
18 Torresan, C., Strunk, J., Zald, H.S.J., Zhiqiang, Y., Cohen, W.B., 2014. Comparing statistical
techniques to classify the structure of mountain forest stands using CHM-derived metrics in Trento province (Italy). European Journal of Remote Sensing - 2014, 47: 75-94. doi:
10.5721/EuJRS20144706.
Vastaranta, M., Kankare, V., Holopainen, M., Yu, X., Hyyppä, J., Hyyppä, H., 2012.
Combination of individual tree detection and area-based approach in imputation of forest variables using airborne laser data. ISPRS Journal of Photogrammetry and Remote Sensing, 67: 73-79. doi:
10.1016/j.isprsjprs.2011.10.006.
Vastaranta, M., Holopainen, M., Yu, X., Haapanen, R., Melkas, T., Hyyppä, J., Hyyppä, H., 2011. Individual tree detection and area-based approach in retrieval of forest inventory
characteristics from low-pulse airborne laser scanning data. The Photogrammetric Journal of
Finland, Vol. 22, No. 2, 2011.
Vauhkonen, J., Ene, L., Gupta, S., Heinzel, J., Holgren, J., Pitkänen, J., Solberg, S., Wang, Y., Weinacker, H., Hauglin, K.M., Lien, V., Packalén, P., Gobakken, T., Koch, B., Næsset E., Yokola, T., Maltamo, M., 2012. Comparative testing of single-tree detection algorithms under different
types of forest. Forestry, Vol. 85, No. 1, 2012. doi:10.1093/forestry/cpr051.
Wagner, W., Ullrich, A., Melzer, T., Briese, C., Kraus, K., 2004. From Single-Pulse to
Full-Waveform Airborne Laser Scanners: Potential and Practical Challenges. Talk: International
Society for Photogrammetry and Remote Sensing XXth Congress, Istanbul; 12 - 2004-07-23; in: "Proceedings", O. Altan (ed.); Vol XXXV, Part B/3 (2004), ISSN: 1682-1750; 201 - 206.IAPRS, 35, PartB, pp. 201 ff.
White, J.C., Wulder, M.A., Varhola, A., Vastaranta, M., Coops, N.C., Cook, B.C., Pitt, D., Woods, M., 2013. A best practices guide for generating forest inventory attributes froma airborne
laser scanning data using an area-based approach (Version 2.0). Canadian Forest Service, Canadia
Wood Fibre Centre, Information Report FI-X-010.
Woods, M., Pitt, D., Penner, M., Lim, K., Nesbitt, D., Etheridge, D., Treitz, P., 2011.
Operational implementation of a lidar inventory in boreal Ontario. The Forestry Chronicle 87(4):
512-528.
Yu, X., Hyyppä, J., Holopainen, M., Vastaranta, M, 2010. Comparison of area-based and
individual tree-based methods for predicting plot-level forest attributes. Remote Sens. 2(6):
1481-1495. doi: 10.3390/rs2061481.
Zimble, D.A., Evans, D.L., Carlson, G.C., Parker, R.C., Grado, S.C., Gerard, P.D., 2003.
Characterizing vertical forest structure using small-footprint airborne lidar. Remote Sensing of
19
2 Full validation of a linear model based on CHM-derived metrics for timber
volume estimation
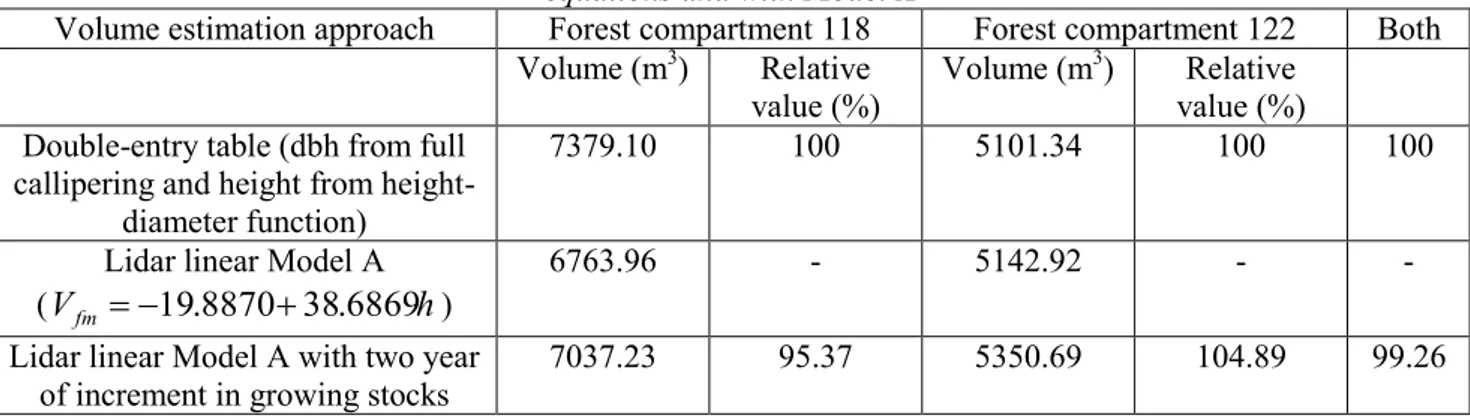
For timber volume estimation, models developed using airborne laser scanner data are already a concrete alternative to the traditional estimation systems. This chapter illustrates a comparison between values of timber volume of two forest compartments in the Paneveggio forest estimated through double-entry stem volume equations and through a linear regression model based on a CHM-derived metric, developed by Floris et al. [2010].
2.1 Introduction
Since 2007, the Forest Geomatics research laboratory of Forest Monitoring and Management Research Unit (MPF) of Agricultural Research Council (CRA) focuses its research on the use of airborne laser scanner data for forestry application on mountainous forests of Alps (North Italy).
Most of studies of Geomatics lab of MPF Unit supported the process established by the Forest Service of Provincia Autonoma di Trento aimed at developing new and innovative forest inventory procedures based on the use of remote sensing data, in particular airborne laser scanner data.
The first studies were oriented to develop ALS data processing techniques to compute indices from the canopy height model useful for the thematic classification of forest stands [Floris et al., 2009] and addressed to support forest technicians in the stratification process for forest inventory purposes.
At a later stage, research was concentrated in the assessment of volume of forests owned by public institutions of Trento province (i.e. municipalities, forest agencies, Trento Province) and managed for commercial purposes. Volume estimation models were carried out by regressing dendrometric response variables, i.e. volume referred to different tree diameter size, against metrics extracted from the CHM processed from airborne laser scanner data collected trough campaigns on Trento province territory [Floris et al., 2010; Clementel et al., 2010; Clementel et al., 2012].
In most cases, Geomatics lab of MPF Unit used lidar data collected for other non-forestry purposes, used area-based methodological approaches, and developed regression models for an easy operational use, with a low number of explicative variables.
The study here described aimed at full validating the statistical linear model for timber volume estimation developed by Floris et al. [2010], herein called "Model A". In particular, timber volume values estimated with Model A were compared with those computed by the application of full callipering and double-entry stem volume equations (ground truth) in two forest compartments located in Paneveggio forest (Trento province).
![Figure 1.2 - An example of a 128 sample 8-bit laser scanner waveform, after Maas [2010]](https://thumb-eu.123doks.com/thumbv2/123dokorg/2777808.1427/10.892.299.639.168.488/figure-example-sample-bit-laser-scanner-waveform-maas.webp)
![Table 2.3 - Main statistical parameters of the height-diameter model according to the Curtis [1967] equation for forest compartment 118 and 122](https://thumb-eu.123doks.com/thumbv2/123dokorg/2777808.1427/33.892.82.811.482.1132/table-statistical-parameters-diameter-according-curtis-equation-compartment.webp)