Predictors of responses to immune checkpoint
blockade in advanced melanoma
N. Jacquelot et al.
#Immune checkpoint blockers (ICB) have become pivotal therapies in the clinical armamentarium against metastatic melanoma (MMel). Given the frequency of immune related adverse events and increasing use of ICB, predictors of response to CTLA-4 and/or PD-1 blockade represent unmet clinical needs. Using a systems biology-based approach to an assessment of 779 paired blood and tumor markers in 37 stage III MMel patients, we analyzed association between blood immune parameters and the functional immune reactivity of tumor-infiltrating cells after ex vivo exposure to ICB. Based on this assay, we retrospectively observed, in eight cohorts enrolling 190 MMel patients treated with ipilimumab, that PD-L1 expression on peripheral T cells was prognostic on overall and progression-free survival. Moreover, detectable CD137 on circulating CD8+ T cells was associated with the disease-free status of resected stage III MMel patients after adjuvant ipilimumab + nivolumab (but not nivolumab alone). These biomarkers should be validated in prospective trials in MMel.
Correspondence and requests for materials should be addressed to L.Z. (email:[email protected]) #A full list of authors and their affliations appears at the end of the paper
T
he recent development of immune checkpoint blockers (ICBs) has rekindled interest in thefield of immune cancer therapies1,2. Cancer vaccines3, adoptive T cell transfer and CAR T cells4, 5, bispecific antibodies6, ICBs7, 8 and oncolytic viruses9have come of age and many immune agents have recently entered the oncological armamentarium. However, to date, immunotherapy has only been shown to provide durable clinical benefit in a fraction of patients. The recent characterization of multiple immune resistance mechanisms by which tumors can evade the immune system has fueled the development of novel agents that circumvent such limitations, targeting new“immune checkpoints”. It is likely that the use of combination strategies will increase the number of cancer patients that might benefit from immunotherapy10. Nonetheless, a number of critical problems remain to be solved. First, the scientific rationale supporting the use of combinatorial regimens needs to be defined. Second, it must be determined whether the future success of immuno-oncology (I-O) will rely on patient stratification in large cohorts or will be personalized to each patient. Depending on tumor characteristics (e.g., PD-L1 or PD-1 expression on tumor cells for anti-PD-1 mAb11–13, HMGB1 and LC3B for immunogenic chemotherapy14, or tumor microenvironment hallmarks such as IDO expression15, macrophage density16, tumor-infiltrating lymphocytes [TIL], or Th1 fingerprints17), onemight envisage more specific and individualized I-O clinical management strategies. Third, predictive immune profiles or biomarkers will need to be validated prospectively to guide I-O utilization in a personalized or stratified manner.
We attempted to address some of these questions in patients with stage III melanoma18, given that (i) optimizing adjuvant I-O therapies for metastatic melanoma (MMel) remains an unmet clinical need, (ii) MMel represents a clinical niche for the development of many mAbs and ICBs, (iii) in these patients, metastatic lymph nodes (mLN) are surgically resected, enabling immunological investigations, and (iv) immune
prognostic parameters have been recently described in stage III/IV MMel19,20. The tumor microenvironment has a high level of complexity in its regulation. Each checkpoint/co-stimulatory pathway displays an independent mechanism of action. This will require a comprehensive analysis of their mode of action in the tumor microenvironment in any given patient to design appropriate combinatorial approaches and to discover specific biomarkers of response. Herein, we use a systems biology-based approach aimed at defining relevant immunometrics for prediction of an in situ response to cytokines and monoclonal antibodies (mAb) (i.e., agonists and blockers of immune checkpoints) in patients with resected stage III melanoma. In this study, wefirst describe a suitable “ex vivo metastatic lymph node (mLN) assay”, and through this assay, we demonstrate novel markers for the efficacy of ICB. We then observed, through multivariate analyses performed on eight pooled cohorts including 190 samples of unresectable stage III and IV melanoma, that PD-L1 expression on peripheral blood CD4+ and CD8+ T cells is prognostic on overall survival (OS) and on progression-free survival (PFS), while in resected stage III melanoma, detectable CD137+CD8+peripheral blood T cells predicted a lack of relapse with ipilimumab + nivolumab combination therapy. We conclude that i) the“ex vivo metastatic lymph node (mLN) assay” represents a suitable method to identify biomarkers for ICB and ii) PD-L1 expression on blood CD8+ T cells can be a useful marker of resistance to CTLA-4 blockade that needs to be prospectively validated.
Results
Functional immunological assays on ex vivo dissociated mLN. The study population of the ex vivo metastatic lymph node (mLN) assay consisted of stage III MMel patients undergoing surgery for lymph node metastases, as previously described19. Of these patients, one third presented with more than three involved LN at surgery, 55% had a mutated BRAF oncogene, >30% had
0 20 40 60 80 100 0 10 % of responders 20 30 40 αPD-1 αCTLA-4 rIFNα2a rIL-2 αTim-3 αCD137/CD137L αPD-1+αCTLA-4 0 10 20 30 40 50 Proliferation Intracellular cytokines
Chemokines/cytokines release Treg
IFNγ +/NK IFNγ +/CD8 IFNγ +/CD4 TNF α+/NK IFN γ+/TNF α+/NK IFNγ +/TNF α+/CD4 Ki67 +/NK Ki67 +/CD8 Ki67 +/CD4
CXCL10 CXCL9 CCL5 CCL4 CCL3 CCL2 IL-1β IL-6 TNFα Tregs decrease
% of responders 0 20 40 60 80 100 % of responders % of responders
Fig. 1 Typification of responses for each axis of stimulation. Summary of Supplementary Figs.3−5showing mLN responding to each axis (CTLA-4, PD-1, Tim-3, or combinations, together or with cytokines) by specific immunometrics shared by at least 20% of patients. M&M detail the experimental settings. Briefly, functional assays used flow cytometry determination of early (18–24 h post-stimulation) intracellular cytokine release in T and NK cells, late (day 4–5 post-stimulation) proliferation assays, chemokine and cytokine secretions in the supernatants at 18–24 h. A biological response to a given axis was scored“positive” when two independent readouts, reaching a >1.5-fold increase or decrease over two background levels (that of the medium and the isotype control Ab) were achieved
thyroid dysfunction, and >50% were scheduled to undergo adjuvant therapy. Of primary lesions, 52% were ulcerated. After mechanical and enzymatic digestion of mLN19, CD45– cells represented 4–98 ± 4.8% of all cells. The composition of tumor-infiltrating immune cells was analyzed by flow cytometry with gating on live cells in 39 tumor specimens that were paired with autologous peripheral blood cells. Analyses were based on a comprehensive immunophenotyping of 252 parameters (124 in blood and 128 in tumor) per patient, featuring cell type, activation status, naive or memory phenotype, and activating or inhibitory receptors or ligands. We previously found that peripheral blood cell markers were as relevant as TIL immunotypes for OS and PFS of stage III/IV MMel and para-meters associated with lymphocyte exhaustion/suppression were associated with greater clinical significance compared to those related to activation or lineage19. The next step consisted of analyzing the dynamics of these parameters after incubation with mAbs± cytokines in 37 patients. Comprehensive assessment of the reactivity of various subsets of infiltrating tumor cells targeting four functional axes, cytokines and their combinations is described (Supplementary Fig.1and Supplementary Table1). A biological response to a given axis was scored “positive”
when two independent readouts, reaching a >1.5-fold increase or decrease over two background levels (that of the medium and the isotype control Ab) were achieved. We prioritized fold changes over p-values, to reduce false positive candidates (with minimal fold changes, yet very low p-values due to small variances). Admittedly, this is an arbitrary choice to select robust effects in the test cohorts but undertook in vivo validation henceforth.
The “inter-rater agreement” was next evaluated. The inter-individual variability for specimen manipulation, ELISA and flow cytometry analyses was minimal, as demonstrated by two specimens handled by the two first authors independently (Supplementary Fig. 2). Overall, the correlation between the original readings (from ELISA or FACS experiments) was found to be highly satisfactory (Spearman correlation= 0.947/0.857 for patient Pt12/Pt24, number of measurements= 259). When compensating/normalizing to the IgG or control medium, and thus making the data comparable and directly exploitable for the immunometrics scoring, the intraclass correlation remained highly significant (ICC = 0.84 (Pt12) and 0.87 (Pt24)) across all axes considered in the study. Charts depicting the overall relative levels of reactivity in “ex vivo responders” vs.
#Also positive for αTIM-3 *Also positive for αCTLA-4+IFNα2a *Also positive for IFNα2a
Patients in green are positive for IL-2
PD1 axis CD137/CD137L axis Pt20 Pt35 Pt33 Pt08* Pt07 Pt02# Pt30 Pt16# Pt04 Pt32 Pt27 Pt10 Pt05 Pt20 Pt28 Pt31 Pt11 Pt23* Pt21 Pt25 Pt22# Pt01 Pt17 Pt15 Pt19 Pt36 Pt12 Pt06 Pt18 PD1 + TIM-3 PD1 + CTLA-4 Pt28 Pt17 Pt37 Pt12 Pt18 Pt34 Pt11 CTLA-4+ IFNα2a Pt30 Pt36 Pt31 Pt04 Pt03 Pt25 Pt22 Pt20 Pt09 Pt26 Pt10* Pt01* Pt21 Pt24 Pt02* Pt16* Pt08* Pt23* Pt13 Pt07 Pt06 Pt19 Pt15 Pt14 Pt33 Pt29
Responses to combined agents
Pt32 Pt27 Pt05 Pt35 Pt26# a b αCTLA-4 αCTLA-4 αPD1 αPD1 αPD1
αPD1+αCTLA-4αPD1 αCTLA-4+IFNα2a αPD1+αCTLA-4 αPD1+IFNα2a αPD1+αTIM-3 α41BB/41BBL αPD1+αCTLA-4 αPD1+αCTLA-4
IFNα2a αCTLA-4 IFNα2a
NR (23) R (7) NR (13) – (3) R (2) NR (5) R (2) NR (11) R (1) NR (2) NR (23) – (15) R (5) NR (3) R (4) NR (1) NR (3) R (10) NR (2) – (3) NR (21) R (8) NR (11) – (2) R (3) NR (5) NR (11) NR (2) NR (21) R (8) NR (3) – (10) R (6) NR (2) R (1) NR (2) R (7) NR (1) – (2) NR (21) R (2) NR (4) – (15) – (2) – (4) R (1) NR (2) – (12) αPD1 and αCTLA-4 /41BBLα41BB α41BB/ 41BBL αPD1+ αCTLA-4 NR (18) R (6) NR (6) – (6) R (3) NR (3) R (1) NR (3) – (2) R (1) NR (5) αCTLA-4 NR (11) R (2) NR (6) – (3) NR (2) R (2) NR (4) NR (3) αPD1 NR (11) R (2) NR (6) – (3) R (1) NR (1) R (3) NR (3) R (1) NR (2) αTIM-3 NR : Non responders R : Responders c Pt14 Pt29 Responses to single agents
IFNα2a axis Pt09
Pt03 Pt34 TIM-3 axis Pt24* Pt13* CTLA-4 axis PD1 + IFNα2a
Fig. 2 Global representation of the patterns of responses to individual or combined stimulations for 37 MMel. a, b Venn diagram representing each stimulating axis alonea or in combination b per circle, patients being identified by letters and numbers. c Frequencies of patient lesions that failed to respond to a given axis (first bar, in red) but could exhibit significant responses to alternative axis of stimulation. (second and third bar in green and blue). For instance (very left bars), in the non-responding lesions (NR) to anti-CTLA-4 Ab, we annotated the percentages that could respond (or not) to anti-CTLA-4 + anti-PD-1 Ab co-blockade (in green), among which some of them could respond (or not) to anti-PD-1 Ab alone (in blue). The detailed patterns of responses feature in Supplementary Table1. In gray boxes: Not Done
“ex vivo non-responders” for each biological readout and culture condition are presented in Supplementary Figs.3−5. As a positive control, ex vivo IL-2 stimulation of mLN frequently induced T and NK cell proliferation, as well as cytokine release mostly by NK cells (Fig. 1, Supplementary Fig. 3). Additionally, ex vivo stimulation with rIFNα2a led to high CXCL10 release (Fig.1and Supplementary Fig. 3). mLN responding ex vivo to PD-1 blockade exhibited T-cell proliferation and chemokine release (CCL2, CCL4, and CXCL10) in 20–33% of cases (Fig. 1 and Supplementary Fig. 4). mLN responding ex vivo to CTLA-4 blockade demonstrated polyfunctional T-cell activation (in 28 and 42% of responders for CD8+and CD4+T cells, respectively) and chemokine release (CCL4, CCL5, and CXCL9 in 30–40% of responders) (Fig.1and Supplementary Fig.4). mLN responding ex vivo to CTLA-4/PD-1 co-blockade typically showed NK cell proliferation (in 46% of responders) and CXCL10 release (in 50% cases) (Fig.1, Supplementary Fig.5). Anti-Tim-3 mAb led to NK and CD4+ T-cell proliferation, inflammatory cytokines and CCL4/CCL5 production in 2–3 out of 6 responding lesions (Fig. 1, Supplementary Fig. 5). mLN responding ex vivo to CD137/CD137L stimulation exhibited CD8+T-cell proliferation accompanied by IL-1β, IL-6, and TNFα release in 30−37% of responding lesions (Fig.1, Supplementary Fig.5).
The Venn diagrams detailing the patterns of immune reactivities are depicted in Fig. 2. The proportions of mLN “ex vivo responding” to at least one I-O axis were ~ 30–50 and 50–60% for mAb combinations (Supplementary Table 1, Fig.2a, b). The proportion of mLN“ex vivo responding” to both anti-CTLA-4 and anti-PD-1 mAb separately was 11/37 (30%), among which 45% failed to respond to concomitant blockade (Supplementary Table 1). Sixty percent (17/28) of mLN were
“ex vivo responders” to agonistic anti-CD137/anti-CD137L mAb among which 35% (6/17) failed to respond to any of the classical ICBs (anti-CTLA-4 or anti-PD-1 mAbs) (Supplementary Table1). The likelihood of“ex vivo response” to any alternate ICB or mAb combination in cases failing to respond to any one monotherapy or combination therapy is depicted in Fig. 2c. Altogether, our ex vivo mLN assay is a feasible test potentially allowing a diagnosis of prediction of ex vivo response to 11 conditions of stimulation.
Predictive biomarkers of resistance to CTLA-4 blockade. We next addressed whether predictive biomarkers of a functional response obtained in the ex vivo mLN assay could be inferred from the 779 blood/tumor parameters. Multivariate analyses by means of PCA on all available information are routinely performed to assess variance structure in the data and in particular for quality control purposes to identify potential outlying samples and/or features. This analysis did not reveal obvious clustering of the samples and their distribution on the first few components could not be significantly associated to any clinical parameters. Very few statistically significant immune parameters predicting responses to CTLA-4 blockade could be found (Fig.3a, b and Supplementary Fig.6a, b).
The strongest predictive biomarkers of ex vivo resistance to CTLA-4 blockade were elevated PD-L1 expression on circulating CD4+ T cells (Fig. 3a, c, AUC= 0.79, p < 0.01, (Wilcoxon rank-sum test)) and CD8+ T cells (Fig. 3a, d, AUC = 0.76, p < 0.03 [Wilcoxon rank-sum test] without adjustment for multiple comparisons) but not on the tumor-infiltrating lymphocytes in lymph node melanoma metastases (Fig. 3b and Supplementary Fig. 6c, d). Hence, pending further evaluation
c d NR (12) R (11) NR (12) R (11) %PD-L1 +/CD8 + %PD-L1 +/CD4 + 0 10 20 30 40 50 60 p<0.0364* a b p<0.0193* 0 10 20 30 40 50 60 Blood Ratio R/NR [log] p -value (Wilcoxon) %PD-L1+/CD8+ %PD-L1+/CD4+ %CD95+/CD8+ %CD95+/CD4+ 1 0.5 0.2 0.1 0.05 0.02 0.01 –1.5 –1 –0.5 0 0.5 1 1.5 Tumor Ratio R/NR [log] p -value (Wilcoxon) %PD-L1+/CD8+ %PD-L1+/CD4+ %CD95+/CD8+ %CD95+/CD4+ 1 0.5 0.2 0.1 0.05 0.02 0.01 –1.5 –1 –0.5 0 0.5 1 1.5
Fig. 3 PD-L1 expression on T cells predicts reactivity to ipilimumab in the“ex vivo mLN assay”. a, b Display of the Wilcoxon rank-sum test p-values vs. the log transformed ratio between responders (R) and non-responders (NR) to anti-CTLA-4 Ab in blooda or tumor b samples. Each dot represents one marker; selected biomarkers are shown in red while biomarkers with very low level of expression are shown in gray.c, d Expression levels of PD-L1 on blood CD4+c and CD8+d T cells in patient lesions responding (R) or not (NR) to the ex vivo mLN assay using a stimulation with anti-CTLA-4 mAb. Each dot represents one patient. The absolute numbers of patients are indicated in parentheses in both groups. Graphs were analyzed by Wilcoxon rank-sum test. Box and whiskers plots are represented from the corresponding distributionc, d
(see below) this potential biomarker may be relevant to circulating T lymphocytes but not to the tumor immune infiltrate. Other potential biomarkers such as CD95 expression (best significance in blood for CD8+ T cells, p= 0.08, [Wilcoxon rank-sum test] and in tumors for CD4+ T cells, p< 0.01 [Wilcoxon rank-sum test], Supplementary Fig. 6e−h) were also
selected in the model. Of note, CD95 membrane expression on CD4+ T cells was dominant in Treg and chronically activated CD4+ T cells as well as terminally differentiated effector CD8+ T cells (but not naive T cells, Supplementary Fig. 7a, b), and highly correlated with HLA-DR and PD-1 expressions (Supplementary Fig.7c, d). Additionally, although retained in the statistical analyses, some biomarkers were not considered further due to their weak detectability (<2% expression) and low robustness of their flow cytometric analyses.
Although the aforementioned correlations between immune parameters and in vitro/ex vivo response patterns were weak (in the sense that they were only borderline significant), we
hypothesized that PD-L1 and/or CD95 on circulating CD4+and CD8+ T cells might predict resistance to CTLA-4 blockade in MMel. We therefore decided to investigate these parameters in another patient cohort to correlate these immune parameters with in vivo responses to CTLA-4 blockade in MMel.
Ipilimumab not only improves overall survival in stage IV MMel but also impacts overall survival, recurrence-free survival and distant metastasis-free survival in resected high-risk stage III melanoma21,22. Based on the results of the“ex vivo mLN assay”, we retrospectively evaluated the previously selected biomarkers PD-L1 and CD95 on clinical response and survival outcomes (overall survival and progression-free survival). Data were available for 190 unresectable stage III and IV MMel patients treated with 3 mg/kg (in 90% cases) of ipilimumab in eight cohorts from different centers. The median follow-up is 30 months (95% Confidence Interval (CI): 26–34). Patients’ characteristics are presented in Supplementary Table 2. PD-L1 and CD95 were evaluated retrospectively at diagnosis in whole 0 10 20 30 40 50 0 10 20 30 40 50 %PD-L1+/CD4+ %PD-L1 +/CD8 + 0 20 40 60 80 100 0 10 20 30 40 50 %CD95+/CD8+ %PD-L1 +/CD8 + CA (19) CH (16) DE (3) DK (67) FR (15) IT (10) OR (20) JE (DN) All (50) HV (16) 0 20 40 60 80 100
Centers (number of patients)
%PD-L1 +/CD8 + a c b d rho = 0.83 Group 1 (46) Group 2 (41) Group 3 (21) Group 4 (19) 0 10 20 30 40 50 Metastasis site %PD-L1 +/CD8 + e f rho = 0.11 CA (19) CH (16) DE (3) DK (67) FR (15) IT (10) OR (20) JE (40) All (190) HV (35) 0 20 40 60 80 100
Centers (number of patients)
%CD95 +/CD4 + ND CH (16) DE (3) DK (67) FR (15) IT (10) OR (20) JE (ND) All (131) CA (ND) HV (10) 0 20 40 60 80 100
Centers (number of patients)
%PD-L1
+/CD4
+
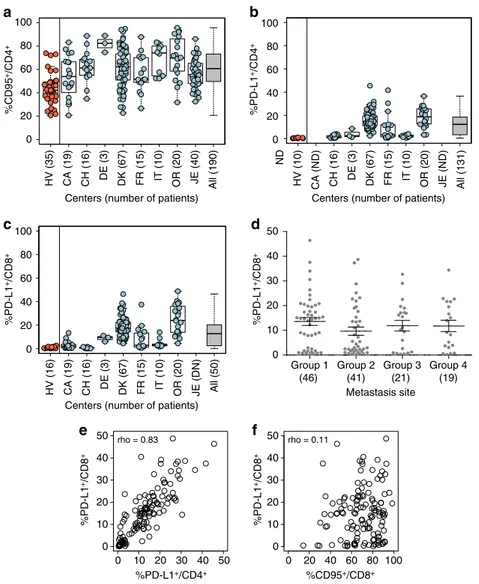
Fig. 4 Melanoma patients express higher levels of PD-L1 on circulating T cells than healthy volunteers. a−c Percentages of CD95 a and/or PD-L1+b, c cells among blood CD4+a, b or CD8+c T cells, respectively, at baseline prior to ipilimumab. Flow cytometric assessments of the proportions of blood CD3+CD4+or CD8+cells expressing PD-L1 after thawing in eight cohorts of MMel (right columns) except CA and/or JE (not assessed), as well as 10–35 healthy volunteers (in red, left column). Each dot represents one healthy volunteer or patient. Mean and s.e.m. are represented along with the box plots for each cohort described in Supplementary Table2.d Expression of PD-L1 on CD8+T cells according to the metastatic sites: 1 (skin, lymph node and lung metastases only), 2 (visceral metastases, soft tissues +/− group 1), 3 (bone metastases and+/− groups 1 and/or 2) and 4 (brain metastases and others).e, f Spearman correlation between PD-L1+/CD8+and PD-L1+/CD4+or CD95+/CD8+with rho index; each dot representing one patient. Box and whiskers plots are represented from the corresponding distributiona−c. Mean + s.e.m. d
blood or peripheral blood mononuclear cells (PBMCs) (after density gradient separation of cells) byflow cytometry gating on CD4+ and/or CD8+ T cells using a standardized methodology validated for all centers (either performed by our laboratory, after thawing of cryopreserved cells or by the investigators themselves using our antibodies and procedures). CD95 expression levels were higher in MMel compared with healthy volunteers (HV) in blood T cells (Fig.4a). Although variable according to centers and individuals, PD-L1 expression levels were highly detectable in circulating CD4+(Fig.4b) and CD8+(Fig.4c) T cells in stage III/ IV MMel patients, while remaining below the threshold of confidence in HV (Fig. 4b, c). Additionally, no significant
expression was observed between PD-L1 expression on CD8+ T cells and either the LDH status (p= 0.71, [Student’s t-test] comparing center-specific high vs. low LDH levels) or the metastases localization (Fig. 4d). On the other hand, PD-L1 expression on CD8+and CD4+T cells are highly correlated (rho = 0.83, Fig.4e) but not with CD95 expression (rho between 0.01 and 0.12, e.g., Fig. 4f).
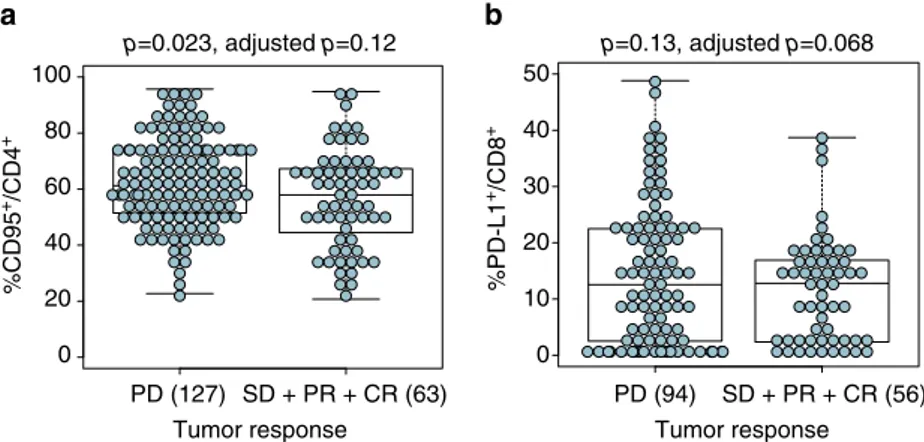
To avoid reducing the power of the statistical analysis, PD-L1 and CD95 biomarkers have been considered on a continuous scale. First, the tumor response evaluated at 3 months was categorized into 4 groups: progressive disease (PD, n= 127, 67%), stable disease (SD, n= 31, 16%), partial response (PR, n = 18, 9%) and complete response (CR, n= 14, 7%) (Supplementary Table2). The chosen binary outcome for the logistic regression model was: PD (n= 127, 67%) vs. SD + PR + CR (n = 63, 33%). Supplementary Table 3 shows the impact of clinical covariates on tumor response and survival endpoints (PFS and OS). Even if some of the presented clinical covariates were not significant in the univariate analysis, we kept them all in thefinal model as they are recognized as potential prognostic factors. Hence, final models were stratified on the centers and adjusted for LDH (“low or high”, meaning below or above the normal value for each clinical center), previous chemotherapy (“yes” or “no”), previous immunotherapy (“yes” or “no”), previous protein kinase inhibitor (“yes” or “no”), gender (“male” or “female”), age (continuous scale) and tumor stage (III or IV). Regarding the clinical response at 12 weeks, the expression of CD95 on CD4+ T cells was observed to be prognostically associated in univariate analysis (Fig.5a, p= 0.023 [Cox modeling]), however, neither CD95 nor PD-L1 on blood CD4+ and CD8+ T cells was observed to be significant in the multivariate analyses (Supplementary Table4).
Of note, the association of PD-L1+/CD8+ on clinical response is border line (Fig. 5b, p= 0.068 [Cox modeling] in multivariate analyses).
Next, we analyzed the impact of those biomarkers on PFS (in 169 MMel including 143 events) and OS (in 189 MMel including 121 events). The 2-year PFS and OS were 17% (95% CI: 11–23%) and 40% (95% CI: 32–47%), respectively (Supplementary Fig.8). Based on the univariate analysis, the highest prognostic clinical covariates on PFS was history of protein kinase inhibition (PKI), while LDH and previous chemotherapy/radiotherapy or PKI were associated with the OS (Supplementary Table 3). PD-L1 expression on circulating CD4+T cells and to a lesser extent on CD8+ T cells were prognostic on PFS after CTLA-4 blockade (Supplementary Table 5, p= 0.009 [Kaplan−Meier methods] for PD-L1+CD4+and p= 0.056 [Kaplan−Meier methods] for PD-L1 +CD8+ in multivariate analyses). Similarly, PD-L1+CD8+ T cells was observed to be prognostic on OS (Fig. 6a, b, p= 0.011 [Kaplan−Meier methods] in multivariate analyses) outperforming PD-L1+CD4+ T cells (p= 0.081 [Kaplan-Meier methods] in multivariate analyses) (Supplementary Table5). For both PFS and OS, the higher is the expression of PD-L1, the higher the risk. On the other hand, no significant association was highlighted between the CD95 expression (on both circulating CD4+ and CD8+ T cells) and survival endpoints (Supplementary Table5). Even if no significant association was observed, Fig.6c illustrates a protective tendency for patients with extremely low expression level of CD95+ on CD8+ T cells. We also investigated a cutoff value of 70% for the expression of CD95 on CD4+T cells (Fig.6d) but did not find association on OS in multivariate analysis. It should be noted that the frequency of circulating PD-L1+CD8+ T cells impacted OS more than PFS with a hazard ratio± 95 confidence interval for OS = 1.053 (1.012–1.096) and for PFS = 1.032 (0.999–1.065), in line with the fact that immune-related parameters generally have a larger influence on OS than on PFS23–25.
Altogether, our data indicate that PD-L1+expression especially on CD8+T cells is associated with CTLA-4 blockade (mostly 3 mg/kg) for OS and borderline for RR and PFS in unresectable stage III and IV MMel.
Predictive biomarkers of response to CTLA-4 + PD-1 co-blockade. The regimen of ipilimumab and nivolumab has demonstrated impressive clinical benefit in MMel (objective
a b PD (127) SD + PR + CR (63) 0 20 40 60 80 100 p=0.023, adjusted p=0.12 p=0.13, adjusted p=0.068 Tumor response %CD95 +/CD4 + PD (94) SD + PR + CR (56) 0 10 20 30 40 50 Tumor response %PD-L1 +/CD8 +
Fig. 5 Predictive values of PD-L1+/CD8+and CD95+/CD4+for RR to ipilimumab.a, b Statistical analyses of the clinical relevance of CD95 expression on CD4+T cells as well as PD-L1 on CD8+T cells according to RR (separating PD from SD, PR, or CR) were performed in univariate and multivariate regression assays. Each dot represents one patient. The box plots indicating the mean and s.e.m. of values for the binary separation are depicted (cf Supplementary Table4). The absolute numbers of patients are indicated in all groups in parentheses. Box and whiskers plots are represented from the corresponding distributiona, b
response rate (ORR)>60% with a PFS >11 months), but is also associated with a high rate of immune related adverse events (>50% grade 3–4 events)26. This supports further investigation
into biomarkers which may predict which patients may derive the most benefit to spare primarily resistant patients the toxicity of the treatment. Given that the proportion of mLN that respond to both anti-CTLA-4 and anti-PD-1 mAb separately was 11/37 (29%), among which 45% failed to respond to combined blockade (Supplementary Table1, Fig.2), we hypothesized that predictive biomarkers of response to this combination would have different immunometrics than those identified for anti-CTLA-4 blockade. Again, few immune parameters in blood and tumors were found to be associated with functional responses to co-blockade (Fig. 7a–d and Supplementary Fig. 9a, b). The two superior immunometrics retained in the assay of 779 variables were the expression levels of CD137/4-1BB on circulating CD4+and CD8+ T lymphocytes (Fig.7b, c). Detectable expression levels of CD137 on blood and tumor CD8+T lymphocytes (and to a lesser extent in CD4+ T cells) at diagnosis were correlated to response to combined anti-PD-1/CTLA-4 mAbs (Fig. 7b, c, e, f). Based on these findings obtained in blood and tumor, we hypothesized that CD137 critically impacted sensitivity to CTLA-4/PD-1 co-blockade in MMel.
To assess the predictive value of CD137 expression on circulating CD8+T cells at baseline for clinical benefit from the combination of ipilimumab and nivolumab, we analyzed this
parameter in PBMCs obtained from a phase II adjuvant trial assessing the efficacy of nivolumab and ipilimumab combination therapy in resected stage IIIc and IV MMel. The median follow-up of this study was 13 months. The expression levels of CD137 on circulating CD8+ T cells at baseline in this cohort of patients was within the range of those described above in patients with metastatic disease (Fig. 7g, h). Interestingly, stage III MMel patients with resected high risk disease who did not relapse after combination therapy expressed much higher levels of CD137 on their circulating CD8+T cells at enrollment in the Phase II adjuvant trial, compared with the levels in patients who had a relapse (p= 0.004 [Wilcoxon rank-sum test]) (Fig.7g).
Of note, low CD137 expression on CD8+T cells did not predict relapse in patients with high-risk resected melanoma treated with nivolumab alone as anticipated from our correlative matrices (Fig.7h). To analyze which biomarker was best associated with clinical outcome to PD-1 blockade, we returned to the ex vivo mLN assay described above. The best immunometrics obtained on circulating T cells and retained in the model of 779 variables were (i) PD-1 expression levels on CD4+ T cells, (ii) the ratio between CD8+ lymphocytes and CD127lowCD25highCD4+Treg cells, (iii) PD-L1 expression on CD4+and CD8+T cells as shown for ipilimumab (Supplementary Fig. 10a). Indeed, higher expression levels of PD-1 (>20%) in circulating CD4+T cells at diagnosis was associated with the likelihood to respond in the
a b c d 20 40 60 80 100 %CD95+/CD8+ 0 6 12 18 24 0 % 25 % 50 % 75 % 100 % At risk 75 61 45 32 21 =< 12.7 75 58 38 28 20 > 12.7 %PD-L1+/CD8+ =< 12.7 > 12.7 Time in months Overall survival 0 10 20 30 40 −3 −2 −1 0 1 2 3 %PD-L1+/CD8+
Log relative risk
−3 −2 −1 0 1 2 3
Log relative risk
0 6 12 18 24 0 % 25 % 50 % 75 % 100 % At risk 134 112 77 59 41 =< 70 55 34 20 12 10 > 70 %CD95+/CD4+ =< 70 > 70 Time in months Overall survival
Fig. 6 Relative risk of death according to PD-L1 or CD95 on T cells. Overall survival is fulfilled for n = 189 patients including 121 events. a Graphical visualization of the log relative risk according to the expression of PD-L1 on CD8+T cells (p= 0.011 in the multivariate analysis, Supplementary Table5). The dashed blue lines represent the 95% confidence intervals. b Kaplan−Meier OS curves segregating the whole cohort according to the median value (i.e., 12.7%) for the PD-L1 expression on blood CD8+T cells at baseline.c Graphical visualization of the log relative risk according to the expression of CD95 on CD8+T cells (p= 0.33 in the multivariate analysis, Supplementary Table5). The dashed blue lines represent the 95% confidence intervals. d Kaplan−Meier OS curves segregating the whole cohort according to a cutoff value of 70% for the CD95 expression on blood CD4+T cells at baseline
ex vivo mLN functional assays using anti-PD-1 mAb (but not other mAbs; p< 0.02 [Wilcoxon rank-sum test], AUC = 0.75) (Supplementary Fig. 10b). A CD8+ T cell/Treg ratio >5 also tended to predict ex vivo reactivity of mLN to PD-1 blockade (but not to another I-O axis; p< 0.06 [Wilcoxon rank-sum test], AUC = 0.73) (Supplementary Fig. 10c). Similar to CTLA-4 blockade, lower expression levels of PD-L1 on circulating CD4+and CD8+ T cells were associated with ex vivo reactivity of PD-1 blockade (Supplementary Fig.10d).
Altogether, this study demonstrates that the ex vivo mLN assay, as well as the preselected biomarkers of response or resistance to mAbs may identify patients likely to respond to, or fail to benefit from the proposed therapy.
Discussion
We describe new predictive biomarkers of response to CTLA-4 blockade and to effective but potentially toxic combination
a Blood b d Tumor e %CD137 +/CD4 + 0 1 2 3 4 5 p<0.2353 NR (10) R (12) NR (10) R (12) c %CD137 +/CD8 + 0 1 2 3 4 p<0.0479* %CD137 +/CD4 + 0 2 4 6 8 10 12 14 p<0.0095** %CD137 +/CD8 + 0 5 10 15 20 p<0.0437* NR (17) R (16) NR (17) R (16) f g h %CD137 +/CD8 + 0 2 4 6 8 10 p<0.0040** Relapse (5) NED (9) %CD137 +/CD8 + 0 2 4 6 8 10 p<0.3143 Relapse (5) NED (18) Ratio R/NR [log] p -value (Wilcoxon) %CD137L+/CD4+ %CD137L+/CD8+ %CD137+/CD4+ %CD137+/CD8+ 1 0.5 0.2 0.1 0.05 0.02 0.01 0.005 –1 –0.5 0 0.5 1 Ratio R/NR [log] p -value (Wilcoxon) %CD137L+/CD4+ %CD137L+/CD8+ %CD137+/CD4+ %CD137+/CD8+ 1 0.5 0.2 0.1 0.05 0.02 0.01 0.005 –1.5 –1 –0.5 0 0.5 1 1.5
Fig. 7 CD137 expression on blood CD8+T cells predicts sensitivity to the combination of anti-CTLA-4+ anti-PD-1 Ab.a, d Display of the Wilcoxon rank-sum test p-values vs. the log transformed ratio between responders (R) and non-responders (NR) to anti-CTLA-4 + anti-PD-1 Abs in the blooda and tumor d in the ex vivo mLN assay. Each dot represents one marker; selected biomarkers are shown in red while biomarkers with low level of expression are shown in gray.b−f Expression levels of CD137 in blood b, c and tumor bed e, f of CD4+b, e and CD8+Tc, f cells, respectively, in patient lesions responding (R) or not (NR) in the ex vivo mLN assay anti-CTLA-4 + anti-PD-1 mAbs stimulatory condition. Each dot represents one patient. The absolute numbers of patients are indicated in both groups in parentheses. Graphs were analyzed by Wilcoxon rank-sum test.g, h Prospective analysis of CD137 expression on T cells prior to enrollment in a Phase II trial of high risk stage IIIc/IV MMel patients. Distributions of CD137 expression on blood CD8+T cells at diagnosis prior to PD-1/CTLA-4 co-blockadeg or PD-1 blockade h across patient groups stratified based on progression (relapse or no evidence of disease [NED]) with a median follow-up of 13 months post enrollment in adjuvant therapy for stage III/IV resected MMel. Each dot represents theflow cytometry analysis value of CD137 expression compared with an isotype control mAb prior to adjuvant therapy. Reported p-values are obtained from the Wilcoxon rank-sum test. Box and whisker plots are represented from the corresponding distributionb, c, e−h
therapy composed of anti-CTLA-4 + anti-PD-1 mAbs. These results are based on a functional method called“the ex vivo mLN assay”, capable of assessing the reactivity of metastatic lymph node infiltrating immune effectors (T and NK cells) during stimulation with various ICB or agonistic mAbs and their combinations. This was coupled with a paired blood and tumor immune profiling of mLN in stage III MMel with the intention of correlating immune fingerprints with clinical parameters27, 28. We elucidated the relevance of PD-L1 expression on circulating T cells for the prediction of resistance to ipilimumab, alone or combination with IL-2 or GM-CSF. Moreover, our study shows that detectable levels of CD137 on circulating CD8+T cells after LN or metastatic resection in stage IIIc and IV melanoma tends to predict longer PFS for the anti-CTLA-4 + anti-PD-1 co-blockade.
The ex vivo mLN assay was feasible for almost all mLN specimens containing at least 107 cells (37/46 were successfully performed and contained enough cells for the “ex vivo mLN assay”). Of note, this method could be downscaled to the size of a biopsy if only 1 or 2 mAbs had to be tested. The method is also reliable in that the two negative controls used (18–24 h or a 4–5 day incubation in the absence of stimulus or in the presence of Ig control mAb) allow the basal assessment of T cell functions to be determined19 with low non-specific backgrounds. The high dose rIL-2 and rIFNα2a positive controls almost invariably triggered effector (and Treg) proliferation and CXCL10 release, respectively, in all patients. We show that this method can analyze important dynamic T and NK cell parameters relevant to effector functions against cancer, such as proliferation and release of Th1 cytokines, as well as proportions of Tregs in the co-culture system. Cytokine and chemokine release could be considered as surrogate markers for effector cell trafficking or homing to inflammatory sites.
It should be noted that the biomarkers that we chose to validate and that were initially characterized in the discovery cohort were chosen without adhering to the usual practice of correcting for multiple comparisons. Rather, we preferred to include candidate biomarkers based on raw (univariate) p-values of <0.05 that reflected results that could be robustly quantified and that appeared biologically relevant with fold changes between positive and negative controls of >1.5 for a given axis. It is only by testing additional cohorts of patients who received ipilimumab in vivo that these candidate biomarkers acquired a potential significance.
Thefindings from our study indicate that the mLN reactivity to immunomodulators is specific for each patient since (i) a precise and specific pattern of immune activation for each mAb or their various combinations across patients was not possible, in contrast to generalizable responses to rIL-2 or rIFNα2a; (ii) each individual patient exhibited a specific pattern of response to the panel of stimulatory agents. Interestingly, our long-term expertise with this ex vivo tumor restimulation assay underscores the relevance of the tumor microenvironment in dictating the functional outcome. Indeed, GIST responded best to anti-IL-10 or anti-TRAIL mAbs or rIFNα2a, rather than to anti-PD-1 or anti-CTLA-4 mAbs29.
Our study also uncovers, for thefirst time, two biomarkers of resistance or response to I-O regimens: ipilimumab alone or combined with PD-1 blockade. Herein, we found that the most prominent markers predicting response to such regimens were not the obvious candidates. PD-L1 (and not CTLA-4) on T cells was found crucial for the prediction of resistance to anti-CTLA-4 mAb, whereas CD137 expression on circulating CD8+ T cells appears a promising predictor of long term (>13 months) relapse-free survival mediated by the combination of anti-PD-1 and anti-CTLA-4 mAbs in the adjuvant setting. This should be
investigated further in the metastatic setting and validated in additional adjuvant patients.
Most previous biomarker studies with PD-1/PD-L1 antibodies have focused on the prognostic significance of PD-L1 (and/or PD-L2) expression on tumor cells or myeloid cells of the TME. Expression of both PD-L1 and PD-L2 significantly correlated with increasing densities of immune cells in the tumor specimens and with immunotype. Positive PD-L2 expression alone or combination with PD-L1 expression, was associated with improved overall survival30. High PD-L1 expression on melanoma were found predominantly in regions of abundant inflammation or TIL infiltrates, even in sanctuaries like brain metastases31, but it failed to predict responses to ICB in MMel. To our knowledge, this is the first comprehensive analysis of the predictive role of PD-L1 expression on peripheral blood T cells in melanoma. This expression might reflect the chronic exposure to type 1−type 2 IFNs in the TME in recirculating TILs20, as already reported in tumor cells themselves32.
In contrast, we could not identify a significant association of the CD95/CD4 biomarker neither with OS nor PFS in multivariate analyses in these cohorts of MMel. However, given its biological relevance33–43, higher levels (>70%) detected in MMel (compared with HV), and co-expression of a variety of inhibitory receptors on CD95+CD4+ T cells (such as PD-1, and HLA-DR, Supplementary Fig. 7), it might still be interesting to consider this biomarker in prospective studies using cutoff values>70%.
The combination of ICBs ipilimumab and nivolumab has been FDA-approved for first-line treatment of unresectable MMel. This approval followed the results of CheckMate 06726–06944, trials where the combination of ipilimumab and nivolumab outperformed each single agent alone in terms of response rates and PFS. Additionally, recently published data in non-small cell lung cancer patients have shown promising results for the combination of anti-PD-L1 and anti-CTLA-4 mAbs in a phase 1b clinical trial45. Hence, such combinations may be integrated into the ever-changing melanoma treatment algorithm, and will most likely be extended to other malignancies sensitive to PD-1 blockade. However, drug-related adverse events of grade 3 or 4 have been reported in 54% of patients receiving ipilimumab/ nivolumab combination therapy, as compared with 24% of patients receiving ipilimumab monotherapy46, 47. Such immune-related adverse events are generally reversible with immunosuppressive medications. Given the efficacy and relative safety of nivolumab alone,finding a predictor of response to such potentially toxic combinations is an urgent unmet clinical need. Here, we propose a biomarker of response to ipilimumab + nivolumab: the presence of detectable levels of CD137 on blood CD8+T cells, which appears to be significantly associated with a lack of relapse in resected high-risk, treatment-naive stage III MMel. This novel biomarker is based on the following data: (i) circulating T-lymphocytes expressing CD137 could be found in the blood of patients with no evidence of disease with a median follow-up of 13 months who received the combination in an adjuvant setting (and not in those where nivolumab was administered alone); (ii) thefinding from the ex vivo mLN assay that CD137 is upregulated in CD4+ and CD8+ TILs in lesions found to be“responding” to ex vivo stimulation with the combination of anti-PD-1 + anti-CTLA-4 mAbs (and not to anti-PD-1 mAb or to other combinatorial regimens). It is therefore conceivable that this combinatorial stimulation leads to the engagement of the CD137/CD137L co-stimulatory pathway, required for T cell fitness and recirculation in the blood of responders20. However, this pathway did not appear responsible for tumor rejection mediated by the combination regimen in mouse models, although the addition of an agonistic CD137 mAb
to the combination therapy further delayed tumor outgrowth in a therapeutic MCA-induced sarcoma model (MJS, unpublished data). This data confirm a previous study performed in mouse ovarian carcinomas, where agonistic anti-CD137 mAb augmented the impact of anti-PD-1 + anti-CTLA-4 mAb therapy48.
These novel predictive immunometrics add to the long list of putative biomarkers potentially relevant for ICB therapies. Our previous experience suggested that high LDH levels, CXCL11 and sCD25 concentrations in the serum negatively predict time to progression in ipilimumab-treated stage IV MMel49–52, whereas CLA (Cutaneous Lymphocyte Antigen) expressing CD8+ TEM represent a pharmacodynamic signature of sensitivity to CTLA-4 blockade20. HLA subtype53, genetic polymorphisms54, and absolute lymphocyte counts55 have not been validated as immunotherapy biomarkers. A number of alternative parameters such as high baseline levels of Foxp3 and IDO expression54, increased TILs and Th1 cells at baseline56, MDSC numbers50, 57,58, T cell ICOS expression as pharmacodynamic markers59, and (more recently) high mutational load and neoantigen landscape60,61, have yet to be prospectively studied as biomarkers for the efficacy of immunotherapy for melanoma.
A number of biomarkers of response to anti-PD-1/PD-L1 mAbs have been considered promising for future prospective validation. For example, selective CD8+T cell tumor infiltration (often correlated with PD-L1 expression) and their distribution at tumor invasive margins preceding PD-1 blockade appear to predict ORR in stage IV melanoma62–64. Similarly, the immunohistochemical determination of PD-L1 expression (although lacking a standardized methodology and subject to variable expression depending on timing and biopsy sites) may guide the choice between PD-1 blockade vs. CTLA-4 + PD-1 co-blockade63–65. A high mutational load is also associated with clinical responses to the PD-1 regimen66. Moreover, high relative eosinophil count, and lymphocyte count, low LDH and absence of metastasis other than soft-tissue or lung at baseline are associated with a favorable OS in patients treated with pembrolizumab67. Whether the proposed blood biomarkers identified in our study (PD-1 expression on CD4+T cells, PD-L1 expression on CD4+and CD8+T cells, or the CD8+T cell/Treg ratio in blood) would also be useful to predict the efficacy of PD-1 blockade remains to be elucidated in large retrospective and then prospective cohorts. Our findings suggest that prospective ICB adjuvant trials in stage III−IV MMel could be personalized based on (i) ex vivo mLN assays or (ii) blood biomarkers capable of predicting such response. Obviously, further clinical trials are necessary to validate this prediction.
Methods
Experimental design. In a cohort of stage III MMel patients, we previously reported the immune parameters that were significantly associated with outcome19.
We established an ex vivo assay based on the reactivity of immune cells from 37 dissociated metastatic lymph nodes to mAbs and cytokines. We arbitrarily defined “responding” lesions, those exhibiting a more than 1.5-fold change over two different controls (medium and IgG) in two independent biological readouts (out of 40 readouts measured, 35 were retained with a threshold of 95% of detected values). This stratification into responders (R) vs. non-responders (NR) enabled us to define in a retrospective manner which parameters expressed by peripheral or infiltrating T cells were essential for this response. Furthermore, we demonstrated the validity of the method by analyzing the predictive value of some parameters on retrospective clinical cohorts including 190 unresectable stage III−IV MMel patients.
Study approval. Institutional review board approvals were granted by the University of Tübingen, the University of California, the University Hospital of Copenhagen, the University Hospital of Zürich, the University Hospital of Siena, the Sharett Institute of Oncology, the Aarhus University Hospital, the Centre Hospitalier de Nantes, and the Providence Cancer Center (for the ipilimumab-treated cohorts), the Laura & Isaac Perlmutter Cancer Center (for ipilimumab +
nivolumab and nivolumab) and Gustave Roussy/Kremlin Bicêtre and Centre Hospitalier Lyon-Sud for the prospective cohort and retrospective cohorts (Supplementary Fig.7d) which were previously described68,69. The human study
protocols were in accordance with the Declaration of Helsinki principles, and all patients provided informed consent before enrollment in the study.
Prospective cohort of 37 patients. This cohort and its clinical parameters have been previously described19.
Retrospective cohorts of 190 ipilimumab-treated patients. Patients enrolled in this study were from several centers: the University of Tübingen, University of Siena, University of California, University Hospital of Copenhagen, University Hospital of Zürich, Sharett Institute of Oncology, Aarhus University Hospital, Centre Hospitalier de Nantes, and the Providence Cancer Center. In all cohorts, blood samples were collected before injections of ipilimumab from patients participating in evaluations of ipilimumab as adjuvant therapy. Markers were assessed on PBMCs with the exception of the Sharett Institute of Oncology cohort (assessed on whole blood) after thawing. Patients’ characteristics can be found in Supplementary Table2.
Retrospective study on the adjuvant Phase II trial testing nivolumab + ipili-mumab vs. nivolumab-treated patients. Information regarding this clinical trial can be found in reference70.
PBMC and TILs preparations. Peripheral blood samples from patients or HV were carefully layered on top of a Ficoll-Hypaque density gradient media (PAA Laboratories). The ring of PBMC was collected and washed twice in PBS, resus-pended in PBS, counted and stained forflow cytometric analyses or resuspended in CryoMaxx medium (PAA Laboratories) for storage in liquid nitrogen. Resected mLN specimens from MMel patients were placed in isotonic solution at least for 1 h. Next, tissue was cut and placed in dissociation medium, which consisted of RPMI1640, 1% penicillin/streptomycin (PEST, GIBCO Invitrogen), Collagenase IV (50 IU/ml), hyaluronidase (280 IU/ml), and DNAse I (30 IU/ml) (all from Sigma-Aldrich), and run on a gentle MACS Dissociator (Miltenyi Biotec) during 1 h. Cell samples were diluted in PBS, passed through a cell strainer and centrifuged for 5 min at 1500 r.p.m. Cells werefinally resuspended in PBS, counted, stained for flow cytometric analyses or resuspended in CryoMaxx medium (PAA Laboratories) for storage in liquid nitrogen. All mLN included in the study were histologically confirmed to be invaded and patients enrolled in this prospective cohort were free of prior Abs-based immunotherapies.
Ex vivo mLN assays. Dissociated cells from mLN were incubated in two 48-well plates at 0.3 × 10⁶/ml in complete medium (RPMI 1640 supplemented with 10% human AB serum [Institut de Biotechnologie Jacques Boy], 1% Penicillin/Strep-tomycin, 1%L-glutamine and 1% of sodium pyruvate [all from Gibco-Invitrogen]) and with isotype control, agonistic (CD137/CD137L) or antagonistic (PD-1/PD-L1, CTLA-4, Tim-3) mAbs or cytokines (IFNα2a [Roferon, ROF], IL-2) or their combinations (PD-1 + ROF, CTLA-4 + ROF, PD-1 + Tim-3, PD-1 + CTLA-4) as described in the Supplementary Fig.1and Supplementary Tables1and7. After 18–24 h of incubation with or without drugs, cells were stimulated with PMA (5 ng/ml) (Sigma), ionomycin (125 ng/ml) (Sigma), and BD Golgi Stop (4µl per 6 ml) (BD Biosciences) for 3−5 h. Cells were then collected, membrane stained to discriminate between different lymphocyte subsets (Supplementary Table8), permeabilized with BD Cytofix/CytopermTMkit (BD Biosciences). Intracellular staining was then performed using anti-IFNγ PE (BD Biosciences, clone B27) and anti-TNFα AF647 (BioLegend, clone Mab11) mAbs. For the second plate, after 4 −5 days of culture with or without drugs, cells were collected and membrane stained, permeabilized with Foxp3/Transcription factor Fixation/Permeabilization kit (eBiosciences) and intranuclearly stained with anti-Ki67 PE (BD Biosciences, clone B56) and anti-Foxp3 APC (eBiosciences, clone PCH101) mAbs following the manufacturer’s recommendations. We arbitrarily defined “biological responses”, as those exhibiting a >1.5-fold increase over the values obtained with two negative controls (medium and Ig control mAb) in at least two independent biological readouts, except for CD4+FoxP3+Treg for which a response was defined as a>1.5-fold decrease compared with the baseline levels in responders compared to non-responders.
Flow cytometric analyses. For membrane labeling, PBMC and TILs were stained withfluorochrome-coupled mAbs (detailed in Supplementary Table8), incubated for 20 min at 4°C and washed. Cell samples were acquired on a Cyan ADP 9-color (Beckman Coulter), BD FACS Canto IIflow-cytometers or on an 18-color BD LSRII (BD Biosciences) with single-stained antibody-capturing beads used for compensation (Compbeads, BD Biosciences or UltraComp eBeads, eBiosciences). Data were analyzed with FlowJo software v7.6.5 or v10 (Tree Star, Ashland, OR, USA).
Cytokine and chemokine measurements. Supernatants from cultured cells were monitored using the human Th1/Th2/Th9/Th17/Th22 13-plex RTU FlowCytomix
Kit (eBiosciences), and human chemokine 6-plex kit FlowCytomix (eBiosciences) according to the manufacturer’s instructions and acquired on a Cyan ADP 9-color flow cytometer (Beckman Coulter). Analyses were performed by FlowCytomix Pro 3.0 Software (eBiosciences). Some measurements were performed by ELISA with IFNγ (BioLegend), IL-9 (BioLegend), TNFα (BD Biosciences), CCL2 (BD Biosciences), CCL3 (R&D Systems), CCL4 (R&D Systems), CCL5 (R&D Systems), and CXCL10 (BD Biosciences) kits in accordance with the manufacturer’s recommendations.
Statistics. Data analyses were performed with the R software ( http://www.R-project.org/). Graphical representations were performed either with R or Prism 5 (GraphPad, San Diego, CA, USA). For the“ex vivo metastatic lymph node (mLN) assay” 124 (blood) and 128 (tumor) parameters were analyzed and reported. The effectiveness of these biomarkers on resistance to CTLA-4 blockade was reported and graphed using the log transformed ratio between responders and non-responders or the area under the ROC curve (AUC statistic) on the x-axis and the Wilcoxon rank-sum test p-values on the y-axis. Distribution of biomarkers were also plotted through box and whiskers plots. Regarding the retrospective cohort evaluation, logistic regressions (univariate and multivariate) have been used to assess the association of covariates on binary endpoint (i.e., clinical response). Two survival endpoints were also evaluated: (i) overall survival (OS) was defined as the time from the date of sampling to death or the last follow-up, whichever occurredfirst and (ii) PFS was defined as the time from the date of sampling to death, disease progression or the last follow-up, whichever occurredfirst. For both survival endpoints (OS and PFS), survival curves were estimated using the Kaplan −Meier method by dichotomizing biomarkers through their median value or a chosen cutoff based on HV. The decision between median vs. a cutoff, is based on the fact that the PD-L1+CD8+cells in most healthy volunteers were undetectable (with values close to 0), meaning that most of the patients would have been classified as supranormal. Therefore, we chose to calculate the median values for patients with respect to this parameter. In sharp contrast, the values of CD95+CD4+cells in healthy volunteers were sizeable, allowing to estimate a threshold above which the patients could be considered supranormal. Cox models have been used to perform univariate and multivariate analysis. Graphical visua-lization of the effect of continuous biomarkers has been performed by modeling them through splines with 2 degrees of freedom. All the logistic and Cox models evaluated the biomarkers based on a continuous scale, were stratified on the centers, and adjusted for LDH, gender, age, tumor stage, CT, IT, and PKI as indicated in Supplementary Tables3−6. In all cases, confidence intervals were reported at a nominal level of 95%.
Data availability. An MTA was signed between Gustave Roussy and Laura and Isaac Perlmutter Cancer Center.
Received: 1 February 2017 Accepted: 10 July 2017
References
1. Tartour, E. & Zitvogel, L. Lung cancer: potential targets for immunotherapy. Lancet Respir. Med. 1, 551–563 (2013).
2. Sathyanarayanan, V. & Neelapu, S. S. Cancer immunotherapy: strategies for personalization and combinatorial approaches. Mol. Oncol. 9, 2043–2053 (2015).
3. Kantoff, P. W. et al. Sipuleucel-T immunotherapy for castration-resistant prostate cancer. N. Engl. J. Med. 363, 411–422 (2010).
4. Rosenberg, S. A. Raising the bar: the curative potential of human cancer immunotherapy. Sci. Transl. Med. 4, 127ps8 (2012).
5. June, C. H., Riddell, S. R. & Schumacher, T. N. Adoptive cellular therapy: a race to thefinish line. Sci. Transl. Med. 7, 280ps7 (2015).
6. Przepiorka, D. et al. FDA Approval: blinatumomab. Clin. Cancer Res. 21, 4035–4039 (2015).
7. Wolchok, J. D. et al. Four-year survival rates for patients with metastatic melanoma who received ipilimumab in phase II clinical trials. Ann. Oncol. 24, 2174–2180 (2013).
8. Topalian, S. L., Drake, C. G. & Pardoll, D. M. Immune checkpoint blockade: a common denominator approach to cancer therapy. Cancer Cell 27, 450–461 (2015).
9. Killock, D. Skin cancer: T-VEC oncolytic viral therapy shows promise in melanoma. Nat. Rev. Clin. Oncol. 12, 438 (2015).
10. Topalian, S. L. et al. Immunotherapy: the path to win the war on cancer? Cell 161, 185–186 (2015).
11. Brahmer, J. R. et al. Safety and activity of anti-PD-L1 antibody in patients with advanced cancer. N. Engl. J. Med. 366, 2455–2465 (2012).
12. Garon, E. B. et al. Pembrolizumab for the treatment of non-small-cell lung cancer. N. Engl. J. Med. 372, 2018–2028 (2015).
13. Kleffel, S. et al. Melanoma cell-intrinsic PD-1 receptor functions promote tumor growth. Cell 162, 1242–1256 (2015).
14. Ladoire, S. et al. Combined evaluation of LC3B puncta and HMGB1 expression predicts residual risk of relapse after adjuvant chemotherapy in breast cancer. Autophagy 11, 1878–1890 (2015).
15. Holmgaard, R. B. et al. Tumor-expressed IDO recruits and activates MDSCs in a Treg-dependent manner. Cell Rep. 13, 412–424 (2015).
16. Kridel, R. et al. The prognostic impact of CD163-positive macrophages in follicular lymphoma: a study from the BC cancer agency and the lymphoma study association. Clin. Cancer Res. 21, 3428–3435 (2015).
17. Denkert, C. et al. Tumor-infiltrating lymphocytes and response to neoadjuvant chemotherapy with or without carboplatin in human epidermal growth factor receptor 2-positive and triple-negative primary breast cancers. J. Clin. Oncol. 33, 983–991 (2015).
18. Eggermont, A. M. M., Spatz, A. & Robert, C. Cutaneous melanoma. Lancet Lond. Engl. 383, 816–827 (2014).
19. Jacquelot, N. et al. Immunophenotyping of stage III melanoma reveals parameters associated with patient prognosis. J. Invest. Dermatol. 136, 994–1001 (2016).
20. Jacquelot, N. et al. Chemokine receptor patterns in lymphocytes mirror metastatic spreading in melanoma. J. Clin. Invest. 126, 921–937 (2016). 21. Eggermont, A. M. M. et al. Adjuvant ipilimumab versus placebo after complete
resection of high-risk stage III melanoma (EORTC 18071): a randomised, double-blind, phase 3 trial. Lancet Oncol. 16, 522–530 (2015).
22. Eggermont, A. M. M. et al. Prolonged survival in stage III melanoma with ipilimumab adjuvant therapy. N. Engl. J. Med. 375, 1845–1855 (2016). 23. Wolchok, J. D. et al. Guidelines for the evaluation of immune therapy activity in
solid tumors: immune-related response criteria. Clin. Cancer Res. 15, 7412–7420 (2009).
24. Hoos, A. et al. Improved endpoints for cancer immunotherapy trials. J. Natl Cancer Inst. 102, 1388–1397 (2010).
25. Hoos, A., Wolchok, J. D., Humphrey, R. W. & Hodi, F. S. CCR 20th anniversary commentary: immune-related response criteria-capturing clinical activity in immuno-oncology. Clin. Cancer Res. 21, 4989–4991 (2015).
26. Larkin, J. et al. Combined nivolumab and ipilimumab or monotherapy in untreated melanoma. N. Engl. J. Med. 373, 23–34 (2015).
27. Weide, B., Di Giacomo, A. M., Fonsatti, E. & Zitvogel, L. Immunologic correlates in the course of treatment with immunomodulating antibodies. Semin. Oncol. 42, 448–458 (2015).
28. Ascierto, P. A., Simeone, E., Sznol, M., Fu, Y.-X. & Melero, I. Clinical experiences with anti-CD137 and anti-PD1 therapeutic antibodies. Semin. Oncol. 37, 508–516 (2010).
29. Rusakiewicz, S. et al. NKp30 isoforms and NKp30 ligands are predictive biomarkers of response to imatinib mesylate in metastatic GIST patients. Oncoimmunology 6, e1137418 (2017).
30. Obeid, J. M. et al. PD-L1, PD-L2 and PD-1 expression in metastatic melanoma: Correlation with tumor-infiltrating immune cells and clinical outcome. Oncoimmunology 5, e1235107 (2016).
31. Berghoff, A. S. et al. Tumour-infiltrating lymphocytes and expression of programmed death ligand 1 (PD-L1) in melanoma brain metastases. Histopathology 66, 289–299 (2015).
32. Benci, J. L. et al. Tumor interferon signaling regulates a multigenic resistance program to immune checkpoint blockade. Cell 167, 1540–1554.e12 (2016).
33. Sheen-Chen, S.-M., Chen, H.-S., Eng, H.-L. & Chen, W.-J. Circulating soluble Fas in patients with breast cancer. World J. Surg. 27, 10–13 (2003). 34. El-Sarha, A. I., Magour, G. M., Zaki, S. M. & El-Sammak, M. Y. Serum sFas
and tumor tissue FasL negatively correlated with survival in Egyptian patients suffering from breast ductal carcinoma. Pathol. Oncol. Res. 15, 241–250 (2009).
35. Perik, P. J. et al. Circulating apoptotic proteins are increased in long-term disease-free breast cancer survivors. Acta Oncol. Stockh. Swed. 45, 175–183 (2006).
36. Ueno, T., Toi, M. & Tominaga, T. Circulating soluble Fas concentration in breast cancer patients. Clin. Cancer Res. 5, 3529–3533 (1999).
37. Redondo, P., Solano, T., VAzquez, B., Bauza, A. & Idoate, M. Fas and Fas ligand: expression and soluble circulating levels in cutaneous malignant melanoma. Br. J. Dermatol. 147, 80–86 (2002).
38. Hewala, T. I., Abd El-Monaim, N. A., Anwar, M. & Ebied, S. A. The clinical significance of serum soluble Fas and p53 protein in breast cancer patients: comparison with serum CA 15-3. Pathol. Oncol. Res. 18, 841–848 (2012).
39. Ugurel, S., Rappl, G., Tilgen, W. & Reinhold, U. Increased soluble CD95 (sFas/CD95) serum level correlates with poor prognosis in melanoma patients. Clin. Cancer Res. 7, 1282–1286 (2001).
40. Malleter, M. et al. CD95L cell surface cleavage triggers a prometastatic signaling pathway in triple-negative breast cancer. Cancer Res. 73, 6711–6721 (2013).
41. Klebanoff, C. A. et al. Memory T cell-driven differentiation of naive cells impairs adoptive immunotherapy. J. Clin. Invest. 126, 318–334 (2016). 42. Gajate, C. & Mollinedo, F. Lipid raft-mediated Fas/CD95 apoptotic signaling in
leukemic cells and normal leukocytes and therapeutic implications. J. Leukoc. Biol. 98, 739–759 (2015).
43. Motz, G. T. et al. Tumor endothelium FasL establishes a selective immune barrier promoting tolerance in tumors. Nat. Med. 20, 607–615 (2014). 44. Hodi, F. S. et al. Combined nivolumab and ipilimumab versus ipilimumab
alone in patients with advanced melanoma: 2-year overall survival outcomes in a multicentre, randomised, controlled, phase 2 trial. Lancet Oncol. 17, 1558–1568 (2016).
45. Hellmann, M. D. et al. Nivolumab plus ipilimumab asfirst-line treatment for advanced non-small-cell lung cancer (CheckMate 012): results of an open-label, phase 1, multicohort study. Lancet Oncol. 18, 31–41 (2017).
46. Postow, M. A. et al. Nivolumab and ipilimumab versus ipilimumab in untreated melanoma. N. Engl. J. Med. 372, 2006–2017 (2015).
47. Weber, J. et al. Phase I/II study of metastatic melanoma patients treated with nivolumab who had progressed after ipilimumab. Cancer Immunol. Res. 4, 345–353 (2016).
48. Wei, H. et al. Combinatorial PD-1 Blockade and CD137 activation has therapeutic efficacy in murine cancer models and synergizes with cisplatin. PLoS ONE 8, e84927 (2013).
49. Hannani, D. et al. Anticancer immunotherapy by CTLA-4 blockade: obligatory contribution of IL-2 receptors and negative prognostic impact of soluble CD25. Cell Res. 25, 208–224 (2015).
50. Martens, A. et al. Baseline peripheral blood biomarkers associated with clinical outcome of advanced melanoma patients treated with ipilimumab. Clin. Cancer Res. 22, 2908–2918 (2016).
51. Delyon, J. et al. Experience in daily practice with ipilimumab for the treatment of patients with metastatic melanoma: an early increase in lymphocyte and eosinophil counts is associated with improved survival. Ann. Oncol. 24, 1697–1703 (2013).
52. Koguchi, Y. et al. Serum Immunoregulatory proteins as predictors of overall survival of metastatic melanoma patients treated with Ipilimumab. Cancer Res. 75, 5084–5092 (2015).
53. Wolchok, J. D. et al. Ipilimumab efficacy and safety in patients with advanced melanoma: a retrospective analysis of HLA subtype from four trials. Cancer Immun. 10, 9 (2010).
54. Hamid, O. et al. A prospective phase II trial exploring the association between tumor microenvironment biomarkers and clinical activity of ipilimumab in advanced melanoma. J. Transl. Med. 9, 204 (2011).
55. Ku, G. Y. et al. Single-institution experience with ipilimumab in advanced melanoma patients in the compassionate use setting: lymphocyte count after 2 doses correlates with survival. Cancer 116, 1767–1775 (2010).
56. Ji, R.-R. et al. An immune-active tumor microenvironment favors clinical response to ipilimumab. Cancer Immunol. Immunother. 61, 1019–1031 (2012). 57. Kitano, S. et al. Computational algorithm-driven evaluation of monocytic
myeloid-derived suppressor cell frequency for prediction of clinical outcomes. Cancer Immunol. Res. 2, 812–821 (2014).
58. Sade-Feldman, M. et al. Clinical significance of circulating CD33+CD11b+ HLA-DR- myeloid cells in Stage-IV melanoma patients treated with ipilimumab. Clin. Cancer Res. 22, 5661–5672 (2016).
59. Ng Tang, D. et al. Increased frequency of ICOS+CD4 T cells as a
pharmacodynamic biomarker for anti-CTLA-4 therapy. Cancer Immunol. Res. 1, 229–234 (2013).
60. Snyder, A. et al. Genetic basis for clinical response to CTLA-4 blockade in melanoma. N. Engl. J. Med. 371, 2189–2199 (2014).
61. Riaz, N. et al. Recurrent SERPINB3 and SERPINB4 mutations in patients who respond to anti-CTLA4 immunotherapy. Nat. Genet. 48, 1327–1329 (2016).
62. Tumeh, P. C. et al. PD-1 blockade induces responses by inhibiting adaptive immune resistance. Nature 515, 568–571 (2014).
63. Taube, J. M. et al. Colocalization of inflammatory response with B7-h1 expression in human melanocytic lesions supports an adaptive resistance mechanism of immune escape. Sci. Transl. Med. 4, 127ra37 (2012). 64. Brahmer, J. R. et al. Phase I study of single-agent anti-programmed death-1
(MDX-1106) in refractory solid tumors: safety, clinical activity,
pharmacodynamics, and immunologic correlates. J. Clin. Oncol. 28, 3167–3175 (2010).
65. Sznol, M. & Chen, L. Antagonist antibodies to PD-1 and B7-H1 (PD-L1) in the treatment of advanced human cancer--response. Clin. Cancer Res. 19, 5542 (2013).
66. Lawrence, M. S. et al. Mutational heterogeneity in cancer and the search for new cancer-associated genes. Nature 499, 214–218 (2013).
67. Weide, B. et al. Baseline biomarkers for outcome of melanoma patients treated with pembrolizumab. Clin. Cancer Res. 22, 5487–5496 (2016).
68. Kruit, W. H. J. et al. Phase 1/2 study of subcutaneous and intradermal immunization with a recombinant MAGE-3 protein in patients with detectable metastatic melanoma. Int. J. Cancer 117, 596–604 (2005).
69. Escudier, B. et al. Vaccination of metastatic melanoma patients with autologous dendritic cell (DC) derived-exosomes: results of thefirst phase I clinical trial. J. Transl. Med. 3, 10 (2005).
70. Nikhil I. K. et al. Adjuvant nivolumab (NIVO) plus ipilimumab (IPI) for resected high-risk stages IIIC/IV melanoma (MEL). ASCO Meet. Abstr. doi:10.1200/JCO.2016.34.15_suppl.9586(2016).
Acknowledgements
The authors thank the patients and their families for their acceptance to participate in this study. This work was supported by Institut National du Cancer INCa, ANR, Ligue contre le cancer (équipe labellisée de L.Z.) and Swiss Bridge Foundation, ISREC Foundation, LABEX OncoImmunology, la direction générale de l’offre de soins (DGOS), Université Paris-Sud, SIRIC SOCRATE (INCa/DGOS/INSERM 6043), PACRI network and PIA2 TORINO-LUMIERE. N.J. received a fellowship from Cancéropole Idf. M.J.S. was supported by a National Health and Medical Research Council of Australia Senior Principal Research Fellowship.
Author contributions
L.Z., S.R., A.M.E., A.M., and G.K. designed the study. N.J., M.P.R., S.R., S.J., D.M.W., A.L.S., M.H., Y.M., M.S.F., A.B., S.S.K., C.F., M. Messaoudene, C.P.M.D., and Y.K. conducted experiments. N.J., M.P.R., D.P.E., S.R., S.J., D.M.W., A.L.S., M.H., Y.M., M.S.F., A.B., S.S.K., C.F., M. Messaoudene, Y.K., J.S.W., and L.Z. analyzed the data. D.P.E., N.T., and S.M. performed statistical evaluations. A.M.E., A.M., M.J.S., and M.A., provided technical and scientific advice. L.C., B.S.K., A.C.A., and V.K.K. provided materials. B.W., F.A., C.B., S.D., O.B., B.B., G.T., A.M.D.G., M. Maio, J.S.W., D.S., I.M., B.D., A.K., M. Levesque, R.D.,. Y.K., L.F., M.L., M.B., H.S., I.M.S., and A.C. provided patient samples and clinical information. L.Z. wrote the paper with input from N.J., M.P.R., D.P.E., M.J.S., G.K., N.T., S.M., and J.S.W.
Additional information
Supplementary Informationaccompanies this paper at doi:10.1038/s41467-017-00608-2. Competing interests:L.C. receives consulting fees from Medimmune and Pfizer and patent/licensing payments from Bristol-Myers Squibb (BMS); L.C. currently receives sponsored research funding from Boehringer Ingelheim, Pfizer and Nextcure. L.F. received research funding from BMS, Merck, Medimmune, Abbvie and Genentech. S.D. is principal investigator, received research grants and congress invitation by BMS. B.W. reports research grants, speaker honoraria, and travel support from MSD/ Merck and BMS. I.M. has served as an advisor for Roche-Genentech, BMS, Boehringer Ingelheim, Novartis, Astra-Zeneca Medimmune and Incyte. AME participated on scientific advisory boards for Actelion, Agenus, Bayer, BMS, GlaxoSmithKline (GSK), HalioDx, Incyte, MSD, Nektar, Novartis, Pfizer, and Sanofi. L.Z. is on the Transgene administrative board and Lytix Pharma scientific advisory board and is the main founder of EverImmune. M.J.S. has research agreements with BMS and Corvus Pharmaceuticals and has received patent payments from BMS. A.M.D.G. has honoraria for certified continuing education, and travel supports from BMS, Astra-Zeneca, Roche and MSD. M. Maio has honoraria for certified continuing education, for consulting and advisory roles, research funding and travel supports from BMS, Roche and MSD. A.C.A. is a member of the SAB for Tizona Therapeutics, Potenza Therapeutics, and Idea Pharmaceuticals, which have interests in cancer immunology. A.K. received congress invitation from BMS. C.B. reports honoraria from Lilly, BMS and MSD, serves as advisory roles from Servier and Roche and receives research grants from Roche. B.D. reports BMS board participation, investigator for BMS clinical trials and congress invitation. Y.K. reports ownership interest in a patent regarding serum biomarkers for ipilimumab treatment (WO2016127052.A1). M.H. is a full time employee of Symphogen A/S Denmark. IMS reports honoraria for teaching, consultancy, and advisatory roles from BMS, Roche, Novartis, Genentech, and MSD, research agreement with BMS, Novartis, and Symphogen and co-founder of IO Biotech. R.D. receives research funding from Novartis, MSD, BMS, Roche, GSK and has a consultant or advisory board relationship with Novartis, MSD, BMS, Roche, GSK, Amgen, Takeda, Pierre Fabre. M.B., Y.M., and M.S.F. were supported by the NORFAR program, the Academic Research Office of the Chief Scientist, Ministry of Economy, Israel and collaborated with improdia.co.il. H.S. reports honoraria for teaching, consultancy and advisory boards from BMS, Roche, Merck and Novartis. J.S.W. receives travel grants from and participated to scientific advisory boards of BMS, Merck, Astra-Zeneca, Genentech and EMD Serono. A.M. received consulting honoraria from Roche/Genentech, BMS, Merck (MSD), Astra-Zeneca and participated to scientific advisory boards of Roche/Genentech, Pfizer/Merck serono, Novartis, GSK, eTherna, Kyowa Kirin, Symphogen, Genmab, Amgen, Lytix, Nektar, Seatlle Genetics, Transgene and Flexus Bio. The remaining authors declare no competingfinancial interests.