Università Politecnica delle Marche Dottorato di Ricerca in Scienze dell’Ingegneria Curriculum “Ingegneria Biomedica, Elettronica e delle
Telecomunicazioni”
Development
of an electromagnetic model
to characterize the field diffracted
by a human body for AAL
applications
Ph.D. Dissertation of:
Giovanni Manfredi
Advisor:
Prof. Graziano Cerri
Curriculum Supervisor:
Prof. Franco Chiaraluce
Università Politecnica delle Marche Dottorato di Ricerca in Scienze dell’Ingegneria
Facoltà di Ingegneria
To my family and Alessandra
«Logic will get you from A to B.
Imagination will take you everywhere.»
Albert Einstein
alla mia famiglia e ad Alessandra
« La logica ti può portare da A a B.
L’immaginazione invece ti può portare ovunque.
Acknowledgments
The making of this dissertation would have been impossible without the support from numerous people I encountered throughout my educational, professional, and personal life.
First of all, I would like to express my deepest appreciation and gratitude to my supervisor Prof. Graziano Cerri, for his teaching and guidance which become my source of inspiration and motivation. I wish to express my gratitude to Ing. Alfredo De Leo, Ing. Paola Russo and Ing. Lorenzo Scalise for their helpful suggestions during my research work. I would like to thank my office colleagues Valentina Di Mattia, Marco Pieralisi, Valerio Petrini and Luca Bastianelli for their support, patience and encouragement during my research.
My sincere appreciation also goes to Director of SONDRA Lab Marc Lesturgie who gave me the opportunity to work with his research group. A special thank to my supervisor Laetitia ThirionLefevre and to SONDRA research team -Jean-Philippe Ovarlez, Israel Hinostroza, Thierry Letertre and R´égis Guin-varc’h - for their full support and insightful comments which helped to improve the quality of this work.
I would also thank the colleagues of Automation research group with particular regard Luca Cavanini for his friendship, support and moments of fun.
Most of all, I would like to thank my family for their constant support and un-derstanding, and Alessandra for her love, encouragement and support through-out the development of this dissertation and my entire Ph.D years, to whom I dedicate my work.
Ancona, November 2016
Giovanni Manfredi
Abstract
The research presented in this thesis regards the development and implemen-tation of an analytical model, for the characterisation of the fields diffracted by a human body, for AAL (Ambient Assisted Living) applications. In the recent years there was growing demand for contact-less sensors addressed to remote monitoring of vital signs, in order to improve the patients’ quality of life.
This kind of systems entails the use of electromagnetic (EM) technology, and their proper design involves the analysis of the interaction between a human body and an electromagnetic wave. EM commercial tools are able to char-acterise this interaction, but they require a huge memory consumption and a great amount of time computation.
To this purpose, an EM model based on the physical optics (PO) approach is presented in this thesis, where a human body was reproduced by homogenous canonical shapes. The analytical model proves to be reliable and sufficiently accurate, reducing the computational burden required by PO-based ray tracing implemented in commercial software.
Measurements and simulations with the EM model, implemented in MAT-LAB, were performed and compared, to test its accuracy and feasibility, con-sidering a metallic sphere, lossless homogeneous objects (sphere and cylinder), and dielectric complex structures (mannequin and real target). In addition, radar Doppler techniques are studied and implemented in the proposed model, in order to analyse and discriminate general activities of a monitored moving target. The use of the EM model allows to optimise the design of unobtru-sive sensors, for the remote monitoring of the vital signs, the falls detection and the energy expenditure of physical activities of elderly people in indoor environments.
Sommario
Il lavoro di ricerca presentato in questa tesi riguarda lo sviluppo e
l’implementazione di un modello analitico, per la caratterizzazione dei campi diffratti da un corpo umano, per applicazioni nell’ambito del Ambient Assisted
Living (AAL).
Negli ultimi anni c’è stata una crescente domanda di sensori senza contatto destinati al monitoraggio da remoto dei parametri vitali, al fine di migliorare la qualità di vita dei pazienti.
Questo tipo di sistemi prevede l’utilizzo di una tecnologia basata sulla
propagazione di onde elettromagnetiche, e la loro corretta progettazione prevede l’analisi dell’interazione tra corpo umano e onda EM. Programmi di simulazione elettromagnetica sono in grado di caratterizzare tale interazione, ma richiedono un consumo di memoria enorme e una grande quantità di tempo di calcolo. Invece, un modello analitico riduce l’onere computazionale, e si dimostra affid-abile e sufficientemente accurato.
A tale scopo, un modello EM basato su un approccio di tipo ottica-fisica è presentato in questa tesi, in cui il corpo umano è stato riprodotto mediante forme canoniche omogenee. Misure e simulazioni effettuate con il modello EM, implementato in MATLAB, sono stati eseguite e confrontate, per analiz-zare l’accuratezza e la fattibilità del modello analitico, considerando una sfera metallica, oggetti omogenei senza perdite (sfera e cilindro), e strutture comp-lesse dielettriche (manichino e target reale). Inoltre, tecniche di radar Doppler sono state studiate e implementate nel modello, al fine di analizzare e discrim-inare attività generali di un target in movimento. Il modello EM permette di ottimizzare la progettazione di sensori senza contatto, per il monitoraggio da remoto dei parametri vitali, per il rilevamento di cadute e della spesa energetica relativa ad attività fisiche di persone anziane in ambienti chiusi.
Acronyms
AAL Ambient Assisted Living
EM Electromagnetic
ETA Electronic Travel Aids
EOA Electronic Orientation Aids
RR Respiratory Rythm
CW Continuous Wave
UWB Ultra Wide Band
WBAN Wireless Body Area Network
CST MWS CST MICROWAVE STUDIO
FDTD Finite Difference Time Domain
MoM Method of Moments
GO Geometric Optics
PO Physical Optics
PTD Physical Theory of Diffraction
SAM Specific Anthropomorphic Mannequin
RCS Radar Cross Section
PEC Perfect Electric Conductor
STFT Short-Time Fourier Transform
FMM Fast Multipole Method
SONDRA Supelec Onera NUS DSO Research Alliance
FFT Fast Fourier Transform
IFT Inverse Fourier Transform
VNA Vectorial Network Analyser
FoPen Foliage Penetration
Contents
1. Summary of Ph.D. Research Activity 1
1.1. Electromagnetic aids for visually impaired people . . . 1
1.2. EM contact-less sensors for AAL applications . . . 4
1.3. Analytical model to characterise the diffracted field by a human body . . . 6
2. Introduction 7 2.1. EM methods used in CST MICROWAVE STUDIO . . . 11
2.2. Aim of Ph.D thesis . . . 14
3. Preliminary Studies 17 3.1. Canonical shapes to represent the human body parts . . . 18
3.2. Analysis of the E-field backscattered by the whole body . . . . 23
3.3. Analysis of human motions: comparison between simulated and measured result . . . 27
4. Analytical Model Based on PO Approach 33 4.1. Human body model . . . 33
4.2. Reference system . . . 35
4.3. Definition of the system’s geometry . . . 37
4.4. Incident field . . . 39
4.5. Oblique incidence: the electric field . . . 40
4.6. Oblique incidence: the magnetic field . . . 42
4.7. Radiation of the equivalent currents . . . 43
4.8. Field received by the antenna of the observed target . . . 44
4.9. Antenna . . . 45
5. Static Target Analysis 49 5.1. Evaluation of the RCS PEC Sphere: comparison with theoretical values . . . 49
5.2. Evaluation of the scattering parameter due to a PEC sphere: comparison with measurements . . . 52
5.3. Evaluation of the scattering parameter due to a PEC cylinder: comparison with measurements . . . 56
Contents
5.4. Evaluation of the scattering parameter due to a phantom: com-parison with measurements . . . 57 5.5. Evaluation of the scattering parameter due to a real target:
com-parison with measurements . . . 61
6. Moving Target Analysis 63
6.1. Radar signature analysis . . . 64 6.2. Doppler signature of a pendulum made up of two spheres . . . 66 6.3. Evaluation of the Doppler signature of a moving real target:
comparison with measurement . . . 72
7. Conclusions and Suggestions for Future Development 75
A. Vector Transformations 77
A.1. Rectangular-to-Spherical (and Vice-versa) . . . 77
List of Figures
2.1. Traditional procedures to gather vital signs: a) electrodes, b) cannulas, c) inductance pneumography, d) spirometry . . . 8 2.2. Human body made by MakeHuman software and imported in
CST MWS . . . 13 3.1. Geometric configurations of the problems implemented in CST
MWS to compare the E-field reflected by the SAM phantom head (left) and by the spheres of different radii (right). . . 19 3.2. Comparison of electric field backscattered by the SAM head and
three spheres, observed at a distance of 1m along the z-axis . . 20 3.3. Comparison between normalised re-radiated waves . . . 21 3.4. E field distribution inside a leg illuminated at 1 GHz by a plane
wave with |E|= 1V /m, considering only the leg (red line) and the whole human body model (black line) . . . 23 3.5. Human body reproduced by primitive shapes implemented in
CST MWS) . . . 24 3.6. E-fields backscattered by individual elements of the human body
and collected at the distance of 1.5m from the antenna (position No 2) . . . 25 3.7. Comparison between the total field scattered by the whole body
phantom and the sum of the fields scattered by each body part evaluated in the position No 2 . . . 25 3.8. Volunteer with her arms in several positions during the
measure-ment test and the phantom arms configuration used to analyse the same positions with CST MWS . . . 28 3.9. Performed procedure to acquire the measured and simulated
spectrogram . . . 29 3.10. Measured spectrogram relative to the movements of the
volun-teer. The red/orange areas highlight the sideward arms move-ment of the subject; the green/white areas represent involuntary movements . . . 30 3.11. Simulated spectrogram relative to the different sideward arms
positions of the human body model proposed . . . 31 xvii
List of Figures
4.1. Human model with 13 body parts analytically expressed
and implemented in MATLAB . . . 34 4.2. Fixed and mobile reference systems . . . 35 4.3. Geometry representation of the interaction between the body
surface and the antenna . . . 37 4.4. Rectangular aperture on an infinite electric ground plane (the
choice of a not traditional reference system is due to graphics constrains faced in Matlab software) . . . 39 4.5. Body scattering . . . 40 4.6. Pyramidal horn antenna . . . 45 4.7. GE and GH as a function of A and B respectively (SOURCE:
Adopted from data by E. H. Braun, "Some Data for the Design
of Electromagnetic Horns", IRE Trans. Propagat., Vol. AP-4,
No. 1 January 1956, IEEE) . . . 46 4.8. Gain at X-band (8.2-12.4GHz) for a lossless pyramidal horn
an-tenna . . . 47 5.1. Radar Cross-Section Diagram in semi-log scale of a metallic
sphere (SOURCE: Adopted from data by B. R. Mahafza, "Radar systems analysis and design using MATLAB," CRC press, 2002.) 50 5.2. Normalised RCS for a perfectly conducting sphere using semi-log
scale, evaluated with the proposed model . . . 51 5.3. S11 measurement set-up used for the characterisation of a PEC
sphere placed at 157cm away from the horn antenna . . . 52 5.4. Comparison between the measured and simulated S11 of a PEC
sphere distant 157cm away from the antenna: modulus (top), phase (bottom) . . . 53 5.5. Time domain: comparison between the measured and simulated
S11 of a PEC sphere distant 157cm away from the antenna . . 54
5.6. S11 measure of a PEC sphere placed at 250cm away from the
horn antenna . . . 54 5.7. Comparison between the measured and simulated S11 of a PEC
sphere distant 250cm away from the antenna . . . 55 5.8. Time domain: comparison between the measured and simulated
S11 of a PEC sphere distant 250cm away from the antenna . . 55
5.9. S11 measurement set-up of a PEC cylinder . . . 56
5.10. Comparison between the measured and simulated S11 of a PEC
cylinder distant 200cm away from the antenna . . . 57 5.11. S11 measurement set-up of a mannequin filled by a lossy
List of Figures 5.12. Mannequin reproduced by sphere, cylinder and parallelepiped,
implemented in MATLAB . . . 59
5.13. Frequency-temperature dependence of the complex relative per-mittivity . . . 59
5.14. Comparison between the measured and simulated S11of a man-nequin distant 230cm away from the antenna . . . 60
5.15. S11 measurement set-up of a real target . . . 61
5.16. Comparison between measured and simulated S11 measure of a real target . . . 62
6.1. Radar imaging of a moving target using FFT . . . 65
6.2. Radar imaging of a moving target using STFT . . . 66
6.3. Oscillation of pendulum made up of two sphere . . . 67
6.4. Range profile of the signal reflected by the pendulum . . . 67
6.5. Doppler frequencies theoretically calculated . . . 68
6.6. Range-Doppler distribution of the signal reflected by the pendulum 68 6.7. Time-Doppler distribution of the signal reflected by the pendu-lum for the range 3-4m . . . 69
6.8. Swinging spheres forward and backward respect the antenna’s direction . . . 70
6.9. Doppler frequencies theoretically calculated of two swinging spheres 71 6.10. Range-Doppler distribution of the signal reflected by the two swinging spheres . . . 71
6.11. Time-Doppler distribution of the signal reflected by the two swinging spheres . . . 72
6.12. Measured spectrogram relative to the swings of a human’s arm 73 6.13. Simulated spectrogram relative to the swings of a human’s arm 74 A.1. Spherical coordinate system . . . 77
B.1. Discretised metal plate 2D . . . 81
B.2. Reflected E field in different observation points . . . 82
List of Tables
2.1. Summary table of advantages and disadvantages of the EM
meth-ods . . . 12
2.2. Summary table of advantages and disadvantages of the PO . . 15
3.1. E-field reflected by SAM and the spheres: Simulation setup . . 19
3.2. Maximum field intensity and cross-correlation between the E-field waveforms diffracted by the spheres and the Sam model’s head . . . 21
3.3. E-field reflected by total body and its parts: Simulation setup . 24 3.4. Analysis of the numerical accuracy in relation to the cells per wavelength adopted . . . 26
3.5. Analysis of human motions: Measure and Simulation setup . . 27
4.1. Human model parameters . . . 35
4.2. Pyramidal horn antenna’s dimensions . . . 45
4.3. Pyramidal horn antenna’s directivity . . . 47
B.1. Minimum requested dimensions cell . . . 82
Chapter 1.
Summary of Ph.D. Research
Activity
The aim of this chapter is to present the main activities that I performed during my Ph.D. in the triennium 2014-2016, in collaboration with the research group of Antenna Laboratory of Department of Information Engineering at UNIVPM. The research was focused on three main topics:
• Design and realisation of EM devices for safe mobility of visually impaired people;
• Design and realisation of contact-less sensors for remote monitoring of physiological activities of a subject in indoor environment;
• Development of analytical model to characterise the fields reflected by a human body for Ambient Assisting Living (AAL) applications.
Those activities are summarised in the following sections.
1.1. Electromagnetic aids for visually impaired
people
The traditional aids for the mobility of blind people are the long (white) cane and the guide dog. For some years, different kinds of electronic aids have ap-peared to prevent blind people from walking into obstacles (Electronic Travel
Aids (ETA)) or to help them to find their way (Electronic Orientation Aids (EOA)). Nevertheless, in literature, there is a lack of studies, which consider
electromagnetic (EM ) radiation as the physical quantity able to deliver in-formation on an obstacle presence for visually impaired people. Therefore, in these years, the main aim was to investigate the capability of novel EM systems designed for visually impaired and blind user mobility. An obstacle detection
Chapter 1. Summary of Ph.D. Research Activity
system was designed (EM Cane), to aid visually impaired users to walk safely and independently. The proposed approach provides additional information on obstacles (height from the ground, distance and position of the obstacle) in comparison with the available assistive technologies currently used. The EM cane was tested by a blind person and it is shown in the online video http://youtu.be/4k9wz72XlNE.
Other studies investigated the possibility to improve the performances of blind athletes, in particular marathon runners, using electromagnetic systems. These EM devices (Track for virtual line and Active athletics track) are ad-dressed to make the blind athlete free of running independently from his guide, at least during training sessions. The first system creates a invisible hallway by means of two transmitting antennas located on a vehicle running in front of the athlete. Whenever the runner gets close to one of the two borderlines, a wearable receiver, located on the user’s chest, indicates him to move toward the central position, through two vibrating transducers positioned on his left and right arm (http://youtu.be/GIyQDu0nOww). The second system gener-ates two magnetic fields with the use of two wires placed on the ground of an athletics track. The current flowing in each wire generates a magnetic field, whose flux variation depends on relative position, between the athlete and the wire, and it is sensed by a receiver worn by the runner. The generation of the warning signals is the same adopted in the previous EM device.
My contributions concerned about:
• the analysis of the performed measurements for the characterization of the radiation pattern of the designed and simulated antennas;
• the setting up of tests about the realised prototypes with the blind user.
The detailed descriptions of the presented systems are available in the follow publications:
• Journal
– M. Pieralisi, V. Petrini, V. Di Mattia, G. Manfredi, A. De Leo, L.
Scalise, P. Russo, G. Cerri, Design and Realisation of an
Electromag-netic Guiding System for Blind Running Athletes, Sensors (Basel),
2015 Jul 8;15(7):16466-83
• Conference Proceeding
– V. Di Mattia, A. Caddemi, E. Cardillo, G. Manfredi, A. De Leo,
1.1. Electromagnetic aids for visually impaired people
Radar System for Autonomous Walking of Blind People, 2016 IEEE
2nd International Forum on Research and Technologies for Society and Industry Leveraging a better tomorrow (RTSI), 6-9 Sept. 2016, Bologna (Italy).
– V. Di Mattia, V. Petrini, M. Pieralisi, G. Manfredi, A. De Leo, P.
Russo, L. Scalise And G. Cerri, A K-Band miniaturised antenna
for safe mobility of visually impaired people, Microwave Symposium
(MMS), 2015 IEEE 15th Mediterranean, Lecce, 2015, pp. 1-4.
– G. Cerri, A. De Leo, V. Di Mattia, G. Manfredi, V. Mariani
Primi-ani, V. Petrini, M. Pieralisi, P. Russo, L. Scalise, The electromagnetic
technology for safe mobility of visually impaired people, Control and
Automation (MED), 2014 22nd Mediterranean Conference of , 16-19 June 2014, pp.164-168.
• Book Chapter
– M. Pieralisi, V. Di Mattia, V. Petrini, G. Manfredi, A. De Leo,
P. Russo, L. Scalise And G. Cerri, The use of the electromagnetic
technology in support to visually impaired runners athletes, Chapter
Book in "Visually Impaired: Assistive Technologies, Challenges And Coping Strategies", 2016 Nova Science Publishers, Inc.
– G. Cerri, A. De Leo, V. Di Mattia, G. Manfredi, V. Mariani
Prim-iani, V. Petrini, M. Pieralisi, P. Russo, L. Scalise, Electromagnetic
Technologies as Travel Aids for Visually Impaired Subjects, in B.
Andò, F. Siciliano, V. Marletta, A. Monteriù, Ambient Assisted Living (Springer 2015), pp. 159-167
• Patent
– G. Cerri, A. De Leo, V. Di Mattia, G. Manfredi, V. Petrini, M.
Pieralisi, P. Russo, L. Scalise, 2016, Sistema elettromagnetico per
attività fisica autonoma di atleti non vedenti o ipovedenti.
IT 102016000009513UB2016A000181, filled January 29, 2016.
Chapter 1. Summary of Ph.D. Research Activity
1.2. EM contact-less sensors for AAL applications
AAL is a research field of great interest and growing attention. In fact, in
the last decade there was an increasing demand for unobtrusive/contact-less solutions for monitoring the indoor living environment and also able to satisfy the request of the aging population. Real-time monitoring of physiological signals such as breathing rate, heart rate, temperature and blood pressure are considered emergency indicators and important predictive parameters for many pathologies. In general, the traditional procedures to gather vital signs from human body require the use of one or more electrodes, cables and chest belts to be applied to the patient, causing him discomfort and stress. On the other hand, a remote monitoring ensures the subject’s comfort and, most importantly, it reduces the intervention of medical personnel and of subject cooperation. A suitable solution for the non-contact monitoring is represented by the use of EM sensing. In this context, a novel EM device was realised, based on the transmission of a frequency sweep signal, from 1 to 6GHz, which allows to detect the respiration rate, analysing the variation of phase of the reflection coefficient S11, due to the movements of thorax. The proposed EM system is
also able to record long-time sleep breathing activity, highlighting the presence of apnea events. In the end, it is investigating on the possibility to detect the heart rate with the same approach, analysing the relation between the heart movement and the EM signal reflected by the human chest.
My contribution concerned about:
• the investigation of the allowable distances between the target and the antenna for the proper detection of the breathing and heart rate;
• data processing;
• the script development in MATLAB for the detection of the target posi-tion.
The following publications describe in details what has just been presented above:
• Conference Proceeding
– V. Petrini, V. Di Mattia, G. Manfredi, A. De Leo, P. Russo, L.
Scalise, G. Cerri, An Electromagnetic Contact-less System for
Ap-nea Monitoring, 2016 IEEE Smart Cities, 12-15 Sept. 2016, Trento
1.2. EM contact-less sensors for AAL applications
– L. Scalise, V. Petrini, V. Di Mattia, P. Russo, A. De Leo, G.
Man-fredi and G. Cerri, Multiparameter Electromagnetic Sensor for AAL
Indoor Measurement of the Respiration Rate and Position of a Sub-ject, in Instrumentation and Measurement Technology Conference
(I2MTC), 2015 IEEE International, 11-14 May 2015, pp.664-669.
– P. Russo, V. Petrini, L. Scalise, V. Di Mattia, A. De Leo, G.
Man-fredi and G. Cerri, Remote monitoring of breathing activity and
po-sition of a subject in indoor environment: the HDOMO 2.0 project,
Proceedings del 6◦Forum Italiano dell’Ambient Assisted Living (forI-TAAL2015), 19-22 May 2015, Lecco, pp 136-145.
– V. Petrini, V. Di Mattia, A. De Leo, P. Russo, V. Mariani
Primi-ani, G. Manfredi, G. Cerri, L. Scalise, Ambient assisted living
elec-tromagnetic sensor for continuous breathing monitoring applied to movement analysis: a preliminary study, Mechatronic and
Embed-ded Systems and Applications (MESA), 2014 IEEE/ASME 10th In-ternational Conference on, 10-12 Sept. 2014, pp.1,5.
– V. Di Mattia, V. Petrini, E. Pallotta, A. De Leo, M. Pieralisi, G.
Manfredi, P. Russo, V. Mariani Primiani, G. Cerri, L. Scalise,
De-sign and realisation of a wideband antenna for non-contact respi-ration monitoring in AAL application, Mechatronic and Embedded
Systems and Applications (MESA), 2014 IEEE/ASME 10th Inter-national Conference on, 10-12 Sept. 2014, pp.1,4.
• Book Chapter
– V. Di Mattia, G. Manfredi, M. Baldini, V. Petrini, L. Scalise, P.
Russo, A. De Leo, G. Cerri, Theoretical Model for Remote Heartbeat
Detection Using Radio-frequency Waves, Proceedings del 7◦ Forum Italiano dell’Ambient Assisted Living (forITAAL2016), 22-23 June 2016, Pisa (Italy), in press on Lecture Notes in Electrical Engineer-ing, Springer.
– V. Petrini, V. Di Mattia, A. De Leo, P. Russo, V. Mariani Primiani,
G. Manfredi, G. Cerri, L. Scalise, Domestic monitoring of respiration
and movement by an electromagnetic sensor, in Andò B., Siciliano
F., Marletta V., Monteriù A., Ambient Assisted Living (Springer 2015), pp. 133-142.
Chapter 1. Summary of Ph.D. Research Activity
1.3. Analytical model to characterise the diffracted
field by a human body
The proper design and development of the EM systems needs a good under-standing of the signal propagation in the environment around a human body and of the interaction between the body and the the field radiated by antenna, also considering its characteristics. Usually these preliminary studies are car-ried out through several simulations, facing with the complexity and massive memory involved in the detailed modelling of the human body. So the last three years were dedicated to the development of an analytical model, able to characterise the reflected fields by a monitored target for AAL applications. The features were to be the accuracy and in the meantime the reduction of the computational burden to avoid the problems suffered by the numerical tools. This work will be the topic of this thesis and deepened in the following chap-ters. The presentation of the assumptions on which is based the model, and its applications are described in the following papers:
• Journal
– G. Manfredi, V. Petrini, V. Di Mattia, A. De Leo, P. Russo, L.
Scalise And G. Cerri, A 3-D Human Body Model for the Movement
Detection in Ambient Assisted Living Applications, IEEE
Transac-tions on Magnetics, 2016, under review.
– G. Manfredi, V. Petrini, V. Di Mattia, A. De Leo, P. Russo, L.
Scalise And G. Cerri, Development of an analytical electromagnetic
model based on PO approach, to characterise the field diffracted by a human body, IEEE Antennas and Propagation Magazine, 2016, under review.
• Conference Proceeding
– G. Manfredi, V. Petrini, V. Di Mattia, M. Pieralisi, A. De Leo,
P. Russo, L. Scalise And G. Cerri, A 3-D body model for physical
activity monitoring by microwave radiation, Microwave Symposium
Chapter 2.
Introduction
In almost every country, the proportion of people aged over 60 is growing faster than any other age group. Although population aging is the results of a long period of good health and a sustained sense of well-being, it could be associated with more illness and disability [1]. Most of the existing health systems are at limit of their resources and do not possess the capacity or framework to face the increasing needs of an aging population [2]. This highlights the impor-tance of monitoring individuals in their homes and implementing preventive strategies in order to predict many diseases. Respiratory rhythm (RR), heart rate, blood pressure and body temperature represent the full set of vital signs whose daily monitoring may be tools for the prevention and early diagnosis of adult diseases. As an instance, a sudden RR change is one of the strongest pre-dictors of mortality [3, 4]. Many studies have shown that an abnormal RR can predict it up to 72 hours prior to the arrest [5]. Moreover, RR as well as heart rate monitoring allow the diagnosis of many cardiovascular diseases [6], such as hypertension, atherosclerosis, stroke, heart failure [7], cardiac arrhythmias, and sudden death [8], or of important breathing disorders such as bronchitis, asthma and sleep apnoea.
Despite these evidences, two studies found out that in general the level of documentation of vital signs in many hospitals is extremely poor [9, 10] and in particular the RR is often not recorded, even when the patient’s underlying condition constitutes a primary respiratory problem. As a matter of fact, RR as well as sleep apnoea monitoring are often neglected mainly due to shortcom-ings of the measurement techniques [11], which usually cause discomfort and stress (see Figure (2.1)). Some examples are: spirometry, nasal thermocouples, respiratory belt transducers, inductance pneumography, pneumatic respiration transducers, whole-body plethysmography [12], and others [13–17].
Chapter 2. Introduction
Figure 2.1.: Traditional procedures to gather vital signs: a) electrodes, b) can-nulas, c) inductance pneumography, d) spirometry
1 All these methods may bring discomfort and inconvenience to the subject
and medical personnel because they don’t include a system that enables the constant measuring of the main vital signs, they don’t take measurements in real time in a comfortable manner, or are expensive and not affordable for local hospitals [18]. For example the apnoea monitor, that uses impedance pneumography [19], is attached to the patient using appropriate sensors for the measurement techniques, with evident issues in terms of comfort and repeated failures due to artifact movements: mattress motion sensors, pneumatic ab-dominal sensors, carbon dioxide (CO2) sensors, cannula, etc.
These issues have achieved a growing demand for unobtrusive/contact-less
1Figure 2.1/a) is taken from the website SIAsT - Servizio Infermieristico
Assisten-ziale Territoriale/Polisonnografia - http://www.siast.it/servizi-e-prestazioni/ esami-strumentali/;
Figure 2.1/b) is taken from the website 1000 livesplus - Improving care through reducing use of cannulas and catheters - http://www.1000livesplus.wales.nhs.uk/stop-psc Figure 2.1/c) is taken from the website When a polygraph test is judged inconclusive-TCS open seesame-solved - http://piyadasa15.blogspot.it/2012_08_01_archive.html Figure 2.1/d) is taken from the website NHS - Spirometry - http://www.nhs.uk/ Conditions/spirometry/Pages/Introduction.aspx
monitoring solutions of vital signs in order to improve patients’ quality of life, reducing hospital stays and, consequently, medical costs. Moreover, in the context of AAL, the monitoring with contact-less and remote techniques of pa-tients, who live at their homes and therefore out of specialised environments, not only increase subject’s comfort and avoid privacy issues but also reduce the level of collaboration required from the subjects, which represents a key point when the targets are senior people. Recently, some non-contact solutions have been proposed in literature, for example based on imaging sensors, such as normal webcams [20], infrared thermography [21], or on EM systems. The use of EM sensing allows to monitor the respiration activity of a target with non-contact measurements at significant distances (a few meters). This aspect may represent a clear advantage because an EM system may be easily installed inside hospital rooms or even at home, without the need of a direct view of the target, nor the intervention of medical personnel or subject cooperation. Moreover, the EM monitoring can be applied to dressed people or patients in bed under blankets, without the discomfort of contact sensors nor privacy issues typical of optical systems. The EM systems proposed in literature are mainly based on the use of Continuous Wave (CW) microwave reflectometric radar [22], Ultra Wide Band (UWB) [23,24] techniques or intermediate solution between CW and UWB approaches, joining the advantages of both [25–27]:
• They are simple to realise and don’t interfere with other existing systems (features of CW technology).
• They are characterised by low transmitting power to the benefit of lower energy consumption and by high speed data transfer over very short dis-tances at low power (features of UWB technology).
In the meanwhile there is an increasing development of completely unobtru-sive sensors, woven into wearable objects, where the information, collected into smart garments, can be transmitted over some distance and further analysed. These technologies enable the people to carry their personal body area network making patients wireless within the hospital, especially, in intensive care units and operating theatres. This not only enhances patient comfort, but it also makes the work of doctors and nurses a lot more efficient and easy. Hence Wireless body area network (WBAN) [28–30] represents a new enabling sys-tem that has promising potential for health monitoring applications. A WBAN consists of several wearable sensors placed in close proximity to a human body, using the body as a conduct for data transmission. It has the potential to continuously and remotely monitor and log a patient’s vital physiological pa-rameters, without significantly obstructing the patient’s normal daily activities. The collected physiological parameters are transmitted wireless to a receiver to which medical professionals can easily access, so that they can perform neces-9
Chapter 2. Introduction sary actions [30].
The proper design of a contact-less sensors as well as the development of an accurate WBAN require the studies of the interaction mechanism between the EM waves and the body. The propagation mechanism of the wireless radio waves on/inside the body [31], the on-body channel characterisation [32] or the analysis of scattering parameters near to a monitored subject [33, 34] are usually studied by means of measurements or several simulations. The under-standing of the signal propagation around the body is essential but not devoid of problems: the measurements are time consuming, as well as the numerical tools, that required in addition a huge computational burden.
In the Antenna Laboratory of the Department of Information Engineering at UNIVPM, the main activities focus on realisation of EM systems, addressed to the remote monitoring of physiological and physical activities of a subject for AAL applications, whose proper design is preceded by several tests and simulations. The following section will be dedicated on the description of the numerical tool CST MICROWAVE STUDIO (CST MWS) adopted by our re-search group, highlighting advantages and disadvantages of the used domain solvers and the main problems occuring to carry out the analysis mentioned above.
2.1. EM methods used in CST MICROWAVE STUDIO
2.1. EM methods used in CST MICROWAVE
STUDIO
CST MWS is an EM commercial tool based on EM methods that provide solu-tions to the Maxwell’s equasolu-tions in both time (Finite Difference Time Domain
(FDTD)) and frequency (Method of Moments (MoM)) domains thanks to the
different solvers implemented on it [35].
FDTD: Finite Difference Time Domain
The FDTD method is a direct solution to Maxwell’s time-dependent curl equa-tions and solves the problem in time-domain. It allows to analyse the effects of reflection and radiation and also to model the wave propagation in complex media such as anisotropic, lossy, time-varying and nonlinear media. FDTD method is one the most powerful methods in solving problems involving EM wave interactions [36].
Advantages: FDTD method is one of the most frequently used methods,
thanks to its versatility and the ability to handle complex structures. In addition, the main reason for using the FDTD approach is the excellent scaling performance of the method as the problem size grows [37].
Disadvantages: FDTD is a computationally intensive method and for high
accuracy requires too computer memory resources and considerable cal-culation time.
MoM: Method of Moments
The MoM [38] is a full wave solution of Maxwell’s integral equations in the frequency domain and it is classified as a low frequency method used to solve volume integral equations and surface scattering problems in the frequency do-main. Because the electromagnetic sources are the quantities of interest, the
MoM is very useful in solving radiation and scattering problems.
Advantages: MoM is significantly more efficient in terms of computational
resources for problems with a small surface/volume ratio. Moreover, fur-ther advantage of the MoM is that it is a source method meaning that only the structure in question is discretized (not the whole free space) and consequently, the propagation distance does not degrade the accuracy of the results.
Disadvantages: Full-wave techniques such as MoM generally suffer from
poor scalability. This limits the electrical size of the problems that can 11
Chapter 2. Introduction
be solved on typical computers. Conceptually, it works by constructing a mesh over the modelled surface, nevertheless for many problems, MoM is significantly less efficient than volume-discretization methods (Finite
Element Method, Finite Difference Method). Additionally, the boundary
element formulations typically give rise to fully populated matrices, with the consequent growth of the storage requirements and computational time, proportional to the square of the problem size (N2).
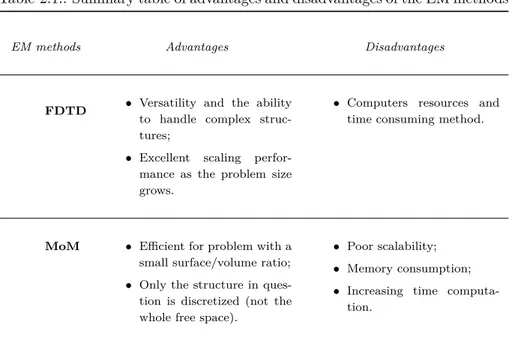
Table 2.1.: Summary table of advantages and disadvantages of the EM methods
EM methods Advantages Disadvantages
FDTD • Versatility and the ability
to handle complex struc-tures;
• Excellent scaling perfor-mance as the problem size grows.
• Computers resources and time consuming method.
MoM • Efficient for problem with a
small surface/volume ratio; • Only the structure in ques-tion is discretized (not the whole free space).
• Poor scalability; • Memory consumption; • Increasing time
computa-tion.
As it has been highlighted in the section (2), the proper design of the EM sensors, addressed to the remote monitoring of the vital signs of a subject, must be preceded by the study of the propagation mechanism of the electromagnetic waves and of their interaction with the body. It follows that the environment to be analysed is mainly made up by:
• human body whose dimensions are on average 170cm X 60cm X 30cm [39]; • antenna whose dimensions and typology depend by the choosen frequen-cies (from 2GHz to 10GHz) and the application to which is addressed; • space whose dimensions strongly depend by the adopted distances
be-tween the antenna and the observed subject (from 4m to 10m).
Due to the poor scalability of MoM, it proves to be less efficient than FDTD which is consequently used by our comunity for these kind of analyses. The
2.1. EM methods used in CST MICROWAVE STUDIO
FDTD method allows to handle complex structures but requires huge resources
and computational time. An example is reported below.
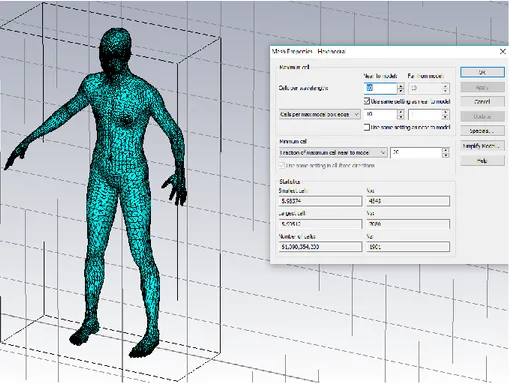
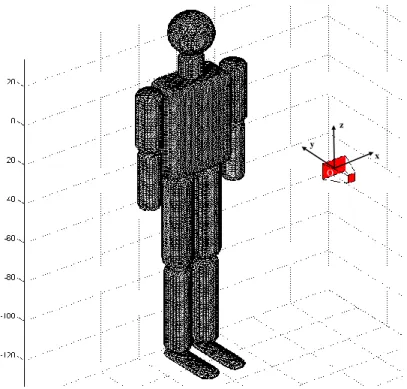
Figure 2.2.: Human body made by MakeHuman software and imported in CST MWS
A human body was made by means of MakeHuman software [40], whose dimensions 170cm X 60cm X 30cm were selected in accordance with those of a realistic body [39]. The work frequencies 2-6GHz were choosen because they are the most proper frequencies for a real-time monitoring of breathing rate or body activities as pointed out by the recent works [25, 26]. The body was imported in CST MWS tool and discretised by hexahedral meshes, picking 10 cells for wavelength. The accuracy of the simulation strongly depends on the selected numbers of cells for wavelength; 10 is the minimum numbers of cells which must be selected to consider the computational error negligible (See
Appendix (B)). It follows that the total number of cells is more than 61
bil-lion, as shown in Fig. (2.2), whose simulation requires a computational burden that clearly cannot be affordable by normal calculators. Usually the parallel computing of more than two cluster nodes is used to optimize the computing performances [41].
Chapter 2. Introduction
A further problems is represented by the computational time required by the quoted simulations which varies from the 4h if several cluster computers are adopted in parallel, to more than 17h if a single calculator is used, as it will be highlighted in detail in the chapter (3).
In view of the issues occuring in the numerical calculations, the aim of the research was the development of an EM model which allows the study of the interaction between the EM waves and the body, avoiding the problem of the computational burden. In the following section the proposed model and the topics deepened in each chapters will be presented.
2.2. Aim of Ph.D thesis
The purpose of the thesis is to develop an EM model which allows to analyse how some parameters such as work frequencies, distance, number and/or di-mensions of the antennas and kind of movements and didi-mensions of a target, affect the fields scattered by a monitored subject, features useful for the proper design of the EM sensors. For this reason the aim of Ph.D. research was the development of EM model based on Physical optics (PO) approach able to characterise the diffracted field by a human body.
PO: Physical Optics
PO [42] is a method for approximating the high frequency surface currents,
allowing a boundary integration to be performed to obtain the fields. PO is an intermediate method between full wave electromagnetism, which is an exact theory, and geometric optics (GO), which is a ray-based technique that models objects based on optical propagation, reflection and refraction theory [43, 44].
Advantages: PO models the interference and the polarisation effects for
which the ray approximation of geometric optics is not valid.
Disadvantages: PO requires an additional method to compute the
contribu-tion due to the diffraccontribu-tion phenomena such as the PTD (Physical Theory
2.2. Aim of Ph.D thesis
Table 2.2.: Summary table of advantages and disadvantages of the PO
EM methods Advantages Disadvantages
PO • It models the interference
and the polarisation effects.
• It doesn’t take into account the fields diffracted by the edges;
• Run-time grows exponen-tially with multiple reflec-tions.
A EM model based on PO allows to calculate the reflected fields in everwhere only determining the surface equivalent current densities flowing on the surface of the target without the discretisation and the calculation of the total observed space as required by the FDTD method. Consequently, the analytical model ptoves to be efficient, light from the point of the computational burden and sufficiently accurate, avoiding the problems of memory consumption and of huge time computation, typical of most of the EM methods explained in the section (2.1). The work will be deepened in this thesis as follows:
In Chapter (3) several preliminary studies will be discussed for the choice of a suitable human model with a particular regard on the validity of the use of homogeneous canonical shapes to model the body parts. Moreover, a comparison between simulations and measurements of a moving target has been carried out to test the feasibility of the adopted choices.
In Chapter (4) the proposed analytical model will be described together with the definition of the human body model and of the analysed scenario’s geometry. In Chapter (5) several tests regarding static targets, carried out to evaluate the accuracy and the feasibility of the model, will be presented and commented. The Chapter (6) is dedicated to the radar Doppler techniques implemented in the model to analyse and discriminate general activities of a monitored target. The Chapter (7) outlines the conclusions and discusses some other possible applications of my EM model.
Chapter 3.
Preliminary Studies
The proper design of an EM sensor, for several biomedical applications or for remote monitoring of physiological signals, involves the study of the propaga-tion mechanisms of the EM waves on and inside the body, with the consequent need for a human model. The coupling effects of the human body on antennas are usually studied by means of experimental investigations or computer sim-ulations, using general purpose EM simulators and, in order to quantitatively analyse the interaction, the evaluation by use of several phantoms is widely performed. Some of the major challenges to face are the manufacturing of the phantoms and, the complexity and massive memory involved in the detailed modelling of the human body in the numerical tools.
Empirical studies are often made with a Specific Anthropomorphic Man-nequin (SAM). It is a human body phantom [47–49], filled with a homogenous tissue liquid, whose shape, properties and general dimensions are similar to an average human body. Those phantoms are expensive and difficult to use in lab-oratory, due to the filling with a special liquid of precisely controlled dielectric properties [30, 50].
In many contemporary EM CAD packages, heterogeneous models are avail-able [35, 51–54], representing the inner structure of the human body. In ad-dition, the modelling of the phantoms requires a great amount of computer resources as the discretisation of the model has to be accurate to represent details of inner organs. Most of the EM simulators indeed perform an auto-matic meshing on the simulated objects using an arbitrary number of cells per wavelength. If a large number of cells per wavelength are selected, the total number of cells will be very large. On the other hand, if a small number of cells per wavelength are selected, the accuracy of the simulation will be very poor (This issue will be deepened in the section (3.2)). As a consequence, in order to overcome this problem, usually only a small part of the human body is usually simulated, such as head or neck in dosimetry studies or torso or single arm to design a proper WBAN [55, 56].
Chapter 3. Preliminary Studies
Given these issues, several preliminary studies were carried out to choose the suitable human model which represents the best trade-off between accuracy and computational efficiency. These results will be presented and discussed in this chapter with a particular regard on the validity of the use of homogeneous canonical shapes to model the body parts. It will also present the compar-ison between measurements and simulations of a moving target, to test the feasibility of the adopted choices.
3.1. Canonical shapes to represent the human
body parts
The human body has a very complex shape and its representation is a very heavy burden from a computational point of view. However, in many cases a detailed description is not required, such as in the situation where the spec-tral content of the body movements is under investigation. In fact, recent works [25, 26] have pointed out that the most proper frequency range for a real-time monitoring of breathing rate or body activities is 2-6GHz. In this frequency range, the skin depth δ is shorter than 1.5cm1. It follows that, a body representation with an accurate knowledge of internal tissues and organs is computationally expensive and useless for evaluating the scattered field, as only a thin external layer interacts with the EM field.
Another aspect concerns the representation of external details of the body, as nose, mouth, ears, fingers, and so on. The great variability of shape and dimen-sion of these parts of the body from one individual to another makes ineffective a too accurate modelling. Consequently, to evaluate the EM backscattering, head, chest, arms and legs can be modelled with primitive shapes (spheres, cylinders and parallelepipeds). In this way, the approach reduces the compu-tational cost, and at the same time, it allows to generate a structure flexible enough to change posture and position. In order to choose the most suit-able simplified model, a commercial full wave EM solver (CST MICROWAVE STUDIO (CST MWS) [35]) was used. The first human part considered was the head, because it is the most complex part of the body, characterised by many anatomical details. Therefore it seems difficult to represent the head with a simple geometrical shape, and for this reason, the case study is suit-able to stress the model. The EM field reflected by the human head provided by the SAM phantom was compared to the backscattering of several spheres of different radius with the aim to verify if the anatomical details of head, as nose, mouth, and ears, were significant for the evaluation of the diffracted field.
1The dielectric properties of the skin adopted for the calculation of δ are: ϵ
r = 42, σ = 3.6S/m [57]. A definition of the skin depth δ is presented by D. Andreuccetti in "Dielectric properties of human tissues: definitions, parametric model, computing codes." [58]
3.1. Canonical shapes to represent the human body parts
𝟏, 𝟓𝒎
𝟏𝒎 𝟏𝒎
𝟏, 𝟓𝒎
E-field E-field
Figure 3.1.: Geometric configurations of the problems implemented in CST MWS to compare the E-field reflected by the SAM phantom head (left) and by the spheres of different radii (right).
Three spheres were taken into consideration: the first has a radius of 108.9mm, in order to have a volume equivalent to the SAM head model. The second one has the radius of 100mm, which corresponds to the radius of longitudinal section of the SAM head model, and the third one, with the radius equal to 109mm, corresponding to the sagittal section (3.1). It was assumed that the spheres and the SAM model are filled with a homogeneous dielectric with the same properties as skin (relative permittivity ϵr= 42, and conductivity σ = 3.6S/m
[57]). Both were placed at a distance of 1.5m from a horn antenna along z direction (See Fig. (3.1)). The excitation signal is a modulated Gaussian pulse generated by the CST MWS software, whose spectrum is in the range 3-5GHz. The wave travels in free space along the z direction and it is linearly polarised, with the E field parallel to y-axis. Figure (3.2) shows the E field reflected by the three spheres and the SAM phantom head, observed at a distance of 1m along the z-axis.
Table 3.1.: E-field reflected by SAM and the spheres: Simulation setup
Setting
antenna horn
frequencies 3-5GHz
distance antenna-target 1.5m
polarization v-pole
field intensity 1V/m (default)
calculation time ≈ 8h
Chapter 3. Preliminary Studies
Figure 3.2.: Comparison of electric field backscattered by the SAM head and three spheres, observed at a distance of 1m along the z-axis
For a better comparison among field time histories, the cross-correlation was evaluated [59]: (f ⋆ g)[n]def= ∞ ∑ m=−∞ f∗[m]g[m + n]. (3.1)
being f and g the discrete functions, representing respectively the E fields re-flected by SAM and the three spheres, n the displacement also known as lag, and f∗ the complex coniugate of f. The function was implemented in MAT-LAB [60] by the function xcorr2, through which was calculated the similiarity
of the observed reflected waves. Table (3.2) reports the maximum amplitude of the backscattered electric field and the result of the cross-correlation, calcu-lated between the diffracted field of each sphere and of the SAM model’s head.
2r = xcorr(x, y) returns the cross-correlation of two discrete-time sequences, x and y. Cross-correlation measures the similarity between x and shifted (lagged) copies of y as a function of the lag. If x and y have different lengths, the function appends zeros at the end of the shorter vector so it has the same length, N, as the other (See the website https://it.mathworks.com/help/signal/ref/xcorr.html).
3.1. Canonical shapes to represent the human body parts
Table 3.2.: Maximum field intensity and cross-correlation between the E-field waveforms diffracted by the spheres and the Sam model’s head
Target E-field [V/m] cross-correlation
(max intensity in absolute value)
Sam 0.0568 1
Sphere - Radius 100mm 0.0503 0.89
Sphere - Radius 108.9mm 0.0560 0.99
Sphere - Radius 109mm 0.0562 0.96
It can be appreciated a good agreement between the sphere with 108.9mm radius and the SAM head, both in terms of correlation and in terms of max-imum strength. Therefore, the sphere with equivalent volume of the SAM’s head provides a response that best fits the realistic situation. Moreover, in order to observe how the distortion of wave depends on the scattering surface, the reflected waves were normalised respect the own maximum peak value and then correlated, applying the equation (3.1), with final result around 0.98, as it depicted in Fig. (3.3).
Figure 3.3.: Comparison between normalised re-radiated waves
Chapter 3. Preliminary Studies
The same results can be obtained also by replacing the other anatomic parts of the body (neck, torso, arms and legs) with elementary geometric shapes such as cylinders and parallelepipeds. It follows that in the range of a few GHz, the representation of anatomic details can be replaced with elementary shapes, without any significant distortion of the backscattered waveform and with a negligible error for what concerns its peak value.
3.2. Analysis of the E-field backscattered by the whole body
3.2. Analysis of the E-field backscattered by the
whole body
The results achieved in section (3.1) were extended to the whole body, and, in particular, it was analysed the possibility to retrieve the field backscattered by the whole body as superposition of the field reflected by separated body parts. Referring to the model presented in the works [50, 56], the human body was modelled as a collection of spheres, cylinders and parallelepipeds to reproduce head, chest, arms and legs, whose dimensions are in accordance with those of a realistic body [39]. The height of the human model is 1.68m and each part is characterised by dielectric properties of the skin with ϵr= 42 and σ = 3.6S/m
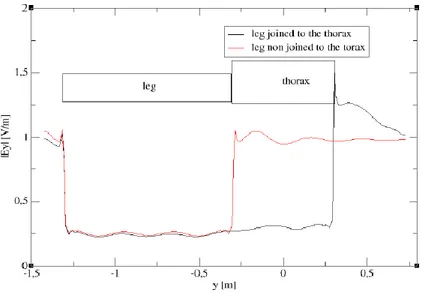
[57]. Furthermore all the parts of the body were considered disjointed from each other in order to make the structure more flexible and able to be configured in different positions. This choice may affect the equivalent current density distribution but, it was validated by A. De Leo et al. in the work [61], by the comparison between full wave numerical simulations where the elements of the body were reproduced joined and disjoined from each other. The result is depicted in Fig.3 (3.4)
Figure 3.4.: E field distribution inside a leg illuminated at 1 GHz by a plane wave with |E|= 1V /m, considering only the leg (red line) and the whole human body model (black line)
3
SOURCE: Picture taken from data by A. De Leo et al., "Breath detection of humans buried in a homogeneous lossy medium: a simplified analytical model", 2012 International Symposium on Electromagnetic Compatibility (EMC EUROPE), IEEE
Chapter 3. Preliminary Studies
Figure (3.4) shown an equivalent distribution of the E-field, observed inside an element either joint or not joint with other body parts, at frequency 1GHz. This because it takes advantage of the relatively high frequencies of the pulse spectrum, corresponding to wavelengths shorter than body parts dimensions, so that the mutual coupling among the body parts can be considered negligible. Both total body and each of its parts, depicted in Fig. (3.5) were individu-ally simulated to demonstrate that the total field scattered by a human body can be approximated as the sum of the fields reflected by single body parts. The objects were illuminated by a plane wave at frequencies ranging from 3 to 5GHz, corresponding to a modulated Gaussian pulse in time domain. The electromagnetic wave, linearly polarised, travels in free space along z direction, with E field directed along y-axis and a default intensity value of 1V/m.
Figure 3.5.: Human body reproduced by primitive shapes implemented in CST MWS)
Table 3.3.: E-field reflected by total body and its parts: Simulation setup
Setting
antenna horn
frequencies 3-5GHz
distance antenna-target 2m
polarization v-pole
field intensity 1V/m (default)
3.2. Analysis of the E-field backscattered by the whole body
Figure 3.6.: E-fields backscattered by individual elements of the human body and collected at the distance of 1.5m from the antenna (position No 2)
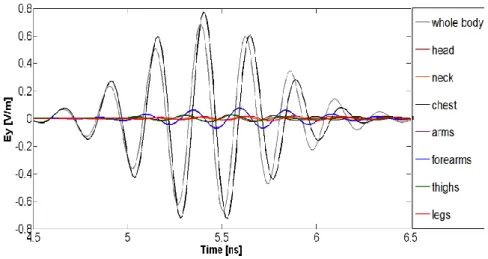
Figure (3.6) reports the E fields scattered by each body parts and collected at the distance of 1.5m away from the antenna in the position No 2. As expected, at this position, the field scattered by the chest is greater than any other E fields, because of its dimension and flat surface.
Figure 3.7.: Comparison between the total field scattered by the whole body phantom and the sum of the fields scattered by each body part evaluated in the position No 2
Chapter 3. Preliminary Studies
Figure (3.7) shows the comparison between the sum of the fields scattered by the total body and by its individual parts, evaluated in the position No 2. The cross-correlation between these two curves is 0.85. This relatively low value (with respect to those evaluated in section (3.1)) is mainly due to the different peak amplitudes whereas the time waveforms are quite similar. This means that:
• the spectral content of the two curves, that is the quantity to be analysed to get information about possible body movements, is the same;
• the amplitude differences are due to numerical accuracy, and do not affect significantly the assumption of negligible mutual coupling among body parts.
To demonstrate these assessments, a simple numerical test was carried out. As spatial discretisation is a critical parameter in every numerical model, further simulations were performed to evaluate its influence on the results. Table (3.4) lists the different resolutions adopted in terms of wavelength, the average num-ber of cells that discretise the body parts for each selected resolution and the calculation time required to simulate each elements. The last column of the table shows the cross-correlation between the sums of the E-fields scattered by the individual parts and by the whole model at different resolutions.
Table 3.4.: Analysis of the numerical accuracy in relation to the cells per wave-length adopted
Resolution Average number of cells
Calculation time Cross-Correlation (cells per wavelength) for each body element
λ /7.5 5800000 4h 23min 0.83
λ /10 133490000 10h 0.85
λ /12 227280000 17h 0.89
Table (3.4) highlights that the correlation monotonically increases up when increasing simulation resolution. Therefore, a higher resolution in terms of wavelength leads to better correlation coefficients. As the only difference be-tween the two curves is in term of peak amplitude, no significant distortion can be appreciated in terms of waveform and consequently of spectral content. This is a key result because, to detect the movements of a target located in front of the EM system, it needs to analyse the spectral content of the backscattered pulse.
3.3. Analysis of human motions: comparison between simulated and measured result
3.3. Analysis of human motions: comparison
between simulated and measured result
The feasibility of evaluating the whole body scattering by dividing the initial problem in a reduced number of much simpler sub-problems, was further vali-dated considering a moving target. In particular, the harmonic content of the signal backscattered by a human subject, performing a sideward arms move-ment, was simulated using the approach proposed in the previous section (3.2) and measured in the Antenna laboratory of the department of Information En-gineering in Ancona. The laboratory set up consisted of a portable Vectorial Network Analyser (VNA), a laptop and a double ridge horn antenna with an aperture of 14cm X 24cm. The signal radiated had a frequency bandwidth 3-5GHz and a power level of 0dBm. The subject was located at a distance of 2.5m in front of the antenna, placed 1.30m above the ground. The backscattered field was acquired in real time by the VNA at the frequency of 3 samples/s. To the purpose of this comparison, at first the volunteer has been asked
• to stay still (time interval No 1, duration ≈ 12s);
• to raise up her arms sideways and return to the rest position (time interval No 2, duration ≈ 12s);
• to stay still again until the end of the measurement session (time interval No 3, duration ≈ 15s).
Table 3.5.: Analysis of human motions: Measure and Simulation setup
Setting
antenna double-ridged horn
frequencies 3-5GHz
distance antenna-target 2.5m
polarization v-pole
power 0dBm
field intensity 1V/m (default)
frequency sampling 3samples/s
measure time 40s
simulation time ≈ 25h
Obviously, despite the real human movement is continuous, it was necessarily simulated as a sequence of frameworks corresponding to a different sidewards arms position (0◦, 30◦, 60◦, 90◦, 120◦, 150◦ and 180◦). Pictures of the exper-iment were used to synchronise the virtual movements of the arms with the 27
Chapter 3. Preliminary Studies
measurement scenario, as shown in Fig. (3.8)
𝟎°
𝟔𝟎°
𝟗𝟎°
Figure 3.8.: Volunteer with her arms in several positions during the measure-ment test and the phantom arms configuration used to analyse the same positions with CST MWS
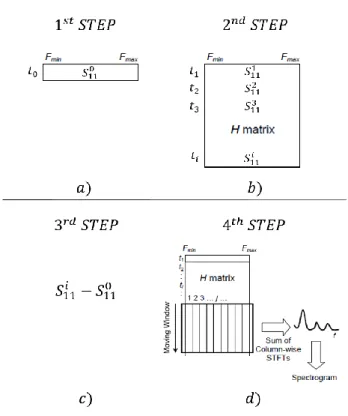
The procedure for the measured and simulated data processing is shown in Fig. (3.9) and explained below:
• 1st STEP: Measure and simulation of the S0
11 relative the volunteer in
still position (See Fig. (3.9) a) );
• 2nd STEP: Measure and simulation of the Si
11 relative the volunteer
performing the sidewards arms movements (See Fig. (3.9) b) );
• 3rd STEP: Subtraction of the contribution of the static objects to the
measured backscattered signal, in order to highlight contribution of mov-ing parts (See Fig. (3.9) c) );
3.3. Analysis of human motions: comparison between simulated and measured result • 4th STEP: Short-Time Fourier Transform (STFT) analysis [25] of the
resulting measured and simulated data matrix H (See Fig. (3.9) d) ). Chosen a moving window, the contribution in magnitude of all transforms for each EM frequency j is considered by taking the sum of the all Fourier Transform M (f ) = N ∑ j=1 | ST F Tj(f ) | (3.2)
being j the column index of the EM frequencies and f the low frequency at which the body motion is evaluated for spectral density.
The final result is a spectrogram which record the variation of the power spec-trum density over time, useful to achieve information about body movements related to any kind of physical activity.
Figure 3.9.: Performed procedure to acquire the measured and simulated spectrogram
Chapter 3. Preliminary Studies
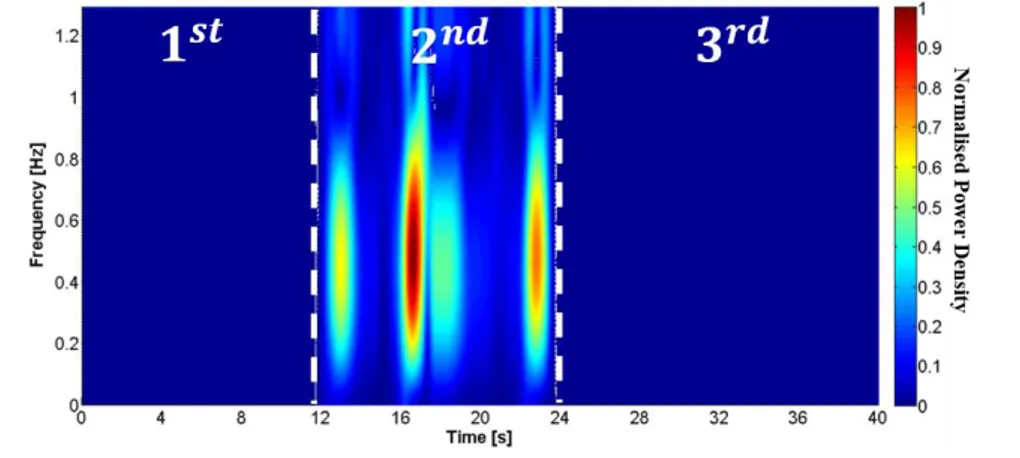
Figure (3.10) depicts the spectrogram obtained from the laboratory mea-surements, where the three time intervals are clearly identifiable. In fact, when the subject is still (0<t<12 s and 24s <t<40s) the power density values are significantly smaller than those obtained in 12s < t <24s, when the subject is moving her arms. More in details, considering the central interval, it is possible to distinguish the harmonic contents relative to the sideward arms movement from bottom to top in the time interval 12-16s, and from top to bottom in the following time interval 20-24s. For both movements the significant harmonic content is between 0.3 and 0.8Hz, represented by the red/orange area.
Figure 3.10.: Measured spectrogram relative to the movements of the volun-teer. The red/orange areas highlight the sideward arms move-ment of the subject; the green/white areas represent involuntary movements
Referring to the Fig. (3.10) some evidences can be highlighted:
• Despite in some intervals the volunteer was asked to stay still, some har-monic contents can be visibly observed (yellow circles in Fig. (3.10)). This behaviour could be due to small involuntary movements of the sub-ject (for example backwards and forwards with respect to the antenna)
3.3. Analysis of human motions: comparison between simulated and measured result which modify the phase of the reflection coefficient and consequently the harmonic content of backscattered signals. Moreover, it is worth noting the sensitivity of the system explained in detail in the previous work [25], which is able to detect the breathing activity enhanced by the movement of the chest at this frequency range.
• Two main spectral contributions emerge during the 2nd interval of time. They are in correspondence of arms located at 90◦ with respect to the body (See Fig. (3.10) a) ). In this position indeed, the component of speed reaches the maximum value of its harmonic variation. The different power density intensities obtained in correspondence of ascendant and descendent movements (See Fig. (3.10) b) ) could be explained with the different speed of arms as well as to involuntary small oscillations of the subject.
The simulated spectrogram is represented in the Fig (3.11) The three intervals of time are well outlined once again, the ascendant and descendent arms move-ments can be distinguished and their significant harmonic content is between 0.3 and 0.7 Hz in good agreement with the measured results.
Figure 3.11.: Simulated spectrogram relative to the different sideward arms po-sitions of the human body model proposed
In addition some evidence can be highlighted:
• As expected the harmonic content in the 1st and 3rd interval is null because the simulation does not take into account neither spurious move-ments nor the respiratory activity that instead are necessarily present in the experiment.
Chapter 3. Preliminary Studies
• Accordingly to measured results, two contributions are significantly higher with respect to the others.
• Again, they correspond to arms located at 90◦ where the component
of speed movement reaches its maximum value. In the simulation, the ascendant and descendent movements are equivalent and hence the re-lated power density values are the same. This confirms that the different spectral values measured during ascending and descending phases of the arms are due to the different velocities and spurious movements that in simulation are not taken into account.
These preliminary studies represented a key point for the development of the EM model based on PO approach which will be presented in the following section. The EM model is addressed to the remote monitoring of physical activity of subjects in indoor environments and the analysis deepened in this section gave useful hints for the construction of the human model which made it more efficient than the traditional numerical techniques.