Patagonian Andes
Angelo Villalobos1 , Gabriel Easton1 , Andrei Maksymowicz2 , Sergio Ruiz2 , Galderic Lastras3 , Gregory P. De Pascale1 , and Hans Agurto‐Detzel4
1Departamento de Geología, Facultad de Ciencias Físicas y Matemáticas, Universidad de Chile, Santiago, Chile, 2Departamento de Geofísica, Facultad de Ciencias Físicas y Matemáticas, Universidad de Chile, Santiago, Chile,3Grup de
Recerca Consolidat en Geociències Marines, Universitat de Barcelona, Barcelona, Spain,4Université Côte d'Azur, IRD, CNRS, Observatoire de la Côte d'Azur, Géoazur, Nice, France
Abstract
The intra‐arc Liquiñe‐Ofqui Fault System (LOFS) is an active transpressive fault zone located in the Patagonian Andes of Chile. In 2007, a seismic sequence occurred in the Aysén Fjord region of Chilean Patagonia along the LOFS, with a Mw6.2 main earthquake that triggered dozens of landslides, some of which induced tsunami waves that caused severe damage and casualties. Through the analysis of high‐resolution seismic reflection and bathymetric data, we identify six submarine faults cutting the Late Quaternary postglacial sedimentary infill of the fjord. The most conspicuous are the dextral‐normal NE‐SW striking Quitralco fault (QF) and the N‐S striking strike‐slip Río Cuervo (RCF) and Punta Cola faults (PCF). Our paleoseismological analysis reveals at least seven paleolandslide events buried in the fjord sediments that were triggered by local paleoearthquakes, which occurred since local ice sheet retreat, that is, circa 12 kyr. By combining tectonic observations with local seismicity data, we propose a seismotectonic model for the evolution of the 2007 seismic sequence where three structures were progressively activated from the depth toward the upper continental crust, causing surface rupture along the PCF and with earthquakes, suggesting only partial ruptures along other faults. Because the other faults did not rupture to the seafloor they remain important sources of seismic hazard. Thus, the last seismic sequence was a consequence of a stress transfer from the lower‐ductile toward the upper‐brittle continental crust, close to the triple junction of the Nazca, South American, and Antarctica Plates. Our results emphasize on the potential synergies between multiple geological and geophysical methods to assess complex events.Plain Language Summary
When crustal faults rupture, the energy released is the earthquakes we feel at the surface of the Earth. Recent studies along strike‐slip faults demonstrate that thesephenomena are often not only related to a single fault but instead take place along several faults like was seen in the 2016 Kaikoura earthquake in New Zealand. Using novel high‐resolution seismic reflection imagery and bathymetric data together with the reanalysis of local seismicity, we show (i) multiple active faults in the Aysén Fjord area along the Liquiñe‐Ofqui Fault System in the Patagonian Andes; (ii) several of these faults were activated during the last 2007 seismic sequence and one of them (the Punta Cola fault), ruptured to the surface causing a Mw6.2 earthquake that generated massive landslides and local tsunami; and (iii) mapping of similar landslides in the fjord sediments demonstrates similar events occurred at least seven times since the last ice sheet retreat in the area, that is, in the last 12,000 yr. This demonstrates the necessity for including the possibility of complex ruptures involving multiple faults regarding seismic hazard assessment along crustal faults, especially for faults near populated areas.
1. Introduction
The identification and characterization of fault geometry and prehistoric earthquakes in the geological records are the basis for the study of multiple seismic cycles, evaluation of seismogenic source behavior, stress distribution, interaction among different faults, and seismic hazard assessment (e.g., Healy et al., 2004; Kilb et al., 2002; Nostro et al., 2005). Active faulting onshore can generate surface ruptures that are even-tually easily recognizable in the geomorphology. In contrast, the recognition and the study of these types of geomorphologic markers are more difficult in the case of the marine environment, at which point the
©2020. American Geophysical Union. All Rights Reserved.
Key Points:
• High‐resolution seismic reflection and bathymetric data reveal seafloor rupture and multiple faults cutting postglacial fjord sediments • Four‐dimensional seismotectonic
model shows that the 2007 Aysén Seismic Sequence resulted in multiple faults activation and surface rupture
• Seven paleoearthquakes similar to 2007 main event caused landslides and conspicuous deformation of the fjord's seafloor, during the last 12 kyr
Supporting Information: • Supporting Information S1 Correspondence to: A. Villalobos, [email protected] Citation:
Villalobos, A., Easton, G.,
Maksymowicz, A., Ruiz, S., Lastras, G., De Pascale, G. P., & Agurto‐Detzel, H. (2020). Active faulting, submarine surface rupture, and seismic migration along the Liquiñe‐Ofqui Fault System, Patagonian Andes. Journal of Geophysical Research: Solid Earth, 125, e2020JB019946. https://doi.org/ 10.1029/2020JB019946 Received 9 APR 2020 Accepted 10 JUL 2020
application of geophysical techniques becomes crucial to improving the geologic structural analysis. In addition, the absence of records of recent seismic activity, either instrumental or in the historical archives, can generate a false sense of security regarding the seismic hazard associated with these active faults. When fault rupture in a submarine environment or near shore other coseismic geohazards such as tsunamis, soil liquefaction, landslides, and associated displa-cement waves can occur, as it was the case of the last 2007 seismic swarm in the Aysén region of the Patagonian Andes in southern Chile (Naranjo et al., 2009; Oppikofer et al., 2012; Sepúlveda et al., 2010; Vargas et al., 2013).
In recent decades, the study of active faults in earthquake geology and paleoseismology on land has improved our knowledge about faulting mechanisms and earthquake occurrence based upon direct observa-tions of geological records (e.g., De Pascale & Langridge, 2012; McCalpin, 2009; Meghraoui et al., 1988; Rockwell & Ben‐Zion, 2007; Vargas et al., 2014; Wallace, 1981; Yeats et al., 1997). However, marine faults pose a number of challenges. Much work along the sub-marine portions of the Alpine Fault in New Zealand (e.g., Barnes, 2009; Barnes et al., 2005, 2013), the Northern Anatolian Fault in Turkey (e.g., Armijo et al., 2005; Beck et al., 2007; Cormier et al., 2006; McHugh et al., 2006; Sunal & Erturaç, 2012), in California (e.g., Hardebeck, 2013), and northern Chile (e.g., Vargas et al., 2011) demonstrates that the combination of high‐resolution multibeam bathymetric data with subbottom profiling yields excellent insights into active fault investigations and provides critical information about slip rates and the timing of paleosurface ruptures. In addition, paleo-seismological studies can focus on secondary active faulting evidence, such as tsunami records, turbidites, slumps or soft sediment deforma-tion features (e.g., Goldfinger et al., 2013; Nelson et al., 2012; Pouderoux et al., 2012; Smedile et al., 2012). Because of their fast sedi-mentation rates and often long sedimentary records, fjords constitute ideal archives to explore the seismic history of an area and to assess the structural style and degree of activity of faults that directly disrupt the sedimentary infill. However these environments can represent a challenge for paleoearthquake investigations based on indirect records of paleostrong ground motions, such as turbidites (e.g., Atwater et al., 2014; Van Daele et al., 2013; Wils et al., 2018), due to the supply of sediment coming from adjacent rivers, as in the case of the Aysén River in the homonymous fjord.
The Patagonian Andes of southern Chile are characterized by a main crustal‐scale transpressional intra‐arc tectonic feature, which is the Liquiñe‐Ofqui Fault System (LOFS—or fault zone) and runs roughly parallel to the continental margin (Figure 1). The LOFS has been characterized as a major transpressive fault system, along which N‐S striking faults accommodate mostly strike‐slip movement with local reserve component, with local extension driving normal fault-ing. The convergent margin in this region is characterized by oblique subduction between the Nazca beneath the South American plates. Between January 2007 and February 2008, an intense seismic sequence occurred in the Aysén Fjord area (2007 Aysén Seismic Sequence: 2007‐AYSS). The peak of seismic activity occurred on April 2007 and was characterized by two main earthquakes: a Mw
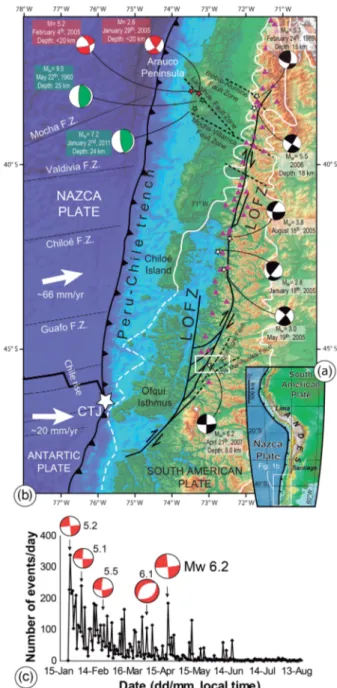
Figure 1. (a) Geotectonic framework of South America showing regional
tectonics. (b) Regional tectonic context at the triple junction of the Nazca, Antarctic, and South American plates. Composite digital elevation model (DEM) of the Nazca and South American plates. Regional map showing the location and extent of LOFS (continuous black lines), transverse fault systems (TFS; seg-mented black lines), Chile Triple Junction (CTJ; white star), and main volcanoes (purple triangles) (after Hervé, 1994; Moreno & Naranjo, 2003; Rosenau et al., 2006; Cembrano & Lara, 2009). Previously published focal mechanisms of crustal earthquakes are shown for the LOFS (black), TFS (red), and megathrust earthquakes (green) (Barrientos & Acevedo‐Aránguiz, 1992; Cifuentes, 1989; Haberland et al., 2006; Lange et al., 2008; Legrand et al., 2011). Convergence velocity vectors after Angermann et al. (1999). White lines show the approximate maximum extension of the Pleistocene ice sheet during the Last Glacial Maximum (modified from Thomson et al., 2010). White rectangle indicates the study area (Figure 3a). (c) Distribution of number of events versus time of the 2007‐AYSS swarm and focal mechanisms for the main shocks according to Geophysics, University of Chile GUC (2007) and Harvard Seismology HRV (2007).
6.1 magnitude on 2 April and a Mw6.2 magnitude on 21 April (Agurto et al., 2012; Lara et al., 2009; Legrand et al., 2011; Mora et al., 2010; Russo et al., 2011; Vargas et al., 2013). The seismic swarm encompassed a spa-tial extension of 52 by 24.5 km2and occurred along the main branches of the LOFS (Figure 1).
In this study, we analyze submarine evidence of surface faulting activity that resulted from the last 2007‐AYSS and prior events by using multibeam bathymetric data and high‐resolution seismic profiles in the inner part of the Aysén Fjord. The results allow us to identify submarine active fault segments of the LOFS, which we compare to previous surface faulting mapping in this area. Through a reanalysis of the seis-micity data, wefind a migration of the seismic sequence among the main faults that resulted in a surface rup-ture triggering large rockslides and submarine landslides, especially on 2 April 2007. Finally, we propose a seismotectonic model suggesting that the 2007‐AYSS resulted from a stress transfer from the lower‐ductile toward the upper‐fragile crust in this region.
2. Seismotectonic Setting
2.1. LOFS and Related Tectonic Features
The study area is located near the southern termination of the subduction margin between the Nazca and South American plates (Figure 1), with a convergence rate estimated at ~6.6 cm/yr (Angermann et al., 1999). The main structural feature in this region is the intra‐arc transpressional LOFS, which extends for ~1,200 km between 38°S and 47°S (Cembrano et al., 1996, 2002; Forsythe & Prior, 1992; Hervé, 1994; Lavenu & Cembrano, 1999; Legrand et al., 2011). In general, the system is formed by two NNE parallel regional linea-ments connected by at least four NE en échelon linealinea-ments that define a duplex structure (Hervé, 1994). A structural control by the LOFS in the distribution of Quaternary volcanism was proposed by Cembrano and Lara (2009), while a strong role of the Quaternary glaciations was proposed as constructive control on the Patagonian Andes mountain building (Thomson et al., 2010).
In the Aysén Fjord and surroundings areas, Quaternary volcanoes, such as the Macá‐Cay volcanic complex (D'Orazio et al., 2003; Niemeyer et al., 1984), are associated with dozens of Holocene monogenetic cones located along lineaments parallel to the main faults or directly along traces of the major structures in the area (Vargas et al., 2013). These Quaternary volcanoes overlay granitic rocks with mafic intrusions and locally gneisses, constituting the North Patagonian Batholith (Bartholomew, 1984). The landscape is domi-nated by U‐shaped valleys associated with the Quaternary glacial erosion, which are characterized by steep slopes reaching up to 2,000 m above sea level (a.s.l.) with landslides, glacial andfluvial geomorphologies, and volcanic deposits related to the Southern Volcanic Zone sources (Sepúlveda et al., 2010; Vargas et al., 2013). The climate of the region is cold and humid, with average annual rainfall of approximately 2,600 mm in Puerto Aysén, reaching maximum values of 4,000 mm in the fjord (Dirección General de Aguas), with mapped glaciers located at elevations down to ~1,100 to ~1,500 m a.s.l. (Vargas et al., 2013). The Aysén Fjord is EW to NW‐SE oriented and corresponds to a typical U‐shaped glacier valley with steeped flanks that was fully glaciated during the Last Glacial Maximum (LGM), which here occurred around 17.3 kyr (e.g., Glasser et al., 2012; Heusser, 1990). Active branches of the LOFS were recognized across the fjord, and despite strong erosion rates and sediment supply to the valleys, especially by the Aysén River, which drains the overall Patagonian Andes at this latitude, geomorphologic markers of faulting activity occurred in the last 12,000 Cal yr BP, after the last ice sheet retreat in the area, were found on land and at the seafloor (Figure 2), suggesting rapid tectonic rates associated with active structures of this major fault system (Vargas et al., 2013). These active tectonic rates would be responsible for significant seismogenic activity along active faults, as previously inferred from a study of the shallow sedimentary infill of the Aysén Fjord (e.g., Wils et al., 2018).
The Chile Rise (CR) is a major tectonic feature that is currently subducting ~260 km southwest of Puerto Aysén (Figure 1), offshore the Patagonian Andes (Cande et al., 1987; Herron et al., 1981). Thisfirst‐order tec-tonic configuration forms the Chile Triple Junction (CTJ), which currently occurs offshore of the Taitao Peninsula in the Aysén region but has migrated to the north circa 14 Ma since the ridge collided with the trench (Bangs & Cande, 1997). The oblique convergence of the Nazca Plate beneath the South American Plate, at an ~18° angle with respect to the orthogonal direction to the trench (Angermann et al., 1999), explains a significant part of the total partitioning in trench parallel transcurrent and compressional defor-mation, defining a transpressional dominant mechanism along the LOFS (Beck, 1988; Cembrano et al., 1996,
2000, 2002; Rosenau et al., 2006). Other factors may influence such a deformation such as a strong interplate coupling and a thermally weakened continental crust (De Saint Blanquat et al., 1998; Legrand et al., 2011). Forsythe and Nelson (1985) and Cembrano et al. (2002) proposed an indenter‐type mechanism produced by a CR‐trench interaction, a mechanism that would generate decoupling of the Chiloé sliver from the continental plate along the LOFS. Cembrano et al. (2002) proposed that both transfer mechanisms may work at the same time and could control short‐ and long‐term deformation respectively along this fault system.
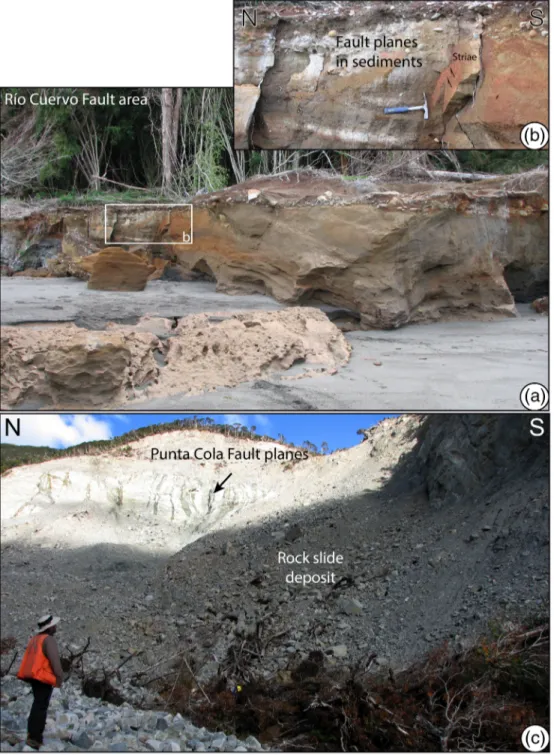
Figure 2. (a, b) Holocene littoral sediments cut by the Río Cuervo Fault in the northern shore of the Aysén
Fjord. (c) Outcrops associated to the Punta Cola Fault, in the northern shore of the Aysén Fjord, showing the rock slide deposit produced by the Mw6.2 episode during the 2007 Aysén Seismic Sequence. Location of both sites corresponds to (c) and (d) points in Figure S16, respectively.
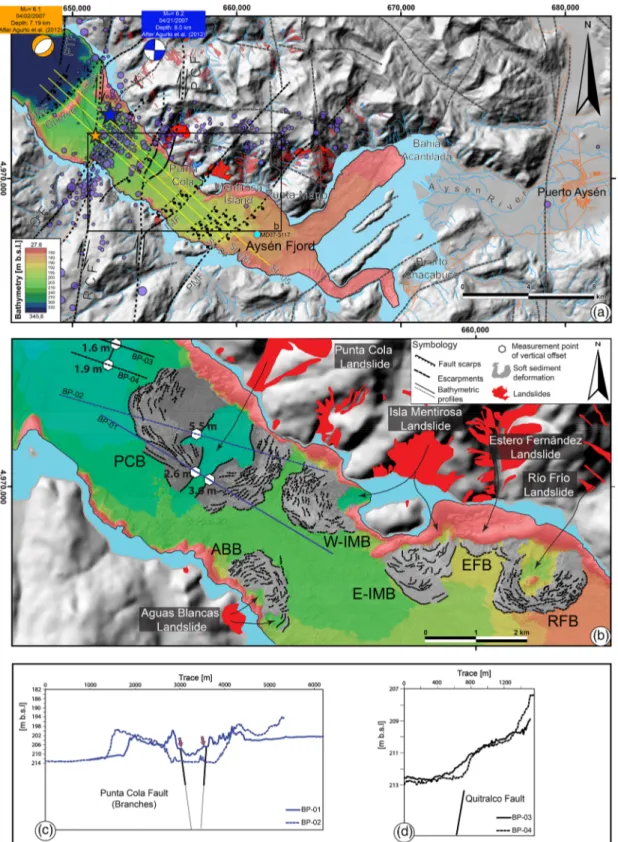
Figure 3. (a) Topo‐bathymetric map of the inner Aysén Fjord. Digital elevation model based on 1:50,000 topographic sheets from the Chilean Army Geographic
Institute (IGM). The location of the seismic profiles (SL‐05, SL‐05 and SL‐07) in Figures 4–6 is shown. Epicenters of the 2007‐AYSS (transparent purple circles) and the focal mechanism solutions for Mw¼ 6.1 and Mw¼ 6.2 are indicated. Continuous black lines show surface rupture features. Segmented black and gray lines show fault traces and lineaments, respectively. Mapping of faults onshore from Van Daele et al. (2013; Figure S16). The light blue point corresponds to an ~21 m piston core extraction site (Wils et al., 2018). (b) Geomorphic analysis of the segment affected by the 2007‐AYSS, PCB (Punta Cola Bulge), W‐IMB (Western Isla Mentirosa Bulge), E‐IMB (Eastern Isla Mentirosa Bulge), ABB (Aguas Blancas Bulge), and EFB (Esterno Fernández Bulge). Escarpments related to PCF and QF are shown. (c, d) Bathymetric profile (BP) traces are shown using blue and black continuous and segmented lines.
Most knowledge about changes in the states of deformation along the LOFS is based on structural and ther-mochronological evidence, proposing left‐lateral (sinistral) kinematics during the Late Mesozoic and right‐lateral (dextral) kinematics since the Late Cenozoic (Middle Miocene to present) (Cembrano et al., 1996, 2000, 2002; Thomson, 2002). Recent tectonics are characterized by right‐lateral lower crust ductile and upper crust brittle deformation during the Pliocene and post‐Pliocene times, with high uplifting and crustal exhu-mation rates during the Quaternary, as estimated fromfission track thermochronology and plutonic rocks (Rosenau et al., 2006; Thomson, 2002).
2.2. The 2007‐AYSS
The Aysén Fjord is located in a remote part of southern Chile that was colonized at the beginning of the twentieth century, explaining the limited historic seismic record.
Seismicity along LOFS is poorly characterized, mainly due to the scarcity of permanent local networks. Shallow crustal events were recorded since the early 1980s by temporary arrays (Figure 1b), which were most commonly deployed to monitor volcanic activity (Agurto‐Detzel et al., 2014; Barrientos & Acevedo‐ Aránguiz, 1992; Lange et al., 2008). The 2007‐AYSS began on 10 January 2007 with a small earthquake (ML< 3) nucleated at 9–10 km below the inner fjord. Many similar events took place on 14, 18, 19, and 21 January until a Mw5.2 earthquake struck the area on 23 January, generating aftershocks with >20 events per hour (Figure 1c; Barrientos et al., 2007; Russo et al., 2011). From this initial stage,five major events each with increasing size (M > 5; U.S. Geological Survey National Earthquake Information Center (USGS NEIC) catalog) occurred on 28 January (Mw5.2), 3 February (Mw5.3), 23 February (Mw5.7), 2 April (Mw6.1), and finally, 21 April (Mw6.2) (Figure 1c). These last two events are considered the peak stage of this seismic sequence (Agurto et al., 2012).
The Mw 6.2 earthquake caused 538 mass movements, including large rockslides and rock avalanches (Figures 2 and 3; Naranjo et al., 2009; Sepúlveda et al., 2010). Among these, the three largest mass move-ments occurred at Punta Cola (12 Mm3), north of Isla Mentirosa (8 Mm3), and at Aguas Calientes (1.7 Mm3; Naranjo et al., 2009; Sepúlveda & Serey, 2009; Sepúlveda et al., 2010; Oppikofer et al., 2012), caus-ing direct damage and triggercaus-ing local tsunami waves when the landslide material entered the fjord. The runups of these waves were tens of meters at Isla Mentirosa and close to 10 m at the southern side of the fjord (Naranjo et al., 2009; Vargas et al., 2013), causing 10 deaths and significant damage to infrastructure and the local economy.
3. Data and Methodologies
To study submarine segments of the LOFS, we used high‐resolution bathymetry and seismic reflection pro-files obtained in the inner fjord west of Puerto Aysén (between 73.13–72.68°W and 45.32–45.47°S; Figures 1 and 3a). The data set was obtained during a geophysical study as part of the DETSUFA project (Deslizamientos Tsunamigénicos en el Fiordo de Aysén; Lastras et al., 2013), which took place between 4 and 17 March 2013, aboard the BIO Hésperides.
3.1. Bathymetry
To obtain a high‐resolution bathymetric map, a KONGSBERG SIMRAD multibeam EM‐1002S was used. This system uses 111 beams at a 96 kHz sonar frequency and with a maximum ping rate of >10 Hz. Equidistant mode was used for swath bathymetry acquisition. This array maximized the number of beams facilitating data acquisition and obtaining a homogenizedfinal grid with improved resolution, with tracks separated every 150 m. The swath thickness was the same regardless of width, generating a 50% overlap between each track, with the exception of areas located near the coast. Expendable Bathythermograph (XBT) probes were used at specific sites to measure changes in water sound velocity due to variability in fresh water circulation.
The processing of bathymetric data was done using Caris HIPS and SIPS software. Thefinal grid of the bathymetric data have a grid size of 4 m, and from these data, bathymetric, slope, and aspect maps were derived using ArcGIS software (Figures 3b and S1 in the supporting information).
3.2. Seismic Profiling
The seismic reflection data were acquired using an array of two BOLT air guns (165 and 175 in.3), which were towed behind the vessel stern. The configuration used in the seismic sources was 2,000 psi, a depth of 3 m for the gun, with afiring rate of 15 m over the seafloor. A 100 m long ministreamer with a 25 m active section, corresponding to one single channel, recovered the shots. The seismic data were recorded by using the DELPH SEISMICPLUS system with a recording length of 4.0 s and a preamplifier gain of 8 Hz. The raw seismic data were processed aboard the SMT Kingdom Suite, including the navigation and standard pro-cesses of electrical noise removing (50 Hzfilter), gain amplifier and band‐pass filtering, to improve data visualization. Postprocessing included the migration of the sea bottom diffractions and the muting of the water column performed in Seismic‐Unix.
We use a P wave velocity (VP)¼ 2,000 m/s for migration from time (TWT) to distance (m) because it corre-sponds to an average value for shallow marine sediments located in the trench of the Nazca beneath the South American plates along Central‐Southern Chile (e.g., Maksymowicz et al., 2012). These sediments were classified as fluvial and glaciomarine in origin (e.g., Bangs & Cande, 1997; Thornburg & Kulm, 1987). A more detailed explanation concerning the physics and empirical values is presented in the supporting information (Text S1).
Finally, the seismic interpretation was generated using Move and Adobe Illustrator. We estimate a maxi-mum error of ±0.33 m for vertical distance estimations from our seismic profiles (Figure S5).
3.3. Seismic Event Locations
Information regarding the 2007‐AYSS hypocenter location was compiled from data recorded by temporary stations at the Chilean National Seismological Center (CSN, Universidad de Chile; Barrientos et al., 2007; Legrand et al., 2011) and the University of Liverpool (Agurto et al., 2012).
To associate seismic activity with geological structures and to propose a geometric model at a crustal scale, we used two seismic catalogs covering most of the 2007‐AYSS. We used data from the CSN local seismic net-work for the period between 27 January and 21 April 2007. During thisfirst stage, the seismic network con-sisted offive three‐component seismometers installed around the epicenter of the Mw 5.2 earthquake (Barrientos et al., 2007). A total of 284 events were recorded before 21 April 2007 (Barrientos et al., 2007; Russo et al., 2011), when the tsunami triggered by the Mw6.2 earthquake destroyed this network. For the following period, we used seismic data published by Agurto et al. (2012) corresponding to the University of Liverpool seismic network. This temporary deployment consisted of 15 stations and recorded seismic data between July 2007 and February 2008. This data set is characterized by precise hypocenter relocation based on a new 1‐D crustal velocity model for the area (Agurto et al., 2012), well constrained for the shallower ~30 km, encompassing the expected seismogenic zone (Agurto et al., 2012; Lange et al., 2008).
To support our seismotectonic model of the LOFS in the area, we analyzed all the earthquakes in a three‐dimensional diagram using MOVE 2016.1. By comparing this latest information with active faults defined from seismic profiles and bathymetric data, together with the hypocenter clusters and focal mechan-isms solutions of the main earthquakes (Agurto et al., 2012), we developed 3‐D surfaces representing the QF, RCF, and PCF at the upper‐crustal scale.
4. Results and Interpretation
4.1. Geomorphology of the Inner‐Fjord Seafloor
The submarine geomorphology of the Aysén inner Fjord is characterized by aflat seafloor with a regional slope of≤2.5° (Figure 3). Its northern and southern boundaries are high‐angle slopes between ~30° and ~80°. The inner part of the Aysén Fjord is bounded to the west by the Cuervo Ridge, which is a conspicuous feature composed of NE striking elongated seamounts, with ~80° slopes. The inner fjord deepens westward from 150 m below sea level (b.s.l.) near Bahía Acantilada, in front of the Aysén river mouth (Figure 3a), to ~220 m in front of Isla Mentirosa. West of the Cuervo Ridge, the sea bottom of the fjord is characterized by a noticeably steep drop‐off of ~100 m, reaching depths of ~340 m.
The submarine continuation of fault scarps is difficult to assess in bathymetric maps, mostly due to the high sedimentation rates associated with the sediment input from the Aysén River as well as the obliteration of
the sea bottom geomorphology imposed by the deformation associated with the submarine impact of rockslides and rock avalanches (Figure 3b). This deformation appears as bathymetric highs with differences of up to ~8 m with respect to the surroundingflat surfaces in the seafloor bathymetry. These abrupt changes will be referred to as“escarpments” hereafter, except in those cases associated with active faults, which will be referred to as“fault scarps.” Some of these bulges, especially in front of Punta Cola (Figure 3b), were interpreted as pressure ridges and fault scarps by Vargas et al. (2013), while these are generally considered basin‐plain deformation associated with the submarine impact of rockslides according to Van Daele et al. (2013), following the model established by Schnellmann et al. (2005). The model proposes that slope‐adjacent landslides induced deep‐ and far‐reaching deformation in the basin‐plain sedimentary sequence (Van Daele et al., 2013). The deformation zone typically displays a geometry similar to a fold‐and‐thrust belt structure in cross section, which is created from an increase loading of the basin‐plain sediment during a mass flow because the slope‐adjacent landslide wedge
Figure 4. (a) Uninterpreted seismic reflection profile (SL‐05; location in Figure 3a) showing the location of insets in
Figure 7. (b) Interpreted profile showing main fault offshore segments of the LOFS transfer zone. Seismic facies color coding corresponds to the Parallel Laminated Unit (PLU, bluish color), Mass Deformed Unit (MDU, green), Moraine Bank Unit (MU, orange), Cuervo Ridge (purple), and North Patagonian Batholith (NPB, red). Continuous lines and discontinued lines represent faults, with continuous lines indicating less uncertainty. Fault names from NW to SE are Cuervo Ridge (CRF), Río Cuervo (RCF), Quitralco (QF), Río Pescado (RPF), Punta Cola (PCF), Isla Mentirosa (IMF), and Punta Mano faults (PMF).
growth leads to a successive propagation of the thrust front (Schnellmann et al., 2005). The compression and deformation of theflat fjord floor is favored by the peculiar geometry of glaciogenic lakes and fjords; this geometry comprises steep slopes with sharp lower slope breaks (Schnellmann et al., 2005).
The bulges are characterized by curved traces on the map at ~370–750 m long, and each of them is associated with a subaerial landslide that entered the fjord (Lastras et al., 2013; Oppikofer et al., 2012; Van Daele et al., 2013; Figure 3b). Using bathymetric profiles and aspect maps, we distinguished a main slope delimit-ing each bulge as well as several internal curved slopes with lower heights that limit tilted surfaces (Figure 3c).
Specifically, the Punta Cola Bulge (PCB) is interrupted by a NNE rectilinear sag limited by two escarpments with vertical offsets that range between 1.6–5.5 m (Figures 3b and 3c). Northwest of the PCB, a 650 m long escarpment‐oriented NE‐SW with vertical offsets that range from 1.6 to ~2 m can be observed (Figures 3b and 3d).
Figure 5. (a) Uninterpreted seismic reflection profile (SL‐06; location in Figure 3a) showing the location of insets in
Figures 7 and 10. (b) Interpreted profile showing main fault offshore segments of the LOFS transfer zone. Color coding for seismic facies units and abbreviations labels for the faults are the same as in Figure 4.
4.2. Seismic Stratigraphy
We differentiate the sedimentary fjord infill into three main seismic‐stratigraphic units based on SBP data. We use Belknap and Shipp's (1991) criteria, which are based on (1) the character of the reflections, (2) the intensity of the acoustic contrast, and (3) the general geometry of the deposit, including the stacking pattern of the reflectors. Additionally, we interpret and relate these units to different geomorphologic and strati-graphic features. As a result, we map and interpret three seismic profiles located along the inner part of the fjord (Figures 3–6).
4.2.1. Cuervo Ridge Unit (CRU)
We observe the internal structure of Cuervo Ridge and other bodies, which are characterized by semicontin-uous and discontinsemicontin-uous chaotic to transparent seismic facies. Lara et al. (2009) interpreted the Cuervo Ridge
Figure 6. (a) Uninterpreted seismic reflection profile (SL‐07; location in Figure 3a) showing the location of insets in
Figures 7 and 10. (b) Interpreted profile showing main fault offshore segments of the LOFS transfer zone. Color coding for seismic‐facies units and abbreviations labels for the faults are the same as in Figure 4.
as at least partly a monogenetic cone based on the dredging of a basalt sample. Vargas et al. (2013) also sug-gested a volcanic component in at least part of this ridge based on the observation of 3.5 kHz subbottom pro-files. Because extensive glaciations occurred in this zone, an alternative interpretation for at least part of this type of unit would be a frontal moraine, where glaciers entrained local volcanic rocks and deposited them here (Boyd et al., 2008).
Seismic facies here have semicontinuous to discontinuous reflectors constituting the Cuervo Ridge, and it can be interpreted as formed by hard rocks, eventually partly volcanic, and constituting the Northern Patagonian Batholith such as, for example, in the eastern portion of profile SL‐05 (Figure 4). Based on these observations, it is possible to discard a submerged moraine as an origin for the Cuervo Ridge. Clearly, more dredge samples in this area are needed to clarify this hypothesis.
4.2.2. Moraine Unit
This unit has continuous to semicontinuous irregularly shaped reflectors with moderate to intense acoustic contrast in lateral contact with the Cuervo Ridge, most possibly onlapping this last feature (Figures 4–6). The unit has a multicrested mound with a hummocky internal shape that we interpret as a moraine, following the similarities in geometry and semichaotic facies seen in previous seismic surveys in Chilean fjords (e.g., Boyd et al., 2008; Breuer et al., 2013). This glacial deposit, described for thefirst time here, appears at ~0.42 s (~107 m below the seafloor, b.s.f.) from eastern flank of the Cuervo Ridge up to the vici-nities of Punta Cola, covering ~7 km along the inner fjord. The estimated thickness of this Moraine Unit (MU) ranges at least between ~14 and 33 m (until thefirst multiple). The stepped geometry of the MU, as found in the seismic profiles, is characteristic of push frontal moraines (Figures 4–6). Furthermore, the con-siderable thickness of the deposit could indicate successive phases of advancements and retreats of the gla-cier that likely occurred during the Late Quaternary here.
4.2.3. Parallel Laminated Unit
The best represented seismic‐stratigraphic unit is the Parallel Laminated Unit (PLU), characterized by seismic facies with parallel continuous to semicontinuous, medium to high intensity reflectors exhibiting laminar and sometimes wedge geometries. The estimated minimum thicknesses for this unit (using V ¼ 2,000 m/s, until the first multiple) ranges from ~107 to ~307 m, thinning from Bahía Acantilada, in front of the Aysén River mouth, toward the Cuervo Ridge. The PLU overlays the MU and the CRU, with well‐recognized onlap terminations denoting an important aggradation of the sedi-mentary infill of the inner fjord, mostly due to the strong sediment supply from the Aysén River (Figures 4–6). Wedge geometries and chaotic seismic facies occur within this unit mainly in the west sec-tion, close to the CRU.
DaSilva et al. (1997) characterized different seismic facies and seismic‐stratigraphic units in Chilean fjords, including part of the Aysén Fjord. They indicated that thefirst 1.5 s of the subsurface sedimentary infill cor-respond to an ice proximal facies (i.e., marine proximal glacial deposits), whereas in Vargas et al. (2013), the PLU was observed up to thefirst ~40.4 m and was subdivided into two seismic‐stratigraphic units: the more recent shallower unit characterized by continuous laminations and a poorly laminated deeper unit, inter-preted as the result of postglacial sedimentation during the deglaciation since 12 kyr and the Holocene sea level high stand post‐7 kyr.
The seismic reflection data used in this work allowed us to extend the observations ~250 m deeper than in previous studies. The images show that the general characteristics of PLU are similar for several meters more of depth (Figures 4a, 5a, and 6a). Within this unit, we generated a subdivision based on the contrast and lat-eral continuity of the reflectors, and we will later discuss the possible origin of this seismic facies.
4.2.4. Mass Deformed Units
We differentiate reflectors characterized by chaotic to semicontinuous seismic facies, some of which have low acoustic amplitude. We named these packages, based on their depth and location, Mass Deformed Units (MDU‐00 to MDU‐07).
Located on the seafloor, MDU‐00 is interpreted as deformed sediment caused by rockslides and rock ava-lanches that entered the fjord triggered by the Mw 6.2 earthquake, following Van Daele et al. (2013). These units are the seismic expression of the bathymetric bulges previously seen on the seafloor (Figure 3b) and are directly related to the three major rock avalanches that entered into the fjord at Punta Cola (PCLS, Figure 7a), Isla Mentirosa (IMLS; Figure 7b), and Aguas Calientes (ACLS, Figure 7c;
Lastras et al., 2013). Continuous reflectors in the upper section of the deposits indicating velocity contrasts between seawater and sedimentary infill show conspicuous vertical offsets. These reflectors are deformed, slightly folded and dislocated, revealing reverse faults that coincide with the curved traces found on the
Figure 7. Detail of the sedimentary deformed wedge (MDU) internal structure interpreted in SL‐05, SL‐06, and SL‐07 seismic profiles (see location
in Figure 3a). Each structural feature, together with kinematics, are indicated in at least onefigure. (a–c) The present‐day seafloor deformation (MDU‐00) associated with PCB, W‐IMB, and ACB. The Punta Cola Fault (PCF) is clearly differentiable from the synsedimentary deformation. (c) MDU‐02, (d) MDU‐01, (e and f) MDU‐03, (g) MDU‐04, (h) MDU‐05, (i) MDU‐06, and (j) MDU‐07.
deformed seafloor that we associate with soft‐sediment fold‐and‐thrust belts based on Van Daele et al. (2013) and Lastras et al. (2013), following Schnellmann et al. (2005).
Seismic profiles show thrust faults verging in opposite directions, a geometry that can be related to a semi-circular deformation front linked to the propagation of a submarine landslide (Figure 3b). Thrust fronts are high‐angle dislocations that separate MDU from PLU facies. The location of basal décollement zones varies between each profile and each sedimentary wedge. In the case of PCB and the Western Isla Mentirosa Bulge (W‐IMB), thrust fronts (related to the landslides deforming the seafloor) detach at ~36 and ~47 m b.s.f., respectively, as observed in the northern seismic profile SL‐05 (Figure 4). In profile SL‐06, the PCB décollement zone is at ~41 m b.s.f, but in W‐IMB, it becomes shallower at ~16 m b.s.f. (Figure 5), while in the southern profile SL‐07, the PCB and Aguas Calientes Bulge décollement zones are located at ~19 and ~21 m b.s.f., respectively (Figure 6). Through the analysis of ~1.3 kHz seismic reflection data, Van Daele et al. (2013) describe similar seismic facies in profiles perpendicular to ours, covered by mass flow‐related deposits they interpreted as megaturbidites.
In the deep sedimentary infill, we identified seven levels with similar features and structures to the seismic facies described upward (MDU‐00) embedded within the Parallel Laminated Unit. These packages, MDU‐01 to MDU‐07 (Figure 7), also exhibit wedge geometries, and most can be followed at the same depth in at least two of the seismic profiles. Similar to MDU‐00, sedimentary wedges, fold‐and‐thrust belts structures can be found. These MDUs are located at minimum depths of ~24.2, ~30.5, ~48.2–51.8, ~65.8, 70.4–82.4, ~100.3– 198.6, and ~121.9–137.1 m b.s.f. in the case of MDU‐01, MDU‐02, MDU‐03, MDU‐04, MDU‐05, MDU‐06, and MDU‐07, respectively.
5. Active Faulting in the LOFS
Through the analysis of seismic profiles, we describe active faults rupturing the postglacial sedimentary infill of the inner Aysén Fjord in the study area, including the Punta Cola Fault (PCF), Quitralco Fault (QF), and Río Cuervo Fault (RCF), as previously mapped by Vargas et al. (2013), and we present new submarine struc-tures identified in this work.
5.1. Punta Cola Fault
Vargas et al. (2013) described PCF as an ~20 km long dextral‐reverse fault based on the observation of rock outcrops affected by intense brittle deformation, with fault planes and fractures that range between centi-metric shear zones and damage zones several dozen meters in width (Figure 2c). From south to north, its onshore style varies from a simple N‐S striking fault trace, observable for ~8.2 km until it reaches the fjord bank (Figure S16).
Here wefind ~4.2 km of submarine continuation of this fault is observed in seismic profiles, showing an asymmetrical positiveflower structure geometry (Figures 4 and 5). This structural feature was not found in the fjord near a pressure ridge, and, on the contrary, the existence of a small depression limited by escarp-ments masks it (Figure 3b). The faulted zone associated with this structure narrows southward from an aver-age width of ~1,080 to ~243 m (SL‐05 and SL‐07; Figures 4 and 6). Branch tips of fault segments in this system can be observed reaching the surface in northern seismic profiles SL‐05 and SL‐06 (Figures 4 and 5). In addi-tion, reflector offsets generate a pop‐up structure within the deformation zone on profiles SL‐05 and SL‐06. In contrast, seismic profile SL‐07 shows fault ruptures terminating at ~0.35 s, below the sea floor. This dif-ference in the behavior of the reflector offset with respect to the northern profiles could be associated to a local bend striking N30–50°E shown in plan geometry (Figure 3a), due to a change in the slip along the fault plane. We interpret this change as a product of reduced slip along the southward fault segment of the PCF across the fjord (Figure 3a).
To the north, the fault strike changes slightly toward the west (N‐S to N10°E) for ~12 km until the northern fault termination.
5.2. Río Cuervo Fault
The RCF is the most prominent NS striking fault in the area, which extends ~100 km, with fault segments ~30–40 km long (Figure S16; Vargas et al., 2013). Damage zones up to hundreds of meters wide show evi-dence of brittle deformation affecting granitic rocks as well as sediments near the northern bank of the
fjord (Figures 2a and 2b; Vargas et al., 2013). However, no trace of this fault can be directly observed in the geomorphology of the seafloor, as revealed by high‐resolution bathymetric data (Figure 3b). Despite this data, seismic profiles show at least four parallel, well‐defined branches affecting the sedimentary infill of the fjord in the area of the RCF. In the three profiles SL‐05, SL‐06 and SL‐07, the estimated deformation zone width is ~500 m, and the tip position of the faults can be observed 0.32 to 0.39 s below the seafloor, never reaching the surface, which suggests that the most recent rupture here occurred dozens to hundreds of years prior to 2007 (Figures 4–6).
5.3. Quitralco Fault
The QF is a NE‐SW striking fault with ~70 km length as a part of a major LOFS transfer zone (Figure S16). It comes from the outer Moraleda Fjord in the western lineament of the system, ending east in the area where it connects with PCF, interacting with the RCF (Thomson, 2002; Vargas et al., 2013). Like other faults and lineaments with a similar strike in the area, right‐lateral displacement has been inferred for the QF from geo-morphologic observations. Using our fault traces projected from our seismic profiles, together with the onshore mapping of this structure based onfield and remote sensing observations of fault scarps (Vargas et al., 2013), we estimate an ~636 m minimum lateral offset. Seismic profiles show QF to be a simple trace accompanied by synthetic and antithetic faults that are best expressed in seismic profiles SL‐05 and SL‐06. The fault defines two blocks as the western hanging block depressed with respect to the eastern–footwall block. Despite this, the QF inclination is ambiguous, with a tendency to dip to the west (Figure 6). We attri-bute such ambiguity to its subvertical nature and possibly to a lesser slip in the fault plane correlated with the change in the tip position toward its termination within the study area.
According our analysis, the fault tip does not reach the seafloor (stopping at ~0.31 s reflector), where a smooth fault scarp is observed (Figures 3b, 3d, and 4). Meanwhile, southward, its tip location is deepened, reaching 0.47 s below the seafloor in the SL‐06 and SL‐07 profiles located to the south (Figures 5 and 6).
5.4. Other NE‐SW Striking Normal Faults
Other faults suggested previously as lineaments in previous work (Vargas et al., 2013) were found in our seis-mic images. These faults are parallel to QF, and we named them, from west to east, the Cuervo Ridge Fault (CRF), Río Pescado Fault (RPF), Isla Mentirosa Fault (IMF), and Punta Mano Fault (PMF).
The CRF is located near a bathymetric steep of ~100 m close to the Cuervo Ridge. Seismic profiles SL‐05 and SL‐06 show that sediment immediately west of the ridge presents an eastward tilting, which can be inter-preted as a rollover anticline. Furthermore, antithetic and synthetic normal faults deform sediment in the hanging‐wall block. We associate the presence of these features to normal fault kinematics of CRF. Unlike other main fault traces clearly shown in seismic profiles, the Cuervo Ridge masks CRF.
RPF limits the easternflank of the Río Pescado Valley. Seismic profiles SL‐06 and SL‐07 show that RPF dips slightly eastward and that its fault tip is located at ~0.34 s (Figures 5 and 6). In SL‐05, the tip falls at ~0.4 s (Figure 4).
Finally, IMF and PMF have greater degrees of uncertainty in our interpretations. Unlike the structures described above, these faults do not present a discontinuity in the reflectors that allow easy recognition in the seismic profiles, possibly due to small accumulated offsets. It is possible to identify deformed zones across the three seismic profiles defining fault branches that we have categorized as main and secondary faults. The main faults delimit an uplifted block and have continuity with lineaments proposed by Vargas et al. (2013).
6. Discussion
6.1. Architecture of Postglacial Sedimentary Infill in the Inner Aysén Fjord
The inner Aysén Fjord, which is limited to the west by the Cuervo Ridge and associated bathymetric step (Figure 3a), is characterized by a well‐stratified sedimentary cover (PLU; Figure 4) that can be interpreted as a postglacial unit overlaying the MU, defined here, exhibiting characteristic wedge architecture to the west. The sedimentary thickness ranges between >300 m, near the Aysén River mouth, to ~109 m, near the Cuervo Ridge (Figures S6–S8). This wedge architecture thinning to the west in PLU implies a strong con-tribution from the Aysén River during the last deglaciation in the Patagonian Andes and the modern global
sea level high stand after 7 kyr (Lambeck et al., 2002). Considering local observations offluvioglacial sedi-ment and moraines covered by tephra layers with buried soil in the area of the Aysén River mouth (Vargas et al., 2013), it is possible to infer an age close to ~12 kyr for the last ice sheet retreat in the area, giv-ing a maximum age for the well‐stratified sediment constitutgiv-ing the PLU. Or viewed from another perspec-tive, time averaged sedimentation rates of 25 to 9 mm/yr are possible here, assuming that all laminated sediments from prior glaciations were removed by the Aysén Glacier during the LGM.
A sediment core of ~21 m long MD07‐3117 was extracted from the Aysén Fjord (SW of Punta Mano, Figures 3a and 4a) in a pre‐2007 campaign (aboard RV Marion Dufresne). From the analysis of this core, Van Daele et al. (2013) and Wils et al. (2018) observed three sandy layers (~5, ~17, and ~20 m core depth), as well as a pumice layer (~10 m core depth), and tentatively correlated these layers with stratigraphic hor-izons in SBP data (which provide a higher resolution at the near surface than our seismic data), referred to as reflectors SL‐F and SL‐D for two of the sandy layers and SL‐E for the pumice layer.
Van Daele et al. (2013) tentatively correlated a ponding unit observed in the Condor River fan, with the H1 Hudson volcano eruption deposits (~8,260 yr BP) assuming similarities in the lamination and stratigraphic configuration. Based on the previous inference, they interpreted sedimentation rates of approximately 3.0 mm/yr; these rates are similar to previous estimates of approximately 1.9 mm/yr (using 210Pb; Salamanca & Jara, 2003). Upon assuming a constant sedimentation rate, they estimated the age of the pumice layer as ~3,170 yr BP (Van Daele et al., 2013), correlating it to the H2Hudson eruption (3,60014C yr BP). More recently, Wils et al. (2018), using a combination of radiocarbon dating with tephrochronology correla-tion, built an age‐depth model for the first ~21 m represented in the MD07‐3117 core, confirming that the pumice layer at ~10 m would correspond to the SL‐E reflector. The age for this deepest layer would corre-spond to 4,050–4,190 14C Cal yr BP. Within the ~21 m sedimentary record encompassed by the MD07‐3117 core, they propose five paleoevents based on the interpretation of layers/reflectors as mega‐ turbidites, dated as 710–830, 1,850–1,980, 1,970–2,120, 7,460–7,540, and 8,710–8,89014
C Cal yr BP, respec-tively. Additionally, they propose four paleoevents, from which the oldest associated with the SL‐A reflector (RL‐023 ¼ 0.4 ms or ~55 m depth in our seismic profiles) would be dated between ~18,600 and 20,00014C Cal yr BP (Wils et al., 2018).
Geomorphological features and radiocarbon ages available on a regional scale support the occurrence of large ice sheets covering the Northern Patagonian Andes during the LGM between ~20–18 kyr BP, with frontal systems likely located in the Pacific Ocean (Heusser, 1990; Thomson et al., 2010; Figure 1). Furthermore, Vargas et al. (2013) dated soils buried by tephra layers directly overlying moraines and out-wash sediment in the Aysén Fjord area as ~12,00014C yr BP, indicating the age for the last ice sheet retreat at the local scale.
Considering that no glaciodeformed sediment can be observed in the sedimentary infill of the Aysén Fjord from our seismic reflection data, we suggest that all of this sediment is postglacial in origin. Additionally, seismic facies interpreted as moraine banks (MU) are clearly visible at ~200 m depth in the profiles. By assuming a minimum age of ~12,000 yr for the top of the MU (Figure 4), it is possible to infer a postglacial age for the entire stratified sediment forming the PLU overlaying the MU (Figure 4). Our inferences provide a new perspective with respect to the previous interpretation of Wils et al. (2018), who assigned an age of ~18–20 kyr for the reflectors located at ~55 m b.s.f., within the PLU, based on the extrapolation of sedimen-tation rates from surface sediment core.
We propose that PLU contains two subunits: a lower one corresponding to a transgressive phase (PLUT), which was generated during the deglaciation in the area, and overlying strata corresponding to the progra-dational phase (PLUP), currently represented by conspicuous deltas such as Aysén, Cóndor, and Cuervo Rivers (Figures 8a and 8b), generated after the sea level stabilization during the early to mid‐Holocene (~7–6 kyr BP; Lambeck et al., 2002, 2014). Our characterization is based on the following points. Reflectors with high contrast acoustic impedance characterize the PLUT, reflecting high amplitude changes. Greater amplitude is generally associated to sediments with greater density. We interpret this as coarser sedi-ments (sand‐gravel) constituting the PLUT with respect to PLUP (Figures 8c and S6–S8). This unit could cor-respond to deposits associated with thefirst stages of a local glacial retreat. Radiocarbon ages reported by Wils et al. (2018) from the core MD07‐3117 are stratigraphically consistent, suggesting an age of
approximately 8,723–9,030 Cal yr BP at the bottom of the sediment core, that is, ~21 m of core depth. From these same ages, the 7.0–6.0 kyr chronostratigraphic horizon would be located between 17–15.5 m of core depth. We can recognize this stratigraphic horizon as a toplap defining the base of the PLUP in our seismic profiles (Figure 8d).
Using a simple geometric calculation, we can roughly estimate sedimentation rates values between ~15.6 and ~36.1 mm/yr (average of ~25 mm/yr) for the time period between ~12,000 and ~6,000 Cal yr BP. This large variation is mainly due to the geometry of MU and the simplicity of our approach. In addition, upon consid-ering 17.3 kyr as a maximum age for the last ice sheet retreat in the region (Glasser et al., 2012; Hein et al., 2010; Sugden et al., 2005) and then for the top of the MU in our seismic profiles (Figures 4–6), it is pos-sible to infer sedimentation rates ranging between ~8.3 and ~19.1 mm/yr (average of ~13.3 mm/yr) for the period between 17.3 and 6 kyr Cal BP. These last estimates are comparable to modern sedimentation rates inferred from ice‐retreat processes in fjords (e.g., Morehead, 2001; Syvitski & Shaw, 1995). We interpret these values as the product of the strong contribution of sediment due to the melting of the Patagonian ice sheet during the deglaciation and by an increase in the accommodation space due to the increase of the sea level, despite the not well‐constrained isostatic rebound in the area. Lower sedimentation rates deduced from the available radiocarbon data from the sediment core MD07‐3117 (Wils et al., 2018) that are similar to the previous estimates in the same area by Van Daele et al. (2013) can be explained by the
Figure 8. (a, b) Photographs taken from a helicopter showing the Aysén River delta. (c) Seismic reflection profile (SL‐06) migrated to distance (m)
using VP: 2,000 m/s. PLU (postglacier sedimentary infill) contains two subunits: a lower one corresponding to a transgressive phase (PLUT, blue) and overlying strata corresponding to the progradational phase (PLUP, green). The limit correspond to the ~6 to ~7 kyr limit (found in Piston Core MD07‐3117) when the sea level stabilized in the area during the early to mid‐Holocene (Lambeck et al., 2002, 2014). Inset (d) shows a top‐lap inside the sedimentary infill that matches with the sea level stabilization limit.
progradation of thefluvial system into the fjord, due to the strong influence of the Aysén river and limited accommodation since the global sea level stabilization during the Holocene (Lambeck et al., 2002, 2014), ori-ginating the PLUP.
6.2. Surface Rupture and Paleoseismological Record
High‐resolution bathymetric data and seismic profiles from the inner Aysén Fjord area provide evidence for surface and subsurface submarine earthquake ruptures during the 2007‐AYSS, associated with active fault-ing along main branches of the LOFS (Figures 4–6). The surface and subsurface submarine rupture that resulted from the 2007 Mw6.2 dextral strike slip earthquake can be directly interpreted from the observation of deformed strata in seismic profiles (Figures 4–6), in which the fault rupture reaches up to the surface (profiles SL‐05 and SL‐06; Figures 8a and 8b). In addition to that, ~1.5–5.0 m height escarpments can be observed not only disrupting the PCB, but also affecting the seafloor outside this unit (Figure 3b). Moreover, the longitudinal sag limited by these submarine escarpments are aligned in the position of the PCF faulted zone (Figures 3b, 3c, 7a, and 7b). Finally, no sags delimited by submarine escarpments can be observed disrupting the other bulges caused by the landslides driven by the Mw6.2 event in 2007. Thus, our interpretation differs from Van Daele et al. (2013) and Lastras et al. (2013), who proposed the sags on PCB exclusively as a break‐through formed by the direct impact of the Punta Cola landslide. We propose these features resulted from an earthquake seafloor rupture with greater slip along the northern segment of PCF, evidenced by a well‐developed fault zone reaching up to the seafloor surface in the northern profiles (SL‐05 and SL06; Figures 4 and 5), with respect to the southern profile (SL‐07; Figure 6). A local subsidence occurred associated to a relaxation lapse generated in the transpressive structure, overimposed by submarine landsliding phenomena (i.e., Kodaira et al., 2012). This would has produced a local rotation of blocks driving an apparent amplification of the vertical offset along the escarpments, with secondary normal faulting at shallow depths (Figures 7a, 7b, and 7c). The 3.5 kHz shallow seismic profiles carried out in 1995 (CIMAR‐ 1) did not show any evidence of deformation of the sea floor in front of the PCF area (Araya‐ Vergara, 2011), supporting our hypothesis of submarine earthquake surface rupture driven by the Mw6.2 event during the 2007‐AYSS (Figures S13 and S14). Sedimentary flows driven by the impact of PCLS may have used this tectonic depression as a preferential path for deposition. This stresses the previous interpreta-tion of Van Daele et al. (2013), who suggest that the entire deformainterpreta-tion affecting the Aysén Fjord in front of Punta Cola (Figure 3b) is sedimentary in origin, involving deeper layers of the sedimentary infill (Type 4 after the model by Schnellmann et al., 2005). In contrast, our interpretation can explain this variant of the model considering these deeper levels, not exclusively as a ramp‐flat system but rather as a part of the faulted zone along the PCF (Figures 7a and 7b), where it is possible to differentiate between tectonic deformation— affecting from deeper strata up to the seafloor—and synsedimentary deformation limited to shallower levels. Therefore, the singular geometry of PCB seen in the plan (opened in contrast to the other bulges) is in partly related to surface submarine rupture of PCF.
Seismic profiles SL‐05 and SL‐06 clearly show sediment layers disrupted by a normal fault in the area, where a 650 m long escarpment is visible (Figure 3b), with a bathymetric change of ~2 m associated with the QF trace (Figure 3d). This escarpment is parallel to the fault trace projected into the Aysén Fjord, proposed by Vargas et al. (2013). However, alternatively to the statement of Wils et al. (2018), we suggest that this escarpment does not correspond to a 2007 event fault scarp but rather to an ancient fault scarp draped by the younger sedimentary infill because our profiles SL‐05 and SL‐06 show the fault tip between ~17.9 and 14.6 m b.s.f. (Figures S9 and S10). Thus, we interpret that the Mw6.1 dextral‐normal event that occurred dur-ing the 2007‐AYSS along the QF, could not have reached the surface at the Aysén Fjord sea bottom. No surface rupture feature can be associated with 2007‐AYSS along the RCF according to our observations in our seismic profile data, in which the tip of the RCF ranges between ~109.2 and 27.2 m b.s.f (Figures S9 and S10).
The complex geometry of the structures in the area could generate several scenarios for paleo‐earthquakes that may have left a record inside the fjord in the form of soft‐sediment deformation and/or vertical offset distribution of the reflectors on both sides of a single structure. The action of these faults could have been presented in several ways but with two extreme scenarios. Thefirst one involves individual faulting for each structure through time, resulting in different recurrences for each fault, and, therefore, each paleo‐event would be associated with a single structure. For us, this approach does not appear tofit as well with the
complex tectonic setting of the area and even less so with the structural domain—the transfer zone—in the LOFS. We would expect interaction between structures, as evidenced by the record of the recent events dur-ing 2007, as discussed later in this work.
The second group of scenarios could imply multifaulting events that can occur when coseismic ruptures between two or more structures exist. These events can be favored by other factors such as the presence of fluids (Legrand et al., 2011) and static stress transfer between structures constituting the same fault system or the megathrust itself. Examples of such events, but over shorter time scales, are the 2010 Canterbury earthquake sequence in New Zealand (e.g., Beavan et al., 2012), the 2011 El Mayor‐Cucapah in Mexico (e.g., Fletcher et al., 2014) and the 2016 Kaikoura earthquakes in New Zealand (e.g., Hamling et al., 2017). These types of phenomena show difficult paleoseismological inferences and seismic hazard assessment from simplistic models based on single fault ruptures (Stirling et al., 2017).
By considering average sedimentation rates from the PLU (~25 mm/yr, between 12 and 6 kyr Cal BP), repre-senting the transgressive phase of the sedimentary infill of the inner Aysén Fjord, we speculate that the last seven paleolandslides, with a similar sedimentary imprint that resulted from earthquakes nucleated along active faults in the area, similar to the Mw6.2 during the 2007‐AYSS. Evidence show that landslides related to the 1960 Mw9.5 Valdivia earthquake have been superficial, restricted to soil and of relatively small volume (Wright & Mella, 1963) while landslides related to the 2007 Mw6.2 Aysén earthquake sever-al tens of million m3large deep seated and in bedrock (Oppikofer et al., 2012). Thus, the deep seated landslides that enter Aysén Fjord should only be from large, local ruptures and not from the subduction zone (e.g., 1960‐style events). Using our estimations these paleoevents occurred close to ~8,315 to ~7,115 (MDU‐ 07), ~6,837 to ~6,238 (MDU‐06), ~5,576 to ~4,675 (MDU‐05), ~4,353 (MDU‐04), ~3,576 (MDU‐03), ~2,648 (MDU‐02), and ~1,344 (MDU‐01) yr BP. If our assumptions about sedimentation rates and timing are correct, these events occurred approximately every ~1,100–1,500 kyr in the Holocene epoch (Figure S12).
6.3. Seismic Migration and Seismotectonic Model
Shallow earthquakes recorded here are generally located in thefirst 10 km of the upper crust (Figure 9a). At a preliminary view, these events appear to have a random distribution. To explore this, we generated a first‐order 4‐D seismotectonic model (space and time; Figure 9). By using different observation windows (day‐to‐day and month‐to‐month), it is possible to distinguish patterns of seismic activity revealing cluster‐like behavior. We establish a first‐order association between each seismic cluster and the spatial loca-tion of the QF, RCF, and PCF, as well as with other minor faults proposed as lineaments in the area that would have been involved in later phases during the 2007‐AYSS.
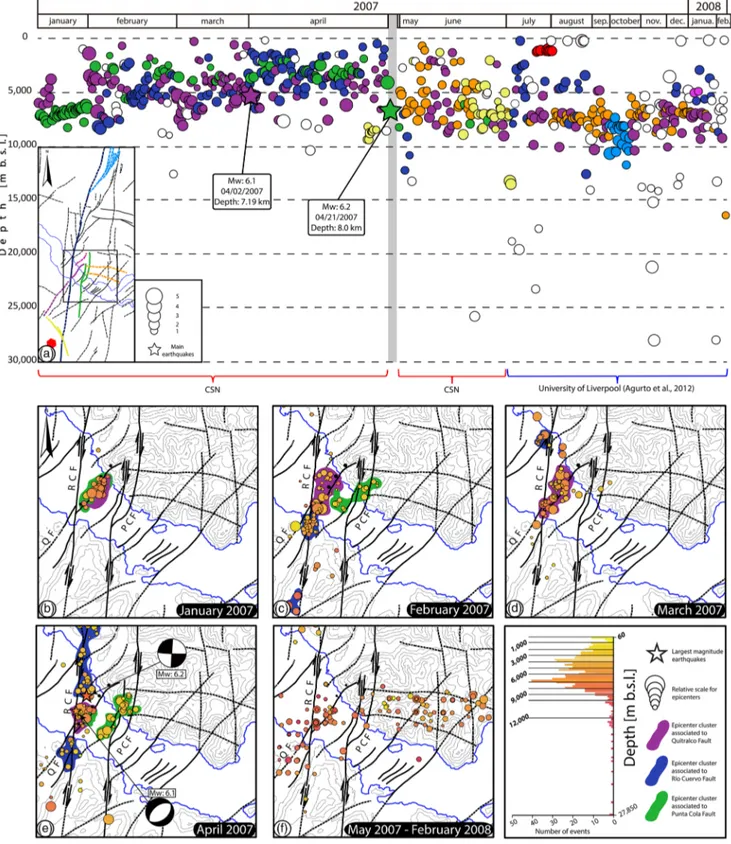
On January 2007, two NE‐SW shallow and deeper clusters of epicenters occurred close to the QF trace (Figure 9b). The depth of the earthquakes ranges between 6.0–8.2 km with local magnitudes of 2.0≤ ML≤ 4.7. The distinction between the two clusters, which we have interpreted as an expression of two independent ruptures, is clear in terms of time and depth (Figure 9a). The association of both clusters with some of the nearby structures was done by (a) proximity, (b) projection of the structure in depth, and (c) the degree of deformation absorbed by each fault recorded in the geological record. In this way, we associ-ate the deepest cluster to the PCF and the shallowest cluster with the QF (green and purple circles and envel-opes, respectively, in Figures 9a and 9b).
Later, in February 2007, seismicity migrated southward, with depths ranging between 3.9 and 8.7 km and magnitudes between 1.3≤ ML≤ 5.0. We tentatively associate two clusters to the RCF (blue circles and envel-opes; Figures 9a and 9c). Well‐defined clusters were located near the RCF‐QF intersection, with depths ran-ging between 3.3–6.1 km and magnitudes between 1.5 ≤ ML≤ 3.2. We interpreted this seismic activity as a prolongation of the seismicity developed in January. Seismicity depths ranged from 1.7–7.4 km with magni-tudes from 1.1≤ ML≤ 5.3. In addition, some minor epicenters appeared near PCF in contrast with the dee-per seismic activity previously seen (depths: 2.0–3.4 km; 1.0 ≤ ML≤ 3.1; green circles and envelopes in Figures 9a and 9c). We interpret this shallowing in the seismicity as subsequent earthquake ruptures propa-gated toward the surface.
QF concentrates most of the seismic activity in March (Figure 9d). Hypocenters range between 2.0 and 6.8 km in depth with magnitudes of 1.0≤ ML≤ 4.8. This seismic activity moves closer to the surface on
Figure 9. Seismic migration of the 2007‐AYSS. Fault map and seismological data (Agurto et al., 2012; Barrientos et al., 2007) were used. (a) Temporal
evolution of the seismic sequence vs. the depth. Green circles correspond to earthquakes associated with PCF. Purple circles indicate QF. Blue circles indicate RCF. Orange circles indicate the group of guidelines identified on the northern flank of the fjord. Yellow circles indicate a NW‐SE line located south of the study area, and light blue circles indicate a branch of the RCF located north of the study area. The mini‐map specifies each fault and lineaments with its corresponding color. (b) January 2007. (c) February 2008. (d) March 2007. (e) April 2007. (f) May 2007 to February 2008. A warm color scale is used to highlight the depth of each event. Epicenters of Mw6.1 and Mw6.2 are marked with stars. Epicenter clusters, which we associate with each active fault involved in 2007‐AYSS, are colored with purple (QF), blue (RCF), and green (PCF) envelopes.
the following days (Figure 9a). Additionally, a small cluster north of the study area and west of the RCF trace is also well defined (depths: 5.0–6.4 km; ~1.0 < ML≤ 4.1).
April 2007 is the most interesting observational time window in the sequence due to the energy released and other phenomena triggered by the two main earthquakes (Mw6.1 and Mw6.2). Despite this, as can be observed in Figures 9a and 9e, the concentration of earthquakes in each area associated with QF and PCF is lower than in the previous months. This is mainly due to and is more noticeable in the case of the PCF, a void in the information caused by the damage to the seismological equipment associated with the Mw 6.2 event. Nevertheless, activity associated with these faults is distinguishable within our model. PCF plays a more important role due to the presence of an NW cluster characterized by shallow depths (1.8–3.7 km, green circles and envelope in Figures 9a and 9e) located near the area where the surface rupture is observed. In addition to the geophysical and geological observations already exposed, this clarifies the moment when the subsurface rupture of QF and superficial rupture of PCF were generated.
It is plausible to expect that during the period without local seismic networks (i.e., no data); aftershocks occurred in QF and PCF. We have summarized the period between May 2007 and February 2008 in Figure 9f for the inner fjord area, and more data are shown in Figure 9a. Unlike previous months where seis-mic activity was approaching the surface and ended mostly within thefirst 5 km, the phase after the peak
Figure 10. Three‐dimensional geometric model of the LOFS in the study area. (a) Seismogenic faults projected at the scale of the fjord and its surroundings. A
digital elevation model based on 1:50,000 topographic sheets from the Chilean Army Geographic Institute (IGM) with a SPOT‐image is superimposed on the fault model. (b) Close to the main structures (RCF, QF and PCF) involved in 2007‐AYSS. Red spheres correspond to earthquakes used for the generation of fault planes. The green sphere corresponds to Mw6.1. The yellow sphere corresponds to Mw6.2.
stage of the 2007‐AYSS was characterized by a deepening of the activity (between ~5 and ~10 km) and by a more important role of other structures, some of which are located outside the study area (yellow and light blue in Figure 9a). In the inner fjord area, a W‐E migration was predominant and can be associated with the approximately E‐W lineaments (orange circles in Figure 9a) located on the northern flank of the fjord (Vargas et al., 2013).
Finally, we present a 3‐D seismotectonic model of the faults across the Aysén Fjord involved in the 2007‐AYSS (Figure 10). The constraints used are mostly the hypocenter clusters, focal mechanisms solutions of the main earthquakes, interpretations of the seismic profiles, and our structural view based on previous field observations (Thomson, 2002; Vargas et al., 2013). All of these data were used to draw planes fitting the hypocentral distribution (e.g., Alparone & Gambino, 2003; Wan et al., 2008; Figure S15). The proposed fault planes present soft angle breaks according to the general geometry observed for this type of structure (e.g., Sylvester, 1988; Thomson, 2002). Our seismotectonic model presents similarities with the theoretical model of Thomson (2002), characterized by approximately NS LOFS structures forming a positiveflower structure at a crustal scale, together with main NE striking dextral‐normal branches of the LOFS, defining a major fault transfer zone in the area (Thomson, 2002; Vargas et al., 2013).
According to our seismotectonic model (Figure 10), we suggest that the 2007‐AYSS and prior similar‐sized events found in our seismic profiles could be the result of static stress transfer and seismic migration from the lower‐ductile to the brittle continental crust. This has been widely demonstrated in the literature, where the tendency is for earthquakes of a medium to large magnitude in crustal faults nucleates at the base of the brittle crust (e.g., Das & Scholz, 1983; Scholz, 1988). This condition, observed in other faults in similar tec-tonic contexts (e.g., Sumatran Fault: Bellier & Sébrier, 1994; Muraoka et al., 2010), would explain the begin-ning of the sequence at low depths. We propose this phenomena mainly based on the hypocenters general tendency at deep during thefirst four months (Figure 9). We do not rule a mixed origin related to a combined fluid‐driven mechanism and intra‐arc tectonic activity, as other works have proposed (Agurto et al., 2012; Legrand et al., 2011). Geologic slip rates along this fault system are unknown in the study region, but once considering modeled based on extremely limited input data slip rates in the order of 32 ± 6 m/kyr since the Miocene, as inferred from thermochronology and displaced granites along the LOFS to the north from our study region (Adriasola & Stöckhert, 2008; Rosenau et al., 2006), it is possible to infer an important seismic potential along active faults of this major fault system (Vargas et al., 2013), which is necessary to consider in future seismic hazard assessment in the region. In light of the evidence we present here showing shorter recurrence intervals between events than postulated previously, having new slip rates here will be of great importance.
7. Conclusions
To understand earthquake phenomena along active fault systems, it is necessary to have an extensive and detailed recognition of the structures and assess fault behavior at millennial time scales. Aysén Fjord is located in the Patagonian Andes of Chile and found in a unique tectonic setting adjacent to a trench‐ ridge‐trench triple junction, along which stress partitioning induces active faulting along the major LOFS. Here, the 2007‐AYSS occurred from January 2007 to February 2008, which culminated with a Mw6.2 event. Faults within the LOFS (Vargas et al., 2013) were responsible for the crustal seismicity that occurred during this period that lead to casualties (e.g., Naranjo et al., 2009; Sepúlveda et al., 2010; Sepúlveda & Serey, 2009). Extensive landslides that occurred during 2007 were the main factor, due to generation of large displacement waves when rock avalanches that were triggered during the earthquakes entered Aysén Fjord, in the eco-nomic impacts and life loss.
Seismicity data based on two local seismic networks were deployed from January and April 2007 (Barrientos et al., 2007; Russo et al., 2011), and July 2007 and February 2008 (Agurto et al., 2012) show involvement in the seismic sequence of the Punta Cola, Río Cuervo, and Quitralco faults. Geological data in thefield (Vargas et al., 2013) show evidence for recent fault activity at Punta Cola and Río Cuervo faults. Active source seismic data from Aysén Fjord show long term Late Quaternary evidence of post‐LGM (and likely post‐12 kyr) defor-mation of marine fjord infill sedimentation, due to faulting in Punta Cola, Río Cuervo, and Quitralco faults. Detailed analysis of the seismic data shows that Punta Cola Fault ruptured the seafloor along its northern segment during the main Mw6.2 earthquake in 2007. Meanwhile, Río Cuervo, and Quitralco faults, likely