UNIVERSITY
OF TRENTO
DIPARTIMENTO DI INGEGNERIA E SCIENZA DELL’INFORMAZIONE
38123 Povo – Trento (Italy), Via Sommarive 14
http://www.disi.unitn.it
AN ITERATIVE PROCEDURE FOR COMBINING THE
ADVANTAGES OF A FREQUENCY AND
MULTI-RESOLUTION INVERSION ALGORITHM
D. Franceschini, M. Donelli, E. Tamanini, and A. Massa
January 2011
AN ITERATIVE PROCEDURE FOR COMBINING THE ADVANTAGES OF A MULTI‐FREQUENCY AND
MULTI‐RESOLUTION INVERSION ALGORITHM
D. Franceschini, M. Donelli, E. Tamanini, and A. Massa Department of Information and Communication Technology, University of Trento, Via Sommarive 14, 38050 Trento, Italy, Email: [email protected], [email protected], [email protected] ABSTRACTStarting from the iterative multi‐scaling approach previously studied for monochromatic illuminations, two multi‐ resolution strategies for dealing with multi‐frequency inverse scattering experiments have been developed. The first procedure is based on the integration of the iterative multi‐scaling algorithm into a frequency‐hopping reconstruction scheme, while in the second one the multi‐frequency data are simultaneously processed exploiting a multi‐resolution expansion of the problem unknowns. The numerical and the experimental analysis presented in this contribution concern with a preliminary assessment of the reconstruction effectiveness of the proposed approaches in comparison with a monochromatic multi‐step process.
1. INTRODUCTION
The reconstruction of the electromagnetic properties of an inaccessible area of investigation [1]‐[4] can be obtained processing the scattered electromagnetic radiation collected in a non‐invasive fashion on a measurement region external to an investigation area.
As far as microwave imaging techniques are concerned, they lack of sufficient collectable information on the scenario under test. In fact, the information content available from the scattering experiments cannot be arbitrarily increased by oversampling the scattered field [5] and, since single‐illumination measurement setups do not usually allow a detailed reconstruction of unknown scatterers, multi‐view and multi‐illumination acquisition systems have been proposed [6]. Moreover, several works have been focused on the potentialities of frequency‐hopping strategies [7] or on strategies aimed at the simultaneous processing of multi‐frequency data [8]‐[10]. Both the approaches can effectively improve the reconstruction capabilities of inverse scattering algorithms. However, some intrinsic drawbacks of multi‐frequency strategies have to be considered in order to efficiently exploit the frequency diversity. First of all, the increase of the data space unavoidably requires additional (with respect to the monochromatic case) software/hardware resources for the processing and the storage. Moreover, the object function modeling the dielectric and conductivity parameters of the medium depends on the working frequency according to a suitable Maxwellian model that describes the relationship between dielectric parameters and operating frequency [8] [9]. Undoubtedly, the advantages of using multi‐frequency measures have been widely investigated in the framework of single‐step inversion algorithms, but limited efforts have been dedicated to the integration of multi‐frequency strategies and multi‐resolution approaches [11]. Therefore, this paper investigates and assesses the profitable combination between a multi‐frequency approach and the IMSA multi‐step inversion algorithm [12][13] previously studied facing monochromatic data. Such an integration is expected to provide effective advantages since multi‐frequency strategies based on the IMSA could better exploit the benefits of a multi‐resolution expansion of the unknowns space ([12]‐[15]) taking into account the enlarged set of information coming from the scattering experiments at different frequencies. In the following Sections, the mathematical formulation of the multi‐frequency IMSA is briefly presented (Sect. 2) and a set of representative synthetic as well as experimental results are reported in Sect. 3. Finally, Sect. 4 concludes the paper.
2. MATHEMATICAL FORMULATION
A two‐dimensional scenario characterized by an inhomogeneous cross section is assumed. The investigation area is illuminated by a set of monochromatic ( being the working frequency of the
I
D
Φ
f
φφ
‐th illumination,φ
= ,...,
1
Φ
)incident electric fields TM‐polarized impinging from
V
different directions (E
vinc,φ(
x
,
y
)
z
ˆ
,v
=
1
,...,
V
,φ
= ,...,
1
Φ
) The multi‐frequency information collected through the scattered radiationE
vscatt,φ(
x
m,φ,
y
m,φ)
z
ˆ
at points belonging to the observation domain can be exploited for reconstructing the following contrast function p v p vM
m
,=
1
,...,
, OD
o rf
y
x
j
y
x
y
x
ε
π
σ
ε
τ
φ φ2
)
,
(
1
)
,
(
)
,
(
=
−
−
(1))
,
(
x
y
rε
andσ
(
x
,
y
)
being the relative permittivity and the conductivity, respectively. The object function (1) is related to the scattered field in the observation domain, , , and to the incident field in the investigation domain, ,)
,
(
, , ,φ mφ mφ scatt vx
y
E
x
m,φ,
y
m,φ∈
D
O)
,
(
,x
y
E
vincφx
,
y
∈
D
I, through the Lippmann‐Schwinger scattering equations [12]{
( , ) ( , )}
) , ( , , , , , x y x y E x y E tot p v ext v m m scatt vφ φ φ =Α φτ
φ (2) O m my
D
x
,φ,
,φ∈
ID
y
x
,
∈
{
( , ) ( , )}
) , ( ) , ( , int, , , x y E x y A x y E x yEvincφ = vtotφ − vφ
τ
φ vtotp (3)I
D
y
x
,
∈
where and indicate the external and internal scattering operators, respectively. Eqs. (2) and (3) have to be solved in order to obtain the contrast function ext v,φ
Α
int ,φ vΑ
)
,
(
x
y
φτ
,φ
= ,...,
1
Φ
. Toward this aim two possible multi‐frequency multi‐resolution strategies have been developed. 2.1. Multi‐resolution Frequency Hopping Strategy A frequency hopping scheme can be efficiently integrated in the IMSA by exploiting the multi‐frequency data set in a cascade fashion starting from the lowest available frequency (f
=
f
1).At each hop of such a strategy (
φ
= ,...,
1
Φ
), a nested multi‐scaling procedure ofs
φ=
1
,...,
S
φ optimization steps is performed in order to processes the monochromatic data‐set related to theφ
‐th frequency.This frequency hopping multi‐resolution (IMSA‐FH) procedure consists of the following steps:
- Initialization. The investigation domain
D
I is partitioned intoN
φ sub‐domains chosen taking into account the information content of the scattered field [9] atf
=
f
φ. Then, the problem unknowns are initialized with the free‐space configuration 1 , 0 , 1 , ,φ(
,
)
φ= ==
φ(
,
)
φ= φ φx
y
E
x
y
E
vinc s tot s v (4) and(
,
)
0(
,
)
0 , 1 ,x
y
x
y
s sτ
τ
φ φ φ φ = ==
(5)if
φ
=
1
, otherwise the profile reconstructed at the convergence step of theφ
−
1
‐th frequency stage is suitably mapped into the investigation domain:)
,
(
)
,
(
, 1 0 , ,x
y
E
x
y
E
vtot s tot s vφ ==
φ− φ φ (6))
,
(
)
,
(
1 , 1 0 ,x
y
Sx
y
s s ==
− φ− φ φ φ φτ
τ
(7)- Low‐order Reconstruction. The first step of the multi‐scaling procedure at each hop aims at obtaining a coarse
reconstruction of the problem unknowns through the minimization of a low‐order cost function
[
]
[
]
∑∑
∑∑
∑∑
∑∑
= = = = = = = = + − + − = Ψ V v N n n n inc v V v N n n n tot v n n v n n tot v n n inc v V v M m v m v m scatt v V v M m n n tot v n n ext v v m v m scatt v y x E y x E y x A y x E y x E y x E y x E y x A y x E v v v v 1 1 2 , 1 1 2 1 , , 1 , int , 1 , , , 1 1 2 , , , 1 1 2 1 , , 1 , , , , , ) 1 ( ) , ( ) , ( ), , ( ) , ( ) , ( ) , ( ) , ( ), , ( ) , ( , , , , φ φ φ φ φ φ φ φ φ φ φ φ φ φ φ φ φ φ φ φ φ φ τ τ (8)- Higher‐order Reconstructions. Successively, thanks to a clustering procedure [13] that identifies a set of regions‐of‐interest (RoIs), a high resolution representation of the unknowns can be retrieved performing an iterative minimization of the cost function (8). In fact, at each step the unknowns are looked for using the
following multi‐resolution expansion
φ s
Q
)
,
(
)
,
(
)
,
(
, ,x
y
x
y
B
sx
y
s s s s s s n R r n n N n s s φ φ φ φ φ φ φ φ φ φ φτ
τ
=
∑∑
(9))
,
(
)
,
(
)
,
(
, , , ,x
y
E
x
y
B
x
y
E
s s s s s s s s s n R r n n N n tot v tot v φ φ φ φ φ φ φ φ φ φ φ=
∑∑
(10) φ φ s sR
r
=
1
,...,
being the resolution index and indicates the n–th rectangular basis function as the s‐ th step of the)
,
(
x
y
B
s nφφ
‐th frequency. - Termination of the frequency hopping Multi‐resolution scheme. The multi‐scale process is stopped when a set of stability criteria on the reconstruction [12] hold true and the solution of theΦ
‐th frequency is assumed as the final estimated profile of the multi‐scaling frequency hopping strategy. 2.2. Multi‐frequency Multi‐Scaling Approach The IMSA was originally proposed in [12] for the reconstruction of single scatterers and extended in [13] for multiple‐ objects for processing single‐frequency data. Its generalization to the multi‐frequency case (IMSA‐MF) can be obtained by carefully performing the following modifications concerning the object functions and the construction of the cost function: - Contrast Function Model. By means of some manipulations of eq. (1), the following expression for the contrast function can be obtained[
(
,
)
]
Im
[
(
,
)
]
Re
)
,
(
x
y
f
f
j
y
x
y
x
φ φ φ φ φτ
τ
τ
=
+
(11)where the value of the contrast at the
φ
‐th frequency,τ
φ(
x
,
y
)
, is related to that of the reference frequencyφ
function,
τ
φ(
x
,
y
)
. This approach allows to avoid the increase of contrast function unknowns and hence the multi‐frequency data space can be profitably exploited. However, the internal fields have to be estimated for each working frequency. - Multi‐Frequency Multi‐Scaling Reconstruction. Likewise the standard IMSA, a multi‐scaling procedure of s=1,...,S steps is performed in order to define the multi‐ resolution expansion of the unknown parameters by minimizing at each step of the iterative profile retrieval the following multi‐frequency cost function[
]
[
]
∑∑∑
∑∑∑
∑∑∑
∑∑∑
Φ = = = Φ = = = Φ = = = Φ = = = + − + − = Ψ 1 1 1 2 , 1 1 1 2 , , , int , , , , 1 1 1 2 , , , 1 1 1 2 , , , , , , , ) ( ) , ( ) , ( ), , ( ) , ( ) , ( ) , ( ) , ( ), , ( ) , ( , , , , φ φ φ φ φ φ φ φ φ φ φ φ φ φ φ φ φ φ φ φ φ φ φ φ φ τ τ V v N n n n inc v V v N n n n tot s v n n s v n n tot s v n n inc v V v M m v m v m scatt v V v M m n n tot s v n n s ext v v m v m scatt v s y x E y x E y x A y x E y x E y x E y x E y x A y x E v v v v (12) 3. NUMERICAL ANALYSISIn this Section, a selected set of comparative reconstruction results are presented and discussed. The aim is to preliminary assess the reconstruction capabilities of the proposed multi‐resolution strategies (IMSA‐MF and IMSA‐FH) in comparison with the standard IMSA (referred in the following as Single‐Frequency Iterative Multi‐Scaling Approach ‐ IMSA‐SF). Figure 1. Layered Profile – Reference distribution of the object function
Fig. 1 shows the geometry of the considered test case. It consists of a layered cylindrical structure centred at (
λ
6
.
0
=
−
=
ref c ref cy
x
λ
being the wavelength atf
=
6
GHz
) in a square investigation domain=
3
λ
I DL
‐sided (for convenience, the distribution of Fig. 1, and as well as those concerning the profile reconstructions, has been cut atλ
4
.
0
−
=
cutx
). The object function of the inner square layer (L
in=
0
.
3
λ
in side) isτ
in=
0
.
5
, while that of the outer layer (L
in=
0
.
9
λ
‐sided) is equal toτ
out=
2
.
0
. The investigation domain has been illuminated by a set of incident plane waves impinging from equally‐spaced directions. For each illumination, multi‐frequency data ( , , , ) have been simulated in a set of measurement points located on a circle8
=
V
3
=
Φ
f
1=
5
GHz
f
2=
6
GHz
f
3=
7
GHz
λ
3
in radius. Moreover, the data have been blurred adding a Gaussian noise characterized bySNR
=
20
dB
. Because of the different information content available at each frequency [5][15],M
v,1=
31
,M
v,2=
37
, andfield samples have been taken into account at , and , respectively. Therefore,
44
3 ,
=
v144
2=
N
, andN
3=
169
basis functions have been used for the IMSA‐FH and the IMSA‐SF), whileN
(
R
s)
=
N
3, , has been chosen for the IMSA‐MF inversion.S
s
=
1
,...,
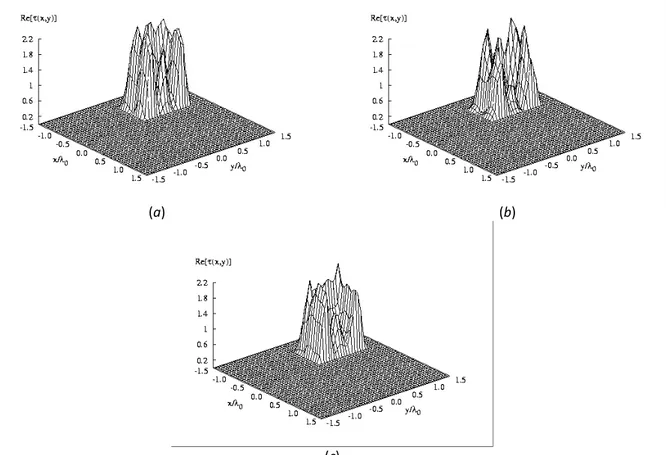
In order to carry out a comparative study, the results of the inversion procedure for the IMSA‐SF simulations are shown in Figs. 2(a)‐(c), while the result for the IMSA‐MF approach is shown in Fig. 3. (a) (b) (c) Figure 2. Layered profile – Reconstructed distributions (SNR=20dB) by means of the IMSA‐SF at the working frequency of (a) f1=5GHz, (b) f2=6GHz, (c) f3=7GHz As expected, the plots of the object function distribution point out that the multi‐frequency data improves both the refinement of the outer and the inner layer. More rigorously, such a qualitative impression can be numerically evaluated by computing the corresponding values of the error figures defined as in [12].
Figure 3. Layered profile – Reconstructed distributions (SNR=20dB) by means of the IMSA‐MF f =5,6,7GHz
The IMSA‐MF turns out to be better guaranteeing enhanced performances in the whole considered frequency range used for the IMSA‐SF inversion. In particular, observing the errors histogram of Fig. 4, it is noticed that
{
}
IMSA MF tot SF IMSA tot − − =χ
φ≥
χ
φ2
.
21
min
1,2,3 ,min
φ=1,2,3{
χ
intIMSA−SFφ}
≥
1
.
20
χ
intIMSA−MF and{
}
IMSA MF ext SF IMSA ext − − =χ
φ≥
χ
φ1
.
58
min
1,2,3 . Figure 4. Layered Profile – Values of the quantitative error figures at the convergence. It is now mandatory to compare the IMSA‐MF to the multi‐resolution frequency hopping approach (IMSA‐FH) which has been run considering the Φ=3 different frequencies used for the monochromatic simulations whose results arepresented in Figs. 2(a)‐(c). The dielectric profile retrieved with the IMSA‐FH strategy is shown in Fig. 5. It can be noticed that the IMSA slightly takes advantage of the frequency hopping scheme.
As a matter of fact, it turns out that
χ
totIMSA−FH=
4
.
19
, int=
28
.
69
and . −FH IMSAχ
χ
extIMSA−FH=
1
.
77
Figure 5. Layered Profile – Reconstructed distributions (SNR=20dB) by means of the IMSA‐FH. 4. CONCLUSIONSIn this paper, a preliminary comparative assessment of two multi‐resolution approaches exploiting multi‐frequency data has been carried out.
As a matter of fact, the IMSA‐MF has shown a better effectiveness in processing multi‐frequency information with respect to the multi‐scaling inversion scheme based on the frequency hoping strategy. Our first objective was finding some indications on the most suitable strategy able to improve in a non‐negligible fashion the reconstruction accuracy with an acceptable amount of computational resources.
However, further researches will be dedicated to the comparative studies of the proposed approach with other traditional single‐step inversion schemes also considering experimental datasets.
5. REFERENCES
1. S. R. H. Hoole, S. Subramaniam, R. Saldanha, J.‐L. Coulomb, J.‐C. Sabonnadiere, “Inverse problem methodology and finite elements in the identifications of cracks, sources, materials, and their geometry in inaccessible locations,” IEEE Trans. Magn., vol. 27, pp. 3433–3443, May 1991.
2. J. C. Bolomey, A. Izadnegahdar, L. Jofre, Ch. Pichot, G. Peronnet, M. Solaimani, “Microwave diffraction tomography for biomedical applications,” IEEE Trans. Microwave Theory Tech., vol. 82, pp. 1998–2000, Nov. 1982. 3. P. M. Meaney, M. W. Fanning, D. Li, S. P. Poplack, and K. D. Paulsen, "A clinical prototype for active microwave imaging of the breast," IEEE Trans. Microwave Theory Tech., vol. 48, pp. 1841‐1851, Nov. 2000. 4. D. J. Daniels, Subsurface Penetrating Radar. London, U. K.: IEE Press, 1996. 5. O. M. Bucci and G. Franceschetti, "On the degrees of freedom of scattered fields," IEEE Trans. Antennas Propagat., vol. 37, pp. 918‐926, Jul. 1989.
6. S. Caorsi, G. L. Gragnani, and M. Pastorino, "An approach to microwave imaging using a multiview moment method solution for a two‐dimensional infinite cylinder," IEEE Trans. Microwave Theory Tech., vol. 39, pp. 1062‐ 1067, Jun. 1991.
7. O. S. Haddadin and E. S. Ebbini, "Imaging strongly scattering media using a multiple frequency distorted Born iterative method," IEEE Trans. Ultrason. Ferroelect. Freq. Contr., vol. 45, pp. 1485‐1496, Nov. 1998.
8. K. Belkebir, R. Kleinmann, and C. Pichot, "Microwave imaging ‐ Location and shape reconstruction from multifrequency data," IEEE Trans. Microwave Theory Tech., vol. 45, pp. 469‐475, Apr. 1997.
9. O. M. Bucci, L. Crocco, T. Isernia, and V. Pascazio, "Inverse scattering problems with multifrequency data: reconstruction capabilities and solution strategies," IEEE Trans. Geosci. Remote Sensing, vol. 38, pp. 1749‐1756, Jul. 2000.
10. A. G. Tijhuis, K. Belkebir, A. C. S. Litman, ans B. P. de Hon, "Theoretical and computational aspects of 2‐D inverse profiling," IEEE Trans. Geosci. Remote Sensing, vol. 39, pp. 1316‐1330, Jul. 2001.
11. A. Baussard, "Inversion of multi‐frequency experimental data using an adaptive multiscale approach", Inverse
Problems, vol. 21, pp. S15‐S31, Dec. 2005.
12. S. Caorsi, M. Donelli, D. Franceschini, and A. Massa, "A new methodology based on an iterative multiscaling for microwave imaging," IEEE Trans. Microwave Theory Tech., vol. 51, pp. 1162‐1173, Apr. 2003.
13. S. Caorsi, M. Donelli, and A. Massa, "Detection, location, and imaging of multiple scatterers by means of the iterative multiscaling method," IEEE Trans. Microwave Theory Tech., vol. 52, pp. 1217‐1228, Apr. 2004.
14. E. L. Miller and A. S. Willsky, "A multiscale, statistically based inversion scheme for linearized inverse scattering problems," IEEE Trans. Geosci. Remote Sensing, vol. 34, pp. 346‐357, Mar. 1996.
15. O. M. Bucci, L. Crocco, and T. Isernia, "An adaptive wavelet‐based approach for non destructive evaluation applications," in Proc. IEEE Antennas Propagation Symp., vol. 3, pp. 1756‐1759, 2000.