1
Faculty of Mathematics, Physics and Natural Science
Department of Chemistry
PhD in Chemical Science
XXXI Cycle
Development of nanomaterials and nanocomposites
for sensor applications
PhD Coordinator: Prof. Osvaldo Lanzalunga
Supervisor: Prof. Ilaria Fratoddi
External supervisor: Dr. Andrea Bearzotti
PhD Student: Paolo Papa
Final thesis
3
Preface
This thesis is the result of the required work necessary to obtain a Ph.D. degree in Chemical Science - XXXI cycle, of the University of Rome “Sapienza”. The work had an extension period from November 2015 until November 2018. This work has been fulfilled in two institutions research, both the Institute of Atmospheric Pollution (IIA) of the National Research Council (CNR) and at the Department of Chemistry of the University of Rome “Sapienza”. This
association allowed to develop a synergistic work on both the synthesis of new materials (thanks to the research group headed by Dr. Ilaria Fratoddi) and the subsequent applications and testing, in the sensors field (thanks to the experience of the sensor group of the CNR-IIA), with the aim to detect potentially harmful substances, both for the human and environmental health.
4
Abstract
In the everyday life, nanotechnology is gaining more and more space, covering many fields of applications, developing new nanomaterials. Due to their particular optical, electronic and catalytic properties, they are pushing the development of increasingly smaller, better and faster products.
This PhD work aims to explore the applicability of these nanomaterials, specifically in the sensors field. The whole work can be divided into two main parts.
The first one is based on the use of gold nanoparticles (AuNPs), suitably functionalized with bifunctional dithiols, to be applied in the sensing detection of vapour mercury. Gold nanoparticles, exploiting their high surface area to volume ratio and their strong affinity with mercury, present great potential in the sensing application. They show advantages in sensitivity, selectivity, stability and at last a very cheap cost, in order to be employed in wide areas of
monitoring. In fact, gold promptly adsorb mercury on its surface for a defined time of exposition, to be subsequently thermally desorbed and quantified with an analytical instrument. A second step of this work regarded the behaviour of two diffusive shelters, to be used with this AuNPs adsorption material. A comparative study has been performed both in at outdoor and indoor environments.
The second part of this work is based on the investigation of conducting polymers, such as polyaniline (PAni). This polymer, and the so obtained composite material, acquire interesting properties which can be used in optoelectronics, electrochemistry, catalysis or, as in the present work, used as sensor devices, detecting some dangerous gases, harmful to the human health (NH3, H2S, NO). Starting from its pristine undoped form, with a subsequent appropriate doping process, it has been added to some functionalized metal nanoparticles (AgNPs-TR), leading in this way to the formation of a composite compound. These polymers have been subsequently deposited on suitable interdigitated supports (by casting or dipping deposition) and subsequently exposed at low concentrations of pollutants (few ppb). From the measurements, very low
detection limits, combined with a good sensitivity and fast recovery time, have been reached in some gases detection.
5
Table of contents
Purpose of the thesis………...4
1. Introduction……….……….……….6
2. Sensor devices ……….……….……….8
3. Environmental mercury detection ………..………....9
3.1. Introduction………..…….9
3.2. Current active instruments in mercury detection……….…...12
3.3. Gaseous mercury adsorption mechanism on gold……….…..13
3.4. The use of gold nanoparticles in mercury detection………...14
4. Experimental………....16
4.1 Materials……….….16
4.2 AuNPs synthesis and characterizations……….…..16
4.3 Passive air samplers (PASs) preparation……….…....21
4.4 PASs measurements………..………..26
5. Comparison of different shelters for PASs expositions………...36
5.1. Diffusive sampling shelters………....37
5.2. Samplers preparation………..38
5.3. Samplers exposures and measurements………..39
6. Conducting polymers in sensing applications………..44
6.1. Use of conducting polymers in sensing devices……….44
6.2. Experimental………..45
6.3. Interdigitated electrode (IDE) support………....45
6.4. Materials……….46
6.4.1.
PAni solutions preparation………...46
6.4.2.
PAni (ES)-PVDF polymeric solution blends………...49
6.4.3.
PAni (ES)–AgNPs composites……….53
6.4.4.
Analysis and measurements……….53
7. General conclusions and future perspectives……….60
6
Purpose of the thesis
The spread of nanotechnology, referred to different scientific and technological areas, makes it one of the most interesting field of study for different research categories.
Of special interest are the studies based for the comprehension and prevention related to the environmental pollution, with regard to the preservation of the human and wildlife health. In this contest, the present project focuses its attention on two different branches, both dealing with nanostructures, applied for the detection of environmental pollutions.
One part of the work was focused on the detection of the environmental vapour gaseous mercury using gold nanoparticles (AuNPs), functionalized with the bifunctional thiols Biphenyl-4,4′-dithiol (BI) or p-Terphenyl-4,4′′-Biphenyl-4,4′-dithiol (TR), able to self-assemble in a stable network of interconnected nanoparticles as adsorbent material for the detection of both the Gaseous
Elemental Mercury (GEM) and the Gaseous Oxidized Mercury (GOM), which when considered as the whole gaseous mercury present in a defined ambient it is commonly indicated as Total Gaseous Mercury (TGM), both for indoor (expositing the material to defined concentrations) and outdoor (at the vapour mercury concentration of the environmental countryside) for adsorption studies, exploiting their affinity with mercury. The adsorbent AuNPs have been tested
customizing different diffusive holders and valuing the results. AuNPs-BI and AuNPs-TR, deposited onto quartz fibres, have been used in more than 30 thermal desorption cycles at 500 °C, showing over time a stable response and a high sensitivity at sub ppb concentration (lower than 2 ng m−3), also in the presence of interfering agents such as relative humidity.
Through the development of passive air samplers (PASs), it was possible to detect the vapour environmental mercury also at low detection levels of concentrations (1.5 ng/m3 of mercury). The goal was that to develop reliable devices, to be used as complement (or even replace in some case) to the use of mercury active sampling systems, which are the most used methodologies in nowadays environmental monitoring.
Secondly, the other part of the research was focused on the study of nanostructured conducting polymers, or composites blends with metals particles.
In this case, thanks to the well knows conduction properties of these polymers and their sensing capacity in presence of some gases, the goal of the research was to implement their sensing properties towards such gases (mainly H2S, NH3, NOx) in order to detect low concentrations
7
(few ppb). The techniques used were based on electric measurements, aiming to exploit their nanostructure characteristics and their quantum effects, to achieve a better response in the interaction between the gas and the material.
All the measurements were conducted with the use of customised gold interdigitated on silica supports, applying several voltage potentials and measuring in their resistivity in presence of such gases as a response. The tests have been performed at different concentrations, exposure times and applied voltages potential difference.
8
1. Introduction
Over the last decades, since its first introduction by the physicist Richard Feynman [1], nanotechnology, experienced a constant development, in many fields of the science, where, manipulate the matter at nanometric scale gave to the possibility to create materials with fundamentally new properties and functions.
This new field is expanding year by year with new researches, publications and applications in different fields.
Today, the prefix “nano-” is used to indicate a “billionth” or a factor of 10-9
. Therefore, in the metric system, the definition of nanometer (nm), is referred to one billionth of a meter (1·10-9 m). When it is used to indicate dimensions at atomic scale, the prefix of “nano-” is used and is often referred materials having at of at least one dimension ranging from 1 to 100 nanometers.
A decrease in the dimension’s material leads to an increase in the surface area to volume ratio and vice versa. In fact, at these nanoscale dimensions, a greater portion of atoms are present at the surface when compared to those inside. So, since the chemical reactions occur at the material surface, a given nanomaterial mass will be much more reactive than the same mass present in the bulk material. Moreover, some materials when present in their inert bulk dimension, become reactive when produced in nanoscale dimension.
The materials present in the nanometric scale (in contrast to the macroscopic scale), can be denoted by the presence of a high percentage of atoms on their surface, which, compared to the bulk material, give them different properties, different energies, reactions and electronic states, referred as quantum effects [2]. In general, nanomaterials and nanocomposites allow building up particular 3D nanoarchitectures with large surface-to-volume ratio, which lead to high catalytic activity with the surrounding environment [3][4][5].
In particular, AuNPs whose average size falls in the range of some hundreds of nanometers, can be considered as one of the leading materials in emerging fields such as catalysis or biocatalysis [6][7], optoelectronics [8][9], nanomedicine or drug delivery [10][11][12], thanks to their size-dependent properties and their chemical stability [13][14]. The modern wet-chemistry approach for the production of gold nanoparticles (AuNPs) received an increasing interest in recent years
9
for the challenging opportunity of isolating stable interconnected networks suitable for solid state applications [15][16]. The structural complexity and crystal growth of these covalent aggregates of nanoparticles was recently studied [17] and their structural thermal stability was investigated [18].
As chemical sensors, AuNPs garnered considerable attention for their potential to obtain fast and selective devices, able to detect low concentration analytes and a reliable measurable signal in response, both for external environment or indoor pollutants, so that to monitor the safe quality standards and to prevent potential negative health effects on humans or wildlife [19][20]. For this purpose, our attention focused on the use of gold nanoparticles (AuNPs) utilized for the detection of gaseous environmental mercury and on polymeric materials, based on conduction polymers, also used in detection of harmful gases, through the variation of their conduction responses. Despite the great attention devoted to this research field in the last years, there is still much more to uncover and investigate at the nanometric scale of these materials, considering that their great potential of applications is still not fully exploited.
10
2. Sensor devices
Given the particular purpose of this thesis, to have a good comprehension, a mention on the meaning of the word “sensor” is required. In the broader acceptance of the word, a sensor can be defined as an electronic component, or module, which purpose is to detect events, or changes, that happens in the environment where is exposed and send an electronic output with information to other electronic devices, frequently a computer processor.
For a good functionality, a sensor should be characterized by different parameters, which determine its efficiency. On this front, the research is always oriented to develop new sensors which have a better stability, sensibility, resolution and selectivity. All these parameters are necessary to have a good reliability in the responses of a sensor, towards the detected substances.
As following reported, in this work two kinds of sensing mechanisms will be taking in account. The first one is based on a passive adsorbent material, which is able to interact with a specific gaseous substance (adsorbing it on its surface) and later, desorbed and quantified by a detector. The second one is based on the use of chemiresistor, which term is a combination of two words: chemical and resistance (in this case is referred to the electrical resistance).
In this latter case, chemiresistors have been widely used in the development of sensor devices, where the variation of the electric resistance is related to the environment where the device is exposed, changing the output signal in response to the present chemical analyte’s concentration.
These chemiresistors, are generally based on the use of interdigitated supports where the sensing material is deposited. These interdigitated are constitute by a series of electrode fingers spaced by a gap, which, filled with the sensing materials, will reacting with the analytes
11
3. Environmental mercury detection
3.1. Introduction
In the last decades, among heavy metals, harmful for human health, the study on the elemental mercury and its compounds has gained more attention, leading to a better
understanding on its cycles and the consequent effects on the human and wildlife health [21][22][23].
In fact, through a microbial process, mercury can be converted in methylmercury [CH3Hg]+, which is highly hazardous for human and wildlife health, as it is a toxic and persistent bio-accumulative substance [24][25].
Mercury is naturally occurring in the environment, in air, water and soil. It is present in several forms: elemental mercury (Hg0, or inorganic mercury) and organic mercury compounds. It can have different emission sources, mostly naturally (such as volcanoes or forest fires) but lately, an increasing emission contribute came from the anthropogenic activities (artisanal gold mines, power plants, means of transportation). As a pollutant, mercury is important for living things, due to its toxicity and hazardous effects, even when is present at low concentration levels [26].
Mercury can be present in the atmosphere in various different forms, which can convert to each other. As reported by Gworek et al. [20] they can be listed as follow:
- GEM (Gaseous Elemental Mercury), when mercury is present in its elemental state, (Hg0);
- GOM (Gaseous Oxidised Mercury), when present in its oxidised forms;
- RGM (Reactive Gaseous Mercury), represents the oxidised forms of divalent mercury, Hg2+;
- TGM (Total Gaseous Mercury), represents the sum of all gaseous species of mercury; - PBM (Particle Bound Mercury), when present in particulate matter (HgP);
- TPM (Total Particulate Mercury), indicates all mercury compounds and unspecified chemical forms contained in particulate matter
- MeHg (Methyl Mercury), indicates the organic mercury compounds; - THg (Total Mercury), it is the sum of all the mercury species;
12
Among the TGM species, the GEM is valued as the dominant form, estimating a presence in the atmosphere > 95% [20] [27] [28]. In the long period, the GEM can be converted into GOM and PBM [29].
The GEM, being in its elemental state (Hg0), can persist in the atmosphere over a long period of time ranging from 0.5 to 2 years [28], before being oxidized and removed by dry or wet depositions. This long permanence of GEM in the atmosphere give it the time to distribute homogeneously, leading to a globally mean concentration with small differences. Generally, the current average concentration of TGM in the atmosphere ranges from 1.5–1.7 ng m−3 to 1.1–1.3 ng m−3, respectively referred to the northern and southern hemisphere, with some variation in the polar regions [22][30].
Many studies have been done trying to outline and understand all the atmospheric, lands and water cycles of the mercury. As reported by Driscoll C.T. et al. [22] an estimates scheme representing all the mercury environmental cycles, both with natural and anthropogenic sources, can be depicted in the Fig.1., where an estimation of 6500 to 8200 Mg yr-1 of mercury is released every year in the atmosphere, which more than half is emitted by natural sources. Estimating instead the total amount of mercury, emitted by the human activities up to 2010, Streets D.G. et
al. [31] reported a total of 1540 Gg of mercury, which, more that 73% have been emitted in the
environment from the 1850 onwards.
Once the mercury is emitted in the atmosphere, it enters in a complex biogeochemical cycle, that is important to study and to understand. As is evidenced in Fig.1, the atmosphere is the main transport pathway of mercury, where many oxidations, transportations and deposits take place.
Currently, an important amount of mercury emitted in the atmosphere is caused by anthropogenic activities, associated to the emissions and reemissions from natural events, even if is difficult to distinguish between the anthropogenic and natural mercury present in the air [32]. Among the anthropic activities, the main source comes from the fuel combustion (mainly coal) and artisanal small-scale gold mining (ASGM), where (in the last case) the highest mercury concentrations have been found.
From the various mercury species emitted, the elemental mercury (Hg0) is the most important. It is characterised by the much higher level of vapour pressure that allow to be distributed on long distances. The most significant reaction that occurs on the Hg0, for the
13
mercury removal from the atmosphere, is the oxidation process. Among the various oxidants that can react with Hg0 the ozone (O3) is the most important.
The proposed photochemical reaction that occurs can be reported as [20]:
Hg
0(g) + O3 (g) → HgO (s) + O2 (g)
Figure 1 – Estimated mercury cycles of mercury in the environment according to Driscoll C.T. et al. [22]
Understand these cycles can help us also to prevent and intervene, where is possible to limit the diffusion of mercury. For these reasons, in the past decades awareness in monitoring our environment has been growing, trying to intervene and limit that activities responsible of major anthropic sources. The understanding of these mercury cycles is important, especially because the atmosphere is the most significant means for the global diffusion of gaseous mercury. The mercury emitted in a local part of the world can be easily transported to another part, damaging some delicate ecosystems like the polar regions for instance.
To prevent the global mercury pollution, some important international conventions occurred over the years. One of the most important is the “Minamata Convention on Mercury”, held in Japan in 2013. This international treaty was purposed to protect the environment, the
14
human and the wildlife health from the effects of the mercury. It aims to phase out the existing mercury mines, to regulate the artisanal gold mines, to modify many products and processes where the mercury is involved and monitor all the environmental levels: air, water and ground [23].
To support the implementations of this convention, there are several international programs. One of them is the Global Mercury Observation System (GMOS). The GMOS is a long-term program, carrying highly precise observations and analysis on the presence of mercury in different Earth Systems, involving: oceans, atmosphere and lands; both in the Northern and Southern hemisphere. These programs are also useful to understand and monitor the cycles of mercury in the environment, modelling its paths from the sources, the transportation and the depositions (both wet and dry), valuing its globally impact on the living beings.
This chapter will approach the study of AuNPs, applied as sensitive material in the detection of aerial vapour mercury, where the use of a chemical reduction procedure of the HAuCl4 in the presence of bifunctional dithiols (BI, TR) and sodium borohydride as reducing agent, in order to have reduced in size and a long-tern stable AuNPs, with a simple synthesis at room temperature [33][34]. This was optimized, achieving a soluble AuNPs based network. Their interaction capacity and their efficiency will be valued, which, associated with the selectivity of the measurement instruments, offer a good opportunity of study and a great
potential of application and versatility for the vapour mercury detection of a wide range of areas.
3.2. Current active instruments in mercury detection
Currently in vapour mercury measurements, the mostly used instruments are the active sampling systems, which using an inner pump can sample a defined volume of air to analyse.
These systems are generally based on a gold preconcentration trap, which can collect the mercury present in the air (mostly in the form of elemental mercury), correlated to a defined volume of sampled air and, after a defined sampling time, are thermally treated, in order to release the adsorbed mercury. Successively, it is quantified through Cold Vapour Atomic Absorption Spectroscopy (CVAAS) or Cold Vapour Atomic Fluorescence Spectroscopy (CVAFS) techniques [35]. In this way it is possible to determine a defined amount of mercury which, known the volume of air sampled, is associated to a certain sampling rate (SR).
15
The advantages associated to these instruments can be manifold. First, is possible to obtain a fine temporal resolution in the measurements, generally of few minutes, associated to a high accuracy and precision. This allow to have reliable instruments useful in the measurement campaigns. But some shortcomings that limit the use of these instruments in wide monitoring areas, mainly, due to the necessary presence of qualified personnel in their use, the constant requirement of electricity and purified gas mostly given by gas cylinder, that make them unsuitable for the use in remote and/or poorly civilized areas are also associated to these features.
At present, one of the most reliable automated instruments, utilised in the air mercury monitoring is the Tekran® Model 2537A ambient mercury vapours analyser. Alongside the Tekran® Model 2537A, another important instrument, useful to calibrate and constantly to control the reliability of the data, is the Tekran® Model 2505, an ultra-precise and accurate vapour mercury calibration unit. It is composed by a closed vessel, which contain a small amount of liquid mercury to keep the inner chamber at a saturated gaseous mercury condition. It is employed to generate defined selected quantities and concentrations of vapour mercury. Other utilized instruments, able to detect and quantify speciated mercury, such as GOM and PBM, are the Tekran® 1130/1135/2537.
To overcome these limitations, researchers have developed alternative measurement systems, in particular based on the use of passive air concentrators [36][37]. The main advantage of these concentrators in the detection of gaseous mercury is the possibility of using them in a large distribution area, providing a high spatial sampling resolution. A common drawback is, in general, that these components can only be used once [38], with relatively high sampling costs. The adsorbent ability of passives is based on the capacity of some noble metals to have an adsorption of vapour mercury leading to the formation of an amalgam.
3.3. Gaseous mercury adsorption mechanism on gold
Gold is a well-known mercury adsorbent material. Thanks to its strong chemical affinity gold films were recently used for Hg detection, both as passive and transducer layer.
For example, Au films were used in quartz crystal microbalance (QCM) devices [39] or in optical based measurements [40] generally with fast response time and low detection limits. Surface acoustic wave (SAW) sensors with a gold film sensitive layer were also used in the presence of different vapour organic chemicals (VOCs), demonstrating a detection limit towards
16
Hg vapour of 4 ppbv at 75 °C, with limited cross-sensitivity effect when the relative humidity content was increased [41].
Furthermore the interaction of gold films with mercury has been extensively studied in literature [42] [43]. Kobiela T. et al. [44] preparing a gold film layer, deposited under ultra-high vacuum, and exposing it to Hg vapours, observed dramatic changes in the topography layer. In fact, the continuous gold layer was transformed into many isolated amalgam islands, changing the previously optical and electrical properties of the gold film.
The same results were obtained in the work of Fialkowski M. et al. [45] where a
continuous gold film, exposed to mercury vapours, leaded to the amalgamation of gold with the formation of well isolated islands.
This process that involves the formation of amalgamated islands can be explained, as reported by the work of Levlin M. et al. [46], as a place exchange process. In this mechanism an Au adatom, belonging to the first surface layer, is moved onto the top of the surface by a Hg atom. At this point the Au adatom works as nucleation for the formation of the island. Further Hg atoms, incorporating into the surface, can expel other Au adatoms, which will act as new nucleation centres for the formation of islands.
In the amalgamation process, the formation of the islands leads to the successive appearance of dendritic structures. It has also been observed that a high amount of grain boundaries, typical of nanostructured materials, results in a greater efficiency of the gold reactivity of the gold surface, with a generally faster and more efficient adsorption and mercury detection [47].
3.4. The use of gold nanoparticles in mercury detection
Nowadays, the use gold nanoparticles, in the gaseous mercury detection is increasingly taken hold. New papers are published, utilizing these AuNPs in active or passive detection systems. Quite recently, gold nano rods were used for mercury vapour plasmonic sensors, by studying the surface plasmon resonance (SPR) shift of gold nano rods upon exposure towards mercury vapour [48] and silver nanoparticles (AgNPs) embedded into a polymer film, able to detect either Hg°, Hg(I) and Hg(II) species [49].
In most published works, where AuNPs have been used as reusable Hg° sensor, a reduction in sensitivity after the thermal treatment cycles have been observed and in some case a reduction of 50% are reported [50].
17
AuNPs have also been used in conjunction of carbon and used as sorbent composites for Hg capture, giving interesting performances even in the presence of O2, NO, SO2 and HCl [51] and the use of nano-engineered surfaces both as sensor and for Hg removal is a topic of great industrial interest [52].
18
4. Experimental
4.1. Materials
The solvents, used as received, were purchased from Sigma-Aldrich: Tetrachloroauric (III) acid trihydrate (HAuCl4·3H2O), Tetraoctylammonium bromide (TOAB), Sodium borohydride (NaBH4), Biphenyl-4,4′-dithiol (BI), Fig.2, and p-Terphenyl-4,4′′-dithiol (TR), Fig.3, Dichloromethane, Chloroform, Ethanol, Toluene, Petroleum Ether.
A Scilogex refrigerated microcentrifuge was used for purification of AuNPs samples (5000 rpm, 20 min, 4 °C, 5× with ethanol). Deionized water was obtained from Zeener Power I Scholar-UV (18.2MΩ).
4.2. AuNPs synthesis and characterizations
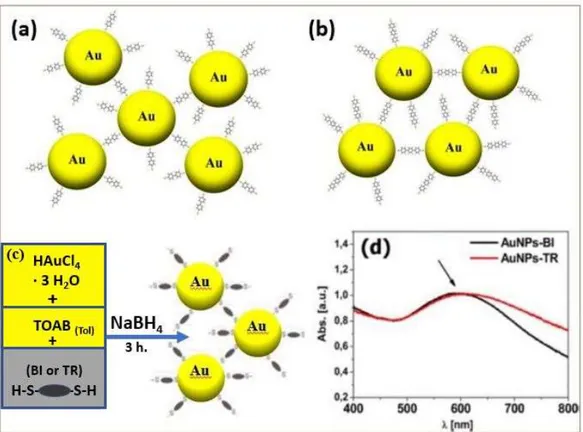
The AuNPs synthesis have been performed starting from the tetrachloroauric acid (HAuCl4) through two phase’s reduction procedures [53][54], optimized for dithiol ligands [55][56] Fig. 3C. All the experimental parameters have been optimized to obtain small nanoparticles with low dispersity in dimension, using a 3:1 metal:sulfur (Au/S) molar ratio, for the synthesis of both AuNPs-BI (Fig. 3 A) and AuNPs-TR (Fig. 3 B) samples. The UV–vis characterization evidenced a SPR broad absorption at about 600 nm, both for AuNPs-BI and AuNPs-TR, red shifted with respect to the typical SPR band of isolated AuNPs found at about 520 nm [57][58]. This shift strongly depends on the interaction among NPs and intercoupling effects [59]. It can be used among others, for chemical and biochemical sensing in complex NPs architectures and for electron transport studies [60]. It is noteworthy that thanks to the high chemical-structure stability, the AuNPs can be stored in solution until its applicative use.
Figure 2 – Biphenyl-4,4′-dithiol
19
Figure 3 – p-Terphenyl-4,4′′-dithiol
As a typical procedure, the AuNPs-TR synthesis is herein reported: an aqueous solution of HAuCl4·3H2O (0.0801 g, 2.00×10⁻⁴ mol) in freshly prepared deionized water (5 mL), was mixed with a solution of tetraoctylammonium bromide (TOAB) (0.1200 g, 2.00×10⁻⁴ mol) in toluene (5 mL). The two-phase mixture was vigorously stirred until all the Au3+ were transferred into the organic layer and a solution of TR (0.0100 g, 0.33×10⁻⁴ mol) in toluene (3 mL) was then added. A NaBH4 deionized water solution (0.0796 g, 2.00×10⁻³ mol), in 2 mL of deionized water, was added under vigorous stirring. After 3 h the organic phase was separated and washed with water. The organic phase was reduced to 2 mL in a rotary evaporator, and 40 mL of ethanol were added. The mixture was kept overnight at −18 °C and then centrifuged at 5000 rpm for 15 min at 4 °C, in order to remove the excess of thiol and TOAB. The supernatant was eliminated, and the precipitate was washed by centrifugation at 13,400 rpm for 10 min with ethanol at 4 °C for 10 times. After the removal of the supernatant, a dark suspension of AuNPs-TR was obtained (yield 30% wt).
The chemical structure and the reaction scheme of the prepared AuNPs in the presence of the π-conjugated dithiols BI or TR, is reported in Fig. 4.
20
Figure 4 – In these pictures are depicted: (a) the chemical structure of BI and (b) AuNPs-TR nanoparticles; and (c) reaction scheme; (d) UV–vis absorption spectra of AuNPs-BI (black line) and
AuNPs-TR (red line) nanoparticles in CH2Cl2. The arrow indicates the absorption peak at about
600 nm.
The so obtained nanoparticles were soluble in common organic solvents such as
dichloromethane and toluene and their stability in solution was monitored up to one month, Fig. 5.
21
Figure 5 – AuNPs suspension of both solutions containing AuNPs-BI and AuNPs-TR dispersed in dichloromethane (CH2Cl2).
The comparison of the AuNPs with the used dithiol ligands have been performed through the analysis of their FT-IR spectrums (Fig. 6, 7) performed in trichloromethane (CHCl3).
Figure 6 - Comparison between FT-IR spectra of AuNPs-BI (in red) and free bifenil-4,4’-dithiol (BI) (in blue).
In Fig. 6, the AuNPs-TR main characterizations are: λmax nm, (CHCl3) 585; FTIR (film, cm-1): 2920, 2853, 1588, 1456, 1371, 1078, 993, 800, 699.
22
Figure 7 - Comparison between FT-IR spectra of AuNPs-TR (in red) and free p-terfenil-4,4’’-dithiol (TR) (in blue).
UV–Vis absorption spectra were run in dichloromethane by using quartz cells, with a Varian Cary 100 Scan UV–vis spectrophotometer. FTIR spectra were recorded with a Bruker Vertex 70 instrument using KRS-5 cells, in the 4000–400 cm-1 range and the samples have been prepared as cast films or from Nujol mulls.
In order to check the behaviour of the nanoparticles under thermal stress, they have been morphologically investigated. At this purpose a Nanosurf® Flex AFM instrument have been used.
The AFM study was carried out in non-contact mode, on AuNPs-BI and AuNPs-TR drop-cast deposited onto silicon substrate, before and after the thermal treatment at 500 °C.
As it is possible to observe in Fig. 8 a-b, for AuNPs-TR freshly prepared sample, an uniformly distribution of AuNPs with maximum diameter of about 6.5 nm can be noted in the pristine material.
After a thermal treatment at 500 °C, Fig. 8 c-d, it is possible to observe a slight increase in AuNPs diameter and the formation of some aggregates, due to a possible merging of vicinal AuNPs. The mean diameter of the NPs was maintained below 17 nm. This preliminary study allowed considering the AuNPs as stable in the used thermal stressing conditions.
23
Figure 8 - AFM topography images of deposited AuNPs-TR on a silicon slice support, analysed before: a, b (1 μm×1 μm) and after the thermal treatment at 500°C: c, d (10 μm×10 μm).
4.3. Passive air samplers (PASs) preparation
After the synthesis of the nanoparticle material, we proceeded with the preparation of the adsorbent samplers. Noted that the current way to release the adsorbent mercury is through the application of heat, a suitable support, able to withstand high temperatures was required.
For this purpose, a thin wool disc (Whatman© quartz filters) consisted of quartz fibres (QF) was used as supporting material. These substrates presented a diameter of 17 mm and a thickness of 0.5 mm.
24
The preparation of the samplers has been performed through the drop casting technique. This technique is rather simple and is based on the casting of a defined volume of the solution by means of an autoclavable pipette.
AuNPs-BI and AuNPs-TR were deposited on substrates casting 100 μL of a
dichloromethane solution (prepared at concentration of 1 mg/mL). The deposition area was circumscribed by a hose, placed on the deposition layer during casting process, allowing a homogeneous absorption of the solution on the circumscribed area. In this way, starting from an initial surface of 227 mm2, a central active area of 133 mm2 was prepared, Fig. 9.
Figure 9 – Depiction of the prepared quartz wool disc with the central area with the deposited AuNPs (both BI and TR).
The freshly prepared samplers appeared as a dark deposition area, Fig. 10.
Figure 10 – Example of AuNPs-TR sampler after the casting deposition, before any heat treatment.
After the deposition, the samples were dried for two hours in an oven at 40 °C, to
facilitate the evaporation of the solvent. Subsequently, they were thermally treated at 500 °C for 5 min. This step was necessary to avoid possible environmental mercury contamination, in addition to the elimination of all solvents and volatile organic elements adsorbed during the
25
sample preparation process. As observed in Fig. 11 a, after the heat treatment at 500°C the appearance of the deposited surface changed in a faded white colour. A different appearance was observed after the thermal treatment of the AuNPs-BI samplers, showing a yellowish colour, as is clearly evidenced from the Fig 11 b.
Figure 11 – Appearance of the sampler after the heat treatment at 500°C. (a) AuNPs-TR sampler; (b) AuNPs-BI sampler.
After this process, the samplers were sealed in a glass holder, previously blown with dry nitrogen.
Further characterization aimed to investigate the morphological distribution of the AuNPs-TR and AuNPs-BI on the fibres involving surface morphological analysis and determination of chemical compositions. Variable Pressure Scanning Electron Microscopy (VP-SEM, Hitachi SU-3500) at high vacuum mode supported by dual energy dispersive X-ray spectroscopy (dEDX) detectors in parallel configuration (Bruker, XFlash® 6|60) able to perform high sensitivity elemental analysis has been employed Fig. 12.
26
Figure 12 – Morphometric and chemical analyses of AuNPs deposited onto quartz fibers: (a) and (b) 2D contour map of the AuNPs distribution of AuNPs-TR (Figure a) and AuNPs-BI (Figure b), respectively. Inset: Plots showing the frequency distribution of the nanoparticle size
histogram. (c) and (d) EDX spectrum image of Figure c and d (elements identified: Au, S, C, Si, O with green background while the remain elements in red colour belongs to the background of the SEM camera).
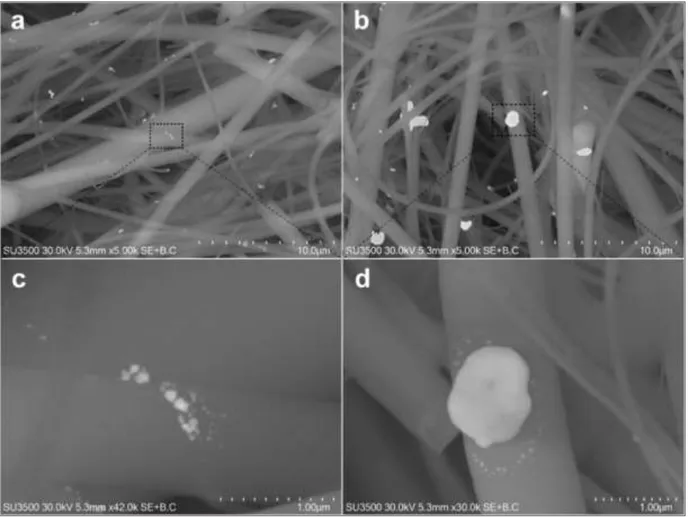
These measurements allowed to investigate the evolution of the AuNPs (TR and BI) aggregation on the fibres. For the AuNPs-TR an average dimension ranging from 15 to 550 nm and an active total area of about 0.915 μm2 was calculated respectively, Fig. 13a. A different morphological evolution may be observed for AuNPs-BI, where the average dimension change from 19 nm to 2.2 μm and an active total area of 7.265 μm2
Fig. 13b. By increasing the magnification of the objects (black dot rectangle), it was possible to observe nanoparticles of dimension under 15 nm with a spherical shape up to 40 nm in size. After a thermal treatment, the AuNPs-TR show an increase in dimensions, probably due to an aggregation effect of small NPs into larger objects, in any case not exceeding the dimensions of about 120 nm, Fig. 13c.
Similarly, an aggregation effect is also observed on the AuNPs-BI but, in this case, particles of micrometric dimensions with a row surface surrounded by few survival nanoparticles have been observed Fig. 13d.
27
The different aggregation effect between AuNPs-BI and AuNPs-TR could be explained in term of the different interparticle distance in the NPs network located on the quartz fibres under thermal treatments [56].
Figure 13 – SEM images of AuNPs deposited onto quartz fibres after thermal treatment: AuNPs-TR (a, c) and AuNPs-BI (b, d).
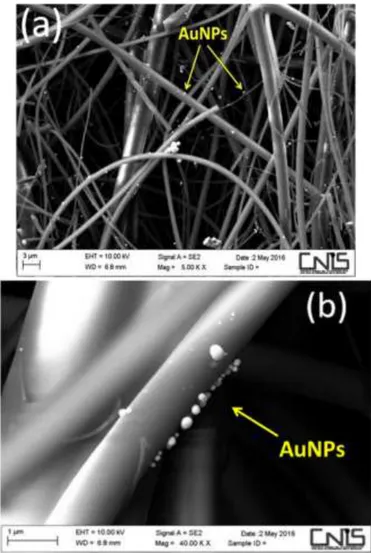
It should be also noticed that the growth effect of AuNPs is independent from the dimension of the quartz fibres, evidencing instead an homogeneously distribution also in the inner quartz fibres layer, showing a good distribution, Fig 14 a,b.
28
Figure 14 – SEM images of AuNPs homogeneously distributer on quartz fibres.
Subsequently, a series of 10 samples of AuNPs-BI and 10 samplers of AuNPs-TR of
nanostructured materials have been prepared. These samplers were prepared with the purpose to successively test and investigate their adsorbing properties.
4.4. PASs measurements
Before testing and applying this adsorbent material towards gaseous mercury, a suitable and reliable procedure for calibration and measurements was required.
For this purpose, both a source of gaseous vapour mercury, necessary to take defined quantities of mercury by a gas tight syringe, and subsequently an instrument, able to reveal and quantify the mercury collected by the adsorbent material, were required.
From the various vapour mercury sources used in the past (like the reduction of mercury-containing solutions which were followed by the purging of the solutions to generate defined vapour mercury), nowadays, the most applied and reliable method is based on the use of closed
29
vessels, which containing a small amount of mercury, are thermoelectrically thermalized bringing the inner saturated gaseous mercury to a certain vapour pressure and concentration. In these containers, the higher the applied temperature is, the more the resulting internal vapour pressure is high.
One reliable and mostly used instrument, based on this operating principle, is the Tekran® 2505 Mercury Vapour Primary Calibration Unit. This instrument is based on the same fundamentals mentioned above and is used as a primary source for the calibration of mercury analyser instruments.
The principle of function is based on the Dumarey equation [61], as following reported:
𝛾𝐻𝑔 =
𝐷
𝑇
10
−(𝐴+[𝐵𝑇])
[1]
where γHg is the saturated mass concentration of mercury in the air expressed in ng/mL, while D, B and A are constants and T is the temperature expressed in K.
Another method to generate constants and defined quantities of vapour mercury, usually used in the measurements and expositions of samplers, is based on the usage of permeation tubes. In this case, the operating principle is slightly different, since, even if related to the temperature too, it works in a constant gas carrier, necessary to dilute the vapour mercury emitted from a Teflon capsule containing a small amount of mercury and kept to a defined temperature, so that to emit at a defined and continuous rate of mercury over time.
In the following case, for our purpose both methods were used, the Teflon permeation tube and the Tekran® 2505.
Alongside the use of apparatus to generate defined vapour mercury quantities or concentrations, it had become necessary to have an instrument able to detect the mercury harvested by these materials.
To this purpose, a suitable thermal desorption system, connected to a mercury analyser was developed.
The apparatus was constituted of:
- a gas delivering system, comprised of a customized quartz crucible necessary to hold the sample and to resist to high temperatures;
- a furnace, comprehending an oven able to reach high temperatures (up to 700°C) in few minutes, set to 500°C (temperature necessary to release adsorbed mercury on the
30
- a Tekran® 2537A, equipped with a cold vapour atomic fluorescence spectrophotometer (CVAFS) detector, necessary to quantify the TGM released from the samplers.
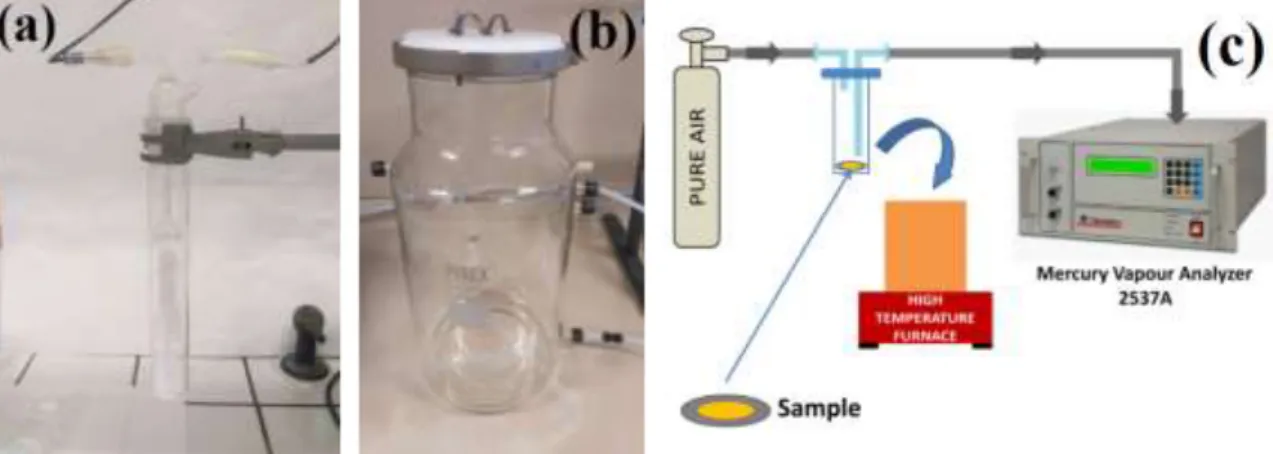
These three main instruments have been appropriately set up, so that to have a complete apparatus able to: expose the samplers to a defined vapour mercury concentration, desorb the amalgamated mercury bonded on the samplers and quantify the relative realised amount, Fig. 15.
Figure 15 – Measurements apparatus schematic diagram: (a) permeation tube heated to a defined temperature immersed in a thermostatic bath, to supply a continuously amount of
mercury in an air carrier flux; (b) the exposition chamber where had been located the samplers to be tested; (c) the desorption and measurement system, consisting of a furnace for the desorption and a Tekran 2537A for the quantification.
All the connections, tubes and chambers used in these measurements were made of Teflon, silicon, glass or quartz, avoiding using metal components that could adsorb vapour mercury on their surfaces, and so affecting the real values of the measurements.
Moreover, calibrations and controls on Tekran® 2537A have been performed both before, during and after the sampling measurements, to verify the correct calibration of the instrument, through the use of a Tekran® Model 2505 Mercury Vapor Calibration Unit and a suitable gastight
syringe.
After setting up all the measurement apparatus, before starting any exposition test in the real environmental vapour mercury concentrations, the so prepared BI-QF and AuNPs-TR-QF have been tested in a suitable 20 L glass Pirex® chamber Fig. 15 b. An adapted Teflon lid was used to hold the AuNPs samplers, during the expositions.
31
Several tubes were connected to the chamber. One entrance was used to enter a continuous flux of purged air with a constant diluted amount of gaseous mercury, coming from a permeation tube, Fig. 15 a. On another connection was fixed an exhaust tube, from which a Tekran® 2537 was connected, to continuously determine and measure any change in the chamber mercury concentration.
An inner concentration of 12.0 ± 1.0 ng m-3 was generated.
The measurements had different exposure times. After each exposition, a desorption process quantified the corresponding adsorption value, as reported in the related Fig. 15 c.
Figure 16 – Graphic depicting the adsorption behaviour towards the vapour Hg° during a sampling.
According to these first results Fig. 16, we could evaluate a high rate affinity between the AuNPs material utilised and the adsorbed vapour mercury, especially when compared to the films of AuNPs reported in the literatures [51].
In this case, the adsorption mechanism that occurs on the AuNPs, leading to the
formation of an amalgam is supposed to work as a place exchange process, as reported by Levlin M. et al. [46].
32
From the measures of Fig.16, it is possible to evidence also a different response in mercury adsorption between AuNPs BI and TR samplers, with a constant higher response for the AuNPs-TR ones.
Successively the AuNPs-BI-QF and AuNPs-TR-QF samplers were tested in a real environmental countryside mercury concentration exposition, in order to evaluate their adsorption
performances. This study was carried out sampling the atmospheric gaseous mercury present in the surrounding countryside of our research centre located in a rural area at North-East of Rome (Italy), away from major anthropogenic sources of air pollutants, with a rather low and stable mean values of TGM over time, in the order of 1.5 ± 0.4 ng m−3 of Hg.
These measurements were performed using a series of 20 adsorbing samples (10 AuNPs-TR-QF and 10 AuNPs-BI-QF) placed in an aluminium sample-holder grid at a distance of at least 2 cm each other.
The surface of the samples was oriented with the adsorbent surface facing downwards in order to avoid undesirable dust deposition effects and placed in another holder suitable for the exposition, Fig. 17.
Figure 17 – Sample holder for outdoor environmental expositions.
During the outdoor exposition, the mercury concentration level was continuously monitored by the analyser Tekran® 2537A, to obtain accurate information about the exposure. In addition, weather parameters (wind speed, temperature, relative humidity and rainfall) were monitored valuating possible influences on the sensing measurements. Through these measurements, a stable background mercury concentration of 1.5 ng m−3 (±0.4 ng m−3) was measured. During the exposition the TGM adsorbed on the samplers (both AuNPs-BI and AuNPs-TR) was measured and quantified progressively after 1, 7, 14, 21, 28 and 56 days.
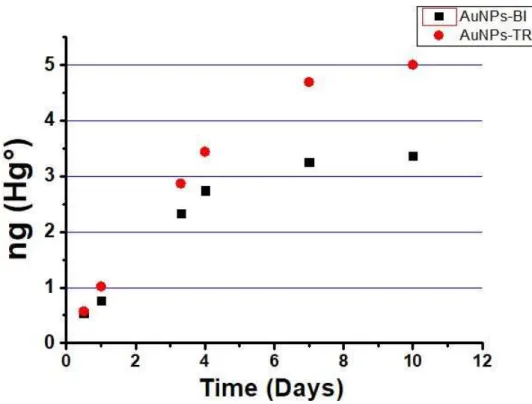
In the detection of the environmental gaseous mercury, several critical aspects have been investigated and evaluated, such as the adsorption capacity, the long-term stability and the temporal and spatial resolution. In Fig. 18 are reported the following results.
33
Figure 18 – Desorption mercury measurements of the AuNPs-TR (red), AuNPs-BI (black) samplers as a function of exposition time in outdoor environment (up to 56 days). The error bars indicate the standard deviation. Measurements were carried out in triple.
From these data it is possible to highlight how 100 μg of casted AuNPs-BI/TR were able to absorb 200–300 pg of mercury in one day of exposition.
Interestingly, the samplers can be exposed (in an average gaseous mercury countryside concentration) for a period of 5–6 months, without encountering saturation phenomena. Moreover, another important characteristic is given by the linearity observed in the adsorption rate, with a low dispersion of the data, indicating any significant influence given from the turbulence of wind or of other atmospheric parameters on the uptake rate (Ur). This behaviour could be explained considering that the AuNPs are not only distributed on the surface of the samplers, but also inside the quartz mesh of the sampler’s fibres, giving in this way a reduction in the diffusion rate, as highlighted by SEM observations, Fig. 14 a.
Also in this case, as the previously expositions, we could observe that, compared to AuNPs-BI, the AuNPs-TR showed a greater capacity to absorb mercury vapor. We have therefore focused our attention on the AuNPs-TR material.
To characterize their absorption, a maximum mercury uptake capacity study was carried out, exposing AuNPs-TR samplers to a saturated vapour mercury concentration (of 14.3 mg m−3, i.e. 1.7 ppm, at 20 °C) as function of the exposure time. A maximum of 240 min of exposition
34
was reached. As reported in Fig. 19, a linear adsorption (up to 120 min of exposition) can be observed, reaching an equilibrium phase of saturation of 14 ng Hg° adsorbed for AuNPs-TR.
Figure 19 – Uptake capacity of an AuNPs-TR sampler, after different exposition times to a saturated vapour mercury ambient (concentration 14.3 mg m−3 – 1.7 ppm). The error bars indicate the instrumental error.
The reported data showed a high uptake capacity toward the GEM up to 14 ng, in relation to the amount of 100 μg of AuNPs-TR material deposited on the quartz fibres. These results are significantly important when compared to other passive vapour mercury samplers, based on gold deposited layers or concentrated AuNPs thick films.
Another important feature for these absorbent composite materials is focused on their ability to be renewed for long cycle life, through a stressing expositions measurement of AuNPs-TR samplers, with a series of cyclic measurements (adsorption and desorption processes) performing a series of more than 35 consecutive measurements.
For these purposes, we used a test chamber made of quartz (with a volume of 8 cm3), Fig. 20, and a primary mercury source (Tekran® 2505 mercury vapour primary calibration unit) to generate constant amounts of elemental mercury. Moreover, a Hamilton® gastight syringe to inject vapour mercury in the chamber was used. The measurements were performed repeatedly injecting the same amount of GEM (1.995 ng Hg°) for a fixed expositions time (1 h).
35
Figure 20 – Injection chamber used for the exposition measurements.
Considering the results of adsorption/desorption of AuNPs-TR it is possible to observe that there is
any reduction in the uptake capacity of the adsorbent material towards the GEM, suggesting that no relevant degradation occurred on the sorbent material, allowing their reutilization for more consecutively measurements, Fig. 21.
36
Figure 21 - Thermal adsorption/desorption cycles of AuNPs-TR samplers. The measurements show any significant variation in the sensitivity values over time and expositions. The error bars indicate the instrumental error.
This result is very important, in fact, starting from a relatively low-cost preparation of each sampler, estimated in 50 euro cents, this cost could be further reduced by the reuse of the samplers in view of possible applications in monitoring campaigns.
Selectivity towards vapour mercury in presence of relative humidity (RH) was verified by
exposing the AuNPs-TR sampler to a fixed quantity of Hg° (0.664 ng) varying different RH with a fixed exposition time of 30 min, Fig. 22.
Figure 22 – Selectivity in presence of relative humidity (R.H.); AuNPs-TR sampler exposed to a fixed amount of Hg° (0.664 ng) at different R.H.% for 30 min.
By the reported graphic a stable adsorption behaviour, in presence of the same mercury amount, varying the RH percentage is evidenced. This result gives us the possibility to employ these samplers in both dry or humid environments without undermine their adsorption capacity. In addition, to investigate the adsorption’s rate of the AuNPs-TR samplers, a series of
measurements have been performed, where a fixed amount of vapour mercury (1.995 ng of Hg°) was injected in a chamber.
37
It was experimentally observed that as the exposition time gradually increased, so the adsorption efficiency, until it reached (after two hours) the total adsorption of the injected vapour mercury Fig. 23.
Figure 23 – Results on the absorption efficiency in relation of different sampling exposure times to fixed amounts of mercury (1.995 ng of Hg°). The error bars indicate the instrumental error.
These first series of studies allowed us to evaluate the efficiency of this adsorbent material, based on AuNPs. If compared with other works reported in literature, it is possible to observe a very high adsorption capacity, a prolonged mechanical stability as well as a
38
5. Comparison of different shelters for PASs expositions
A subsequent study was aimed to customize this new adsorbent material for gaseous mercury, employing different diffusive bodies geometries and comparing their behaviours using them as alternative devices, easy to use, economic and flexible, with a wider possibility to monitor larger areas. In fact, compared to active sampling systems, diffusive samplers can offer some advantages in handling, also due to the absence of power or gas cylinder supply, with low purchase costs. These characteristics can push their application to gain a higher spatial sampling resolution, allowing a greater coverage achieved in the monitoring campaigns, making it possible to identify sources of pollution emissions spread over a large area.
On the other hand, compared to the active sampling systems, these devices present a lower accuracy and temporal resolution, due to their slow sampling process.
The theoretical basis of diffusive sampling can be found in expressions deriving from Fick’s first law of diffusion, relating the mass uptake by the sampler (m) to the diffusion coefficient of the target species sampled (DA), the gradient of concentration between the environment (C0 ) and next to the adsorbent (C1), the time of exposure (t), and the geometric characteristics of the sampler (cross-sectional area, A, and diffusion path length, L, Fig. 24). In ideal conditions, when the adsorbent is a perfect sink, C1 can be assumed to be zero. Actually, a series of factors affect the diffusion process from the air onto the adsorbent, among them turbulence along the diffusion path, saturation of the adsorbent, back diffusion and pressure or temperature variations. The following expression, introducing a coefficient k to account for non-ideality:
L k t C A D m A 0
[2]
is preferred to the theoretical one. The uptake rate (Ur) or sampling rate can be defined as:
L A D U A r
[3] Therefore, the environmental concentration (C0) in ideal conditions (when k equals 1) can be obtained by:
𝐶0 = 𝑚 ∙ 𝐿 𝐷𝐴 ∙ 𝐴 ∙ 𝑡=
𝑚
𝑈𝑟 ∙ 𝑡 [4]
In general, k depends on various factors among which the couple adsorbent/adsorbate and it is determined experimentally.
39
For this purpose, both indoor and outdoor (where mercury ambient background
concentrations could be found) expositions were carried out, to evaluate their adsorption capacity and the relative sampling rate, when exposed to different conditions.
5.1. Diffusive sampling shelters
In this section a series of three sampling supporters will be described, to evaluate the most suitable for this kind of adsorbing material.
The used sampler geometries can be described as follows:
- A glass cylinder (inner diameter 20 mm, 25 mm in depth) with a cap and a diffusion teflon net (mesh 100 µm) (Fig. 24), aimed to avoid undesired adsorption by using metallic nets.
Figure 24 – Schematic representation of the axial sampler. Adsorbent nanostructured material [A], teflon o-ring [B], glass cylinder [C], teflon cap [D] diffusive teflon net [E].
- Three Radial diffusive bodies made of polyethylene (PE) with a microporous structure, 1.5 mm in thickness, an average porosity of 20±5 μm, has been used for the radial diffusion sampling (Fig. 25).
40
Figure 25 – Schematic representation of a radial sampler. Adsorbent nanostructured material (F), the diffusive body (G).
- A polystyrene (PS) holding grid, 85 mm x 40 mm, has been used to hold three samplers exposed directly with the ambient vapour mercury concentration, without any diffusion barrier (Fig. 26).
Figure 26 – Schematic representation of the sampling grid. Structural holder (H), adsorbent nanostructured material (I).
5.2. Samplers preparation
Starting from the same AuNPs-TR solution used for the preparation of the samplers mentioned in the studies above described, in this second section a batch of 9 samplers have been prepared. Noticing the high vapour mercury adsorption efficiency of the previously deployed samplers, a reduction in the deposited solution was done. In fact, a solution volume of 50 μL, containing the
41
AuNPs in dichloromethane, at a concentration of 1 mg/mL, was deposited on a thin disk of quartz wool fibres (QF). The total active surface area, covered by the gold particles on each sample, was of 133 mm2. In this way, three circular samplers to be used in the axial geometry and three other circular samplers to be used for the direct exposure, were prepared. In the case of the radial geometry, three different rectangular elongated quartz fibres forms have been used, so that they could be inserted inside the radial diffusive holder. The total active surface area of 133 mm2 deposited and the amount of 50 μL solution casted on the quartz fibres supports was the same for all the samplers (both for the circular and rectangular shape). A total of nine adsorption samplers, both with circular and rectangular shapes, have been prepared.
5.3. Samplers exposures and measurements
For the outdoor environment exposures measurements, a countryside outside Rome has been chosen. The samplers were placed on a single main support, with few centimetres of distance between one another, in order to minimize the different conditions during the sampling period, Fig. 27.
Figure 27 – Outdoor exposure conditions, holders for: axial diffusive dosimeters (A), radial diffusive dosimeters (B). direct exposure (C).
During sampling expositions, the external gaseous mercury concentration was constantly monitored using a Tekran® 2537A, which recorded the data with an interval of 5 min.
42
The data regarding the external vapour mercury concentration did not show any significant change during the sampling period, reporting a total mean concentration of 1.5 ± 0.5 ng m-3 of TGM.
The indoor measurements instead, have been performed in a closed laboratory, not used by personnel, to avoid undesired turbulences effects on the sampling. In this case a continuous monitoring of gaseous mercury concentration was carried out by a Tekran® 2537A as well and a mean concentration of 4.5 ± 0.5 ng m-3 was measured (temperature of ~22°C, relative humidity of ~42% RH), sampling for a period of 31 days.
As the previous measurements, at the end of each exposure the samplers were thermally desorbed and quantified by mean of a Tekran 2537A.
Based on the results of this study, it has been possible to determine and associate a defined Ur to each sampler, both for indoor and outdoor exposures.
The related Ur associated to the samplers has been calculated according to the following equation [5]:
𝑈𝑟 =
𝑚𝐶0 ∙𝑡
[5]
where m is referred to the mass of adsorbed mercury on the sampler (ng), C0 is the vapour
mercury ambient concentration (ng m-3), and t the sampling time (days).
According to the above equations, theoretical Ur of 0.005 m3 day-1 and 0.075 m3 day-1 was deduced, referred to the axial and radial diffusive samplers respectively.
Different results have been observed from the axial geometry (where the adsorbent material is placed orthogonally to the incoming flow on the bottom of a cylinder opened on one side) and the radial symmetry samplers (where the gases enter through the pores of an elongated diffusion cylinder towards an adsorbing material placed inside).
From the data reported in the Fig. 28 a, evaluating the indoor expositions, it is possible to observe a different adsorption rate between the two samplers geometries plus the direct one, however all samplers show a straight linearity with a high reproducibility (the error bars, equal to one standard deviation, lie inside the marked point).
The reported adsorption linearities, could be explained by the absence of any air turbulence in the room and a stable vapour mercury concentration over time.
43
On the other hand, a different behaviour was observed in the outdoor exposures, where the samples were exposed for a period of 46 days, at 1.5 ± 0.5 ng m-3 of vapour mercury concentration. The measurements have been repeated successively for shorter periods. After each desorption and measurement cycle, the triplicate samplers were exposed once again for successive sampling.
Finally, the direct exposure (D.E.) of the adsorbent material, without any diffusion barrier, was also carried out, taking in account the effects of an open-air exposure on the surface Fig. 28 a (blue marks).
In addition to the indoor expositions, in Fig. 28 b are reported the data concerning the samplers exposed to the outdoor conditions. It this case a larger dispersion of the data has been noted, especially for D.E. samplers.
Figure 28 – Adsorbed TGM on samples exposed in indoors (a) and outdoors (b) environments.
In the outside exposition, the adsorption dispersion observed in the D.E. samplers, (Fig. 28 b, blue marks), could be easily explained by the direct effects of the environmental changing conditions on the adsorbent surfaces; so, in this case, it is not possible to define a true Ur.
According to the expositions time, the amount of mercury adsorbed and the exposition environment concentration, applying the [5] equation, it has been possible to determine the Ur of both the indoor and outdoor expositions, as reported in the graphics of Fig. 29 a,b.
44
Figure 29 – Ur of the sample shelters following the indoor (a) and outdoor (b) exposures.
In Fig. 29-a and 29-b, differences in the Ur are evident. In Fig. 29-a, a slight decrease of the values is observed in the radial type Ur, while a more stable and linear Ur, over the time, was observed in the axial geometry.
A different Ur behaviour was instead observed in the outside exposures. As shown in Fig. 29-b, the uptake rate plots can be divided into two parts. A fast decreas in the Ur can be observed in the first days, followed by stabilization at lower values after the fifth day of exposure. These responses could be explained by the change of the concentration gradient into the diffusion gap during the first days, as also observed in previous studies on diffusive samplers [65][66]. The equilibrium concentration of the gaseous mercury upon the adsorbent material is, indeed, low at the beginning of sampling, resulting in a higher concentration gradient with a fast adsorption of the mercury compound. Since uptake is a cumulative process and uptake rate is relative to the entire sampling period, this should be extended, so that the fast initial changes can be considered negligible. This is much more evident for the radial samplers, which are characterized by a shorter diffusion path and, hence, a faster sampling. Moreover, a greater dispersion is observed for the radial samplers Ur, while a lower and constant Ur is reported for the axial ones, as summarised in Table 1.
45
Sampler
Indoor Ur
(m3·day-1)
Adj. R-Square
Outdoor Ur
(m3·day-1)
Adj. R-Square
Axial 0.006 0.99 0.005 0.97
Radial 0.030 0.99 0.010 0.92
Table 1 – Experimental indoor and outdoor Ur for both shelters, with relative coefficient of determination R2.
The best results have been obtained with the axial geometry. In fact, a higher coefficient of determination (R2) in both indoor and outdoor exposures was calculated for this geometry. From the data reported, it is possible to observe a good agreement between the theoretical and the experimental Ur in the case of the axial sampler outdoors (0.005 m3·day-1), with a slight difference for indoors (0.006 m3·day-1). A different response was observed for the radial sampler, which, compared to a theoretical Ur of 0.075 m3·day-1, experimental Ur of 0.030 m3·day-1 and 0.010 m3·day-1 for the indoor and outdoor expositions were observed respectively. Thanks to its geometry, that allows to have a constant uptake rate (Ur), the axial diffusive shelter exhibited, in the outdoor long-term exposures, a low influence coming from the variable environmental conditions, reporting a high coefficient of determination (R2 0.97).
Indoor exposures showed a higher reproducibility, along with a higher coefficient of determination (R2 0.99).
These results allowed to discriminate and propose the most suitable prototype of diffusive sampler, for this kind of adsorbent material, in different sampling conditions.
46
6. Conducting polymers in sensing applications
6.1. Use of conducting polymers in sensing devices
Starting from the work of Shirakawa et al. [67] on polyacetylene studies, the use of conducting polymers (CPs), such as polypyrrole (PPy), polyaniline (PAni),
poly(3,4-ethylenedioxythiophene) (PEDOT), polythiophene (PTh), and their derivatives, as sensitive material in the use of chemiresistors sensors, had an increasing investigation and application, among many other things, in the environmental pollutant monitoring [68]. A constant growth as gas sensors since the 1980s was found [69]. Compared to other sensors, that based on conducting polymers have the characteristics to be processed and used at room temperature, besides, they have high sensitivities and a fast response time. Among other conducting polymers, we focused our attention mainly on PAni conducting polymer Fig. 30 [70], which has been studied both individually, in blends polymers (PAni/PVDF) and in polymer/metal nanocomposites (PAni/AgNPs).
Figure 30 – PAni structure.
Generally, the conducting polymers presents the characteristics to have a conjugated backbone chain, consisting of an alternative singles and double bonds, forming a broad π-electron conjugation.
As follow described, the work is based on the use of two conducting polymers, PAni,
PEDOT and their polymeric blends, characterising their electrical and morphological properties, along with the use of nanocomposites polymer/metals for conductivity measurements in presence of gaseous analytes.
47
6.2. Experimental
In this section is described the preparation process of the conducting polymers for the following solutions. A Polyaniline Emeraldine Base (PAni-EB), 10.000Mw (blue colour) in its non-conductive state has been used. In its base form, because of its non-conductivity it required an acidic doping process and, in this case, canforsulfonic acid (HCSA) and hydrochloric acid (HCl) have been used, both solubilized in methylethylketone (MEK).
In this work, different strategies and solution preparations have been experimented (with high or low doping preparations, etc.). Some of them gave interesting measurements, while others need to be further investigated. For a good comprehension of the following undertaken work the main experiments and results are reported.
6.3. Interdigitated electrode (IDE) support
Important devices useful for the following measurements, are the gold interdigitated electrodes on silicon, Fig. 31. These supports have an interesting application because they operates both as a physical support, for the thin films of the applied polymers, and as transducer element, for the following electrical conductivity measurements.
Figure 31 – Interdigitated Au/Pt support on silicon.
On the surface of these interdigitated supports, a thin film of polymeric solution was deposited, by means of two deposition techniques: the dip-coating technique, that forms a thin film uniformly distributed over the entire surface of the electrode, and the casting deposition technique, which forms a thicker layer even if homogeneously distributed.
48
For the dip-coating, a home-made instrument has been developed, where the interdigitated support was fixed and set at a defined velocity for the immersion pulling up from the solution. For the casting deposition where, a defined volume of solution, using an autoclavable pipette, was deposited on the surface of the interdigitate substrate.
Successively, these supports are kept in an oven at low temperature, to facilitate the solvent evaporation process and leave a homogeneous polymeric film on the surface.
6.4. Materials
The following materials used in the preparation of the solutions were all purchased from the Sigma-Aldrich Co.; Emeraldine Base Polyaniline, (PAni-EB, Mw~10.000), Methyl ethyl ketone (,MEK), Camphor-10-sulfonic acid (β) (HCSA), Poly(vinylidene fluoride) (PVDF, average Mw ~180,000), 3,4-Ethylenedioxythiophene (EDOT, 97%), Titanium (IV) isopropoxide (TTIP, 97%), Iron (III) chloride (97%), Chlorobenzene (anhydrous 99.8%).
6.4.1. PAni solutions preparation
Starting from the pristine polyaniline in its non-conductive form (emeraldine base), a solution was prepared as follow, Tab. 2:
Solution PAni-EB (mg) MEK (mL)
1° 150 10
Table 2 – PAni-EB solution prepared in MEK solvent.
This solution was necessary to start from a first electrical conductivity characterization, in order to measure the response of this polymer in its undoped state.
A successive series of four PAni solutions, at different degree of doping were prepared, Tab. 3:
Solution PAni-EB (mg) MEK (mL) HCSA (mg)
1° 150 10 25
2° 150 10 50
3° 150 10 100
4° 150 10 150