Sapienza University of Rome
Faculty of Mathematical, Physical and Natural Sciences Department of Biology and Biotechnology “Charles Darwin”
PhD Course in Cellular and Developmental Biology
Serpin function and disease: cellular toxicity of neuroserpin polymers
and novel roles of alpha1-antitrypsin
PhD student
Emanuela D’Acunto
Supervisor
Prof. Maria Elena Miranda Banos
Coordinator
Alla mia famiglia, Mamma Papà e Laura
INDEX
General introduction……….. 7
Aims of the work……… 13
SECTION I: MUTANT NEUROSERPIN INDUCES MITOCHONDRIAL ALTERATIONS IN A NEURONAL MODEL OF DEMENTIA FENIB……… 15
Summary……….. 15 Sommario………. 16 Introduction………. 19 Results……….. 23 Discussion………. 53 Methods………. 63 References………. 77
SECTION II: DISSECTING IMMUNOMODULATORY MECHANISMS OF A1AT WITH FUNCTION-NEUTRALISING MONOCLONAL ANTIBODIES….. 91
Summary……….. 91
Introduction……….. 95
Results……… 99
Discussion……… 127
Methods……… 126
References……… 131
General conclusions and perspectives………. 147
GENERAL INTRODUCTION
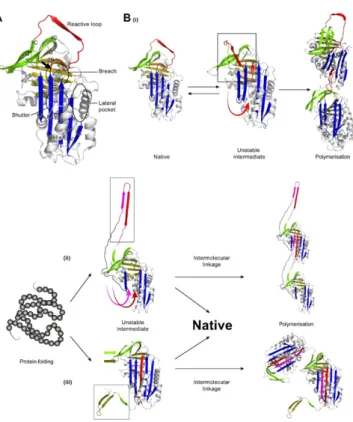
Serpins are the largest and most broadly distributed superfamily of protease inhibitors (Irving et al., 2000). Members of the serpin superfamily are found in all major branches of life including viruses, prokaryotes and eukaryotes. The serpin superfamily is characterised by more than 30% amino acid sequence homology with the archetypal serpin, antitrypsin (A1AT) (Carrell et al., 1985), a secretory serpin produced in the liver and delivered to the blood, through which it reaches the lungs where inhibits the protease neutrophil elastase. Serpins are mid-sized proteins (about 400 aminoacidic residues) whose tertiary structure consists of three β-sheets (A, B, and C), ten α-helices, and an exposed reactive center loop (RCL) of about 25 residues tethered between β-sheets A and C (Potempa et al., 1994) (Fig.1). This tertiary fold traps the molecule in a metastable conformation, resulting mainly from the labile configuration of a pair of parallel β-strands within the large central β sheet-A (β-strands s3A and s5A) (Gettins, 2002). Serpins are omnipresent throughout the body, residing both intra- and extra-cellularly. Circulating serpins are variably glycosylated, but the carbohydrate side chains are not required for inhibitory activity. Other inhibitory serpins are central in controlling proteolytic cascades in a number of fundamental biological pathways including blood coagulation, fibrinolysis, complement activation, and extracellular matrix (ECM) remodeling (such as neuroserpin). Inhibitory serpins are distinguished from all other protease inhibitors by their ability to set into motion a mousetrap-like mechanism that not only entraps the protease but also inactivates it.
Figure 1. The secondary structural features of a serpin. β sheets A, B, and C are shown in red, blue and
green, respectively. The ten α helices are designated A through H (hA – hH, all in yellow). The reactive center loop (RCL) is indicated in yellow at the top of the molecule. The first and second figure show respectively the front and the back of the protein. (Gettins, 2002).
The protease recognition site is contained within the exposed RCL in an accessible region for protease docking. Cleavage of the reactive site bond (termed the P1-P1’ bond) by the protease triggers a dramatic change in the conformation of both the serpin and the protease. The N-terminal portion of the cleaved RCL inserts as the fourth strand into the gap between strands s3A and s5A to yield a fully antiparallel β-sheet A (Huntington 2000; Gettins 2002; Huntigton 2011). During this transition, termed the stressed to relaxed transition, the RCL transports the covalently linked protease (at its intermediate stage of the catalytic cycle) from one pole of the serpin molecule to the other. Although the overall shape of the serpin
conformation, in which the cleaved RCL is accommodated within β-sheet A, is much more stable than the conformation of the native molecule. Most of the energy released by this transformation is used to severely distort the structure of the protease, as evident from the resolved crystal structures of several serpin-protease complexes. A negative consequence of these requirements is that the inhibitory activity of serpins is susceptible to impairment by point mutations which may lead to both deficiency and degenerative disorders. Most serpin-related disorders are caused by point mutations that, alone or in combination with other factors, disrupt the delicate conformation of the mutated serpin, rendering it vulnerable to self-association and tissue deposition. Amino acid substitutions in serpins result in an aberrant conformational transition that causes a spectrum of pathologies knows as serpinopathies. The serpinopathies are protein conformational diseases characterised by the polymerisation and intracellular deposition of mutant variants of the serpins within the endoplasmic reticulum (ER) of the cells that synthesize the protein. Currently, three models of serpin polymerisation are proposed in the literature, differing in the number of β-strands (1, 2, or 3) involved in the intermolecular linkage (Lomas et al.,1992; Ekeowa et al., 2010; Yamasaki et al., 2008; Yamasaki et al., 2011) (Fig.2). However, all three models incorporate release of strand 1 of beta-sheet C, expansion of
β-sheet A and insertion of reactive loop residues as an extra strand in beta-sheet A. The first model, proposed by Lomas and collaborators, suggests that the RCL is the only structural element inserted into the A sheet of an adjacent molecule during polymerisation (Lomas et al., 1992) [Fig. 2B(i)].
crystal structures of a dimer of antithrombin in which the molecules were linked by a beta-hairpin of the RCL and strand 5A (Yamasaki et al., 2008) [Fig. 2B(ii)]. More recently, a triple-strand model of polymerisation was extrapolated from the crystal structure of a closed trimer of A1AT (Yamasaki et al., 2011) [Fig. 2B(iii)]. The intermolecular linkage consists of the three C-terminal ß-strands (strand 1 of ß-sheet C and strands 4 and 5 of ß-sheet B of AAT). This mechanism, as the second one, requires a substantially unfolded intermediate state, associated with intramolecular insertion of the reactive site loop. In general, the mutation causes a conformational transition and the formation of an unstable intermediate characterised by the "opening" of the βA sheet and the partial insertion of the RCL, which is no longer exposed to the solvent. The formation of polymeric chains causes, for each mutant serpin, a loss-of-function phenotype due to the lack of active serpin in the extracellular place of action, and in some cases a gain-of-toxic-function phenotype due to intracellular polymer accumulation in the tissue of synthesis.
Figure 2. Models of A1AT polymerisation. A. Crystal
structure of native A1AT and key features indicated. The reactive loop (red), beta-sheet A in blue, beta-sheet B in gold, and beta-sheet C in green. The arrow indicates the site of the Z mutation, within the breach region where initial intramolecular loop insertion may occur. B. Three models of polymerisation. (i) Single strand (reactive loop) linkage model; (ii) beta-hairpin (strands 5A + 6A) linkage model; (iii) triple-strand (C-terminal motif: beta-strands
AIMS OF THE WORK
Serpinopathies are characterised by the misfolding and intracellular polymerisation of mutant forms of the serpin within the ER of the cell of synthesis and can be classified as “conformational diseases” that arise when proteins undergo self-association and tissue deposition (Carrell and Lomas, 1997). The retention of mutant protein causes damage due to the presence of polymers in the cell that synthetize the protein, whilst the lack of the circulating protease inhibitor causes an ineffective inhibition of its specific target (Lomas et al., 2016). These problems predispose the individuals to develop severe diseases depending on the type of mutated serpin. Examples of human mutant serpins accumulating and causing a toxic gain of function are alpha 1-antitrypsin (A1AT) variants causing cirrhosis (Sharp et al., 1969) and mutants of neuroserpin (NS) causing the dementia familial encephalopathy with NS inclusion bodies (FENIB) (Davis et al., 1999a). The best characterised of the serpinopathies is surely A1AT deficiency in which the Z mutation causes the retention of protein within hepatocytes, giving rise to inclusion bodies, in association with neonatal hepatitis, cirrhosis and hepatocellular carcinoma (Sveger et al., 1976; Dawwas et al., 2013), whilst the lack of A1AT, an important lung elastase inhibitor, predisposes the Z homozygote to early onset panlobular basal emphysema (Eriksson et al., 1986). FENIB is an autosomal dominantly inherited disease characterised clinically as a spectrum of phenotypes, from dementia to epilepsy with variable electrical
status (Gooptu et al., 2009), with the presence of eosinophilic
neuronal inclusions distributed throughout the deeper layers of the cerebral cortex and in many subcortical nuclei, especially
the substantia nigra. To date, six different mutations have been described in NS that promote its polymerisation in people affected by FENIB. In this work our interest is to evaluate with diverse approaches very different aspects of both pathologies. In the case of NS, following previous work in our laboratory in which we demonstrated the presence of oxidative stress in a novel neuronal model for FENIB neurodegeneration (Guadagno et al., 2017), our interest is to evaluate the cellular aspects involved in the polymer toxicity, focusing in particular on the mitochondrial network and its interconnection with oxidative stress and ER disfunctions. For A1AT deficiency, our interest is to explore a non-inhibitory function of this protein, to date not well understood and apparently not directly related with the onset of the pathology: its immunomodulatory role.
SECTION I
MUTANT NEUROSERPIN INDUCES
MITOCHONDRIAL ALTERATIONS IN A NEURONAL MODEL OF DEMENTIA FENIB
SUMMARY
Neuroserpin (NS) is a protein belonging to the serpins (serin protease inhibitors), a conserved superfamily of proteins that inhibit serin proteases. Several mutations have been identified as the cause of different pathologies, where mutant serpins form chains of polymers that accumulate within the endoplasmic reticulum (ER) of the cell of synthesis. The neurodegenerative dementia FENIB (familiar encephalopathy with neuroserpin inclusion bodies) is caused by polymerisation and deposition of the neuronal serpin neuroserpin within the ER of neurons. With the aim of understanding the toxicity due to intracellular accumulation of NS polymers, we have generated transgenic neural stem progenitor cells (NSPCs) from mouse fetal cerebral cortex, stably expressing the control protein GFP (green fluorescent protein), or human wild type (WT), polymerogenic G392E (GE) or truncated (delta) NS. In this cellular model, we have described the upregulation of several genes involved in the defense against oxidative stress in cells expressing G392E NS (Aldh1, Apoe, Gpx1, Gstm1,
Prdx6, Scara3, Sod2) (Guadagno et al., 2017). We are now
investigating the involvement of mitochondria in NS polymer toxicity. Our analysis of mitochondrial distribution shows a
cells, in contrast with filamentous mitochondria in cells expressing wild type NS or GFP. This phenotype is aggravated to mitochondrial fragmentation in the presence of a glutathione chelator, supporting a link between oxidative stress and mitochondrial dysfunction in the neurodegeneration FENIB. Moreover, treatment with the antioxidant molecules melatonin and tocopherol improves the perinuclear phenotype of the G392E NS cells, back to a distribution comparable to that of control cells. We also investigated the cellular morphology looking at the actin cytoskeleton and our results show an altered cellular morphology in cells that have altered mitochondria, in particular G392E NS cells show a lower number of well-developed neurites compared to WT NS cells. We evaluated mitochondrial function and found that the potential of the inner mitochondrial membrane is lower in G392E than WT NS cells, but no other parameters of the mitochondrial metabolism seemed to be altered as per seahorse analysis of the total population of cells. Lastly, in order to better understand how NS polymers cause mitochondrial deregulation, we evaluated the ER-mitochondria contact regions and found that in G392E NS cells these are less abundant than in cells expressing wild type NS.
SOMMARIO
La neuroserpina (NS) è una proteina facente parte delle serpine (inibitori di serin proteasi), una superfamiglia di proteine altamente conservata che inibisce le proteasi a serina. Fino ad ora sono state identificate numerose mutazioni alla base di altrettante patologie, dove le serpine mutanti formano
catene di polimeri che si accumulano nel reticolo endoplasmatico (RE) della cellula di sintesi. La neurodegenerazione FENIB (encefalopatia familiare con corpi di inclusione di neuroserpina) è causata dalla polimerizzazione e deposizione della serpina neuronale NS nel RE dei neuroni. Con il fine di comprendere la tossicità causata dall’accumulo intracellulare dei polimeri di NS, sono state generate linee di cellule staminali progenitrici neurali transgeniche, derivate dalla corteccia cerebrale fetale di topo ed esprimenti stabilmente la proteina di controllo GFP, o la NS umana in versione wild type (WT), la forma polimerogenica G392E (GE) o la variante troncata (delta) NS. In questo modello cellulare abbiamo già descritto l’aumento d’espressione di numerosi geni coinvolti nella difesa contro lo stress ossidativo nelle cellule che esprimono G392E NS (Aldh1, Apoe, Gpx1,
Gstm1, Prdx6, Scara3, Sod2) (Guadagno et al., 2017). I nostri
studi mirano attualmente a comprendere il coinvolgimento dei mitocondri nella tossicità indotta dai polimeri di NS. Le nostre analisi sulla distribuzione mitocondriale mostrano una redistribuzione perinucleare di questi organelli nelle cellule G392E, in contrasto con mitocondri disposti in maniera filamentosa delle cellule esprimenti neuroserpina WT o GFP. Questo fenotipo viene esacerbato fino alla frammentazione mitocondriale in presenza di un chelante del glutatione, il che supporta un collegamento tra stress ossidativo e il fenotipo mitocondriale presente nella demenza FENIB. All’opposto, il trattamento con le molecole antiossidanti tocoferolo e melatonina migliora il fenotipo perinucleare delle cellule G392E fino a valori comparabili ai controlli. Abbiamo inoltre studiato la morfologia cellulare concentrandoci sul
morfologia cellulare nei neuroni che presentano una alterata distribuzione mitocondriale; nel concreto, le cellule G392E NS hanno un numero minore di neuriti ben sviluppati quando comparate con le cellule WT. Abbiamo anche valutato la funzione mitocondriale e abbiamo trovato che il potenziale della membrana mitocondriale interna è minore nelle cellule G392E NS rispetto alle WT, ma nessun altro parametro del metabolismo mitocondriale sembra essere deregolato se valutati tramite seahorse assay sulla popolazione cellulare totale. Infine, con l’obiettivo di comprende meglio come i polimeri di NS influiscono sulla deregolazione mitocondriale, abbiamo valutato le aree di contatto tra RE e mitocondri, trovando che nelle cellule G392E NS ci sono meno punti di contatto tra i due organelli.
Introduction
The serpinopathies are protein conformational diseases characterised by the polymerisation and intracellular deposition of mutant variants of the serpins, within the endoplasmic reticulum (ER) of the cells that synthesize the protein. This mechanism results, in our case, in a neuropathological condition caused by mutations in neuroserpin (NS) (Roussel et al., 2011). This pathology, an autosomal dominant condition known as FENIB (familial encephalopathy with neuroserpin inclusion bodies), is a neurodegenerative dementia (Davis et al., 1999a). To date, six different mutations have been described in NS that promote its polymerisation in people affected by FENIB: Ser49Pro (Syracuse), Ser52Arg (Portland), His338Arg, Gly392Glu,
Gly392Arg and Leu47Pro. Mutant NS was found to
accumulate within affected neurons forming periodic acid-Schiff (PAS)-positive inclusion bodies known as Collins bodies, most abundant in the cerebral cortex but also present in other regions of the central nervous system (Davis et al., 1999b). Clinically this accumulation is translated in a spectrum of phenotypes, from dementia to epilepsy with
variable electrical status (Roussel et al., 2016). These main
phenotypical and biochemical features of FENIB deduced, respectively, from its clinical manifestations and from the postmortem analysis of affected brains, were confirmed through the expression of mutant NS in mice (Madani et al., 2003; Galliciotti et al., 2007), in Drosophila melanogaster (Miranda et al., 2008) and in diverse cellular systems (Miranda
et al., 2004, 2008; Roussel et al., 2013). Transgenic mice
abundant intraneuronal Collins bodies, neuronal loss in the cerebral cortex and hippocampus, and pathological phenotypes reminiscent of FENIB during late adulthood, while overexpression of human S49P, S52R, H338R and G392E NS in Drosophila melanogaster led to a decrease in locomotor activity, with decreasing mobility correlating to increased polymer content in the brain. In cellular models, polymer formation and its correlation with the disease phenotype was confirmed in transiently transfected COS-7 and stable inducible PC12 cell models of FENIB, where overexpression of each mutant variant lead to intracellular accumulation of polymeric NS within the ER to a degree that was proportional to the severity of FENIB as seen in patients (Miranda et al., 2004, 2008; Moriconi et al., 2015). Despite these results, the mechanism of toxicity of NS polymers in cellular models of disease has been elusive so far, since these cellular systems failed to show clear signs of cell malfunction and death upon NS polymer accumulation, precluding a detailed investigation of the mechanisms underlying NS polymer toxicity. This lack of a toxic phenotype could be related to the proliferative nature of these cell lines. To overcome these issues, we have recently developed a neuronal model with stable overexpression of WT, G392E and delta NS. Mouse neural stem cell progenitors were isolated from the cortex of mouse foetal brain, transfected with the NS variants and propagated
in vitro as proliferative cells, and later differentiated to mature,
non-dividing neurons for detailed studies of polymer toxicity. Our group has recently shown that, in this cellular model, expression of mutant G392E NS causes oxidative stress (Guadagno et al., 2017).
Oxidative stress, the imbalance between generation and disposal of reactive oxygen species (ROS), is an important factor in several neurodegenerative disorders including Alzheimer's, Parkinson's and Huntington's diseases and amyotrophic lateral sclerosis (Cobb and Cole, 2015). Neurons are particularly vulnerable to oxidative stress due to their high energy requirements, to a decrease in antioxidant defenses with age and to their terminally differentiated nature, and so oxidative stress is a key player in neurodegenerative disorders (Gandhi and Abramov, 2012). Under physiological conditions, ROS have important roles in signaling and immune defense, and their levels are kept under check by several antioxidant defense systems, including enzymatic (mainly superoxide dismutase, glutathione peroxidase, catalase and thioredoxin reductase) and non-enzymatic (specially glutathione, GSH) mechanisms, which can either scavenge ROS or decrease their formation (Li et al., 2013). The ER, where NS polymer formation takes place, provides an oxidizing environment for correct formation of disulfide bonds during protein folding. Accumulating evidence suggests that ROS can be generated as a by-product of protein oxidation during normal ER function and also upon ER stress due to accumulation of misfolded proteins. Both ER stress and oxidative stress, through ROS generation, may increase the leak of Ca2+ from the ER lumen, as well as induce protein and lipid oxidation. All these evidences support that the accumulation of serpin polymers within the ER may upset the redox balance in this organelle. The importance of mitochondria in energy production has long been appreciated, but new research into the dynamic nature of
physiology and disease (Knott et al., 2008). Mitochondria are important organelles in all cell types, but they are particularly important in the nervous system. Mitochondrial function is essential to neuronal processes such as energy production, Ca2+ regulation, maintenance of plasma membrane potential, protein folding by chaperones, axonal and dendritic transport and the release and re-uptake of neurotransmitters at synapses (Hoppins et al., 2007; Zhang et al., 2007). Because mitochondria are the main source of ROS, oxidative damage of mitochondrial proteins or DNA is likely to contribute to the mitochondrial dysfunction that is characteristic of many neurodegenerative disorders (Lin et al., 2006). High levels of ROS generation within the mitochondria further increase Ca2+ release from the ER, generating a vicious cycle of ROS production and cellular oxidative stress (Malhotra and Kaufman, 2007). From this starting point, in this work we decided to focus on mitochondrial behavior in our cell lines to better understand the interconnection between NS polymer, oxidative stress and neuronal toxicity.
Results
Generation and characterization of NSPCs expressing NS
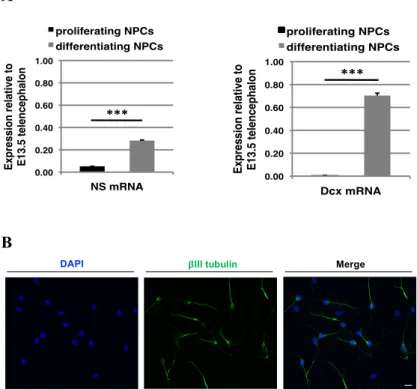
Since the cell lines in use can only be amplified for a limited number of passages, we decided to produce again the neural stem progenitor cell (NSPC) lines starting from murine cortex cells at 13.5 days of embryonic development (E13.5), as described in Guadagno et al. (2017). In order to gain a better knowledge of our cell model system, we assessed the levels of endogenous NS in naïve (non-transfected) NSPCs in proliferative conditions versus cells differentiated to a neuronal phenotype following our in vitro differentiation protocol for six days (Soldati et al., 2012). By real-time RT-PCR, we found that endogenous mouse NS expression increased approximately five times upon differentiation of NSPCs into neurons, and that expression levels in differentiated cells were nearly 30% of those found in E13.5 mouse telencephalic tissue (Fig. 1A, left panel). As a control, the expression of Dcx, a marker for differentiating neuroblasts, was strongly increased following six days of culture in differentiating conditions (Fig. 1A, right panel). Furthermore, to evaluate the differentiating conditions used for our assays, we performed an immunofluorescence for the neuronal marker β III tubulin and counted the positive cells on the total population, finding a percentage of nearly 55-60% of neurons (Fig. 1B).
A
B
Figure 1. Characterization of NS expression in naïve cells and differentiating conditions. A. Naïve cell
expression of endogenous NS mRNA in proliferating and differentiating conditions compared to expression in E13.5 telencephalon (left), and expression of the positive control gene for neuroblast differentiation Dcx (right). n=3 Data are mean ± SEM, t-test: ***p ≤ 0.001. B.
Immunofluorescence for βIII tubulin (green) to evaluate
the number of neurons on the total cell population after 0.00! 0.20! 0.40! 0.60! 0.80! 1.00! NS mRNA! proliferating NPCs! differentiating NPCs! Ex p re s s io n r e la ti v e to ! E1 3 .5 te le n c e p h a lo n ! !!!" 0.00! 0.20! 0.40! 0.60! 0.80! 1.00! Dcx mRNA! proliferating NPCs! differentiating NPCs! Ex p re ss io n r el ati ve to ! E1 3. 5 te le n ce p h al o n ! !!!"
six days treatment with the differentiation protocol. Cell
nuclei were stained with DAPI (blue) Scale bar 10μm.
As described in Guadagno et al. (2017), we introduced the transgenes by electroporation for constitutive expression of GFP and the NS variants. We thus recreated the four transgenic cell lines, which permanently overexpressed wild type NS (WT NS), the strongly polymerogenic G392E NS (GE NS), the truncated protein delta NS (dNS) and the green fluorescent protein (GFP), respectively. In all plasmids, the sequence for the gene of interest (NS or GFP) and the one for the puromycin resistance gene are expressed in a single bicistronic mRNA via an internal ribosome entry site (IRES), under the control of a strong CAG promoter that contains the enhancer sequence of human cytomegalovirus (CMV), which promotes constitutive expression of the gene of interest (Vallier et al., 2005) (Fig. 2A). NSPCs with stable integration and expression of WT, G392E NS, dNS or control GFP were selected and maintained by culturing in the presence of 1 μg/ml puromycin. We verified the correct expression of these constructs in our transgenic NSPC differentiated cultures by SDS and by non-denaturing PAGE followed by western blot analysis of the cell lysates and culture media (Fig. 2B). The results show that in denaturing conditions WT NS was found as a single band of nearly 50 kDa, partially in the cell lysate and partially in the extracellular medium, showing that WT NS was normally processed and secreted as a monomer. In contrast, G392E NS was detected in the cell lysate as a doublet of two close bands and no signal was apparent in the medium. Delta NS was detectable only in cell lysates after proteasomal
analyzed by non-denaturing PAGE and western blot, WT NS presented as a monomer, particularly visible in the culture medium, while G392E NS was detected as polymers of different sizes both in the cell lysate and culture medium. No NS signal was seen in the samples from GFP expressing cells
that were used as negative control.
B
Figure 2. Expression of NS in NSPC. A. Schematic
diagram of the pTP6 plasmid. The gene of interest and the puromycin resistance genes are separated by an internal ribosome entry site (IRES), and expression of both is driven by a human cytomegalovirus immediate early enhancer (HCMVIEE) coupled to the chicken β-actin promoter and first intron (CBA). The 3’ end contains a bovine growth hormone polyadenylation signal (bGHpA). The plasmid was linearized with ScaI, which cut within the ampicillin resistance (ampR gene) prior to introduction into NPCs by electroporation. B. Cell lysates and culture media of stably transfected NSPCs after differentiation into neurons, expressing control GFP
No n-de na tur ing PA G E S D S-PA G E polymers monomer 50 kDa β-actin
or not with the reversible proteasomal inhibitor MG132 (2
μM for 12h), but only the non-treated culture medium
was collected, since this variant of NS is not secreted (Davies et al., 2009). Samples were resolved by 10% w/v acrylamide SDS and 7,5% w/v acrylamide non-denaturating PAGE, and analysed by western blot with an anti-neuroserpin polyclonal antibody. The same membrane was probed for the housekeeping enzyme beta actin as a loading control.
G392E NS expressing cells show altered mitochondrial distribution
Recent research has demonstrated the role of oxidative stress in neurodegenerative diseases and the importance of the communication between the ER (where mutated NS accumulates) and mitochondria, which is known to be the major organelle involved in the response to oxidative stress and the main intracellular source of ROS (Maharjan et al., 2014). We thus decided to look at the mitochondrial network in our cell lines. We stained the cells with Mitotracker Red CMXRos © (Mitotracker), which is a red fluorescent dye that labels mitochondria within living cells using the mitochondrial membrane potential. Based on the literature and on our
analysis of the cellular phenotypes, we defined three
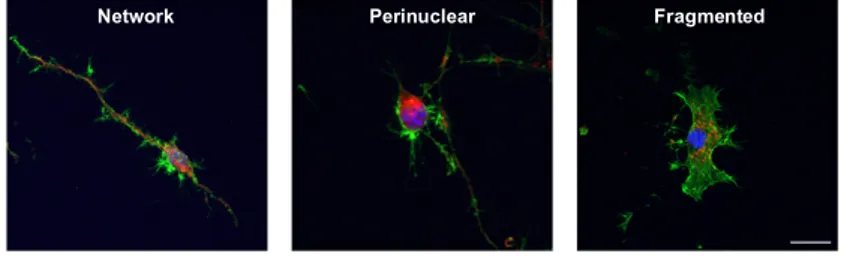
categories of mitochondrial distribution (Fig. 3A): i) network mitochondria homogeneously distributed throughout the cytoplasm, forming a filamentous network within the neurons (left panel); ii) perinuclear: mitochondria that appeared clustered in the neuronal soma and generally on one side of the nucleus (middle panel); and iii) fragmented: mitochondria appeared as small and rounded, and located close to the nucleus (right panel). In our analysis, we grouped perinuclear and fragmented mitochondria as “altered” distribution. In basal conditions, WT and delta NS expressing cells mostly showed the network-like distribution, indicative of a healthy mitochondrial network. Cells expressing G392E NS showed a higher proportion of altered mitochondria (nearly 40%), which were often found clustered close to the nucleus with no mitochondrial fragmentation, indicative of the underlying
neuronal exposure to the oxidative insult caused by H2O2 resulted in a significant change in mitochondrial distribution of control GFP cells: in untreated cells, healthy mitochondria were organized in a filamentous network; after exposure to H2O2 this transformed into a clustered distribution and in some cells into a fragmented phenotype. These changes resulted in a significant shift of mitochondria from category (i) into categories (ii) and (iii).
A B GFP GFP+H 2 02 WT G392E dNS 0 20 40 60 80 100 mitochondrial distribution (%) NETWORK PERINUCLEAR FRAGMENTED *** *** ***
Figure 3. Analysis of mitochondrial distribution in differentiated NSPCs. A. NSPCs were differentiated for
6 days and mitochondrial distribution was characterised after staining with Mitotracker (red). Three different mitochondrial phenotypes were defined: network (left panel), which showed filamentous mitochondria distributed throughout the cells; perinuclear (middle panel), in which mitochondria were clustered close to the nucleus and typically on one side of it; and fragmented (right panel), characterised by the strongly punctuate staining around the nucleus. B. Immunofluorescence panel of the four cell lines evaluated and percentage of healthy (network) and altered (perinuclear + fragmented) mitochondria for each cell line. As a positive control, GFP cells were treated with H2O2 100 μM, which mostly induced mitochondrial fragmentation. Cell nuclei were
stained with DAPI (blue). Data are mean ± SEM,n = 5;
t-test: ***p ≤ 0.001. (n= 100 cells/ 5 independent experiments) Scale bar 10μm.
Alterations of the mitochondrial network are directly related to the presence of intracellular polymers
Since we have observed the presence of NS polymers in the culture medium of G392E NS cells by western blot, we quantified them by sandwich ELISA using a monoclonal antibody with higher affinity for polymeric than monomeric NS (7C6, Miranda et al., 2008), and found an average
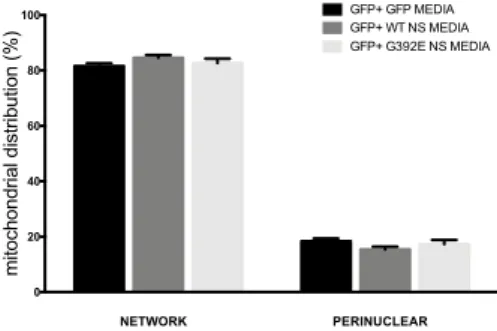
the mitochondrial network of G392E NS cells is caused by the accumulation of polymers in the ER or to their presence in the culture medium, we treated GFP control cells with culture medium preconditioned by GFP cells or cells expressing WT or G392E NS. We collected the conditioned media after three days of differentiation and used them to treat GFP cells for another three days of differentiation. At the end of the treatment, we used Mitotracker to evaluate mitochondrial distribution (Fig.4) and found that there were no significant changes when treating GFP cells with medium conditioned by either WT or G392E NS cells.
Figure 4. Analysis of mitochondrial distribution in GFP cells treated with preconditioned media derived from GFP, WT NS and G392E NS cells. GFP, WT NS
and G392E NS cells were differentiated for 3 days, after which culture media were collected and used to treat GFP cells for the remaining 3 days of differentiation.
NETWORK PERINUCLEAR 0 20 40 60 80 100 mitochondrial distribution (%) GFP+ GFP MEDIA GFP+ WT NS MEDIA GFP+ G392E NS MEDIA
Mitochondrial distribution was assessed after staining with Mitotracker. There were no significant changes in
mitochondrial distribution. Data are mean ± SEM, n = 5.
(n= 100 cells/ 5 independent experiments).
Pharmacological inhibition of the antioxidant defenses leads to enhanced mitochondrial perturbation in G392E NS cells
We next decided to investigate the effect of pharmacological inhibition of the cellular defenses against oxidative stress.
Glutathione (GSH) is an important antioxidant metabolite that
prevents cell damage caused by the presence of ROS, lipid oxidases and free radicals, and is involved in the mechanism of action of several of the enzymes that were overexpressed in our G392E NS expressing cells. Cellular levels of GSH can be
depleted by treating the cells with DEM (diethyl maleate). We
stained the cells with Mitotracker after treating them with DEM 50 μM for 1h. As shown in figure 5, GFP, WT and delta NS expressing cells showed little alterations of mitochondrial distribution after DEM treatment, while cells expressing G392E NS showed a stronger response to the pro-oxidant treatment with DEM, with a significant increase in the number of cells showing fragmented distribution, thereby supporting the oxidative nature of the insult caused by the presence of G392E NS polymers in the ER.
GFP WT G392E dNS 0 20 40 60 80 100 DEM 50μM mitochondrial distribution (%) NETWORK PERINUCLEAR FRAGMENTED *** ** * CTRL DEM 50 µM
Figure 5. Analysis of mitochondrial distribution in differentiated NSPCs after DEM treatment. The
percentage of healthy (network) and altered (perinuclear + fragmented) mitochondrial distribution was evaluated for each cell line after differentiation for 6 days and treatment with DEM at final concentration of 50 μM for 1h, by staining with Mitotracker and counting the cells with each of the three different distributions under a fluorescence microscope. Cell nuclei were stained with
DAPI (blue). The graph shows the mean ± SEM, n = 3;
t-test: ***p ≤ 0.001, **p ≤ 0.01, * p ≤ 0.05. (n= 100 cells/ 3 independent experiments) Scale bar 10μm.
The mitochondrial phenotype caused by expression of G392E NS is rescued by antioxidant molecules
We next decided to verify if antioxidant treatments could revert the perinuclear mitochondrial distribution seen in G392E NS cells. We selected two different antioxidants to test in our cell cultures: melatonin and alpha tocopherol. Melatonin is a pineal gland neurohormone that mediates photoperiodicity
in mammals, and alpha tocopherol is a vitamin that function as
a lipid soluble antioxidant protecting cell membranes from oxidative damage, but both are also well characterised antioxidant molecules. We first evaluated their effect in WT and G392E NS cells by treating them with increasing concentrations of melatonin and tocopherol for 24 and 48 h followed by staining with Mitotracker, to obtain dose-response curves for both molecules (Fig. 6A and B). After determining
the optimal concentration and time conditions, we treated all
four cell lines with 10 μM of each of the two compounds for
the lasts 48 h of differentiation. As shown in figures 7A and 7B, cells expressing GFP, WT and delta NS showed very mild changes, while cells expressing G392E NS showed a reduction in the percentage of cells with perinuclear distribution, decreasing to values similar to those seen for control cells.
A B WT WT 1µM WT 10µM WT 100µM G392E G392E 1µM G392E 10µM G392E 100µM 0 20 40 60 80 100
DOSE RESPONSE TOCOPHEROL 24h
mitochondrial distribution (%) NETWORK PERINUCLEAR * ** WT
WT 1µM WT 10µMWT 100µM G392E G392E 1µMG392E 10µMG392E 100µM 0 20 40 60 80 100
DOSE RESPONSE TOCOPHEROL 48h
mitochondrial distribution (%) NETWORK PERINUCLEAR ** *** * WT
WT 10µM WT 50µM WT 100µM G392EG392E 10µM G392E 50µM G392E 100µM 0 20 40 60 80 100
DOSE RESPONSE MELATONIN 24h
mitochondrial distribution (%) NETWORK PERINUCLEAR * * WT WT 10µM WT 50µM WT 100µM G392E
G392E 10µMG392E 50µMG392E 100µM 0 20 40 60 80 100
DOSE RESPONSE MELATONIN 48h
mitochondrial distribution (%)
NETWORK PERINUCLEAR
Figure 6. Dose-response curves for tocopherol and melatonin treatments. WT and G392E NS NSPCs were
differentiated for 6 days and mitochondrial distribution was analyzed by staining with Mitotracker after treatment with tocopherol (A) or melatonin (B) at the indicated doses (1, 10, 100 μM) during the last 48 or 24 h of differentiation. Data are mean ± SEM, n = 3; t-test: ***p ≤
0.001, **p ≤ 0.01, *p ≤ 0.05. (n= 100 cells/ 3 independent experiments).
- + - + - + - + 0 20 40 60 80 100 TOCOPHEROL 10µM 48h mitochondrial distribution (%) NETWORK PERINUCLEAR *** * GFP WT NS G392E NS dNS CTRL Tocopherol 10 µM A
- + - + - + - + 0 20 40 60 80 100 MELATONIN 10µM 48h mitochondrial distribution (%) NETWORK PERINUCLEAR *** GFP WT NS G392E NS dNS CTRL Melatonin 10 µM B
Figure 7. Analysis of mitochondrial distribution in differentiated NSPCs treated with antioxidant molecules. NSPCs overexpressing GFP, WT NS,
G392E NS or delta NS were differentiated for 6 days, treating with 10 μM alpha tocopherol (A) or 10 μM melatonin (B) during the last 48 h, and mitochondrial distribution was characterised by staining with Mitotracker. Cell nuclei were stained with DAPI (blue).
Data are mean ± SEM, n = 5; t-test: ***p ≤ 0.001, * p ≤
0.05. (n= 100 cells/ 5 independent experiments) Scale
bar 10μm.
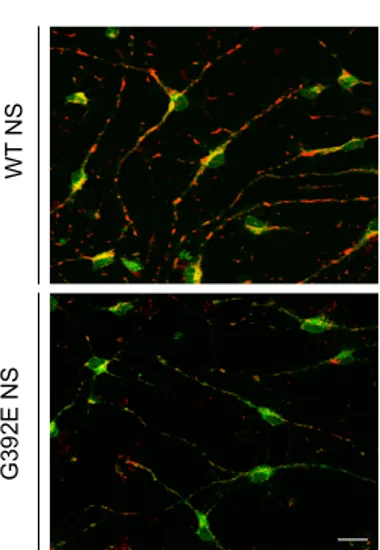
Cellular morphology is altered in cells with altered mitochondrial distribution
Given the altered distribution of mitochondria in our cells, we investigated if the general morphology of these cells was also altered, by looking at the actin cytoskeleton. We performed a double staining with Mitotracker and phalloidin-Alexa 488, which specifically binds the polymerised actin cytoskeleton, in cells differentiated for six days. Our results show a strong change in the morphology of cells that have perinuclear and fragmented mitochondrial phenotypes (Fig. 8). Neuronal cells that presented network mitochondrial distribution had well-developed neurites, while cells with a perinuclear or fragmented phenotype mitochondria located close to the
nucleus in correlation with the absence of well-developed neurites.
Figure 8. Neuronal morphology and mitochondrial distribution of differentiated NSPCs. NSPCs were
differentiated for 6 days and double stained for mitochondrial morphology with Mitotracker and for cell morphology with phalloidin-Alexa 488 (red and green respectively). Cell nuclei were stained with DAPI (blue).
Representative images obtained with a confocal microscope (Zeiss) Scale bar 10μm.
To quantify this observation, we evaluated neurite length in WT and G392E NS cells differentiated for six days and double stained with Mitotracker and phalloidin-Alexa 488, and measured neurite length using the image analysis software “Image J” (NIH software), a public domain Java image processing program, and the specific plug in “Neuron J”. As
Network Perinuclear Fragmented
shown in figure 9, G392E NS cells had shorter neurites when compared to WT NS cells.
A B
Figure 9. Evaluation of neurite length in differentiated NSPCs. A. NSPCs were differentiated for
6 days and mitochondrial morphology was assessed with Mitotracker and the cell morphology with phalloidin-Alexa 488 (red and green fluorescence respectively). Cell
nuclei were stained with DAPI (blue). B. Quantification of
neurite length in images obtained as in A, data are mean ± SEM, n=3; t-test: ***p ≤ 0.001. (n= 50 cells/ 3 independent experiments) Scale bar 10μm.
*** WT NS G392E NS 0 20 40 60 80 Ne u ri te le n g h t ( μ m) WT NS G392E NS
The potential of the inner mitochondrial membrane is lower in G392E NS than WT NS cells
To understand if the altered distribution of mitochondria is also related with functional alterations, we evaluated one of the most important parameters directly related to the health of mitochondria, the inner membrane potential. In order to asses
this we used the cationic dye
5,5',6,6'-tetrachloro-1,1'3,3'-tetraethylbenzamidazol-carboncyanine (JC-1). Healthy mitochondria can transport JC-1 into their matrix, where it forms aggregates that produce red fluorescence. If the inner mitochondrial membrane is depolarized, the dye fails to cross it and remains outside the organelle in its monomeric form returning green fluorescence. The ratio between red and green fluorescence thus correlates with the potential of the inner mitochondrial membrane, allowing to assess mitochondrial state. Red JC-1 aggregates and green monomers were visualized simultaneously with a dual band-pass filter for fluorescein (Ex/Em 490/520 nm)/rhodamine (Ex/Em 540/570
nm). Confocal microscopy images of living cells were
analyzed and quantitated as red (aggregate)/green (monomer) ratio using image analysis software “Image J”. As shown in figure 10, the proportion of green fluorescence in G392E NS cells is higher than in the WT NS ones, suggesting a functional alteration in mitochondria of cells expressing polymerogenic G392E NS.
A B
Figure 10. Evaluation of inner mitochondrial membrane potential using JC-1 staining in differentiated NSPCs. A. NSPCs were differentiated for
6 days and inner mitochondrial membrane potential was analyzed with the JC-1 probe by imaging of living cells with confocal microscopy. B. Quantification of the red fluorescence (aggregated JC-1)/green fluorescence (monomeric JC-1), mean ± SEM, n=3; t-test: **p ≤ 0.01. (n= 100 cells/ 3 independent experiments) Scale bar
10μm. WT NS G392E NS 0 5 10 15 re d /g re en f lu o re sc en ce ra ti o ( A .U ) ** WT N S G3 9 2E N S
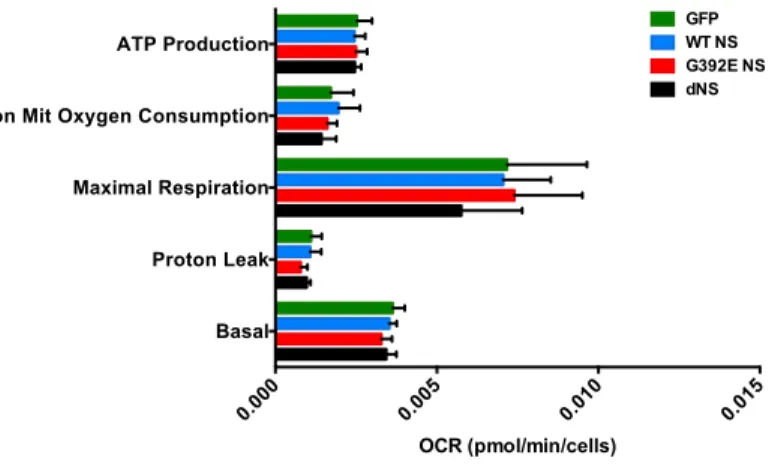
G392E NS cell cultures do not show alterations in mitochondrial metabolism
Mitochondria are essential for the energy metabolism of cells and alterations of the mitochondrial respiration can induce mitochondrial failure. Oxygen consumption rate (OCR) is an important indicator of normal cellular function and it is routinely used to investigate mitochondrial functionality. Using a Seahorse platform in collaboration with Prof. Michael Duchen (UCL, London, UK) and Lorita Gianfrancesco, a former master student in our lab, OCR was measured before and after the addition of inhibitors, in order to derive several parameters of mitochondrial respiration for all cells in culture wells of GFP, WT NS, G392E NS and dNS lines differentiated for six days. Initially, baseline cellular OCR is measured, from which basal respiration can be derived by subtracting non-mitochondrial respiration. Next, oligomycin, a complex V inhibitor, is added and the resulting OCR is used to derive ATP-linked respiration (by subtracting the oligomycin rate from baseline cellular OCR) and proton leak respiration (by subtracting non-mitochondrial respiration from oligomycin rate). Next, carbonyl cyanide-p-trifluoromethox-yphenyl-hydrazol (FCCP), a protonophore, is added to collapse the inner membrane gradient, allowing the electron transport chain to function at its maximal rate, and maximal respiratory capacity is derived by subtracting non-mitochondrial respiration from the FCCP rate. Lastly, antimycin A, inhibitor of complex III, is added to shut down the electron transport chain function, revealing the non-mitochondrial respiration. The mitochondrial reserve capacity is calculated by
capacity (see Methods for a graphic explanation). As reported in figure 11, none of the parameters evaluated showed variations in our cell lines.
A
B
0 1 2 3
Coupling Efficiency (%) Spare Resp Capacity (%)
OCR (pmol/min/cells) 0 20 40 60 80 0.000 0.005 0.010 0.015 Time (min): OC R ( p m o l/m in /c ells ) GFP WT NS G392E NS dNS Oligomycin 1µM FCCP 1µM Antimycin A 2.5 µM 0.000 0.005 0.010 0.015 Basal Proton Leak Maximal Respiration Spare Respiratory Capacity Non Mit Oxygen Consumption ATP Production OCR (pmol/min/cells) GFP WT NS G392E NS dNS
Figure 11. Seahorse analysis of differentiated NSPCs. A. NSPCs were differentiated for 6 days and
Seahorse assay was performed, by recording the oxygen consumption rate of each culture well, in the presence of pharmacological treatments as described in the main text B. Mitochondrial metabolic parameters evaluated in all four cell lines. Data are mean ± SEM, n=5, one-way ANOVA.
0.000 0.005 0.010 0.015
Basal Proton Leak Maximal Respiration Non Mit Oxygen Consumption ATP Production OCR (pmol/min/cells) GFP WT NS G392E NS dNS
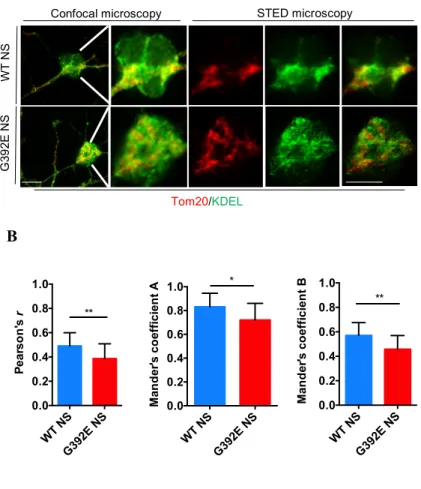
G392E NS cells show a reduction in ER-mitochondria membrane contact sites
Recent studies support the importance of the communication between the ER, where mutated NS accumulates, and
mitochondria. ER-mitochondria contact sites are highly
dynamic structures controlling lipid and calcium homeostasis and mitochondrial metabolism, as well as several intracellular processes and signaling pathways. Since NS polymers accumulate inside the ER, we investigated the crosstalk between ER and mitochondria by assessing the extent of their contact regions, the mitochondria associated membranes (MAMs), comparing MAMs in G392E NS neurons to those of WT NS ones. In collaboration with Dr. Giovanna Galliciotti (University Medical Center Hamburg-Eppendorf, Germany), we double stained cells differentiated for six days for Tom20, an import channel of the outer mitochondrial membrane, and KDEL, the ER retention motif found in many ER resident proteins. By using stimulated emission depletion (STED) microscopy, a high-resolution confocal microscopy approach, we quantified the overlapping between these two organelles with Imaris Microscopy Software and found that G392E NS cells had a reduced contact between ER and mitochondria when compared to WT NS cells (Fig. 12). This result was also confirmed by western blot analysis of some proteins characteristic of the contact regions between ER and mitochondria which are directly involved in the transport of calcium between the two organelles, Sigma1R, VDAC and IP3R. As shown in Fig. 13 all three proteins show a significant decrease in G392E NS cells.
A
B
Figure 12. Evaluation of ER-mitochondria contact regions with STED confocal microscopy. NSPCs
were differentiated for 6 days, double stained for Tom20 (red), and KDEL (green), and analysed with STED
confocal microscopy and Imaris Microscopy Software. A.
Immunofluorescence panels of regular confocal and STED confocal microscopy of representative cells. B.
WT NS G392E NS 0.0 0.2 0.4 0.6 0.8 1.0 Pe ar so n 's r ** WT NS G392E NS 0.0 0.2 0.4 0.6 0.8 1.0 Ma n d er 's c o effi ci en t A * WT NS G392E NS 0.0 0.2 0.4 0.6 0.8 1.0 Ma n d er 's c o effi ci en t B **
Confocal microscopy STED microscopy
G3 9 2E N S WT N S Tom20/KDEL
Pearson’s and Mander’s coefficients (A= overlapping of red fluorescence on green fluorescence, B= overlapping of green fluorescence on red fluorescence) measured in cells expressing either WT or G392E NS. Data are mean ± SEM, n=3 (15-20 neurons analyzed per experiment), t-test: **p ≤ 0.01, * p ≤ 0.05. Scale bar 10μm.
Figure 13. Evaluation of proteins characteristic of
ER-mitochondria contact sites. Samples were
resolved by 10% w/v acrylamide SDS PAGE and GFP WT NS G392E NS dNS 0 1 2 3 ( A .U ) ** ** * SIGMA1R GFP WT NS G392E NS dNS 0 1 2 3 4 ( A .U ) ** * VDAC GFP WT NS G392E NS dNS 0.0 0.5 1.0 1.5 2.0 ( A .U ) * ** IP3R
analysed by western blot with an anti-Sigma1R, -VDAC and -IP3R antibodies. The same membrane was probed for the housekeeping enzyme beta actin as a loading
Discussion
In this part of my PhD project, we investigated the cellular consequences of the presence of NS polymers in the ER by expressing a highly polymerogenic FENIB variant, G392E NS, in NSPCs. Previous work in the lab started from an unbiased analysis of the entire mRNA profiles of NSPCs expressing G392E NS or negative control GFP differentiated
in vitro to produce neurons. This analysis identified 747 genes
significantly altered in G392E NS cells, either up-regulated (623) or down-regulated (124). Among these, we selected 17 overexpressed and 4 under expressed genes as particularly relevant to our studies due to their role in oxidative stress, and demonstrated that the expression of G392E NS induced adaptation of NSPCs to pro-oxidant conditions, and when challenged by pharmacological inhibition of the anti-oxidant response they died by apoptosis (Guadagno et al., 2017). Because these cell lines can be amplified only for a limited number of passages (usually between 15 and 20 times), we started the present work by recreating the same NSPC lines and demonstrating that our in vitro differentiation protocol produced neurons and the overexpressed genes behaved as published in our previous work (Guadagno et al., 2017). The expression of Dcx, a marker of differentiating neuroblasts, was strongly increased in our differentiation conditions, indicating that, in agreement with previous publications (Onorati et al., 2011), our six days differentiation protocol produces immature neurons, nearly 60% of the total culture by positivity to βIII tubulin, and that our in vitro system can recapitulate the upregulation of endogenous NS expression observed during
the levels found in mouse telencephalic tissue at E13.5. Using the newly generated cell lines expressing GFP, WT NS, G392E NS and delta NS we confirmed that in differentiating conditions WT NS was correctly secreted as a monomer into the culture medium, while G392E NS accumulated as polymers within ER and delta NS was degraded by ERAD, in accordance with the handling of NS described in other cell model systems (Miranda et al., 2004 and 2008; Krueger et al., 2009; Davis et al., 2009; Roussel et al., 2013), as well as our results in the first work published using NSPCs (Guadagno et al., 2017).
Recent research has demonstrated the role of oxidative stress in neurodegenerative diseases and the importance of the communication between the ER and mitochondria, the major organelle involved in the response to oxidative stress.
Mitochondrial function is essential to neuronal processes such as energy production, Ca2+ regulation, maintenance of plasma membrane potential, protein folding by chaperones, axonal and dendritic transport and the release and re-uptake of neurotransmitters at synapses (Chan, 2006a, b; Hoppins et al., 2007; Zhang et al., 2007). Moreover, axonal transport of mitochondria is required for neuronal function (Hollenbeck et al., 2005). Several evidences support a role for mitochondrial morphology and dynamics in neurodegenerative disorders (Maharjan et al., 2014). Recent studies about apoptosis have uncovered a central role for mitochondria, showing the disintegration of the mitochondrial network and the formation of punctiform mitochondria located close to the nucleus early during apoptosis (Karbowski et al., 2002; Desagher et al.,
in our neuronal model for the dementia FENIB, where we identified three types of mitochondrial distribution: network mitochondria, typical of healthy cells and homogeneously distributed throughout the neuronal cytoplasm; perinuclear mitochondria, in which mitochondria are found clustered close to the nucleus, generally on one side; and fragmented mitochondria, distributed all around the nucleus with a clear
punctuate staining. Mitochondrial fragmentation is typical of
neurodegenerative processes, while clustering of mitochondria close to the nucleus has been shown during the initial steps of caspase-independent apoptosis, as with tau overexpression in Alzheimer’s disease (Ebneth et al., 1998; Satoh et al., 2005; Trinezek et al., 1999). In basal conditions, differentiated NSPCs expressing G392E NS showed a higher proportion of cells with mitochondrial clustering close to the nucleus, suggesting that NS polymers induce mitochondrial alterations as part of their toxic effect. Moreover, since the addition of culture medium containing NS polymers secreted by G392E NS cells did not cause an increase in perinuclear mitochondria in GFP cells, the increase in altered mitochondrial distribution seen for G392E NS cells should be due to the intracellular accumulation of polymers within the ER. Since alterations in mitochondrial dynamics have been described in numerous neurodegenerative disorders and under oxidative stress conditions, our results suggest that the mitochondrial phenotype observed in G392E NS cells is due to the oxidative stress induced by accumulation of NS polymers (Guadagno et
al., 2017). Recent studies conducted in mouse models have
shown an association between oxidative stress and the pathophysiology of the best-described serpinopathy, alpha-1
accumulation of alpha-1 antitrypsin (A1AT) polymers within the liver (Lomas et al., 2002). A1ATD mice showed higher GSTs mRNA levels but no differences were found in total GSH content if compared to control mice (Marcus et al., 2012). Furthermore, an increase in oxidative stress has been demonstrated in young patients with A1ATD before the development of severe clinical manifestations (Escribano et al., 2014). Serum measurements in these patients showed low total and reduced GSH as well as reduced catalase activity,
supporting the implication of oxidative stress in A1ATD associated to the presence of A1AT polymers. We have reported recently the activation of an adaptive antioxidant
response in our G392E NS cells that masked the neurotoxic
effect of NS polymer accumulation, and which could be unmasked with a chelator of glutathione (DEM). We now show that the same treatment leads to the appearance of fragmented mitochondria in our NSPCs, with G392E NS neurons as the most sensitive to the pro-oxidant treatment, confirming the link between oxidative stress and mitochondrial alterations in our model of FENIB. In the opposite way, we have found that two antioxidant molecules,
melatonin and a-tocopherol, can decrease the proportion of
neurons with perinuclear mitochondria to levels similar to
those of WT NS and GFP control neurons. Melatonin has
hormonal as well as anti-inflammatory and anti-apoptotic properties (Calvo et al., 2013), is implicated in energy metabolism and thermoregulation in mammals and plays also a vital role in the lessening of neonatal hypoxia–ischemia induced ER stress in neural cells of newborn rats (Carloni et al., 2014). The experimental evidence supports its actions as a
al., 2003), as an indirect antioxidant by stimulating antioxidant enzymes (Reiter et al., 2000), by stimulation of the synthesis of glutathione (Urata et al., 1999), by protection of antioxidative enzymes from oxidative damage (Mayo et al., 2003), and due to its ability to increase the efficiency of mitochondrial electron transport chain thereby lowering electron leakage and reducing free radical generation (Okatani et al., 2003). Similarly, a-tocopherol, or vitamin E, is a lipid soluble antioxidant that protects cell membranes from oxidative damage and has a protective action at nanomolar and micromolar concentrations against H2O2-induced brain cortical neuron death (Zakharova et al., 2017). We tested both antioxidants after performing dose-response curves and found a significant rescue of the perinuclear mitochondrial phenotype for G392E NS cells. These results confirm the link between oxidative stress and mitochondrial alteration in these cells and suggest that overexpression of cellular antioxidant defenses together with exogenous administration of antioxidant molecules promotes a reversion of the altered mitochondrial distribution, reverting it to control levels. Our results show that cells with altered mitochondrial distribution generally lack well-developed neurites, as seen by co-staining of mitochondria and polymerised actin. In agreement with this observation, we found that G392E NS cells, compared with the WT ones, had shorter neurites. Recent evidences indicate that there is a constant crosstalk between the actin cytoskeleton and the release of ROS by mitochondria (induced by either hypo- or hyper-polarization of the mitochondrial membrane) (Wilson and Gonzalez-Billault,
migration and chemotaxis, which are actin-dependent processes especially for neurons (Roberts et al., 1999; Ambruso et al., 2000; Kim and Dinauer, 2001). Whereas physiological ROS production is needed for proper cytoskeleton polymerisation, oxidation tends to disrupt polymerisation and impair cytoskeletal dynamics under oxidative stress conditions (Munnamalai and Suter, 2009; Hung et al., 2018; Morinaka et al., 2011; Wilson et al., 2015). Indeed, there are evidences on the role of ROS as promoters of neuritic growth influencing the state of actin polymerisation under physiological conditions (Munnamalai and Suter, 2009), but it has also been demonstrated that the persistent presence of ROS causes carbonylation of actin, producing the loss of lamellipodia and the arrest of cellular plasticity (Barth et al., 2009). Our findings suggest the possibility that the chronic oxidative condition promoted by G392E NS expression influences the cytoskeletal dynamics of neurons, during dendrite formation or during the definition of synaptic spines, but further investigations are needed to understand link between oxidative stress, altered mitochondrial distribution and cytoskeleton dynamics in our cellular model of FENIB. To better understand the extent of the mitochondrial perturbation in our G392E neurons we looked at one of the most important parameters of mitochondria, its inner membrane potential (ψm), a sensitive indicator of the energy state of mitochondria and cell viability. Our results support a decrease in ψm of G392E NS cells differentiated to neurons, compared to cells overexpressing WT NS. The loss of membrane potential can have different meanings and there are
between membrane potential and ROS genesis (Duchen et al., 2004). Depolarization of mitochondria following excessive ROS production is an early sign of mitochondrial dysfunction and precedes many other signs of cell injury (Zamzami et al. 1997). In several cellular models a concomitance between the loss of inner mitochondrial membrane potential and an increase in ROS genesis has been highlighted, with a consequent increase in oxidative stress (Satoh et al. 1997; Wood-Kaczmar et al 2008; Gottlieb et al. 2000; Ricci et al. 2003). Furthermore, oxidative damage affects mitochondria at different levels, resulting in increased mtDNA mutations and protein and lipid oxidation. Recent studies suggest a central role for mitochondrial potential and oxidative damage to the organelle in the gradual decline of brain functions during aging (Nicholls et al., 2004). In agreement with this, Xiong et al. (2002) found a 5 mV decrease in ∆ψ of acutely isolated cerebellar slices from old mice compared to young ones. In collaboration with the laboratory of Prof. M. Duchen at UCL (London, UK), we analysed our NSPCs by Seahorse assay, a well-stablished approach to measure key mitochondrial bioenergetic and metabolic parameters in whole cell
populations of cultured wells. We found no significant
differences between the four cell lines, probably due to the mixed character of our differentiated cultures, which contain glial as well as neuronal cells, but also suggesting that mitochondrial function is not excessively altered in G392E NS neurons, in agreement with the lack of neuronal death observed for these cells in basal conditions.
interaction at particular regions of contact between their
membranes, the mitochondria-ER sites (MAMs). Since NS
polymers accumulate inside the ER, we have also investigated the crosstalk between ER and mitochondria by assessing the extent of MAMs in G392E NS neurons compared to WT NS ones. Our results show a decrease in the area of contact between the two organelles and a concomitant decrease of proteins characteristics of these sites. These results directly link the alterations due to the expression of the polymerogenic G392E NS with the mitochondrial alterations described above. The contacts between ER and mitochondria are abundant in all neuronal compartments and often the ER forms a network that "embraces" the mitochondria (Wu et al., 2017). The molecular composition of MAMs is very heterogeneous in different eukaryotic cells and, in mammals, includes an abundant and complex range of proteins (Lee e Min, 2018). Mitochondrial proximity to the ER governs especially the dynamics of calcium transfer from the ER to mitochondria (Mironov et al., 2005), relying particularly in the initial complex formed by interaction between IP3R (inositol triphosphate receptor, localized in the ER membrane), Grp75 (glucose-regulated protein 75) VDAC (voltage-dependent anion channel 1, localized at the outer mitochondrial membrane) and Sigma-1 receptor (localized in the ER membrane). The impairment of RE-mitochondria communication has a decisive role in metabolic and neurodegenerative diseases and in cancer. There are numerous studies in which structural and functional changes have been observed at MAMs in neurodegenerative diseases such as Alzheimer’s and Parkinson’s diseases (Lee and Min, 2018). Although the role of MAMs in
Alzheimer’s disease suggest that increased communication between ER and mitochondria may enhance neuronal death, probably due to an increase in Ca2+ influx within the mitochondria (Hedskog et al. 2013). On the contrary, in Parkinson’s disease neurodegeneration seems related to disintegration of MAMs: α-synuclein has been identified at the level of these sites (Guardia-Laguarta et al., 2014), and mutations that affect this protein in patients with familial Parkinson’s disease promote a decrease in ER-mitochondria contact sites, as well as greater fragmentation of the mitochondrial network (Cali et al., 2012), reminiscent of our own findings for FENIB.
In summary, our present work shows for the first time the interconnection between NS polymer deposition and oxidative stress with ER-mitochondria communication and mitochondrial alterations in FENIB. Our data support that expression of polymerogenic mutant NS causes pro-oxidative conditions in neuronal cells that alter the dynamics and functionality of mitochondria. These new aspects of the neurodegenerative dementia FENIB are consistent with recent findings showing that oxidative stress and mitochondrial dysfunction lead to neurodegeneration and aging and underlie the pathology of several neurodegenerative disorders.