true entrepreneurship or exclusion
from (wage-)employment?
▸
Job satisfaction of shifters into self-employment informs us about their risk of social ex-clusion▸
Those who shift into self-employment are the more motivated wage-employed seeking higher job satisfaction▸
Social exclusion is not a likely outcome to those who shift into self-employment▸
Institutional features, such as the differential inclusion of self-employed and wage-emplo-yed into unemployment insurances and the level of employment protection, also explain these shifts22.1 Entrepreneurship choice among
older workers
Social inclusion and work are closely related. Those who work in an organisa-tion, firm or instituorganisa-tion, are typically more socially included that those who do not (Morgana 2010). However, many (older) workers decide or are forced to leave employment. In many cases, the reinclusion into wage-employment (WE) is dif-ficult, mostly at later ages. In that case, transitions into self-employment (SE) are a good option to go back into work. However, not all those who shift into SE do so out of necessity to avoid social and economic exclusion, it is often a conscious occupational choice. In this chapter, we look at shifts into SE of individuals in their working careers’ later stage. We investigate whether shifts stem from a con-scious planning/choice or whether they are taken out of necessity because older workers tend to be excluded from the labour market. We search for indications of the exclusion hypothesis using job-satisfaction data, as we want to test whether shifters were dissatisfied with their previous job.
This is a very important question to answer, because SE may hide unemploy-ment for a large fraction of the population. This would imply that the increase in SE, which is observed in many European countries, is not motivated by entre-preneurship but rather testifies to the rigidities and difficulties of re-entrance in the labour market for older workers that get dismissed, possibly highlighting the higher cost of WE relative to SE. The policy reactions to these two options are
evi-dently completely different. For instance, many observers claim that SE is partly responsible for the limited participation in unemployment insurance (UI) pro-grammes of the older people (Kautonen et al. 2010).
In this study, we examine job satisfaction data included in SHARE before the shift into SE (Waves 4 and 5). Schnalzenberger et al. (2008) have previously inves-tigated the relationship between job satisfaction and transitions into retirement. They use SHARE data 2004-2006 and report that subjective overall job-satisfac-tion is a strong predictor for early retirement. In the same vein, we look at tran-sitions into SE using fresher data. The numerous questions about perceived job quality and satisfaction included in SHARE should reveal whether those who are less satisfied with their current job are more likely to shift.
22.2 Empirical set up and sample description
22.2.1 Employment and occupation
The first step in the analysis is the definition of the employment status (work or not) and occupation (WE or SE). We define the labour market status and occu-pation combining the information reported in two questions included in the 4th
and 5th wave of SHARE. The first concerns the self-reported current job situation
(“In general, which of the following best describes your current employment sit-uation? 1. Retired, 2. Employed or self-employed (including working for family business), 3. Unemployed, 4. Permanently sick or disabled, 5. Homemaker, 97. Other (Rentier, Living off own property, Student, Doing voluntary work)” and the second requests respondents to describe their current main occupation (“In this job are you an employee, a civil servant, or self-employed?”). The answers to these two questions allow for the definition of four mutually exclusive labour market states: SE, WE, retired (RE), Unemployed (UI). RE is defined as fully retired, i.e. it excludes semi-retired and partially retired. Fully retired are individuals who answer “Retired” to first question and do not declare to be either an employee, a civil servant, or self-employed when answering the second. WE includes both employees and civil servants. It also includes semi-retired and partially retired. UI includes unemployed, permanently sick or disabled, homemakers and others. Before using the data, we carry out some necessary selection to the sample. First, as we study shifts, we only keep those observed both in Waves 4 and 5. Also, we only keep those reporting valid information in the aforementioned questions concerning employment and occupation. As we concentrate on mature workers, we also limit the sample to those aged 50 to 70 in Wave 4. The resulting sample
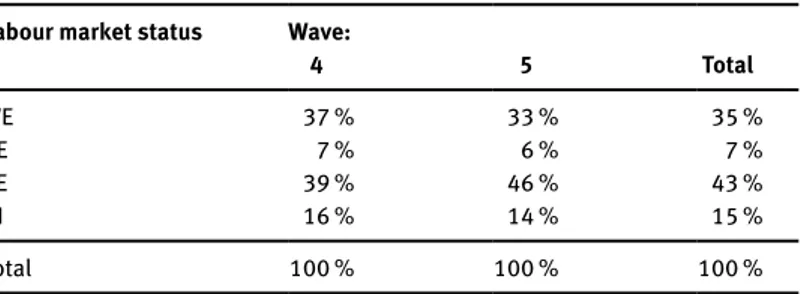
counts 24,423 individuals. Table 22.1 reports the distribution of labour market states in our sample. Obviously, when getting older, workers and UI retire.
Table 22.1: Distribution of labour market status of SHARE panel components in Wave 4 and
Wave 5
Labour market status Wave:
4 5 Total WE SE RE UI 37 % 7 % 39 % 16 % 33 % 6 % 46 % 14 % 35 % 7 % 43 % 15 % Total 100 % 100 % 100 %
Notes: Number of observations: 24,423
Source: SHARE Wave 4 release 1.1.1, Wave 5 release 0
Table 22.2 shows the transition matrix among labour market states between Wave 4 and 5. The table shows observed frequencies and percentages by row (in italics).
Table 22.2: Transitions among labour market states between Wave 4 and 5: frequencies and
percentage (in italics)
Labour market status Wave 5
WE SE RE UI Total Wa ve 4 WE 7,323 80.35 1982.17 1,13412.44 4595.04 9,114100 SE 228 12.68 1,21767.69 24413.57 1096.06 1,798100 RE 233 2.43 971.01 8,96593.53 2903.03 9,585100 UI 335 8.53 621.58 88822.62 2,64167.27 3,926100 Total 8,119 33.24 1,5746.44 11,23145.99 3,49914.33 24,423100 Source: SHARE Wave 4 release 1.1.1, Wave 5 release 0
Table 22.2 shows high state dependence, which is visible along the diagonal. About two per cent of WE shifts to SE between waves. The opposite transition from SE to WE is much more likely, roughly 13 per cent. Retirement on the con-trary is (almost) an absorbing state: 94 per cent of RE in Wave 4 remained RE
in Wave 5. About 3.5 per cent returned to work either as WE or SE. One should keep in mind that partial retirees are defined as workers and included in WE or SE. Especially for this type of transitions (RE to WE/SE) there might be a sizable country heterogeneity induced by different rules on accumulation of pension income with earnings (Börsch-Supan et al. 2009). Frequencies are unfortunately too low for disaggregating transitions by country.
22.2.2 Job quality and satisfaction
The analysis of job quality and job satisfaction should provide the answer to the question concerning what has possibly motivated the shift into SE. To this end, we use job satisfaction data from Wave 4, i.e. prior to the shift, which we describe in this paragraph. We prefer not to carry out the analysis of satisfaction indicators after the shift due to the following reasons. Questions on job quality in SHARE Wave 5 are asked only to those panel individuals who (have continuously worked and) have experienced a change in job since the last interview; those who stayed in their previous occupation are no longer asked about their current job satis-faction. To face this routing issue, we should assume that perceived job quality remains unchanged for those whose job did not change.
Besides, our baseline approach avoids explaining transitions across states by means of self-reported variables at the destination state that induce a self-justi-fication bias (Kapteyn et al. 2011). This means that switchers may “justify” their change in labour market status by declaring that the quality of their new status is particularly good. We use the following ten questions on perceived job quality: 1. All things considered I am satisfied with my job
2. My job is physically demanding
3. I am under constant time pressure due to a heavy workload 4. I have very little freedom to decide how I do my work 5. I have an opportunity to develop new skills
6. I receive adequate support in difficult situations 7. I receive the recognition I deserve for my work
8. Considering all my efforts and achievements, my [salary is/earnings are] ade-quate
9. My [job promotion] prospects [for job advancement] are poor 10. My job security is poor
While the first question is about an overall judgment of work satisfaction, the others concern more specific aspects. The last two questions are only asked to WE
or SE. Respondents must choose any of the following answers: “Would you say you 1. Strongly agree, 2. Agree, 3. Disagree, 4. Strongly disagree”. The response rate to these questions is very high.
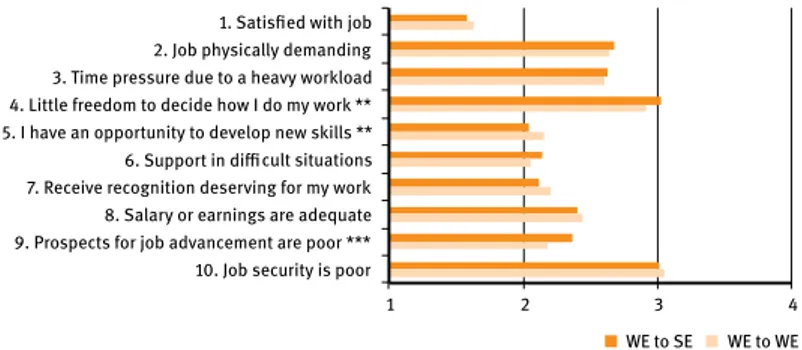
Figure 22.1a shows a comparison of the mean of the job quality measures for those who shift from WE to SE and for wage-employed that do not shift. We report a series of t-tests. They show whether there is a statistically significant dif-ference in the means of several job-satisfaction variables, when we look at these two different groups. Significance is evaluated at 95 per cent confidence level. The figure shows that those who shifted found that they had the opportunity to develop their skills, had enough freedom to decide how to do their work and had prospects for job advancements. This suggests that those who shift into SE can be seen as being relatively satisfied about their previous job, compared to those who did not shift.
1 2 3 4
1. Satisfied with job 2. Job physically demanding 3. Time pressure due to a heavy workload 4. Little freedom to decide how I do my work ** 5. I have an opportunity to develop new skills ** 6. Support in difficult situations 7. Receive recognition deserving for my work 8. Salary or earnings are adequate 9. Prospects for job advancement are poor *** 10. Job security is poor
Jo b qua lity m ea su re WE to SE WE to WE
Figure 22.1a: Mean of job quality measures in Wave 4: wage-employed (Wave 4) to
self-emplo-yed (Wave 5) versus wage-emploself-emplo-yed to wage-emploself-emplo-yed
Significance of the difference between means: *** p<0.01, ** p<0.05, * p<0.1
Notes: Number of observations: about 7,000 (varying with question); 1 = Strongly agree, 2 = Agree; 3 = Disagree; 4 = Strongly disagree
Source: SHARE Wave 4 release 1.1.1, Wave 5 release 0
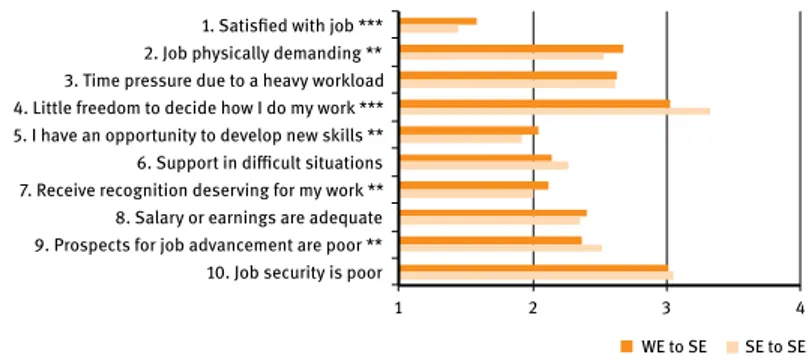
In Figure 22.1b, we look at shifters from WE to SE and compare them to those who stay into SE. For six questions, we cannot reject the hypothesis that job satis-faction significantly differs between groups. Relative to longer term SE, the new self-employed were less satisfied with their previous job, had little opportunity to develop new skills, found the previous job not (physically) demanding, received little recognition and had poor prospects of job advancement relative to longer term SE.
1 2 3 4
1. Satisfied with job *** 2. Job physically demanding ** 3. Time pressure due to a heavy workload 4. Little freedom to decide how I do my work *** 5. I have an opportunity to develop new skills ** 6. Support in difficult situations 7. Receive recognition deserving for my work ** 8. Salary or earnings are adequate 9. Prospects for job advancement are poor ** 10. Job security is poor
Jo b qua lity m ea su re WE to SE SE to SE
Figure 22.1b: Mean of job quality measures in Wave 4: wage-employed (Wave 4) to
self-emplo-yed (Wave 5) versus self-emploself-emplo-yed to self-emploself-emplo-yed
Significance of the difference between means: *** p<0.01, ** p<0.05, * p<0.1
Notes: Number of observations: about 2,000 (varying with question); 1 = Strongly agree, 2 = Agree; 3 = Disagree; 4 = Strongly disagree
Source: SHARE Wave 4 release 1.1.1, Wave 5 release 0
One way to interpret these two figures is that those who shift into SE are more satisfied about their previous job relative to those who remained in WE. However, when compared to the rest of the self-employed, the recent shifters find their old employment worse than those who have been already self-employed for longer. This finding is compatible with the idea that shifters are the most motivated among the wage-employed and moved into SE in order to achieve a higher level of satis-faction, enjoyed by the longer term self-employed. This in turn suggests that for those workers shifting into SE should not result in problems of social exclusion.
22.3 Multivariate analysis
In the descriptive analysis, we have discussed the possibility that shifters from WE to SE are typically those who are more motivated in their job and that shift possibly to realise a larger level of job satisfaction enjoyed by the longer term self-employed. However, we cannot exclude that switches into SE might also be affected by other (confounding) factors. To account for them, we perform a mul-tivariate analysis. This is a model to estimate the hazard into SE, when WE is the common lagged state. We select the subsample of 7,521 individuals defined as WE in Wave 4: 198 of them switched into SE in Wave 5 (see Table 22.2). The dependent variable is a binary indicator equal to one if the individual switched to SE, and 0 otherwise. From the original answers (ranging from one to four of the job quality questions described earlier), we build corresponding binary indicators equal to
1 if the individual responded either “1. Strongly agree” or “2. Agree”, and 0 if he/ she responded “3. Disagree” or “4. Strongly disagree”. Our main variables of inter-est are these binary indicators of perceived job quality. They could be included in the model altogether since we do not find evidence of multicollinearity.
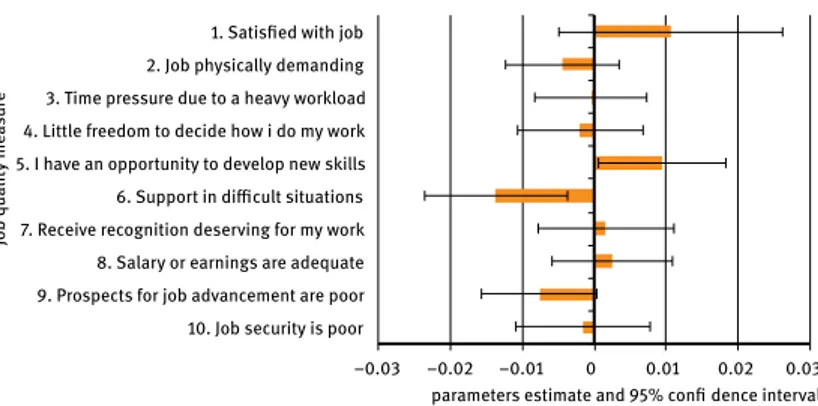
Figure 22.2 summarises the results of this multivariate analysis. The results look similar also if we estimate separate models for each job quality dummy (along with the background characteristics, whose results are omitted from Figure 22.2). The figure shows the coefficients of a linear probability model and the 95 per cent confidence interval. When we correct for other confounding factors, it appears that the hazard into SE is significantly related only to three job satis-faction characteristics. Those who agree with the statement that they have an opportunity to develop new skills are more likely to shift into SE. At the same time, agreement concerning the lack of prospects for job advancement is nega-tively correlated to the probability of shifting into SE (significant at ten per cent level). Finally, the hazard is negatively correlated to those who agree with the fact that in WE support in difficult situations would be offered. Overall, these results confirm descriptive findings (the only exception being given by question 6) and are consistent with the interpretation reported above.
–0.03 –0.02 –0.01 0 0.01 0.02 0.03
1. Satisfied with job 2. Job physically demanding 3. Time pressure due to a heavy workload 4. Little freedom to decide how i do my work 5. I have an opportunity to develop new skills 6. Support in difficult situations 7. Receive recognition deserving for my work 8. Salary or earnings are adequate 9. Prospects for job advancement are poor 10. Job security is poor
parameters estimate and 95% confi dence interval
Jo b qua lity m ea su re
Figure 22.2: Job quality measures and transition into self-employment (Linear Probability Model)
Notes: Number of observations: 6,778; Additional controls: dummies for age, civil servant, gender, being married, country, and being in good health; years of education, tenure and total earnings.
Source: SHARE Wave 4 release 1.1.1, Wave 5 release 0
In Figure 22.2 we do not show the other controls. In this paragraph, we briefly discuss their effect. We have included dummies for age, civil servant, gender, marriage, country, and being in good health. Also the years of education, tenure and total earnings were included. The estimation results, even after a number of
specification tests, show that being in good health, and highly educated is posi-tively correlated with the probability of shifting into SE. Again, this suggests that social exclusion should not be expected by those leaving WE in order to enter SE. Further, earnings and being a civil servant are negatively correlated with the hazard into SE. Finally, the age dummies do not show any specific age-trend. What appears to be very interesting is the presence of statistically significant spikes around age 65. This is an institutionally relevant age in different countries, for instance because of the entitlement to old-age programs. This suggests that, next to the intrinsic satisfaction described above, there is room for explaining the transitions into SE using institutional features (Börsch-Supan et al. 2009), such as statutory retirement ages or different levels of social insurances.
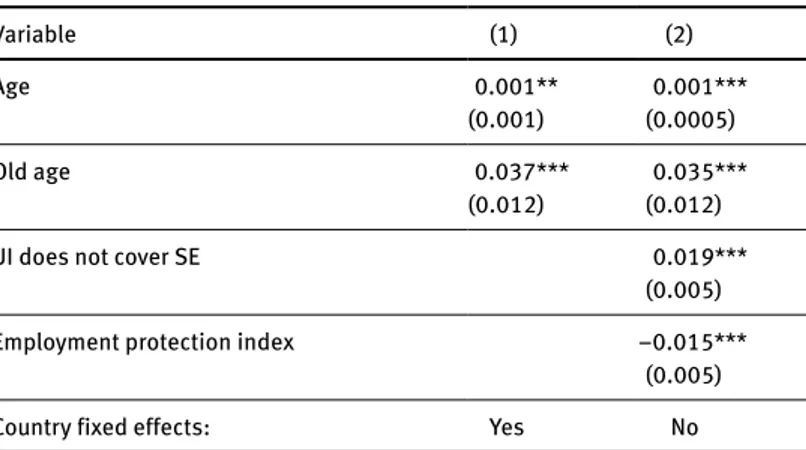
We have, therefore, estimated a set of additional specifications in which such institutional details are accounted for. We have summarised several institutional features in a number of indicators, representing either a differential treatment between SE and WE in the different countries, or report of specific institutions that change by country (and individual characteristics) with different levels of employment protection. This means that some indicators are country-specific, thus in our last specification we omit the country dummies in order to avoid spu-rious correlations (see Table 22.3, specification 2).
Table 22.3: Institutional factors and transition into self-employment (Linear Probability Model)
Variable (1) (2)
Age 0.001**
(0.001) 0.001*** (0.0005)
Old age 0.037***
(0.012) 0.035*** (0.012)
UI does not cover SE 0.019***
(0.005) Employment protection index
–0.015*** (0.005)
Country fixed effects: Yes No
Significance: *** p<0.01, ** p<0.05, * p<0.1
Note: Number of observations: 6,778; standard errors in brackets; additional controls: dummies for ten job quality measures, civil servant, gender, being married and being in good health, years of education, tenure and total earnings
The legal retirement largely differs across countries (MISSOC 2012). It also differs by gender (e.g. Austria), year of birth (e.g. France) and family composition (Czech Republic). We report in the estimation (Table 22.3) an indicator Old age that is equal to 1 if the respondent is observed being as old as the legal retirement age (standard pension). The effect of age on the transition into SE is modelled with a linear function. In specification (2) we additionally include an indicator UI does
not cover SE that is equal to 1 if in the analysed country unemployment insurance
covers WE but not SE. Furthermore, we include the OECD employment protec-tion index for regular workers (OECD 2014). Finally, some instituprotec-tions that could potentially be relevant – such as disability insurance and the presence of an earn-ings test – cannot be studied here, as these do not differ much across country or between WE and SE.
The results in Table 22.3 show that the variable that picks up a differential treatment of social insurances, where the self-employed are excluded from the payment of premiums but also from coverage, has a positive effect on the hazard into SE (UI does not cover SE: 0.019). This suggests that when SE is less expensive (for instance because lower premiums for unemployment insurances have to be paid) it is also more common. A similar finding is confirmed by the variable Old
age that returns a positive, sizable and significant coefficient, robust across the
different specifications (0.037–0.035, cf. with the effect of age which is positive but very weak: 0.001). This means that the probability to become self-employed increases substantially when respondents reach the statutory retirement age. This is consistent with the view that at that age it is profitable to shift (or outsource) as in most countries labour costs reduce after that age if one enters SE. Further still, the employment protection index, which is closely related to the costs of dismissal, is negatively related to the probability of becoming self-employed.
In sum, the institutional variables, that in the literature have been docu-mented to affect labour market shifts, play a significant role also in our case. In our study, these all suggest that when institutions make SE less costly, transitions into SE are observed more often. Parameters estimates for the job quality mea-sures do not change once variables capturing institutional factors are included in the model.
22.4 Job satisfaction and institutional factors
drive entrepreneurship choices
In this study, we related job satisfaction indicators to shifts into SE, as we wanted to gain a better understanding of what motivates employees to change occupa-tion. Shifts into SE could be motivated by entrepreneurial decisions, or at the same time be the result of a lack of other options on the labour market. As we look at older workers, relevant concerns could arise. For instance, if older employees are pushed into SE this could result in social exclusion.
Our results suggest that those who shift into self-employment are the more motivated wage-employed. Their job satisfaction is larger than that of those who do not shift. However, compared to those who were already self-employed, their job satisfaction is lower. This indicates that shifters are actually seeking higher job satisfaction. This in turn suggests that social exclusion is not a likely outcome to those who shift into self-employment. In a sense, they are the more content with their previous job, and possibly will end up at a higher level of satisfaction after the shift.
These results also hold when we include institutional parameters in the esti-mating equation, such as the legal retirement age, the differential participation into unemployment insurance and the employment protection index. These insti-tutional characteristics are all significant determinants of shifts into self-employ-ment.
References
Börsch-Supan, Axel, Brugiavini, Agar, Croda, Enrica (2009): “The role of institutions and health in European patterns of work and retirement”. In: Journal of European Social Policy 19. No.4, p. 341–358.
Brown, Sara, Dietrich, Michael, Ortiz-Nuñez, Aurora, Taylor, Karl (2011): “Self-employment and attitudes towards risk: timing and unobserved heterogeneity”. In: Journal of Economic Psychology 32. No.3, p. 425–433.
Kautonen, Teemu, Down, Simon, Welter, Friederike, Vainio, Pekka, Palmroos, Jenni, Althoff, Kai, Kolb, Susanne (2010): “’Involuntary self-employment’ as a public policy issue: a cross-country European review”. In: International Journal of Entrepreneurial Behaviour & Research 16, p. 112–129.
Li Yue, Mastrogiacomo, Mauro, Hochguertel, Stefan, Bloemen, Hans (2014): “The role of wealth in the start-up decision of new self-employed: evidence from a pension policy reform”. 2nd International Conference on the Dynamics of entrepreneurship, ZEW, Mannheim. MISSOC, Mutual Information System on Social Protection (2012): http://www.missoc.org/
Morgana, Michelle (2010): “Social inclusion at work”. In: International Journal of Disability, Development and Education 57. No. 4, p. 440–441.
OECD (2014): “Employment protection, strictness of employment protection – individual dismissals (regular contracts)”. http://stats.oecd.org/Index.aspx?DataSetCode=EPL_R, visited on 02 April 2015.
Kapteyn, Arie, Smith, James, van Soest, Arthur (2011): “Work disability, work, and justification bias in Europe and the United States”. In: Explorations in the Economics of Aging. Schnalzenberger, Mario, Schneeweis, Nicole, Winter-Ebmer, Rudolf, Zweimüller, Martina
(2008): “Job quality and retirement decisions”. In: Börsch-Supan, Axel, Brugiavini, Agar, Jürges, Hendrik, Kapteyn, Arie, Mackenbach, Johan, Siegrist, Johannes and Weber, Guglielmo (Eds.): First results from the Survey of Health, Ageing and Retirement in Europe (2004–2007). Starting the longitudinal dimension. Mannheim: Mannheim Research Institute for the Economics of Aging (MEA), chapter 6.2.