NEW MEASUREMENTS OF THERMOLUMINESCENCE IN
LITHIUM FLUORIDE
M.A. VINCENTI, R.M. MONTEREALI
ENEA - Unità Tecnica Sviluppo di Applicazione delle Radiazioni Laboratorio Micro e Nano Strutture per la Fotonica
Centro Ricerche Frascati, Roma, Italia E. NICHELATTI
ENEA - Unità Tecnica Tecnologie dei Materiali Laboratorio Sviluppo e Realizzazione di Componenti Ottici
Centro Ricerche Casaccia, Roma, Italia M. AMBRICO
CNR-IMIP UoS di Bari Bari, Italia L. SCHIAVULLI
Dipartimento di Fisica dell’Università di Bari e Sezione INFN di Bari Bari, Italia
V.S. KALINOV, A.P. VOITOVICH Institute of Physics
National Academy of Science of Belarus Minsk, Bielorussia
G. BALDACCHINI Via Guglielmo Quattrucci, 246 00046 Grottaferrata, Roma, Italia
AGENZIA NAZIONALE PER LE NUOVE TECNOLOGIE, LʼENERGIA E LO SVILUPPO ECONOMICO SOSTENIBILE
NEW MEASUREMENTS OF THERMOLUMINESCENCE IN
LITHIUM FLUORIDE
M.A. VINCENTI, R.M. MONTEREALI
ENEA - Unità Tecnica Sviluppo di Applicazione delle Radiazioni Laboratorio Micro e Nano Strutture per la Fotonica
Centro Ricerche Frascati, Roma, Italia E. NICHELATTI
ENEA - Unità Tecnica Tecnologie dei Materiali Laboratorio Sviluppo e Realizzazione di Componenti Ottici
Centro Ricerche Casaccia, Roma, Italia M. AMBRICO
CNR-IMIP UoS di Bari Bari, Italia L. SCHIAVULLI
Dipartimento di Fisica dell’Università di Bari e Sezione INFN di Bari Bari, Italia
V.S. KALINOV, A.P. VOITOVICH Institute of Physics
National Academy of Science of Belarus Minsk, Bielorussia
G. BALDACCHINI Via Guglielmo Quattrucci, 246 00046 Grottaferrata, Roma, Italia
I contenuti tecnico-scientifici dei rapporti tecnici dell'ENEA rispecchiano l'opinione degli autori e non necessariamente quella dell'Agenzia.
The technical and scientific contents of these reports express the opinion of the authors but not necessarily the opinion of ENEA.
I Rapporti tecnici sono scaricabili in formato pdf dal sito web ENEA alla pagina http://www.enea.it/it/produzione-scientifica/rapporti-tecnici
NEW MEASUREMENTS OF THERMOLUMINESCENCE IN LITHIUM FLUORIDE
M.A. VINCENTI, R. M. MONTEREALI, E. NICHELATTI, M. AMBRICO, L. SCHIAVULLI, V.S. KALINOV A.P. VOITOVICH, G. BALDACCHINI
Abstract
Thermoluminescence (TL) measurements of eight nominally pure lithium fluoride (LiF) crystals, containing less than 30 ppm impurities, and irradiated with vastly different gamma rays doses, has been performed and studied in connection with color centers (CCs) generated during the ionizing irradiation. A first order kinetics approach has been used to simulate the TL glow curves and, as a result, ten glow peaks (GPs) spanning from 100 to 450 °C have been unveiled, in agreement with previous measurements. However, at the same time, the already established associations GPs-CCs have not been fully confirmed, and rather the GPs were associated mostly to impurity defect centers. This unexpected discovery has shown the paramount importance of impurities in LiF crystals, also when apparently negligible, for TL phenomena. So, although a few associations between GPs and CCs have been established, new measurements on LiF crystals of highest purity at least an order of magnitude are necessary to establish on more sound bases the effects of impurities on TL and also on related phenomena.
Key words: thermoluminescence, LiF, color centers, glow peaks
NUOVE MISURE DI TERMOLUMINESCENZA NEL FLUORURO DI LITIO
Riassunto
Misure di termoluminescenza (TL) su otto cristalli di fluoruro di litio (LiF) nominalmente puri, contenenti impurezze in quantità minori di 30 ppm, e irraggiati con raggi gamma in un ampio intervallo di dose, sono state effettuate e studiate in connessione con i centri di colore (CCs) prodotti dall’irraggiamento stesso. Un approccio cinetico al primo ordine è stato utilizzato per simulare gli spettri di TL e, come risultato, sono stati individuati dieci glow peaks (GPs) nell’intervallo da 100 a 450 °C, in accordo con misure effettuate precedentemente. Ma, nel contempo, l’associazione GPs-CCs non è stata completamente confermata, e piuttosto i GPs sono stati soprattutto associati a difetti dovuti alla presenza di impurezze. Questa inaspettata scoperta ha mostrato l’importanza primaria per i fenomeni della TL delle impurezze presenti nei cristalli di LiF, anche quando sono apparentemente trascurabili. Così, sebbene siano state stabilite alcune associazioni fra GPs e CCs, sono necessarie nuove misure su cristalli di LiF di almeno di un ordine di grandezza più puri, per stabilire su basi più solide gli effetti delle impurezze sulla TL e anche sui fenomeni correlati.
INDEX
1. INTRODUCTION………....7
2. COLOR CENTERS IN LiF………..…...8
3. THERMOLUMINESCENCE AND GLOW PEAKS………...12
4. EXPERIMENTAL PROCEDURE …..……….……...13
4.1 Optical and spectroscopic characterization of color centers in LiF………..14
4.2 Thermoluminescence and Glow Peaks in LiF...18
4.3 Analysis of Thermoluminescence in LiF……….….………...…….22
5. DISCUSSION ………...28 6. CONCLUSIONS..……….………...…...33 REFERENCES...35
NEW MEASUREMENTS OF THERMOLUMINESCENCE IN
LITHIUM FLUORIDE
1. INTRODUCTION
Thermoluminescence (TL) literally means emission of light stimulated by heat, which is only partially true because, unfortunately, no material is known being able to emit light by solely heating it, except for black body emission. In order to get light emission, it is necessary first to excite the material with some other form of physical quantity, whose energy is later on released when the material is, e.g. heated. Traditionally, when ionizing radiation (high-energy photons, elementary particles and ions) excites the material, the light emitted is called TL [1].
In principle, all crystalline materials are susceptible to emit TL, but in practice only a few of them emit enough light to be easily observed. Indeed, when ionizing radiation impinges on a crystal, electrons are freed, ions or atoms are displaced out of the regular lattice, and defects are created in addition to the impurities that already exist in the crystal. Usually, electrons are captured in stable traps nearby the conduction band, while holes do the same nearby the valence band. Nothing happens if the material is not disturbed anymore by an external factor. However, when the temperature of the crystal is raised, electrons and holes are thermally excited in the conduction and valence band, respectively, from where they decay either radiatively or non-radiatively, depending on the existence of one or more trap centers possessing active or quenched optical transitions, the latter case being the most frequent one in nature.
From what has been said above, it is clear that when optical transitions are active, a close relationship exists between the radiation dose absorbed by a crystalline material and the observed TL. For that reason, this effect has been applied in dating archeological pottery, which contains quartz and other crystalline materials, and in radiation dosimeters for personal and environmental use, with outstanding success [1, 2, 3]. In the latter case, several crystalline materials were utilized but, among them, lithium fluoride (LiF) has always kept a prominent position because it is almost tissue equivalent, being the effective atomic number equal to 8.1, close to biological tissues 7.4.
Moreover, LiF crystals are relatively hard (they can be easily cut or grinded) and almost not hygroscopic. Irradiation of LiF crystals by ionizing radiation induces the stable formation at room temperature (RT) of primary and aggregate color centers (CCs), whose optical and spectroscopic properties are rather well known [4].
LiF has been used as a dosimeter for quite a long time, and it has stimulated studies on its properties especially when doped with several ions, among them Mg being the most known [5]. LiF doped with Mg, and duly irradiated with ionizing radiation, delivers a prominent glow peak (GP) at about 200 °C [6]. The traps associated with Mg seem to be very efficient, as far as the intensity of the related GP is concerned [7]. This favorable situation is so appreciated that LiF doped with Mg and Ti is commercially produced by the Harshaw Chemical Co. as a common dosimeter; doped with Cu, P and Fe is widely utilized as well [8, 9].
Even though doped LiF is widely used as a dosimeter, several features remain to be investigated; among them, the most prominent one, from the basic and applicative points of view, regards the origin of the various GPs, that is, the role of the impurities and defect centers in the phenomenon of luminescence. Indeed, the mechanism of TL is not known in detail yet, although a general description has been attempted with some success. This situation has been addressed lately having in mind the role of impurities versus the properties of pure LiF material [10, 11].
During the last decade, systematic studies have been carried out to establish the role of intrinsic defect centers, i.e. color centers, in TL spectra, with promising results. Several CCs have been associated with some prominent GPs of nominally pure LiF crystals but, at the same time, it was not possible to attribute other congested peaks to well defined CCs, but rather to generic perturbed CCs [12, 13]. Such a partial failure could be the result of both the possibility that there is no close relationship between CCs and GPs or no relationship at all, and the lack of strong experimental evidences. Indeed, our previous research was performed by using only four LiF crystals and, although they were irradiated with the same dose and treated afterwards so to get a wide variation of CCs content, the average intensity of TL was substantially similar in all four of them, which did not allow a useful and clear-cut comparison among the experimental results.
In order to improve our studies, we started a new campaign of TL measurements on a larger number of LiF crystals irradiated with a much wider range of dose. In this way we could get TL intensity orders of magnitude different from each other, having so a new powerful tool to differentiate among various contributors to the final TL. In the following, the results that have been obtained till now are reported and discussed.
2. COLOR CENTERS IN LiF
CCs in LiF can be generated only by irradiation with ionizing radiation, such as photons (UV, X
and rays), electrons, neutrons, protons, particles and heavier charged ions. Each radiation
source gives rise to different kinds of lattice damaging processes, according to the energy-release mechanisms of the involved particles.
The primary mechanism of damage by ionizing radiation in LiF is radiolysis [14], which consists of the creation of Frenkel pairs via non-radiative Self-Trapped Exciton (STE) decay. A Frenkel pair consists of an F center (formed by an electron trapped in an anionic vacancy) and a H interstitial center (a positively-charged molecular ion in interstitial position).
A suitable pulse of radiation ionizes the halide lattice ions and produces electron-hole pairs, as shown in Fig. 1.1(a). The holes become immediately self-trapped as diatomic halogen molecular ions (Vk centers) in a configuration where they occupy an interstitial position. This produces the formation of two anion vacancies (each with +e/2 effective charge) opposite each other and next to the halogen molecule in a <110> direction, as reported in Fig. 1.1(b). The slowed-down electrons are captured, due to Coulomb attraction of the vacancies around the Vk center, forming a highly excited self-trapped exciton (STE). Then, the electron cascades non-radiatively down the quasi-hydrogenic energy levels of the STE. The first excited state of the latter is adiabatically unstable for its interstitial ionic configuration, having an excess energy relative to an off-center configuration. Therefore, the interstitial halogen molecule experiences an acceleration towards and through one of the half-vacancies, resulting in the formation of F-H center pairs, as shown in Fig. 1.1(c). If the energy released during the de-excitation of the STE is high enough, the F-H pairs will be formed at enough large separation for the system to remain stable [14].
Figure 1. Ionizing irradiation in alkali halides produces an exciton (a) which evolves into a self-trapped exciton (b) and, finally, an F-H couple (c).
The kinetics of coloration is complex and strongly dependent on a large number of variables: the type of ionizing radiation and its characteristics, the irradiation conditions, chemical purity, mechanical and thermal history, radiation intensity (dose rate), temperature, etc. All of them influence the level of coloration and the kinds of induced CCs [15].
The primary color center is the F center, which consists of an anionic vacancy occupied by an electron. Its absorption band is located at about 248 nm [16]. Up to now, the photoluminescence (PL) originating from the F center in LiF has not been detected unambiguosly, but a weak emission is theoretically expected at about 900 nm [17], and has been very likely observed [18]. The F center plays a crucial role as primary defect, which can aggregate to form complexes such as the aggregate F2 electronic defect, which consists of two nearest-neighbour F centers along the <100>
+
+
+
+
+
+
+
+
+
+
+
+
+
+
—+
+
+
+
+
+
+
+
+
— —+
(a) (b) (c)direction of the cubic lattice, or the F3 color center consisting of three F centers in nearest-neighbour sites in the (111) plane.
Primary and aggregate CCs produced in LiF by ionizing radiation are stable at RT and give rise to absorption bands that extend from the UV through the visible (VIS) up to the Near IR (NIR) region of the electromagnetic (e.m.) spectrum. Several of them, if properly excited with electromagnetic radiation, emit PL bands in the VIS and NIR spectral regions [19]. Table 1 reports a list of the main electronic defects in colored LiF crystals and typical values of the peak position (Ea, Ee) and of the full width at the half maximum (FWHMa, FWHMe) of their absorption and emission bands, respectively, at RT.
Table 1. Spectroscopic parameters of color centers in LiF at RT. Ea and FWHMa are peak position and full width at
the half maximum of the absorption band; Ee and FWHMe are peak position and full width at the half maximum of the
emission band. aRef. [16], bRef. [18], cRef. [20], dRef. [21], eRef. [22], fRef. [23] ,gRef.[24].
Center Ea (eV) λa (nm) FWHMa (eV) Ee (eV) λe (nm) FWHMe (eV) F 5.00 a 248 0.76 a F2 2.79b 444 0.16 b 1.83b 678 0.36 b F3+ 2.77 b 448 0.29 b 2.29b 541 0.31 b F2+ 1.92 c 645 0.433 c 1.36c 912 0.29 c F2 -1.29c 960 0.21 c 1.11c 1117 0.17 c F3(R1) 3.92d 316 0.52 e 1.94d 640 F3(R2) 3.31d 374 0.66 e 2.34d 530 F3-(R1’) 1.88d 660 F3-(R2’) 1.55 d 880 0.190 d 1.38d 898 0.331 d F4(N1) 2.40f 517 0.21 e F4(N2) 2.26f 549 0.22 e F4 – like 1.91g 648 0.19 g 1.69g 735 0.16 g
F2 and F3+ electronic defects (two electrons bound to two and three anion vacancies, respectively)
[19] possess almost overlapping absorption bands, peaked at about 450 nm, generally called M
peaked at 678 nm and 541 nm, respectively (see Table 1), which only partially overlap because of a different Stokes shift.
The absorption bands peaked at 316 nm and 374 nm are due to the R1 and R2 transitions of F3 electronic defects [21]. Moreover, the absorption bands peaked at 517 nm and 549 nm are attributed to the N1 and N2 transitions of the F4 defects, which consist of four associated F centers [19].
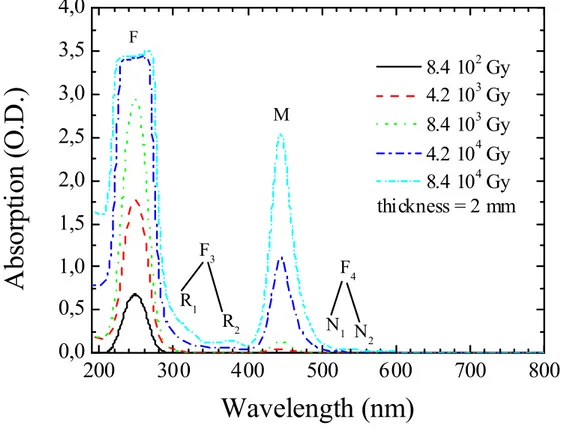
Types and concentrations of radiation-induced CCs can be determined by measuring the absorption spectra of the irradiated crystals. Figure 2 reports the absorption spectra of
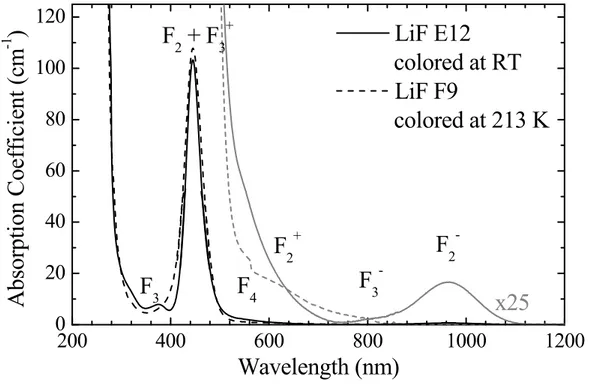
gamma-irradiated LiF crystals at five different doses, from 8.4x10² to 8.4x10⁴ Gy. Figure 3 shows the
absorption coefficient as a function of the wavelength of two LiF crystals colored by 3 MeV electrons at RT (E12) and at 213 K (F9) with different doses producing the same absorption intensity for the M band located at 450 nm. As shown by both figures, the absorption band of F centers, called F band, is located at about 248 nm ( 5 eV), the M band peak position, due to F2
and F3+ CCs, is located at 450 nm (2.8 and 2.7 eV), the contributions of F3(R1 and R2) and F4 (N1
and N2) are at 350 nm (3.9 and 3.3 eV) and at 550 nm (2,4 and 2.2 eV), respectively. Figure 3
also shows the contributions of CCs absorbing above 600 nm: F2+ at 640 nm ( 2 eV), of F3- at 800
nm ( 1.5 eV), and F2- at about 1000 nm ( 1.3 eV).
Figure 2. RT absorption spectra, in O.D., of gamma-irradiated LiF crystals at five different doses, from 8.4 102 to 8.4
104 Gy.
200
300
400
500
600
700
800
0,0
0,5
1,0
1,5
2,0
2,5
3,0
3,5
4,0
F4 N2 N1 F3 R2 R1 M FA
bs
or
pt
ion (
O
.D
.)
Wavelength (nm)
8.4 10
2Gy
4.2 10
3Gy
8.4 10
3Gy
4.2 10
4Gy
8.4 10
4Gy
thickness = 2 mm
200
400
600
800
1000
1200
0
20
40
60
80
100
120
x25
LiF E12
colored at RT
LiF F9
colored at 213 K
F
2+F
2-F
3-F
4F
2+ F
3+F
3A
bsorpti
on Coeffi
ci
ent
(cm
-1)
Wavelength (nm)
Figure 3. RT absorption coefficient as a function of the wavelength of two LiF crystals colored by 3 MeV electrons at RT (E12) and at 213 K (F9) with different doses producing the same absorption intensity for the M band at 450 nm. It also shows a 25 magnification of the curves for wavelengths greater than 500 nm. The irradiation dose of the crystal E12, 1.3 mm tick, was 3.6x10²¹ eV/cm3 (2.2x10⁷ rad), while that of the crystal F9, 1.2 mm tick, was 2.8x10²² eV/cm3
(1.7x10⁸ rad).
Up to now, we have described CCs that arise in pure LiF crystals, but when ion impurities are present in sizeable amounts, let us say a few percent, other absorption bands appear [25]. In our case, impurities are kept at the lowest amount as possible, so their absorption bands are not observable, with the exception of some spurious and weak absorption below 300 nm. However, they exist and can be inferred by carefully measuring PL [26] and quenching phenomena of the observed emissions [27].
3. THERMOLUMINESCENCE AND GLOW PEAKS
Impurities and/or lattice defects may create new localized energy levels in the forbidden band gap of a crystal. Under certain conditions, some of these defects are capable to trap an electron. A trap is characterized by the energy E (which is referred to as the trap depth) that a trapped electron must acquire from lattice vibrations to escape to the conduction band, where it can move freely in the
crystal. There is a characteristic temperature TM at which the thermal vibrations of the crystal
lattice are sufficient to cause the release of trapped electrons. The rate at which the electrons, or holes, escape from the traps is roughly governed by the vibrational frequency (or attempt-to-escape factor or frequency) S of the charge within the trap and by the trap depth E. The overall escape rate is proportional to S·exp(-E/kT).
Thermally stimulated light emission from an insulator or a semiconductor, following the previous absorption of energy from ionizing radiation, results in the typical thermoluminescence glow curve from which the information on the electron traps present in the band gap can be extracted. Under the hypothesis that the total electron retrapping probability is much lower that the recombination probability (i.e. slow retrapping condition), the thermoluminescence intensity for single peak is given by the well-known first order kinetics equation [1] in the case of a linear temperature gradient:
∙ ∙ ∙ (1)
where β is the heating rate, T0 is the initial temperature, n0 the initial number of filled traps, E is the
trap energy, S is the above expressed frequency factor (s-1) indicating also the number per second
an electron interacts with the lattice. The exponential integral in equation (1) could be only analytically solved [28] and gives a representation of the single peak glow curve as a nonlinear
function of trap energy E, peak temperature at maximum TM and peak maximum intensity IM. The
integral in (1) is then the representation of a glow peak (GP) with a maximum intensity IM at a
characteristic temperature TM following the equation:
(2)
It then follows that the integral light intensity depends on the number of trapped charges, n0, that
are in turn depending on the irradiation dose and independent on the heating cycle. The
characteristic temperature TM does not depend on the number of trapped charges, but rather it
relates with the trap energy E. Moreover, the trap energy depth E, the peak maximum temperature
TM and the width of the peak (defined as the Full Width at Half Maximum Intensity of the GP),
are related among them by the following relation [29]:
≅ (3)
From eq.(3) it is expected in general that GPsat higher temperature correspond to deeper traps.
4. EXPERIMENTAL PROCEDURES
The samples utilized in the present work were cut from a LiF boule containing less than 10-4 g/g
(1018/cm3) impurity ions in total, see Table 2 for details. These samples were irradiated by a 60Co
source, emitting 1.17 MeV gamma rays, at different doses and temperatures as shown in Table 3, where also the dimensions of the samples are given. In particular, seven samples were irradiated at RT with increasing doses and one of them at -60 °C (213 K) in order to obtain a certain variety of CCs, as discussed later on.
Table 2. Content of impurity ions in a boule of LiF crystal from where the samples utilized in the present work have been cut, expressed as gram of impurity ion/gram of crystal material (g/g) and as number of impurity ion/cm3 (N/cm3).
Ion content
Ion
Ce Na Fe Gd Cu La Nd Eu Se Mn Cr Ag Sb Hf et al. Mg O2
-10-7 g/g 230 180 90 40 37 34 18 7 2,8 2.2 1,4 1,4 0,5 0,3 < 0,1 0,4
1015 N/cm3 260 1240 255 40 92 39 20 7.3 5.6 6.4 4.3 2 0.64 0.27 <0.65 40
Table 3. LiF samples, temperature of coloration in air with a 60Co gamma source, radiation dose, planar dimensions,
and thickness.
LiF Sample
Temperature of coloration
(°C)
Irradiation Dose Planar
Dimensions (mm2) Thickness (mm) (R) (Gy) 07-3-11, S11 24 103 8.3 6.4×4.7 2.0 07-3-12, S12 24 3103 25 6.0×4.2 2.0 07-3-13, S13 24 104 83 6.03.0 2.0 07-3-14, S14 24 3104 2.5x10² 6.25.4 2.0 07-3-15, S15 24 3105 2.5x10³ 5.6×3.4 2.0 07-3-16, S16 24 3106 2.5x10⁴ 6.0×4.0 2.0 07-3-17, S17 24 3107 2.5x10⁵ 6.5×4.5 1.9 07-3-18, S18 -60 107 8.3x10⁴ 16.0×4.5 2.6
4.1 Optical and spectroscopic characterization of color centers in LiF
Optical density (O.D.) measurements of the gamma-colored LiF crystals were performed at normal incidence and at RT by using a double-beam and double-monochromator Perkin-Elmer Lambda 950 spectrophotometer. The O.D. spectra were collected in the 190-1400 nm spectral range and with a wavelength resolution of 1 nm, by attaching each sample to a metal mask with a circular hole of 6 mm in diameter, mounted by means of special supports in the sample compartment, along the path of the measurement beam. An identical metal mask is also placed in the sample compartment along the path of the reference beam, in order to better balance the sample and reference beam powers. A HORIBA Jobin Yvon Fluorolog spectrofluorimeter, mod. FL-11, was utilized in a front-face detecting geometry to measure at RT the PL spectra of the colored LiF crystals.
Figure 4 shows the experimental O.D. spectra of the LiF crystals irradiated at RT. It can be noticed that the main absorption contribution starts above 4 eV (i.e., below 300 nm) at low irradiation doses (F band), increases and expands toward 3 eV (400 nm) at medium irradiation doses, keeps increasing and enters the visible region below 3 eV (above 400 nm) at high irradiation doses, almost saturates above 2.5 eV (below 500 nm) and starts to absorb in the NIR at very high
irradiation doses. Figure 4 shows also an absorption band of about 0.3 OD above 5.5 eV which is due to impurities, among them, in particular, oxygen ions. These impurities may participate in the aggregation of CCs. As shown in Fig. 5, the sample S18, which has been irradiated with a smaller dose with respect to sample S17, shows a completely different spectrum, as expected because of the irradiation at low temperature. Figures 4 and 5 also show the continuous simulated absorption
spectra of the samples, which include the F4-like CC and exclude the presence of F2+ and F3- CCs,
which are known to be obtained only at higher irradiation doses [30].
Figure 4. RT absorption spectra (divided by 2.3) of the LiF crystals irradiated at RT with gamma rays from a source of 60Co, at doses between 8.3 and 2.5 x 10⁵ Gy. See text for details.
Figure 5.RT absorption spectrum (divided by 2.3) of sample S18 irradiated at -60 °C (213 K) with gamma rays from a source of 60Co, dose 8.4 x 10⁴ Gy. See text for details.
7 6 5 4 3 2 1 0 0,1 1 10 100
A
bsorp
tion
(O
.D
.)
Energy (eV)
S11 S11 best fit S12 S12 best fit S13 S13 best fit S14 S14 best fit S15 S15 best fit S16 S16 best fit S17 S17 best fit 7 6 5 4 3 2 1 0 0,1 1 10 100 S18A
bso
rp
tio
n (O
.D
.)
Energy (eV)
In principle, one could try to extract the volume concentration of the various CCs by manually measuring their absorption peaks with the help of a graduated ruler on the printed graphs. However, such measurement is not easy experimentally because of the strong overlapping of the
various absorption bands. In particular, the absorption bands of F2 and F3+ centers almost coincide,
and the only way to discriminate one from the other is to resort to their different emission bands or best fit procedure of the overall M absorption band.
Figure 6 shows the visible PL spectra under optical excitation at 444 nm of the irradiated LiF
crystals, from which it is possible to assess the contribution to PL of F2 and F3+ CCs. While samples
from S11 to S17 contain both kind of centers in concentrations that increase with the irradiation
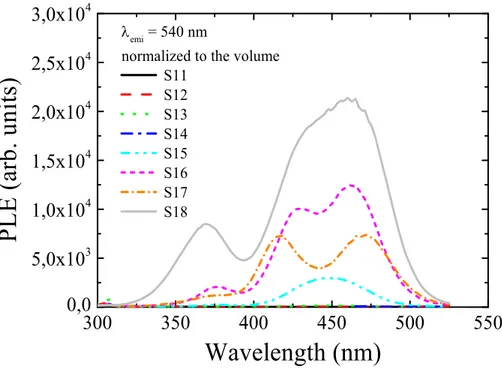
dose, the sample S18 contains practically only F3+ centers. Figures 7 and 8 report the
photoexcitation (PLE) measurements of the investigated samples, collected at two different
emission wavelengths, emi, 540 nm (green emission, F3+) and 678 nm (red emission, F2). The PL
contributions of F3+ and F2 CCs increase with the irradiation dose. Moreover, in Fig. 7 the sample
optical absorption is evident in colored LiF crystals at the two highest irradiation doses [27], because of their higher thickness.
Figure 6. PL spectra at RT of the colored LiF crystals excited at 444 nm and normalized to their volumes.
500 550 600 650 700 750 800 850 900 0 1x10⁴ 2x10⁴ 3x10⁴ 4x10⁴ 5x10⁴ 6x10⁴ 7x10⁴ 8x10⁴
P
L
(arb
. u
nits)
Wavelength (nm)
exc = 444 nmnormalized to the volume S11 (x10) S12 (x10) S13 (x10) S14 (x10) S15 S16 S17 S18
Figure 7. Photoexcitation spectra at RT of the colored LiF crystals acquired at the emission wavelength of 540 nm (peak emission band of F3+ centers), and normalized to their volumes.
Figure 8. Photoexcitation spectra at RT of the colored LiF crystals acquired at the emission wavelength of 678 nm (peak emission band of F2 centers), and normalized to their volumes.
PL measurements were used in addition to a complete simulation procedure to fit optical transmittance spectra, which has already given reliable results [12, 13]. Without going into too many details, which are however available in the previous publications, with the help of this fit
300
350
400
450
500
550
0,0
5,0x10
31,0x10
41,5x10
42,0x10
42,5x10
43,0x10
4PLE (
ar
b.
uni
ts
)
Wavelength (nm)
emi = 540 nmnormalized to the volume S11 S12 S13 S14 S15 S16 S17 S18 350 400 450 500 550 600 650 0,0 5,0x10³ 1,0x10⁴ 1,5x10⁴ 2,0x10⁴ 2,5x10⁴ 3,0x10⁴
P
L
E (arb. u
nits)
Wavelength (nm)
emi = 678 nmnormalized to the volume S11 S12 S13 S14 S15 S16 S17 S18
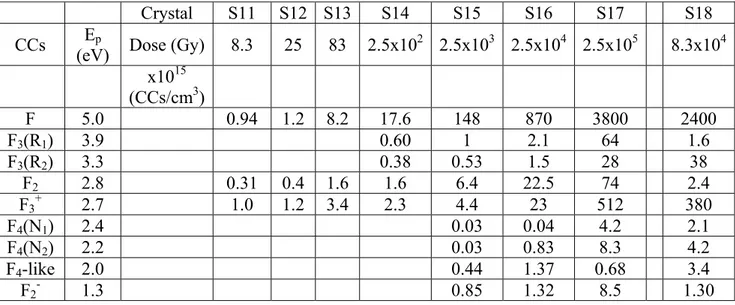
procedure we could deduce the amplitudes of the absorption bands of the different CCs existing in our samples, with the exception of sample S18 which proved too hard to be best fit. Therefore, this sample has been studied by using a well-established manual method that gives the absorption of CCs with a relative error fairly less than 50%. In conclusion, by using the simulation procedure, the PL results, and the manual method, it was possible to determine the concentration of each CC, by the well-known Smakula formula [31]. Table 4 displays the final data of concentration for each CC observed in the investigated samples as a function of the dose; the peak energies of the CCs are given as well for the sake of completeness.
Table 4. The concentration of CCs has been determined by fitting the absorption spectra of the samples with the already known parameters of the various CCs, by using the results of photoluminescence when the CCs are optical active, and by resorting to well tested manual procedures whenever possible for superimposed and saturated absorption bands. CCs are represented by the usual nomenclature and the energy of their absorption peak is reported in eV. Sample S18 is separated by the other ones because it has been irradiated differently on purpose.
Crystal S11 S12 S13 S14 S15 S16 S17 S18
CCs (eV) Ep Dose (Gy) 8.3 25 83 2.5x10² 2.5x10³ 2.5x10⁴ 2.5x10⁵ 8.3x104
x1015 (CCs/cm3) F 5.0 0.94 1.2 8.2 17.6 148 870 3800 2400 F3(R1) 3.9 0.60 1 2.1 64 1.6 F3(R2) 3.3 0.38 0.53 1.5 28 38 F2 2.8 0.31 0.4 1.6 1.6 6.4 22.5 74 2.4 F3+ 2.7 1.0 1.2 3.4 2.3 4.4 23 512 380 F4(N1) 2.4 0.03 0.04 4.2 2.1 F4(N2) 2.2 0.03 0.83 8.3 4.2 F4-like 2.0 0.44 1.37 0.68 3.4 F2- 1.3 0.85 1.32 8.5 1.30
4.2 Thermoluminescence and Glow Peaks in LiF
TL was measured in the range 50-450 °C (323-721 K) with a heating rate of 0.25 °C/s (15 °C/min)
by using a commercial automated RISØ TL/OSL-DA-15 reader, also equipped with a 90Sr/90Y beta
(β) radiation source (0.565 MeV mean β energy, dose rate 0.119 Gy/s). The glow curves were recorded from small fractions of powder obtained by pounding small pieces of the LiF crystals listed in Table 3 under a nitrogen flux. To verify that the intensity readouts were the same for each irradiated LiF sample, five pieces of each crystal of about equal weight were pounded and measured for statistical purposes, and the final TL glow curves were averaged by taking in account the weight of each powder sampling.
The results of the TL measurements are reported in Figures 9-16, in which the emission intensities vs. temperature are shown. At a first sight, the intensity of the most intense GPs increases by 4
order of magnitude moving from sample S11 (dose 8.3 Gy) to S17 (dose 2.5x10⁵ Gy); note that
also the dose increases by 4 orders of magnitude. Hence, the effect of the dose on the TL active centers seems to be approximately linear, as usually expected in the majority of TL materials. For
-60 °C (213 K), so that it should deliver an intensity comparable with those of samples S16 and
S17, which is the case within the same order of magnitude, i.e. 0.5106 against 106 and 2106.
At this point, all the needed data are available to proceed further on with a comparative analysis of CCs on one side and GPs on the other one. However, before embarking in such complex endeavor it could be more convenient to compare the present TL data with the old ones. Indeed, in case we found that the two set of experimental data are not compatible with each other, we would be in very deep troubles merely to continue the present analysis, if at all.
Of the old TL measurements, consisting of samples A, B, C, and D [12, 13], only samples A and C can be taken into consideration, because in addition to gamma irradiation, sample B had been also annealed, while sample D had been optically pumped with a UV laser. Moreover, by taking into
consideration that sample A had been irradiated with a dose of 7x10³ Gy, one concludes that it can
be compared only with samples S15, dose 2.5103 Gy, and S16, dose 2.5104 Gy. Sample C can
be compared only with sample S18, because both were irradiated at -60 °C (213 K), although the latter one had been irradiated with a dose about 10 times higher than the former one.
Figure 9. TL of sample S11. Lines without physical
meaning join the experimental data. Figure 10. TL of sample S12. Lines without physical meaning join the experimental data.
Figure 11. TL of sample S13. Lines without physical
meaning join the experimental data. Figure 12. TL of sample S14. Lines without physical meaning join the experimental data.
300 350 400 450 500 550 600 650 700 750 0,0 1,0 2,0 3,0 4,0 5,0 S12 Temperature (K) TL intensit y ( 10 3 arb. units ) 300 350 400 450 500 550 600 650 700 750 0,0 0,2 0,4 0,6 0,8 1,0 1,2 S11 Temperature (K) T L in te ns ity ( 10 3 ar b. uni ts ) 300 350 400 450 500 550 600 650 700 750 0,0 0,5 1,0 1,5 2,0 S13 Temperature (K) T L in te ns ity ( 10 4 ar b. unit s ) 300 350 400 450 500 550 600 650 700 750 0,0 2,0 4,0 6,0 S14 Temperature (K) T L int ensity ( 10 4 ar b. unit s )
Figure 13. TL of sample S15. Lines without physical
meaning join the experimental data. Figure 14. TL of sample S16. Lines without physical meaning join the experimental data.
Figure 15. TL of sample S17. Lines without physical
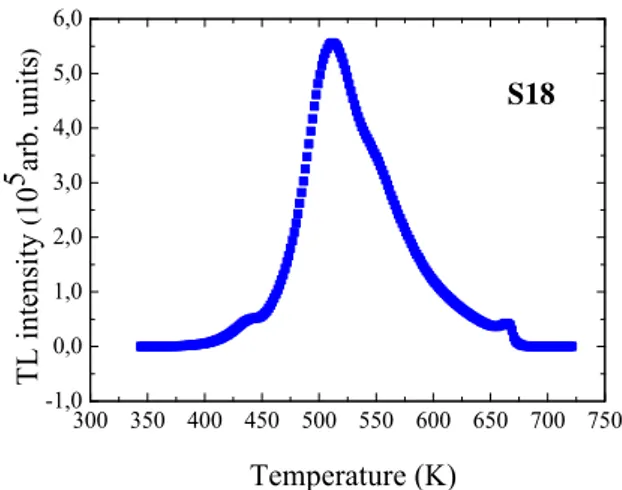
meaning join the experimental data. Figure 16. TL of sample S18. Lines without physical meaning join the experimental data.
Figure 17 reports the TL of sample A in the range of temperatures 273-773 K, while Fig. 18 shows the same for samples S15 and S16. The spectra of samples S15 and S16 look very similar, with a bump at 500 K coming out at higher irradiation dose in sample S16 as expected, so let us look carefully only at the spectra of samples A and S16. The two spectra share roughly the same shape, being present one GP first and a second one later on at higher temperature, but the average temperature of the whole emissions moves apart by about 40 °C.
300 350 400 450 500 550 600 650 700 750 0,0 0,4 0,8 1,2 1,6 2,0 S15 Temperature (K) T L intensity ( 10 5 ar b. units ) 300 350 400 450 500 550 600 650 700 750 0,0 2,0 4,0 6,0 8,0 10,0 12,0 S16 Temperature (K) T L int ensity ( 10 5 ar b. unit s ) 300 350 400 450 500 550 600 650 700 750 0,0 0,2 0,4 0,6 0,8 1,0 1,2 1,4 1,6 1,8 S17 Temperature (K) TL i nte nsity ( 10 6 arb. uni ts ) 300 350 400 450 500 550 600 650 700 750 -1,0 0,0 1,0 2,0 3,0 4,0 5,0 6,0 S18 Temperature (K) T L intensity ( 10 5 ar b. units )
Figure 17. TL in log scale of old sample A, irradiated at RT with gamma rays at a dose of 7x10³ Gy.
Figure 18. TL in log scale of new samples S15 and S16, irradiated at RT with gamma rays at a dose of 2.5x10³ Gy
and 2.5x10⁴ Gy, respectively.
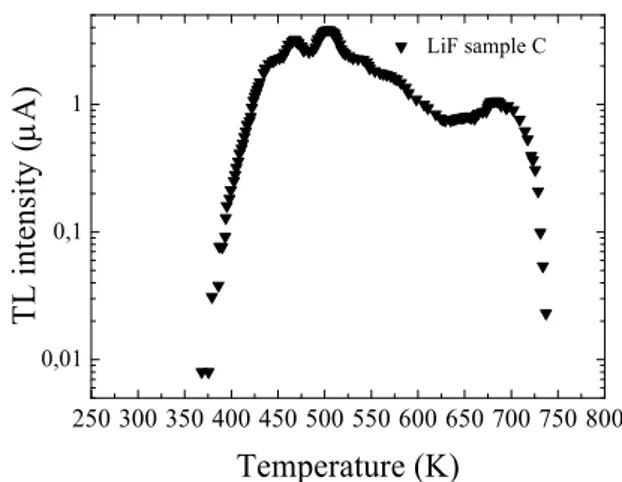
Figures 19 and 20 report the TL of samples C and S18, respectively. Also in this case the shapes of the two emissions look surprisingly similar, especially as far as the bump at around 670 K is concerned, which can be hence considered as a signature for the irradiation of LiF at low temperatures. However, also in this case, there is a difference of about 20 °C of the average temperature emission between the two TL bands.
Figure 19. TL in log scale of old sample C, irradiated at -60 °C (213 K)with gamma rays at a dose of 7x10³
Gy.
Figure 20. TL in log scale of new sample S18, irradiated at -60 °C (213 K) with gamma rays at a dose of 8.3x10⁴ Gy.
By summing up the two parallel cases above, it seems that old and new samples have similar TL glow curves, which is an omen for our measurements, while the temperatures of the GPs do not correlate closely among them, which can be a consequence of the experimental temperatures being different in the two measurements by about 30 °C in average for physical or instrumental causes. However, given the similarity of our TL glow curves, we can move on in analyzing the new measurements, which cover more than four orders of magnitude in intensity, contrarily to the old spectra, which covered only two decades.
300 350 400 450 500 550 600 650 700 750 101 102 103 104 105 106 S15 S16 Temperature (K) T L in te nsity ( ar b. uni ts ) 300 350 400 450 500 550 600 650 700 750 101 102 103 104 105 106 Temperature (K) T L in te ns ity ( 10 arb. uni ts ) S18 250 300 350 400 450 500 550 600 650 700 750 0,01 0,1 1 T L intensi ty ( A) Temperature (K) LiF sample A 250 300 350 400 450 500 550 600 650 700 750 800 0,01 0,1 1 LiF sample C T L intensity ( A) Temperature (K)
4.3 Analysis of Thermoluminescence in LiF
Up to now, we have shown the measurements of eight LiF samples, which were irradiated by gamma rays in different conditions. In particular, for each LiF crystal, the amount and types of CCs have been established from optical absorption spectra together with the complete TL glow curves for each of them. However, in order to compare and discuss the data, the new non-trivial step of extracting the GPs from the TL glow curves is awaiting us.
In a previous work, TL glow curves of the four gamma-irradiated LiF crystals were visually analyzed, and eight GPs were associated to the more prominent bumps of the emission intensity [12]. Later on, a first-order kinetics approach was used to simulate the TL glow curves, and the best fit of all the four spectra at the same time delivered ten GPs [13]. Apart from two weak GPs at 142 and 363 °C (415 and 636 K, respectively), all the other GPs were coinciding in the two simulations well within 5 °C, which is consistent with the fact that the two analyses refer to the same spectra, and demonstrates that the visual method was not very far from the more sophisticated one, by taking into consideration also the weakness of two unseen GPs.
One could consider proceeding along the same simulation path as above mentioned, but the experimental observation that the new TL glow curves were shifted with respect to the old ones posed an insurmountable problem. So, we had to proceed along new lines of simulation, by using the previous results only as a rough guide.
Here too, we have chosen a first-order kinetics model to fit the experimental data [32]; the reason for this choice has been the same as in the previous works, i.e. it seems not convenient to use a more refined approach at a the present level of knowledge because there are too many parameters which are influenced by impurities [13]. So, we should first isolate them in order to look more deeply inside a more appropriate fitting model.
In practice, the analysis of the TL intensity has been accomplished by using a friendly free downloadable software, namely GlowFit, a program that is specially designed to simulate TL glow curves resulting from up to ten single or superimposed GPs following the first order kinetics [33].
GlowFit allows determining the trap energy depth E, the peak maximum temperature TM, the peak
maximum intensity IM and the frequency factor S as output best fit parameters, and also calculates
the peak area A. Furthermore, it is also possible to calculate the width of the GP, ωa, defined as
ωa=A/IM. The fit reliability is expressed through the figure of merit (FOM) value that is a further
program output, and is defined as
% ∑ 100 ∙|∆ | (4)
where n is the number of data points, Δyi is the difference between the experimental and fitted
points, and AT is the integral of the fitted glow curve in the region of interest [34].
Figures 21-28 show the results of the fit which delivers 10 GPs in agreement with the previous fit [13], but at odd with their peak temperatures; considering our previously comments, this is not a
surprising result. If the complexity of the matter is taken in due consideration, it is astonishing how good these results are, especially as far as sample S18 is concerned (see Fig. 28), which possesses a well-resolved GP at about 650 K. Moreover, sample S18 has been pivotal in assigning GP9, because that peak is so weak in the other samples that it would have escaped our attention, and so would have been not included in the model. These results also show that signals smaller than 10, in the arbitrary units (arb. units) of the intensity, do not have any meaning being comparable with the noise of the experimental apparatus.
Figure 21. Experimental TL (points) theoretical fit (black full line) and GP curves (colored full lines), all in log scale, of sample S11. FOM is the Figure Of Merit of the fitting procedure.
Figure 22. Experimental TL (points) theoretical fit (black full line) and GP curves (colored full lines), all in log scale, of sample S12. FOM is the Figure Of Merit of the fitting procedure.
300 350 400 450 500 550 600 650 700 750 101 102 103
TL
Intensity (arb.un
its)
Temperature (K)
exp fit N1 N2 N3 N4 N5 N6 N7 N8 N9 N10 S11, FOM = 9.38 % 300 350 400 450 500 550 600 650 700 750 101 102 103 104 S12, FOM = 7.97 %T
L
In
ten
sity
(arb
.u
nits)
Temperature (K)
exp fit N1 N2 N3 N4 N5 N6 N7 N8 N9 N10Figure 23. Experimental TL (points) theoretical fit (black full line) and GP curves (colored full lines), all in log scale, of sample S13. FOM is the Figure Of Merit of the fitting procedure.
Figure 24. Experimental TL (points) theoretical fit (black full line) and GP curves (colored full lines), all in log scale, of sample S14. FOM is the Figure Of Merit of the fitting procedure.
300 350 400 450 500 550 600 650 700 750 101 102 103 104 exp fit N1 N2 N3 N4 N5 N6 N7 N8 N9 N10
Temperature (K)
TL Intensity (arb. units)
S13, FOM = 4.46 % 300 350 400 450 500 550 600 650 700 750 101 102 103 104 105 S14, FOM = 5.75 %
T
L
in
ten
sity
(arb
. u
nits)
Temperature (K)
exp fit N1 N2 N3 N4 N5 N6 N7 N8 N9 N10Figure 25. Experimental TL (points) theoretical fit (black full line) and GP curves (colored full lines), all in log scale, of sample S15. FOM is the Figure Of Merit of the fitting procedure.
Figure 26. Experimental TL (points) theoretical fit (black full line) and GP curve (colored full lines), all in log scale, of sample S16. FOM is the Figure Of Merit of the fitting procedure.
300 350 400 450 500 550 600 650 700 750 101 102 103 104 105 106 S15, FOM = 2.12 %
T
L
inten
sity
(a
rb.u
nits
)
Temperature (K)
exp fit N1 N2 N3 N4 N5 N6 N7 N8 N9 N10 300 350 400 450 500 550 600 650 700 750 101 102 103 104 105 106Temperature (K)
S16, FOM = 2.55 %TL i
nt
ensi
ty (ar
b.
uni
ts
)
expfit N1 N2 N3 N4 N5 N6 N7 N8 N9 N10Figure 27. Experimental TL (points), theoretical fit (black full line) and GP curves (colored full lines), all in log scale, of sample S17. FOM is the Figure Of Merit of the fitting procedure.
Figure 28. Experimental TL (points) theoretical fit (black full line) and GP curves (colored full lines), all in log scale, of sample S18. FOM is the Figure Of Merit of the fitting procedure.
300 350 400 450 500 550 600 650 700 750 101 102 103 104 105 106 107 S17, FOM = 2.34 %
TL
In
ten
sity
(arb
. un
its)
Temperature (K)
exp fit N1 N2 N3 N4 N5 N6 N7 N8 N9 N10 300 350 400 450 500 550 600 650 700 750 101 102 103 104 105 106 S18, FOM = 3.91 %TL Int
ens
it
y (
arb.
uni
ts
)
Temperature (K)
exp fit N1 N2 N3 N4 N5 N6 N7 N8 N9 N10Table 5 reports the peak intensities of the GPs as a function of irradiation dose. It can be noticed that all the data are bigger than 10 arb. units with the exception of GP9 in sample S11, whose value is 2 arb. units, an artificial result from the fitting procedure.
Table 5. Intensity of Glow Peaks as a function of dose, i.e. the various samples S11-17 and S18. The latter sample is inserted in a separated column because is not homogeneous with the former ones, and its data can be utilized only for a reasoned comparison.
Sample S11 S12 S13 S14 S15 S16 S17 S18
Dose
(Gy) 8.3 25 83 2.5x10² 2.5x10³ 2.5x10⁴ 2.5x10⁵ 8.3x10⁴
Glow
Peak (arb. units) Intensity
GP1 48 187 370 996 3771 16333 89443 761 GP2 756 3088 11898 45265 129732 705511 865773 1357 GP3 230 1070 2936 14689 54525 347375 512801 28072 GP4 17 44 431 4779 58487 465018 453829 303 GP5 78 344 1443 4792 35762 558195 1320938 384289 GP6 45 171 1189 4238 23377 383742 971821 332736 GP7 19 35 178 1161 5848 82405 914472 135347 GP8 20 33 175 336 2203 10415 747465 68847 GP9 2 17 66 159 450 945 222522 42772 GP10 22 41 72 186 238 873 27619 69
Table 6 reports the most important parameters of the fitting procedure, i.e. TM, E, ωa, and S for
each GP; the found values are in line with similar calculations for other investigated cases. A much closer comparison with other data will be accomplished in the next Section.
Table 6. Values of the parameters TM, Temperature at maximum intensity, and E, activation Energy, ωa , width, and S,
frequency factor, referring to the GPs as fitted with a first order kinetics approach. In brackets the semi-dispersion of the experimental data, well below 10% for the Temperature and about 10% for the Energy, which is a measure of the goodness of the fit.
GP TM (±Δ) (K) TM (°C) E (±Δ) (eV) ωa (°C) S (s-1) 1 395 (8) 122 1.06 (0.08) 13 1.6×10¹² 2 435 (9) 162 1.41 (0.10) 16 1.3×10¹⁵ 3 449 (12) 176 1.19 (0.13) 17 9.2×10¹¹ 4 474 (21) 201 1.12 (0.25) 19 2.5 1010 5 509 (5) 236 1.05 (0.11) 22 5.8×10⁸ 6 552 (6) 279 1.02 (0.05) 26 3.7×10⁷ 7 599 (8) 326 1.94 (0.20) 30 9.4×10¹⁴ 8 630 (11) 357 2.11 (0.30) 33 3.4×10¹⁵ 9 663 (10) 390 2.76 (0.24) 37 6.6×10¹⁹ 10 692 (11) 419 1.78 (0.20) 40 2.3×10¹¹
5. DISCUSSION
First of all, by looking carefully at Figs. 21-28 and taking into account that the intensities of TL span over three orders of magnitude, the fit on the whole is satisfactory enough. Indeed, when peaks and bumps are prominent in the TL glow curves, they are well reproduced by the simulation, while our approach is more problematic when the intensity features are hidden. From the whole process of fit, it is possible to extract the parameters reported in Table 6, which can be compared with the
previous ones reported in Table 4 of Ref. [13]. The GP temperatures, TM, differ in average by about
10 °C among the corresponding ones, which is still reasonable for TL. The present trap depths, E, are comparable with the previous ones, but in addition they are more monotone and the trend
“deeper depths-higher TM” is more evident than previously. Also, the widths, ωa, are now more
monotone than before. Finally, the frequency factors, S, are still variable within 12 orders of magnitude, but less than the old fits, where there were differences of 14 orders of magnitude, and
they are closer to the expected maximum value of 1.26×10¹⁴ s-1, i.e. the lattice vibration frequency
in LiF.
Having established that the present fit procedure has been much improved with respect to the previous one [13], we can proceed further in analyzing the measurements, and in particular we are now in the position to systematically follow the growing of single GPs and CCs with dose. This new scenario offers new possibilities of analysis, as opposed to the case of the old measurements for which the dose was the same and only the relative concentration ratio of CCs was changed in 4 samples.
Figures 29-37 show the behavior of the CCs concentration in the present irradiated LiF crystals as a function of dose. Sample S18 has been added only for comparison: it does not participate in determining the polynomial fitting curve, which has the sole function of interpolating the experimental data and thus facilitating to deal with variations.
Figure 29. Concentration of F centers as a function of gamma ray dose for the eighth samples utilized in the
present study.
Figure 30. Concentration of F3(R1) centers as a function
of gamma ray dose for the eighth samples utilized in the present study. The first three samples do not give
appreciable numerical values.
103 104 105 106 107 108 1013 1014 1015 1016 1017 1018 1019 S11-S17 S18
polynomial best-fit (3rd degree)
F conc ent ration (cm -3 ) Dose (R) 10 3 104 105 106 107 108 1013 1014 1015 1016 1017 1018 1019 S11-S17 S18
polynomial best-fit (3rd degree)
F 3 (R 1 ) concentrati on (cm -3 ) Dose (R)
Figure 31. Concentration of F3(R2) centers as a
function of gamma ray dose for the eighth samples utilized in the present study. The first three samples do
not give appreciable numerical values.
Figure 32. Concentration of F2 centers as a function of
gamma ray dose for the eighth samples utilized in the present study.
Figure 33. Concentration of F3+ centers as a function of
gamma ray dose for the eighth samples utilized in the present study.
Figure 34. Concentration of F4(N1) centers as a function
of gamma ray dose for the eighth samples utilized in the present study. The first four samples do not give
appreciable numerical values.
Figure 35. Concentration of F4(N2) centers as a function
of gamma ray dose for the eighth samples utilized in the present study. The first four samples do not give
appreciable numerical values.
Figure 36. Concentration of F4-like centers as a function
of gamma ray dose for the eighth samples utilized in the present study. The first four samples do not give
appreciable numerical values.
103 104 105 106 107 108 1013 1014 1015 1016 1017 1018 1019 S11-S17
polynomial best-fit (3rd degree) S18 F 3 (R 2 ) co nce nt ra ti on ( cm -3 ) Dose (R) 103 104 105 106 107 108 1013 1014 1015 1016 1017 1018 1019 S11-S17 linear best-fit S18 F 2 co nc entra tio n (c m -3 ) Dose (R) 103 104 105 106 107 108 1013 1014 1015 1016 1017 1018 1019 S11-S17
polynomial best-fit (3rd degree) S18 F 3 + concentration (cm -3 ) Dose (R) 10 3 104 105 106 107 108 1013 1014 1015 1016 1017 1018 1019 S15-S17
polynomial best-fit (2nd degree) S18 F4 (N 1 ) concentration (c m -3 ) Dose (R) 103 104 105 106 107 108 1013 1014 1015 1016 1017 1018 1019 S15-S17
polynomial best-fit (2nd degree) S18 F 4 (N 2 ) concent ra tion (cm -3 ) Dose (R) 103 104 105 106 107 108 1013 1014 1015 1016 1017 1018 1019 S15-S17
polynomial best-fit (2nd degree) S18 F 4 -like concent rat ion (cm -3 ) Dose (R)
Figure 37. Concentration of F2- centers as a function of
gamma ray dose for the eighth samples utilized in the present study. The first four samples do not give
appreciable numerical values.
Figures 38-47 show the behavior of the intensity of the 10 GP vs. irradiation dose. Also here, sample S18 has been added just for the sake of comparison, being the situation similar to the previous figures regarding CCs.
With these new data, we are now able to relate CCs and GPs, if any correlation ever exists.
The first evidence is the observation of all the GPs since sample S11, just above the noise for a few
of them. On the contrary, F3(R2), F3(R1), F4(N1), F4(N1), F4-like, and F2- are not even observed until
samples S14-S15, and after that they increase with different behaviors well below 1016-1017
CCs/cm3. Therefore, it seems that these CCs are not related to any observed GP and, consequently
they can be discarded from any further analysis.
Only F, F2, and F3+ CCs remain to be considered. All three of them increase with dose and, in
particular, F3+ centers start to grow more than linearly from a certain dose.
Figure 38. Intensity of GP1 as a function of gamma ray
dose for the eighth samples utilized in the present study. dose for the eighth samples utilized in the present study.Figure 39. Intensity of GP2 as a function of gamma ray
103 104 105 106 107 108 1013 1014 1015 1016 1017 1018 1019 S15-S17
polynomial best-fit (2nd degree) S18 F 2 - co nc en tr ation (c m -3 ) Dose (R) 103 104 105 106 107 108 100 101 102 103 104 105 106 107 S11-S17 polynomial best-fit S18 G P 1 in te nsity (arb . u nit s) Dose (R) 10 3 104 105 106 107 108 100 101 102 103 104 105 106 107 S11-S17 polynomial best-fit S18 G P 2 in te nsity (arb . u nit s) Dose (R)
Figure 40. Intensity of GP3 as a function of gamma ray
dose for the eighth samples utilized in the present study. dose for the eighth samples utilized in the present study.Figure 41. Intensity of GP4 as a function of gamma ray
Figure 42. Intensity of GP5 as a function of gamma ray
dose for the eighth samples utilized in the present study. dose for the eighth samples utilized in the present study.Figure 43. Intensity of GP6 as a function of gamma ray
Figure 44. Intensity of GP7 as a function of gamma ray
dose for the eighth samples utilized in the present study. dose for the eighth samples utilized in the present study.Figure 45. Intensity of GP8 as a function of gamma ray
103 104 105 106 107 108 100 101 102 103 104 105 106 107 S11-S17 polynomial best-fit S18 G P 3 i nt ensit y (arb. un its) Dose (R) 10 3 104 105 106 107 108 100 101 102 103 104 105 106 107 S11-S17 polynomial best-fit S18 G P 4 intensit y (arb. units) Dose (R) 103 104 105 106 107 108 100 101 102 103 104 105 106 107 S11-S17 polynomial best-fit S18 G P 5 intensit y (arb. un its) Dose (R) 103 104 105 106 107 108 100 101 102 103 104 105 106 107 S11-S17 polynomial best-fit S18 G P 6 intensit y (arb. un its) Dose (R) 103 104 105 106 107 108 100 101 102 103 104 105 106 107 S11-S17 linear best-fit S18 G P 7 intensit y (arb. un its) Dose (R) 103 104 105 106 107 108 100 101 102 103 104 105 106 107 S11-S17 polynomial best-fit S18 G P 8 i ntensi ty (arb . unit s) Dose (R)
Figure 46. Intensity of GP9 as a function of gamma ray dose for the eighth samples utilized in the present study.
Figure 47. Intensity of GP10 as a function of gamma ray dose for the eighth samples utilized in the present study.
Among the glow peaks, GP2, GP3, GP4, GP5, and GP6 show a net saturation at high doses, if not a decrease as for GP4. As a result, they are not related at all to the three previous CCs. We will see later on how to explain them.
GP1 and GP7 show a linear behavior with the dose, thus they can be related to both F and F2 centers, whose concentrations are linear with the dose too. However, the amount of F centers in sample S18 is in agreement with the intensity of GP7 for the same sample S18, so that F centers and GP7 can be associated. With the same reasoning, the amount of F2 centers of sample S18 agree with the intensity of GP1 for sample S18, therefore one can conclude that GP1 and F2 centers are related each other.
Finally, GP8, GP9, and GP10 display a behavior vs. dose similar to that of F3+ centers, but again
sample S18 allows only GP9 to be associated to F3+ centers.
Let us now go back to the saturated glow peaks GP2, GP3, GP4, GP5, and GP6. Because their intensities grow, since the lowest doses, together with the F and F2 centers concentrations, they are for sure related to these point defects, but not only to them. Indeed, while the concentrations of F and F2 centers continue to grow, these GPs saturate. Consequently, we advance the hypothesis that these GPs are due to the presence of F2 and F centers bound to the impurities contained in the LiF crystals, i.e. F2-imp and F-imp. But, taking into the account the behavior of sample S18, it appears that the GPs are essentially correlated with the F2-imp. For GP2, GP3 and GP4, this association can be considered clear, while for GP5 and GP6 it is less certain. Looking at Table 2, it is evident that
the concentration of the various impurities barely arrive to 1018 cm-3, in any case well above the
amount of F2 centers. However, it is known that not all impurities have the same tendency to attach themselves to defect centers, so that their effective numbers are much less. Therefore, at a certain dose, there are not enough impurities to be bounded to F2 centers, and the GPs related to F2-imp centers cannot grow anymore, rather they may even decrease in intensity. Therefore, we can conclude that GP2, GP3, GP4, GP5, and GP6 are related mostly to F2-imp centers and to a lesser extent to F-imp centers.
In conclusion, up to now we can state the following as much as GPs and CCs are concerned: - GP2, GP3, GP4, GP5, and GP6 are related to F2-imp centers, mainly.
- GP7 is related to F centers, - GP1 is related to F2 centers,
- GP9 is related to F3+ centers,
- GP8 and GP10 are, by exclusion, tentatively assigned to F3(R) centers.
Table 7reports the previous associations in a concise way for a better appreciation.
103 104 105 106 107 108 100 101 102 103 104 105 106 107 S11-S17 polynomial best-fit S18 G P 9 i nt ensit y (arb . un its) Dose (R) 10 3 104 105 106 107 108 100 101 102 103 104 105 106 107 S11-S17 polynomial best-fit S18 G P 10 in te ns ity (a rb . u nit s) Dose (R)
Table 7. Association between GPs and CCs as given by the present measurements and analysis.
GP 1 2 3 4 5 6 7 8 9 10
TM(K) 395 435 449 474 509 552 599 630 663 692
TM(°C) 122 162 176 201 236 279 326 357 390 419
CC F2 F2-imp F2-imp F2-imp F2-imp F2-imp F F3(R) ? F3+ F3(R) ?
6. CONCLUSIONS
About ten years ago, some of the present authors became involved in the task of understanding whether the TL of so-called pure LiF crystals irradiated with gamma rays could be amenable to a well-defined association with the CCs produced by the same irradiation [35]. To make a long story short, after five years we were able to associate a few GPs with certain CCs [12, 13]. The breaking tools, which were used in the previous assignments in four samples irradiated with the same gamma dose, were mainly the knowledge of the physics of CCs and accurate annealing
measurements, rather than the TL glow curves themselves. In practice, we assigned to F3+, F3, and
F2 centers the GPs al low temperatures, less than 260 °C, and to F2-imp and F centers the GPs above 260 up to 420 °C. However, we were not completely satisfied with such result, because both the F2-imp and F center attributions were made by the exclusion principle and, overall, only one dose of irradiation was considered, which is a rather limited frame of operation. In the present study, such limitations have been overcome, and we propose the assignments reported in Table 7. As one can see, with the exception of the F2 centers, the F2-imp and F centers dominate the low
temperature range of TL, while F3 and F3+ dominate the high temperature range of TL, just the
opposite with respect to the old assignments. This unexpected result can be observed much better in Table 8, where all the involved data are displayed together and in a logical representation. Apart from the slight temperature differences between the old and new TL glow curves, which we have already discussed before, the GP-CC assignments have been completely reversed.
Table 8. Association between GPs and CCs as given by present, New, and previous measurements and analyses of samples A,B,C,D, Old 1 [12] and Old 2 [13]. The values in bold refers to the most intense GPs.
Sample Temperature of GPs (TM °C) and Association to CCs
GP 1 2 3 4 5 6 7 8 9 10
New 122 162 176 201 236 279 326 357 390 419
CC F2 F2-imp F2-imp F2-imp F2-imp F2-imp F F3(R)? F3+ F3(R)?
Old 1 164 193 228 263 286 308 332 410
CC F3+ F3 F3 F2 F-imp F-imp F-imp F
Old 2 142 162 190 224 253 281 300 328 363 412
When we started these studies on LiF crystals, we assumed their nominal purity of less than 20 ppm in weight to be good enough to the purpose, but this assumption proved to be less and less reliable as our studies progressed; we have now observed that the issue cannot be ignored anymore. Indeed, the TL glow curves measured up to now show that a significant fraction of the light emission is due to center traps associated with F2 and to a less extent to F, centers and/or impurities.
In conclusion, apart from the few present associations, which await to be confirmed, more pure crystals should be used if the GPs related to CCs are to emerge in a sea of GPs related to impurities. As a side effect, the unexpected consequences of the impurities on the TL properties, have reminded the authors that LiF has been used for a long time in the broad field of optoelectronics, and lately also in miniaturized devices [4, 36, 37]. The question naturally arises, whether the impurities have also marred the functioning of such interesting and promising optoelectronic devices.
REFERENCES
[1] R. Chen and S.W.S. McKeever, Theory of Thermoluminescence and Related Phenomena, World Scientific, Singapore, 1997.
[2] C. Furetta and P.-S. Weng, Operational Thermoluminescence Dosimetry, World Scientific, Singapore, 1998.
[3] C. Furetta, Handbook of Thermoluminescence, World Scientific, New Jersey, 2003.
[4] G. Baldacchini, Colored LiF: an Optical Material for all Seasons, J. Lumin. 100 (2002) 333-343. And references cited therein.
[5] C.C. Klick and E.W. Claffy, Color Centers and Thermoluminescence in LiF, Proc. Int. Symposium on Color Centers in Alkali Halides, Rome, Italy, September 23-27 (1968) 166-7. [6] J.A. Ghormley and H.A. Levy, Some Observations of Luminescence of Alkali Halide Crystals
Subjected to Ionizing Radiation, J. Phys. Chem. 56 (1952) 548-54.
[7] A.T. Davidson, A.G. Kozakiewicz, D.J. Wilkinson, J.D. Comins, and T.E. Derry,
Thermoluminescence of Ions-implanted LiF Crystals Using 100 keV Rare Gas Ions, Nuclear
Instruments and Methods in Physics Research B 141 (1998) 523-7.
[8] M. Moscovitch and Y.S. Horowitz, Thermoluminescent Materials for Medical Applications, Radiation Measurements 41 (2007) S71-7.
[9] N. Salah, P.D. Sahare, and A.A. Rupasov, Thermoluminescence of Nanocrystalline
LiF:Mg,Cu,P, J. Lumin. 124 (2007) 357-64.
[10] A.T. Davidson, A.G. Kozakiewicz, D.J. Wilkinson, and J.D. Comins, Defect Clusters and
Thermoluminescence in LiF Crystals, J. Appl. Phys. 86 (1999) 1410-4.
[11] D.R.S. Ribeiro, D.N. Souza, S.L. Baldochi, and L.V.E. Caldas, Applicability of Pure LiF in
Dosimetry, Radiation Measurements 43 (2008) 1132-4.
[12] G. Baldacchini, R.M. Montereali, E. Nichelatti, V.S. Kalinov, A.P. Voitovich, A.T. Davidson, and A.G. Kozakiewicz, Thermoluminescence in Pure LiF Crystals: Glow Peaks and Their
Connection with Color Centers, J. Appl. Phys. 104 (2008) 063712-1-10.
[13] G. Baldacchini, P. Chiacchiaretta, V. Gupta, V. Kalinov, and A.P. Voitovich,
Thermoluminescence, Glow Curves and Carrier Traps in Colored and Nominally Pure LiF Crystals, Physics of the Solid State 50 (2008) 1747-1755.
[14] W. Gellermann, Color Center Lasers, J. Phys. Chem. Solids 52 (1) (1991) 249. [15] J.H. Crawford, Radiolysis of Alkali Halides, Adv. Phys. 17 (1968) 93.
[16] E. Hughes, D. Pooley, H.U. Rahman and W.A. Runciman, Harwell Atomic Research
Establishment R-5604 (1967).
[17] F. Seitz, Color Centers in Alkali Halide Crystals, Rev. Mod. Phys. 26 (1954) 7.
[18] G. Baldacchini, M. Cremona, U.M. Grassano, V. Kalinov and R.M. Montereali, Emission
Properties of Gamma Irradiated LiF Crystals Excited in the F Absorption Band by an Excimer Laser, in Defects in Insulating Materials (O. Kanert and J.M. Spaeth, Eds.), World Scientific,
Singapore (1993) 1103-06.
[19] E. Sonder and W.A. Sibley, Point Defects in Solids (J.H. Crawford and L.M. Slifkin, Eds.), Chap. 4, Plenum Press, New York (1972).
[20] V.V. Ter-Mikirtychev and T.T. Tsuboi, Stable room-temperature tunable color center lasers
and passive Q-switchers, Prog. Quantum Electr. 20 (3) (1996) 219.
[22] M. Montecchi, E. Nichelatti, A. Mancini and R.M. Montereali, J. Appl. Phys. 86 (7) (1999) 3745.
[23] J. Nahum, Optical Properties and Mechanism of Formation of Some F-Aggregate Centers in
LiF, Phys. Rev. 158 (1967) 814.
[24] V.V. Ter-Mikirtychev and T.T. Tsuboi, On the nature of the 735 nm luminescence band in
coloured LiF crystals, Canad. J. Phys. 75 (1997) 813.
[25] G. Baldacchini, Defect Centers in Insulating Solids, Optical Properties of, Encyclopedia of condensed matter physics, G.F. Bassani, G.L. Liedl, and P. Wyder, eds, Elsevier Academic Press, (2005) 379-386.
[26] T. Marolo, G. Baldacchini, V.S. Kalinov, R.M. Montereali, Combined Excitation-Emission
Spectroscopy of Colour Centres in Lithium Fluoride Crystals, Phys. Stat. Sol. (c) 2, No. 1 (2005)
367-370.
[27] G. Baldacchini, F. Bonfigli, F. Menchini, and R.M. Montereali, High Concentration of
Aggregate Color Centres in Heavily Irradiated LiF Crystals, Nucl. Instrum. Methods Phys. Res. B
191 (2002) 216-220.
[28] Y.S. Horowitz and D. Yossian, Computerised Glow Curve Deconvolution: Application to
Thermoluminescence Dosimetry, Radiat. Prot. Dosim. 60 (1995).
[29] G. Baldacchini, P. Chiacchieretta, V. Gupta, V. Kalinov, A.P. Voitovich,
Thermoluminescence, glow curves, and carrier traps in colored and nominally pure LiF crystals,
Phys. Solid State 50 (2008) 1747.
[30] G. Baldacchini, R.M. Montereali, and T. Tsuboi, Energy transfer among color centers in LiF
crystals. Eur. Phys. J. D 17 (2001) 261-264.
[31] W. Beall Fowlers, Electronic States and Optical Transitions of Color Centers, in Physics of color centers, Academic Press, N.Y., 1968, Edited by Beall Fowler, Chapter 2, p. 72.
[32] S.W.S. McKeever, Thermoluminescence of Solids, Cambridge University Press, Cambridge, 1985.
[33] M. Puchalska and P. Bilski, GlowFit—a new tool for thermoluminescence glow-curve
deconvolution. Radiation Measurements 41 (2006) 659-664.
[34] H.G. Balian and N.W. Eddy, Figure of merit (FOM), an improved criterion over the
normalized chisquared test for assessing goodness-of-fit of gamma ray spectra peaks. Nucl.
Instrum. Meth. 145 (1977) 389–395.
[35] G. Baldacchini, A.T. Davidson, V.S. Kalinov, A.G. Kozakiewicz, R.M. Montereali, and A.P. Voitovich, Effects of Bleaching on the Thermoluminescence of Gamma-Irradiated LiF Crystals, J. Lumin. 102-103 (2003) 77-80.
[36] L. Jia-Rong, Y. Yong-Bo and Z. Xiang , Organic Light-Emitting Devices with a LiF Hole
Blocking Layer, Chinese Phys. Lett. 24 (2007) 828.
[37] T. Kurobori, Y. Obayashi, K. Suzuki, Y. Hirose, T. Sakai and S. Aoshima, Fabrication of
Optoelectronic Devices in Lithium Fluoride Crystals by Interfering Femtosecond Laser Pulses,