List of Contents
1. Introduction ………..….... 4
2. Accident scenario and plant data ……….…..….… 7
2.1 SBLOCA accident scenario ………..……...….. 7
2.2 Boundary conditions ………..….… 7
2.2.1 Power ……….…. 7
2.2.2 Steam generator pressure and level control ………... 9
2.2.3 Hot leg break ………. 11
2.2.4 Letdown/make-up flow and ECCS injections ………..… 11
2.2.5 Threshold set-point values ………..… 11
2.3 TMI-2 plant data ………...… 11
2.3.1 Free volumes ………..…... 11
2.3.2 Heat transfer with secondary side ………,..………. 12
2.3.3 Intact core geometry ………,…...…. 12
2.3.4 Vessel and internal structures ………,..…… 12
2.3.5 Vent valve operation ………,…...…… 12
2.4 Initial TMI-2 plant conditions ……….…..…. 13
2.4.1 Nominal TMI-2 steady-state ………,………….. 13
2.4.2 Primary coolant mass inventory ………,…...…... 13
2.5 Core reflooding scenarios ………...…… 14
3. MELCOR calculations ……….… 16
3.1 Brief description of the MELCOR code ……….…... 16
3.2 Reference physical parameters of the code …………..………..… 17
3.3 Initial TMI-2 plant conditions ………...…..18
3.3.1 Nominal TMI-2 steady-state ………...……… 18
3.3.2 TMI-2 plant model ……… 19
3.3.3 Primary mass inventory ………..…..….. 21
3.4 Parameters and results ……….….…...22
3.4.1 Reference case ………..……… 23
3.4.2 Sensitivity case A ………...……….……….. 35
3.4.3 Sensitivity case B ………..……… 45
3.5 Final remarks ………..… 55
4. ASTEC calculations ……….……….…… 57
4.1 Brief description of the ASTEC code ……….…... 57
4.2 TMI-2 reactor ASTEC model …….……….….…. 58
4.3 Reference scenario and sensitivity analysis ……….…. 61
4.4 Reflooding cases ………..……….….. 70
4.4.1 Calculation results ……...……….…..72
4.5 Platform dependencies ………...……..……….….. 81
4.6 Summary and conclusions ……….…. 84
5. MELCOR and ASTEC result comparison ………...……….…. 86
5.1 TMI-2 steady-state conditions at nominal power ………..…. 86
5.2 In-vessel core degradation parameters and modelling options ………..…. 87
5.3 Chronology of main events ……….….... 88
5.4 Evolution of main parameters ……….…… 88
3.4.1 Reference case without reflooding ………..…..……… 89
3.4.2 Reflooding of a slightly degraded core……...………...……….. 95
3.4.3 Reflooding of a highly degraded core ………..………… 100
1.
Introduction
During a severe accident in a light water reactor, the core can melt and can be relocated to the lower plenum of the reactor pressure vessel (RPV). Due to the possible presence of water, the melt can form a particle debris bed (in-vessel scenario). An insufficient heat removal of decay heat in the debris bed may lead to a re-melting of the debris and to a failure of the RPV. On the other hand a reflooding (due to the intervention of safety systems) of hot (temperatures above 1500 K), but relatively intact, fuel rods may result in a sharp increase of temperature of the fuel rods and surrounding core regions, large production of hydrogen and steam, enhanced fission product release and core material melting. This sounds counterintuitive, but the increase of temperature is caused by the oxidation of the regions of the core that have not yet been quenched but are exposed to large quantities of hot steam produced by the quenching process.
Although this is still an area of active research, a large number of reflooding experimental data, as well as data from TMI-2, has demonstrated these characteristic trends. Nowadays, computer codes are essential tools for understanding how the reactor might respond under severe accident conditions. The codes are used as a tool to support engineering judgement, based on which specific measures to mitigate the effects of severe accidents are designed. They are also used to determine accident management strategies and for probabilistic safety assessment. It is very important to use these sophisticated tools in accordance with certain rules derived from knowledge accumulated worldwide. In the case of numerical simulation of severe accidents, generally is adopted a two-tier approach: integral codes or code systems that simulate the entire accident rapidly, from the initiating event to the possible release of radionuclides outside the containment and taking into account the main safety systems; detailed or mechanistic codes that provide a finer simulation of the phenomena involved a finer simulation of single phenomenon or group of phenomena (core degradation or FP release).
The integral codes are primarily not designed to perform best estimate simulations; the objective is rather to allow the user to bound important processes or phenomena by numerous user-defined parameters in a fast running manner. The fast running codes may contain best estimate models for some phenomena, but not necessarily for all of the relevant phenomena. It is, therefore, difficult to use them for a best estimate analysis because of large uncertainties in some of the models. After all, a completely conservative approach cannot be applied in the analysis of a severe accident because a conservative assumption for one parameter may lead to a non-conservative response for another parameter. For example, a low failure temperature (i.e. temperature for the onset of relocation of molten material) is conservative with respect to the time of vessel failure but not with respect to hydrogen production. On contrary, the aim of detailed or mechanistic codes is to represent the plant behavior as realistically as possible according to state of the art knowledge. It is important to point out that for the early phase of a severe accident up to the formation of large amounts of molten fuel in the core, the experimental database is sufficiently large, an understanding of the phenomena is good and
the models are adequately detailed and validated. For the late in-vessel phase of a severe accident, the experimental database is still poor (particularly with respect to the scale), the models have more modelling parameters, are less general and not well validated.
Since the Three Mile Island Unit 2 (TMI-2) reactor accident in 1979, there have been extensive research activities to try to understand the phenomena involved, and to develop accident management strategies to mitigate the consequences of core melt accidents. Given that a severe accident cannot be simulated at or near full scale, since all the experimental database on core heat up, melt progression and fission product release is limited to the results of small-scale experiments, which are only partially representative of what could occur in a real reactor. Therefore, integral codes are used to describe core degradation transients in nuclear reactors without a clear idea of their predictive capabilities. This is the reason why TMI-2 provides a unique opportunity to assess the capability of integral codes to simulate a severe accident in a full scale Pressurizer Water Reactor (PWR).
The TMI-2 reactor modeling used in computer codes for severe accidents as MELCOR, ASTEC, MAAP 4 and ATHLET-CD has improved significantly over the years due to better understanding, and the simulation results confirm these continuous improvements. In the frame of the current ADP LP1 Task B1.2 program, the activity of ENEA in collaboration with CIRTEN, is devoted to verify the progress and reliability of ASTEC and MELCOR codes through the result comparison for a representative severe accident sequence in a pressurized nuclear power plant of 900 MWe.
The comparison of MELCOR and ASTEC results for the SBLOCA scenario calculated in Ref. [1.1] has shown significant differences mainly regarding the core melt progression in the late transient phase. These differences may come from different core degradation parameters/criteria used by the two codes. In order to try to understand the reason of these differences some sensitivity analysis have been performed, and in an attempt to reduce them the same SBLOCA scenario has been calculated starting with the same core degradation parameters/criteria implemented in the two code calculations. Furthermore, starting from the new reference calculation without safety injection, two core reflooding scenarios have been calculated to investigate the impact of severe accident management measures that implement the delayed availability of emergency core cooling systems to stop the core degradation and the propagation of the severe accident.
In Section 2 of this report, the reference specifications for both code calculations are defined regarding: the SBLOCA accident scenario, the boundary conditions, the TMI-2 plant data, the steady-state conditions of the TMI-2 plant at transient initiation, and the specifications for the reflooding scenarios to be investigated. In Section 3, the results of the MELCOR calculation performed by the University of Pisa are presented in details, along with a short description of the code models used in the analysis to best represent the in-vessel core degradation phase. Similarly, in Section 4, the results of the ASTEC calculations performed by the University of Bologna and the code models used are presented in detail. In Section 5,
the main code results are compared and the main differences tentatively explained. Finally, main conclusions and recommendations are drawn in Section 6.
References
1.1. G. Bandini, M. Di Giuli, M. Sumini, A. Manfredini, W. Ambrosini – Lessons Learned from the Result Comparison of a Reference Severe Accident Sequence on a TMI2-like Reactor of 900 MWe Power with the Integral Codes ASTEC and MELCOR – ENEA - ADPFISS - LP1 – 032 – Settembre 2014.
2.
Accident scenario and plant data
2.1 SBLOCA accident scenarioThe initial event is a small break (size = 0.0015 m2) in the hot leg A at t = 0 s, with simultaneous loss of main feedwater on the secondary side of steam generators (SGs). The primary pressure begins to reduce along with the pressurizer level as soon as the break opens. After few seconds, the fast SG dryout with consequent loss of heat removal from the primary side results in sudden primary pressure increase. The opening of the pressurizer PORV is not enough to limit the pressure rise and, therefore, reactor scram occurs when the pressurizer pressure set-point of 16.3 MPa is reached. The further primary pressure increase after reactor scram might be attenuated by the pressurizer safety valve operation (valve pressure set-point at 17.0 MPa).
The auxiliary feedwater starts at t = 100 s trying to restore 1 m water level in the SG secondary side. The primary pump stop occurs when the whole primary water mass (liquid + steam) inventory reduces below 85000 kg.
Then the accidental transient is let free to evolve towards core uncovery and heatup, core melting and corium relocation in the lower plenum, until possible lower head vessel failure. In the reference accident scenario, no HPI or LPI injection are actuated during the transient phase. In this case, the transient calculation should be pursued until vessel failure using code model options and parameter values recommended by code Best Practice Guidelines. Conversely, HPI injection is taken into account in the calculation of core reflooding scenarios as specified in section 2.5.
2.2 Boundary conditions
The SBLOCA scenario is specified with very simple and well defined boundary conditions, in order to minimize the influence of uncertainty of these conditions on the variability of code results.
2.2.1 Power
Initial core power = 2772 MW.
Thermal heat losses from primary system to containment atmosphere are not taken into account.
Table 2.1: Core power evolution
Time (s) Power (W)
0 2772.00e6
ts (scram time) 2772.00e6
ts + 1 167.94e6 ts + 4 147.96e6 ts + 10 130.14e6 ts + 40 103.14e6 ts + 100 86.13e6 ts + 400 65.34e6 ts + 800 52.92e6 ts + 1000 49.95e6 ts + 2000 42.39e6 ts + 4000 34.56e6 ts + 8000 28.35e6 ts + 10000 26.05e6 ts + 20000 21.46e6
Radial core power profile (6 rings) is given in Table 2.2 below (according to the radial discretization and number of fuel rods defined in the ASTEC simulation by ENEA in ATMI Benchmark [2.1]).
Table 2.2: Radial profile of core power
Ring Factor Number of fuel rods External radius (m)
1 1.2572 1040 0.27 2 1.2127 3120 0.54 3 1.1469 5200 0.81 4 1.0596 7072 1.08 5 0.951 9152 1.35 6 0.8198 11232 1.665
Axial profile of core power is given in Table 2.3 below (same axial power profile in different rings).
Table 2.3: Axial profile of core power Z (m) Factor 0 0 0.15 0 0.302 0.675 0.607 0.857 0.912 1.037 1.217 1.153 1.522 1.202 1.826 1.231 2.131 1.241 2.436 1.209 2.893 1.102 3.503 0.595 3.81 0 4 0
The radial and axial profiles in Table 2.2 and Table 2.3 are valid for intact core geometry. The change in power distribution following core degradation and fuel relocation must be taken into account by the respective code models.
2.2.2 Steam generator pressure and level control
Boundary conditions for the SG secondary side are given by controlling the steam generator pressure and water level (in the riser) as follows:
SG pressure at steady-state value in the first 100 s (P = 6.41 MPa), then pressure rise up to 7.0 MPa in 100 s and constant value until the end of the transient, as shown in Figure 2.1.
SG level reduces quickly down to 0 due to heat transfer from primary side (timing of SG dryout is calculated by the code), then linear increase from t = 100 s, by startup of auxiliary feedwater, reaching the 1 m value at 200 s, and then constant until the end of the transient, as shown in Figure 2.2, by auxiliary feedwater flow rate control.
Regarding the feedwater control, we assume:
Maximum feedwater flow rate = 50 kg/s per SG. Feedwater temperature = 295.15 K.
The linear increase of SG level up to 1 m, starting at 100 s by auxiliary feedwater injection, might be delayed because of strong evaporation inside the SG and due to the limit on maximum feedwater flow rate.
Also based on the experience of the ATMI Benchmark, it seems important to note that the SG pressure and level might deviate from the boundary values, when SG power removal reduces down close to 0, due to stop of natural circulation in the primary loops, after the initial boil-off phase. By this time, steam condensation in the secondary side of SG leads to slow progressive decrease of the SG pressure below 7.0 MPa and, at the same time, leads to slow progressive increase of the SG level above 1 m. In any case, and in particular in this situation, the pressure cannot be controlled by steam ingress into the SG dome, so as the level cannot be controlled by water draining from the SG bottom.
Figure 2.1: SG pressure control
Figure 2.2: SG level control 62 64 66 68 70 72 0 100 200 300 400 500 600 700 800 900 1000 Time (s) P ressu re (b a r) SG pressure 0.0 0.2 0.4 0.6 0.8 1.0 1.2 0 100 200 300 400 500 600 700 800 900 1000 Time (s) L e ve l ( m ) SG level
2.2.3 Hot leg break
Break size = 0.0015 m2
Break position = 4 m along the hot leg of loop A, from vessel outlet nozzle
Containment pressure = 0.1 MPa (pressurization of the containment atmosphere is not taken into account)
No stratification in the hot leg during the boil-off phase before primary pump stop, which may significantly affect the break mass flow rate value.
2.2.4 Letdown/make-up flow and ECCS injections Letdown flow rate = 0
Make-up flow rate = constant value of 2 kg/s during the all transient in cold leg 2B (water temperature = 315.15 K)
No HPI injection No LPI injection
2.2.5 Threshold set-point values
Pressurizer PORV opening Pressurizer pressure > 15.56 MPa Pressurizer PORV closure Pressurizer pressure < 14.96 MPa Reactor scram Pressurizer pressure > 16.30 MPa
Pressurizer safety valve set-point 17.0 MPa (valve capacity = 86.9 kg/s) Primary pump stop Primary mass (liquid + steam) < 85000 kg
2.3 TMI-2 plant data
General plant geometry is defined according to the Final Report of the OECD/ATMI Benchmark [2.1]. Plant data concerning free volumes of the primary system have been updated according to the Final Specifications of MSLB Benchmark Report [2.2]. Other details on the overall TMI-2 plant layout can be found in Ref. [2.2] if needed.
The radial and axial core discretization is let free to the code user, but the power distribution in the core must be consistent with the radial and axial power profiles given in Section 2.2.1.
2.3.1 Free volumes
Primary system volume without the pressurizer = 288.29 m3
Pressurizer volume = 42.5 m3
Reactor pressure volume = 113.6 m3
2.3.2 Heat transfer with secondary side
SG tubes surface per SG (secondary side) = 12302.5 m2
Number of tubes per SG = 15530
2.3.3 Intact Core Geometry
Main characteristics of the core
Number of fuel bundles of type 15x15 = 177 Active core length = 3.66 m
Total core length = 4.0 m (from core bottom: 0.15 m + 3.66 m (active length) + 0.19 m)
Type of fuel lattice = square, pitch = 0.01443 m Number of fuel rods per assembly = 208
External diameter of fuel rod = 0.0109 m Fuel pellet radius = 0.0047 m
Fuel rod cladding thickness = 0.000673 m Initial core material inventory
UO2 mass = 93650 kg (over the 3.66 m of core active length) Zircaloy mass = 23050 kg
H2 total mass if converted from total zircaloy = 1011 kg (Zircaloy mass / 22.8) AIC mass (Ag + In + Cd) = 2750 kg
2.3.4 Vessel and internal structures
Core baffle internal diameter = 3.28 m Core baffle external diameter = 3.33 m Core barrel internal diameter = 3.584 m Core barrel external diameter = 3.683 m Thermal shield internal diameter = 3.683 m Thermal shield external diameter = 3.753 m Vessel wall internal diameter = 4.36 m Vessel wall external diameter = 4.86 m 2.3.5 Vent valve operation
These valves, between the upper plenum and the top of the downcomer, are designed to avoid a direct loss of water by the hot leg. They should be modeled, as they were shown to have an influence on the transient. Simplified simulation of these valves is defined as follows:
If ΔP > 1724 Pa, the valves are fully open, which corresponds to a total section of 0.794 m2.
If 414 Pa < ΔP < 1724 Pa, the valves are considered partly open, with a cross section area increasing linearly with ΔP.
2.4 Initial TMI-2 plant conditions
2.4.1 Nominal TMI-2 steady-state
The nominal steady-state of the TMI-2 plant is the one defined in the “Pressurizer Water Reactor Main Steam Line Break (MSLB) Benchmark” Final Specifications [2.2]. The nominal values of the main TMI-2 plant parameters for both primary and secondary systems are listed in Table 2.4.
Table 2.4: Nominal TMI-2 steady-state conditions at transient initiation
Parameter Unit TMI-2 steady-state
Reactor core power MW 2772
Pressurizer pressure (dome) MPa 14.96
Temperature hot leg A & B K 591.15
Temperature cold leg A & B K 564.15
Mass flow rate loop A & B kg/s 8800
Pressurizer collapsed level m 5.588
Pressurizer water mass kg 13710
Total primary mass kg 222808 (**)
Steam pressure SG A & B (outlet nozzle) MPa 6.41
Steam temperature SG A & B K 572.15
Riser collapsed level SG A & B m 3.28 – 4.03 (*) Downcomer collapsed level SG A & B m 5.1 – 5.6 (*)
Liquid mass SG A & B kg 13140 – 19210 (*)
Feedwater flow rate SG A & B kg/s 761.1
Feedwater Temperature SG A & B K 511.15
(*) Range of values used by participants in the ATMI Benchmark (**) According to primary volumes in Table 2.5
2.4.2 Primary coolant mass inventory
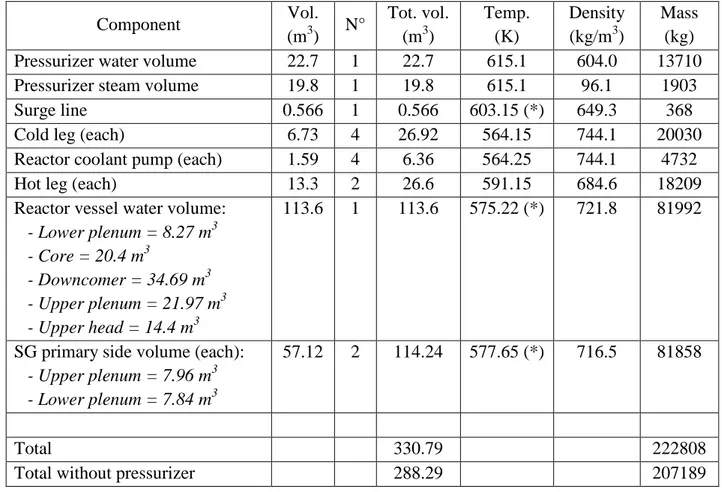
The coolant mass inventory in the primary system has been evaluated according to the primary component volumes defined in Ref. [2.2]. The calculation of the primary mass inventory is illustrated in Table 2.5 below.
Table 2.5: Coolant mass inventory in the primary system Component Vol. (m3) N° Tot. vol. (m3) Temp. (K) Density (kg/m3) Mass (kg)
Pressurizer water volume 22.7 1 22.7 615.1 604.0 13710
Pressurizer steam volume 19.8 1 19.8 615.1 96.1 1903
Surge line 0.566 1 0.566 603.15 (*) 649.3 368
Cold leg (each) 6.73 4 26.92 564.15 744.1 20030
Reactor coolant pump (each) 1.59 4 6.36 564.25 744.1 4732
Hot leg (each) 13.3 2 26.6 591.15 684.6 18209
Reactor vessel water volume: - Lower plenum = 8.27 m3 - Core = 20.4 m3 - Downcomer = 34.69 m3 - Upper plenum = 21.97 m3 - Upper head = 14.4 m3 113.6 1 113.6 575.22 (*) 721.8 81992
SG primary side volume (each): - Upper plenum = 7.96 m3 - Lower plenum = 7.84 m3
57.12 2 114.24 577.65 (*) 716.5 81858
Total 330.79 222808
Total without pressurizer 288.29 207189
(*) Estimated average temperature values
2.5 Core reflooding scenarios
In order to evaluate the ability of emergency core cooling systems to stop the in-vessel core degradation during a severe accident and thus avoid the propagation of the accident through the vessel failure, two different reflooding scenarios have been calculated starting from different core degradation conditions.
The actuation of emergency core cooling system is simulated by starting the HPI injection at the constant flow rate of 30 kg/s of water (T = 40 °C) in the cold legs, which is equal to about 50% of full HPI capacity.
In the first reflooding scenario, the HPI injection is started at the beginning of the core degradation phase, from a slightly degraded core condition, when the core degraded mass is around five tons. In the second reflooding scenario, the HPI injection is started with a delay of 1000 s with respect to the initial scenario, from a highly degraded core condition, when the core degraded mass might amount to several tens of tons.
References
2.1. F. Fichot, O. Marchand, G. Bandini, H. Austregesilo, M. Buck, M. Barnak, P. Matejovic, L. Humphries, K. Suh, S. Paci, “Ability of Current Advanced Codes to Predict Core Degradation, Melt Progression and Reflooding - Benchmark Exercise on an Alternative TMI-2 Accident Scenario”, NEA/CSNI/R(2009)3, July 2009.
2.2. K.N. Ivanov, T. M. Beam, A. J. Baratta, “Pressurised Water Reactor Main Steam Line Break (MSLB) Benchmark”, Volume 1: Final Specifications, NEA/NSC/DOC(99)8, April 1999.
3.
MELCOR calculations
3.1 Brief description of the MELCOR code
MELCOR is a fully integrated, engineering-level computer code able to model the progression of severe accidents in LWR nuclear power plants [3.1]. It is being developed at SNL for the U.S.N.R.C. as a second generation plant risk assessment tool and the successor to the Source Term Code Package. The spectrum of severe accident phenomena, including reactor coolant system and containment thermal-hydraulic response, core heat-up, degradation and relocation, and fission product release and transport, is treated in MELCOR in a unified framework for both BWR and PWR reactors. MELCOR has especially been designed to facilitate sensitivity and uncertainty analyses. The code has been under development since 1982 and the latest version is the 2.1, released in 2008.
Thermal-hydraulic behavior is modeled in MELCOR in terms of control volumes and flow paths. All hydrodynamic material (and its energy) resides in control volumes. Hydrodynamic material includes the coolant and non-condensable gases. These materials are assumed to separate under the influence of gravity within a control volume to form a pool beneath and an atmosphere above. Each control volume is characterized by a single pressure and two temperatures, one temperature for the pool and one for the atmosphere. The control volumes are connected by flow paths through which materials may move without residence time, driven by a momentum equation. Based on the elevations of the pool surfaces in the connected control volumes relative to the junctions with the flow paths, both pool and atmosphere may pass through each flow path. Appropriate hydrostatic head terms are included in the momentum equation for the flow paths, allowing calculation of natural circulation.
The MELCOR COR-package calculates the thermal response of the core and lower plenum structures, including the portion of the lower head directly beneath the core. In addition, the relocation of core materials during melting, slumping, and debris formation are modelled. Fuel pellets, cladding, grid spacers, canister walls, other core structures (e.g. control rods), and particulate debris are modelled separately with individual cells. Cells are the basic nodalization units in the COR-package. All the important heat transfer processes are modelled in each COR cell. Thermal radiation within a cell and between different cells in both axial and radial direction is accounted for, as well as radiation to boundary structures. Radiation to a liquid pool and to steam is also included. Radial conduction across the fuel cladding gap and axial conduction between cells is modelled. Convection to the control volume fluids is simulated for a wide range of fluid conditions and structure surface temperatures, including nucleate and film boiling. Oxidation of Zircaloy and steel is modelled for both the limiting cases of solid state diffusion of oxygen through the oxide layer and gaseous diffusion of steam or oxygen through the mixture. The core degradation model treats eutectic reactions, dissolution reactions, candling of molten core materials and the formation and relocation of particulate debris.
MELCOR calculates both the release and transport behavior of fission products and control rod materials. It tracks the masses of these materials by grouping them into classes. Each material class represents a group of one or more elements or compounds with similar physical properties. Each class has its own set of values of parameters, such as release coefficients and vapor pressure. Aerosols and vapors can deposit directly on surfaces such as heat structures and water pools. In addition, aerosols can agglomerate and settle.
3.2 Reference physical parameters of the code
Main core degradation physical parameters used in the reference calculation with MELCOR are summarized in the Table 3.1. The physical parameters used in the standard calculation of MELCOR in Ref. [3.2] where the default recommended values. In this reference calculation, the default values are modified according to the same values used in the ASTEC calculation.
Table 3.1: Main assumptions on main degradation models for the reference calculation
Parameter MELCOR
Zircaloy oxidation kinetics Urbanic-Heidrick
Cladding failure criteria (with molten material candling)
ZrO2 thickness < 100 µm and Tclad > 2350 K or
Tclad > 2500 K Melting point of UO2-ZrO2
ceramic material
UO2 Tm = 2800 K ZrO2 Tm = 2800 K
Debris formation criteria For other materials than fuel rods: thickness < 100 µm
Fuel rod failure and debris formation when: Tfuel > 2500 K
Molten core relocation into the lower plenum
After failure of grid-supported plate that can initially support fuel assemblies and particulate debris above it. Thus, everything resting on that ring of the plate will fall,
but the plate will remain in place until it melts (1273 K). This event corresponds to failure of the plate portion with
survival of the grid
Reactor pressure vessel failure Failure of the lower head will occur if creep-rupture failure of a lower head segment occurs, in response to
mechanical loading at elevated temperatures
For Zircaloy oxidation, the solid-state diffusion of oxygen through an oxide layer to unoxidized metal is represented by a parabolic rate equation, whose rate constant is evaluate using the Urbanic-Heidrick correlation. For very low oxidant concentrations, gaseous diffusion may limit the reaction rate, and a mass transfer coefficient is calculated via a heat-mass transfer analogy from the heat transfer correlations.
Candling, that is the downward flow of molten core materials and the subsequent refreezing of these materials as they transfer latent heat to cooler structures below, is addressed with a semi-mechanistic model, based on fundamental thermal/hydraulic principles. Relocation of core materials may result in a reduction of area and increase of flow resistance, or even total blocking of flow, within various parts of the core. A model is also implemented for an oxide shell to hold up molten material until the shell is breached. Molten material is held up within a component if the oxide thickness is greater than a critical value hold, if the component temperature is less than a critical value, and if no candling from the component in that cell has yet taken place.
MELCOR contains several simple models that consider the structural integrity and support of intact components, and convert them to particulate debris when either is lost. Most are logical models rather than structural models; no stress calculations are performed for any component other than supporting structure. All components other than fuel rods are immediately converted to particulate debris whenever the unoxidized metal thickness is reduced below a user defined minimum value. The thickness criterion is also used for cladding, which is assumed to support fuel pellets, but other criteria are also considered for fuel rods. Oxidized rods are assumed to retain their identity until they reaches 2500 K, after that they collapse unconditionally.
3.3 Initial TMI-2 plant conditions
3.3.1 Nominal TMI-2 steady-state
The nominal steady-state of the TMI-2 plant is the one defined in the “Pressurizer Water Reactor Main Steam Line Break (MSLB) Benchmark” Final Specifications. The nominal values of the main TMI-2 plant parameters for both primary and secondary systems are listed in Table 3.2. The TMI2 initial conditions are obtained by a steady-state code run lasting 2000 s and starting from plant thermal-hydraulic parameter values close to the ones specified for TMI-2. During the steady-state calculation, some regulations in the primary and secondary sides are activated to facilitate the achievement of stable conditions.
The controlled parameters are:
the pressurizer pressure by turning on the heaters when the pressure is lower than the nominal value;
the pressurizer liquid mass, by water injection or draining, in order to obtain the precise liquid level;
These controls are deactivated during the last 600 s of the steady-state.
The TMI2 plant initial conditions calculated by the MELCOR code are compared with TMI-2 accident data at turbine trip in the table below. The primary circuit conditions are very well reproduced by the code, the larger mismatch being the mass core flowrate which resulted about 3% lower with respect to reference plant parameters.
Table 3.2: Nominal TMI-2 steady-state conditions at transient initiation
Parameter Unit TMI-2 steady-state MELCOR
Reactor core power MW 2772 2772
Pressurizer pressure (dome) MPa 14.96 14.95
Temperature hot leg A & B K 591.15 591.3
Temperature cold leg A & B K 564.15 561.8
Mass flow rate loop A & B kg/s 8800 8600
Pressurizer collapsed level m 5.588 5.56
Pressurizer water mass kg 13710 14200
Total primary mass kg 222808 220300
Steam pressure SG A & B (outlet nozzle) MPa 6.41 6.41
Steam temperature SG A & B K 572.15 570.0
Riser collapsed level SG A & B m 3.28 – 4.03 6.12
Downcomer collapsed level SG A & B m 5.1 – 5.6 7.79
Liquid mass SG A & B kg 13140 – 19210 25938
Feedwater flow rate SG A & B kg/s 761.1 761.1
Feedwater Temperature SG A & B K 511.15 511.15
3.3.2 TMI-2 plant model
The same nodalization used to simulate the first two phases of the TMI-2 accident has been used for these analyses, with proper boundary conditions. Moreover, minor changes were performed with respect to this benchmark, in order to reduce stratification in the primary side and improve heat transfer through steam generators.
The nodalization of the TMI-2 primary system for the MELCOR 1.8.6 code is presented in the Fig. 3.1. Both primary loops (A and B) have been modelled simulating each SGs and considering a single equivalent main pump and cold leg. The secondary system is modelled only up to the main feed and isolation valves, while the SGs were modelled with a high level of detail. The secondary side is connected to an imposed pressure control volume and to a “spill&feed” level control, which assure the desired imposed boundary conditions.
Particular care has also been devoted to core simulation (Fig. 3.2). The core schematization is constituted by five radial rings and twelve axial levels; four thermal-hydraulic levels are used in each ring of the core region, with three core cells axially in each thermal-hydraulic control volume. Radial and axial flow paths in the core region allow for the prediction of 2-D flow patterns. Heat structures representative of the control rod guide tubes and upper tie plate in the upper plenum have been added to the MELCOR model to permit condensation heat transfer and coolant recirculation inside the vessel. The input deck was developed using standard default MELCOR modeling parameters as far as possible, and allows for a complete description of an eventual severe progression of an accidental transient.
The VENT valves are also explicitly modeled between the cold and hot collectors. The plant geometry, the boundary conditions and the accident scenario have been strictly defined according to TMI-2 scenario benchmark specifications.
Figure 3.2: TMI-2 core simulation with MELCOR
3.3.3 Primary mass inventory
The coolant mass inventory in the primary system has been evaluated according to the primary component volumes defined in Ref. [3.3]. The calculation of the primary mass inventory is illustrated in Table 3.3.
Table 3.3: Coolant mass inventory in the primary system Component Vol. (m3) MELCOR (m3) Mass (kg) MELCOR (kg)
Pressurizer water volume 22.7 22.7 13710 14347
Pressurizer steam volume 19.8 19.8 1903 1867
Surge line 0.566 0.9078 368 599
Cold leg 26.92
32.148 20030 24049
Reactor coolant pump 6.36 4732
Hot leg 26.6 24.66 18209 16943
Reactor vessel water volume
- Lower plenum = 16.23 m3 - Core = 21.57 m3 - Downcomer = 25.62 m3 - Upper plenum = 30.16 m3 - Upper head = 13.573 m3 113.6 107.16 81992 75746
SG primary side volume (each)
- Upper plenum = 10.9 m3 - Lower plenum = 10.9 m3
57.12 60.78 81858 86938
Total 330.8 328.9 222808 220489
Total without pressurizer 281.6 207189 204275
3.4 Parameters and results
The chronology of major events calculated by MELCOR is presented in Table 3.4 below and discussed in the following sections.
Table 3.4: Chronology of main events (code output)
Parameter Time (s)
Break opening and total loss of main feedwater 0
Pressurizer PORV opens (P > 15.56 MPa) 14.00
Reactor scram (P > 16.30 MPa) 22.5
Pressurizer PORV closes (P < 14.96 MPa) 27.02
Full steam generator dryout 54.02
Startup of auxiliary feedwater 100.00
Pressurizer is empty 250.0
First fuel rod clad perforation/burst (-)
First clad oxidation 4610
First clad melting and dislocation (also considering control rods) 5850 First molten material slumping in the lower plenum 5890
First ceramic melting and dislocation 6140
Vessel failure 13100
3.4.1 Reference case
Minor differences in the thermal-hydraulic behavior of the primary circuit were detected, with respect to the results obtained in the previous calculation of Ref. [3.2], due to a refinement of primary legs MELCOR model. This modification led to a much similar thermal hydraulic behavior, with respect to results obtained using the ASTEC code, during the earlier phase of the transient. This allowed obtaining a better agreement between MELCOR and ASTEC predictions up to the beginning of the core damage phase. As no injection of cooling fluid is considered during the Reference case, the calculation is stopped at vessel failure time.
Boundary conditions on the SGs secondary side (Figures 3.3 to 3.4) are maintained during the whole transient, by connecting each steam generator secondary side to a control volume with imposed pressure and using a “spill&feed” level control. So, changes in pressure and in liquid level due to steam evaporation/condensation which takes place during the transient are continuously corrected by injecting/spilling saturated steam and water from/to the two controlled source.
The initial feedwater trip and the consequent heat removal through the two steam generators causes the primary pressure to rapidly reach the opening PORV set-point and after about 22 s the SCRAM is actuated. The primary pressure (Fig. 3.5) rapidly approaches saturation as a consequence of the break on the hot leg and remains almost constant at a value of 7.6 MPa up to the trip of the pumps which takes place after 2910 s. Almost at the same time, the break uncovers and pressure starts increasing due to reduced removed power through the steam generators and the break. After 10 minutes the pressure decreases again, due to the beginning of core uncovery, reaching a minimum value of about 6.8 MPa. Finally, primary pressure increases due to lower plate failure followed by a strong interaction of corium with water remained in the lower plenum and finally decreases up to the time of vessel failure.
Formation of void fraction is predicted in the primary system (Fig. 3.6) reaching almost 50% when the main pumps trip, due to the low primary mass. Heat transfer through the two steam generators (Fig. 3.7) is directly correlated to the primary system saturation temperature up to the trip of the main pumps, when heat removal steeply decreases to zero.
The mass of water in the primary system (Fig. 3.8) decreases with an almost constant rate during liquid flowrate through the break. The calculation of break mass flowrate (Fig. 3.9) is performed using RETRAN correlations for choked flow, that is the Moody model for saturated water and the Henry-Fauske model for the subcooled phase. After break uncovering the mass inventory decreases more slowly reaching a minimum value of about 34 tons at the end of the calculation.
The mass flowrate through the two primary loops (Fig. 3.10) is predicted to be rapidly reduced due to void formation inside the primary system. A void degradation factor has been also applied in order to simulate the decrease of pumps head as a function of the void fraction.
The core starts to uncover at 2600 s (Fig. 3.11) as a consequence of the break and pumps trip, while core heatup starts at 3000 s at the core top, because the core decay power is no more removed by natural circulation in the primary circuit. Core level is predicted to reach the bottom of the active fuel after 5700 s since the beginning of the transient and it remains to this level up to the vessel failure.
The temperature in the cold leg (Fig. 3.12) remains at saturation during the first part of the transient and undergoes a steep increase after steam generator emptying. The behavior of the temperature inside the hot leg (Fig. 3.13) is similar, even though higher values of steam superheating are evaluated during core heatup phase.
The fuel rod temperature in the central ring, as evaluated by MELCOR at three different core elevations (Figures from 3.14 to 3.16), shows a steep increase during the oxidation phase. At the bottom of the core, a weaker fuel rod heatup is anyway predicted during the phase where the core level goes to zero.
Fuel rod melting starts just before the main oxidation phase. Melting of control rods materials starts after 5400 s since the beginning of the transient, while Zircaloy starts melting at about 5700 s also causing a partial dissolution of the fuel. The total mass of molten metals is predicted to be about 25 tons (Fig. 3.17), while about 17 tons of debris is predicted to relocate towards the vessel bottom (Fig. 3.18) before the failure of lower supporting plate. Fig. 3.19 shows that most of initially degraded core material reaches the lower plenum; after the failure of lower plate at about 12000 s, almost the whole mass of the core falls into the lower plenum, eventually leading to final vessel failure.
The main oxidation phase takes place (Fig. 3.20) between 4600 s and 7300 s since the beginning of the transient. During this phase almost 417 kg of hydrogen are generated (Fig. 3.21), with a maximum rate of about 0.7 kg/s at 6300 s (Fig. 3.22).
Figure 3.3: Reference case - Steam generator A level
Figure 3.4: Reference case - Steam generator A pressure 0 1 2 3 4 5 6 7 8 0 2000 4000 6000 8000 10000 12000 14000 time [sec] L e v e l [m ] 6300000 6400000 6500000 6600000 6700000 6800000 6900000 7000000 7100000 0 2000 4000 6000 8000 10000 12000 14000 time [sec] Pr e s s u re [Pa ]
Figure 3.5: Reference case - Pressurizer pressure
Figure 3.6: Reference case - Main pumps void fraction 0 2000000 4000000 6000000 8000000 10000000 12000000 14000000 16000000 18000000 0 2000 4000 6000 8000 10000 12000 14000 time [sec] Pr e s s u re [Pa ] 0 0.2 0.4 0.6 0.8 1 1.2 -4000 -2000 0 2000 4000 6000 8000 10000 12000 14000 time [sec] N o d im e n s io n FL-VOID.235 FL-VOID.285
Figure 3.7: Reference case - Steam generator A removed power
Figure 3.8: Reference case - Total primary water mass 0 200 400 600 800 1000 1200 1400 1600 1800 0 500 1000 1500 2000 2500 3000 3500 4000 time [sec] Po w e r [MW ] 0 50000 100000 150000 200000 250000 0 2000 4000 6000 8000 10000 12000 14000 time [sec] Pr im a ry m a s s [k g ]
Figure 3.9: Reference case - Break mass flowrate
Figure 3.10: Reference case - Loop A mass flowrate 0 20 40 60 80 100 120 0 2000 4000 6000 8000 10000 12000 14000 time [sec] Ma s s F lo w R a te [k g /s ] -2000 0 2000 4000 6000 8000 10000 0 1000 2000 3000 4000 5000 6000 7000 8000 9000 10000 time [sec] Ma s s F lo w R a te [k g /s ]
Figure 3.11: Reference case - Core collapsed water level
Figure 3.12: Reference case - Cold leg A temperature
0 0.5 1 1.5 2 2.5 3 3.5 4 0 2000 4000 6000 8000 10000 12000 14000 Time [sec] C o re l e v e l [m ] 500 550 600 650 700 750 800 850 900 950 1000 0 2000 4000 6000 8000 10000 12000 14000 time [sec] T e m p e ra tu re [K ]
Figure 3.13: Reference case - Hot leg A temperature
Figure 3.14: Reference case - Fuel rod temperature at the top of the core 0 200 400 600 800 1000 1200 1400 1600 1800 2000 0 2000 4000 6000 8000 10000 12000 14000 time [sec] T e m p e ra tu re [K ] 0 500 1000 1500 2000 2500 3000 0 2000 4000 6000 8000 10000 12000 14000 time [sec] T e m p e ra tu re [K ]
Figure 3.15: Reference case - Fuel rod temperature at the middle of the core
Figure 3.16: Reference case - Fuel rod temperature at the bottom of the core 0 500 1000 1500 2000 2500 3000 0 2000 4000 6000 8000 10000 12000 14000 time [sec] T e m p e ra tu re [K ] 0 500 1000 1500 2000 2500 0 2000 4000 6000 8000 10000 12000 14000 time [sec] T e m p e ra tu re [K ]
Figure 3.17: Reference case - total mass of molten or relocated metals in the core
Figure 3.18: Reference case - total mass of debris in the core
0 5000 10000 15000 20000 25000 30000 0 2000 4000 6000 8000 10000 12000 14000 Time [sec] M o lt e n m a te ri a l [k g ] 0 20000 40000 60000 80000 100000 120000 140000 0 2000 4000 6000 8000 10000 12000 14000 Time [sec] D e b ri s m a s s [ k g ]
Figure 3.19: Reference case - total mass of core material reaching the lower plenum
Figure 3.20: Reference case - fraction of oxidised Zr
0 20000 40000 60000 80000 100000 120000 0 2000 4000 6000 8000 10000 12000 14000 Time [s] M a s s t o l o w e r p le n u m [ k g ] 0 5 10 15 20 25 30 35 40 45 50 0 2000 4000 6000 8000 10000 12000 14000 time [sec] F ra c ti o n o f o x id is e d Z r [% ]
Figure 3.21: Reference case - Cumulated mass of Hydrogen
Figure 3.22: Reference case - Hydrogen production rate 0 50 100 150 200 250 300 350 400 450 500 0 2000 4000 6000 8000 10000 12000 14000 time [sec] Ma s s [k g ] -0.1 0 0.1 0.2 0.3 0.4 0.5 0.6 0.7 0.8 0 2000 4000 6000 8000 10000 12000 14000 Time (s) H 2 p ro d u c ti o n r a te [ k g ]
3.4.2 Sensitivity case A
In this calculation the actuation of the HPI (15 kg/s of water at 413 K in both cold legs of primary loop B) is assumed to take place after 6300 s since the beginning of the transient, when an amount of about 5 tons of debris is evaluated to be formed as a consequence of core damage.
Of course, the primary pressure (Fig. 3.23) is equal to the Reference case up to HPI actuation, when the strong steaming which follows the interaction between the relatively cold injected water with the lower part of the fuel elements causes a second pressure peak from the value of about 6.8 MPa to a maximum of about 10 MPa. Reflooding of the core finally lead the primary pressure to a constant value of about 6.8 MPa, mainly affected by imposed secondary side pressure.
The void fraction is predicted in the primary system (Fig. 3.24) reaching almost the 50% when the main pumps trip, due to the low primary mass. After pumps trip the void fraction in the cold legs jumps to almost 100 %, up to HPI injection which causes a slightly decrease of this variable in the cold legs of primary loop B where HPI injection takes place.
Heat transfer through the two steam generators (Fig. 3.25) is directly correlated to the primary system saturation temperature up to the trip of the main pumps, when heat removal steeply decreases to zero. HPI injection cause a weak inversion of heat transferred through steam generators up to temperature equilibration between primary and secondary systems.
The mass of water in the primary system (Fig. 3.26) decreases with an almost constant rate during liquid flowrate through the break. After HPI the primary system inventory starts increasing again up to the value of about 110 tons after 8000 s, when water level reaches the break (Fig. 3.27), determining a new steady condition in the plant.
Core uncovering clearly takes place in a very similar way as in the reference calculation, starting at 2600 s (Fig. 3.28) as a consequence of the break and pumps trip. Core level is predicted to reach the bottom of the active fuel after 5700 s since the beginning of the transient, but starts to increase again at 6700 s (400 s after HPI actuation) and the core is completely flooded in about 20 minutes.
The temperature in the cold legs (Fig. 3.29) and in the hot legs (Fig. 3.30) of the primary system is also identical to the Reference case up to HPI injection, after which an effective decrease of temperature up to saturation values is detected.
The fuel rod temperature in the central ring, as evaluated by MELCOR at the upper core elevations (Figures from 3.31 to 3.32), shows a steep increase during the oxidation phase as in the Reference case and the failure condition is reached almost at the same time in both cases. At the bottom of the core, the fuel rod heatup is initially stopped as a consequence of core reflood (Fig. 3.33), but the fuel temperature starts to increase again as fast as before, eventually reaching the failure limit. This unexpected behavior is detected also in the other circumferential rings modeling the core: despite of the gradual inlet of water from the lower plenum to the core, a reduction of heat transfer (probably both convective and radiative) is
predicted in some of the lower axial nodes of the fuel rods. This seems to be due to a drastic decrease of natural circulation of vapor still present in those locations as a consequence of the partial blockage of surrounding flow paths. The mismatch between decay heat still produced inside the fuel rod and removed power causes an increase of void fraction (Fig. 3.34) and a consequent additional degradation of heat transfer. Failure of lower zone of fuel rods leads to the complete relocation of the whole fuel element.
A much larger amount of debris is therefore predicted (almost 100 tons) to relocate towards the lower supporting plate (Fig. 3.35), even though the water injected through the HPI and entering the core is able to maintain the coolability of this material. Even though a partial failure of the lower supporting plate with core material relocation in the lower plenum (Fig. 3.36) is still predicted, the reflooding is sufficient to prevent vessel failure.
The main oxidation phase still takes place (Fig. 3.37) between 4600 s and 7300 s since the beginning of the transient. During this phase almost 380 kg of hydrogen are generated (Fig. 3.38). While the maximum H2 generation rate of about 0.7 kg/s at 6300 s (Fig. 3.39) is similar to the Reference case, the total amount of produced hydrogen is slightly lower due to reflooding which inhibited the steam-metal reaction during the very last phase of this phenomenon.
Figure 3.23: Sensitivity case A - Pressurizer pressure 0 2000000 4000000 6000000 8000000 10000000 12000000 14000000 16000000 18000000 0 2000 4000 6000 8000 10000 12000 14000 16000 time [sec] Pr e s s u re [Pa ]
Figure 3.24: Sensitivity case A - Main pumps void fraction
Figure 3.25: Sensitivity case A - Steam generator A removed power 0 0.2 0.4 0.6 0.8 1 1.2 -4000 -2000 0 2000 4000 6000 8000 10000 12000 14000 16000 time [sec] N o d im e n s io n FL-VOID.235 FL-VOID.285 -50 -40 -30 -20 -10 0 10 20 30 40 50 0 2000 4000 6000 8000 10000 12000 14000 16000 time [sec] Po w e r [MW ]
Figure 3.26: Sensitivity case A - Total primary water mass
Figure 3.27: Sensitivity case A - Break mass flowrate 0 50000 100000 150000 200000 250000 0 2000 4000 6000 8000 10000 12000 14000 16000 time [sec] Pr im a ry m a s s [k g ] 0 20 40 60 80 100 120 0 2000 4000 6000 8000 10000 12000 14000 16000 time [sec] Ma s s F lo w R a te [k g /s ]
Figure 3.28: Sensitivity case A - Core collapsed water level
Figure 3.29: Sensitivity case A - Cold leg A temperature
0 0.5 1 1.5 2 2.5 3 3.5 4 0 2000 4000 6000 8000 10000 12000 14000 16000 Time [sec] C o re l e v e l [m ] 500 550 600 650 700 750 800 0 2000 4000 6000 8000 10000 12000 14000 16000 time [sec] T e m p e ra tu re [K ]
Figure 3.30: Sensitivity case A - Hot leg A temperature
Figure 3.31: Sensitivity case A - Fuel rod temperature at the top of the core 0 500 1000 1500 2000 2500 0 2000 4000 6000 8000 10000 12000 14000 16000 time [sec] T e m p e ra tu re [K ] 0 500 1000 1500 2000 2500 3000 0 2000 4000 6000 8000 10000 12000 14000 16000 time [sec] T e m p e ra tu re [K ]
Figure 3.32: Sensitivity case A - Fuel rod temperature at the middle of the core
Figure 3.33: Sensitivity case A - Fuel rod temperature at the bottom of the core 0 500 1000 1500 2000 2500 3000 0 2000 4000 6000 8000 10000 12000 14000 16000 time [sec] T e m p e ra tu re [K ] 0 500 1000 1500 2000 2500 3000 0 2000 4000 6000 8000 10000 12000 14000 16000 time [sec] T e m p e ra tu re [K ]
Figure 3.34: Sensitivity case A – void fraction in the central-lower part of the core
Figure 3.35: Sensitivity case A - total mass of debris in the core 0 0.2 0.4 0.6 0.8 1 1.2 6000 6500 7000 7500 8000 8500 9000 9500 10000 10500 11000 time [sec] Vo id fr a c ti o n CVH-VOID-T.11 CVH-VOID-T.12 0 20000 40000 60000 80000 100000 120000 140000 0 2000 4000 6000 8000 10000 12000 14000 16000 Time [sec] D e b ri s m a s s [ k g ]
Figure 36: Sensitivity case A - total mass of core material reaching the lower plenum
Figure 3.37: Sensitivity case A - fraction of oxidized Zr
0 10000 20000 30000 40000 50000 60000 70000 80000 90000 100000 0 2000 4000 6000 8000 10000 12000 14000 16000 Time [s] M a s s t o l o w e r p le n u m [ k g ] 0 5 10 15 20 25 30 35 40 0 2000 4000 6000 8000 10000 12000 14000 16000 time [sec] F ra c ti o n o f o x id is e d Z r [% ]
Figure 3.38: Sensitivity case A - Cumulated mass of Hydrogen
Figure 3.39: Sensitivity case A - Hydrogen production rate 0 50 100 150 200 250 300 350 400 450 0 2000 4000 6000 8000 10000 12000 14000 16000 time [sec] Ma s s [k g ] -0.1 0 0.1 0.2 0.3 0.4 0.5 0.6 0.7 0.8 0 2000 4000 6000 8000 10000 12000 14000 16000 Time (s) H 2 p ro d u c ti o n r a te [ k g ]
3.4.3 Sensitivity case B
In the last sensitivity case the actuation of the HPI (15 kg/s of water at 413 K in both primary cold legs) is assumed to take place after 7300 s since the beginning of the transient, when a larger amount of about 20 tons of debris is evaluated to be formed as a consequence of core damage. The results are quite similar to previous sensitivity calculation and therefore in the following only the main differences will be discussed.
The primary pressure (Fig. 3.40) still shows a second pressurization peak following the HPI actuation. The maximum value of the pressure is now slightly higher (11.1 MPa) and also a larger timing is predicted for this peak. Reflooding of the core finally lead the primary pressure to a constant value of about 6.8 MPa, mainly affected by imposed secondary side pressure.
The actuation of the HPI causes a reduction of void fraction in both the cold legs of the primary system (Fig. 3.41) pointing out that, after core reflooding water is able to enter also the cold leg of primary loop A.
Heat transfer through the two steam generators (Fig. 3.42) still shows a weak inversion of heat transferred through steam generators up to temperature equilibration between primary and secondary systems, as a consequence of HPI actuation.
The mass of water in the primary system (Fig. 3.43) decreases with an almost constant rate during liquid flowrate through the break. After HPI the primary system inventory starts increasing again up to the value of about 120 tons after 9700 s, when water level reaches the break (Fig. 3.44), determining a new steady condition in the plant.
Core uncovering takes place in a very similar way as in the previous calculations (Fig. 3.45). Core level is still predicted to reach the bottom of the active fuel after 5700 s since the beginning of the transient, starts to increase again at about 7800 s and the core is completely reflooded in about 20 minutes.
The temperature trends in the cold legs (Fig. 3.46) and in the hot legs (Fig. 3.47) of the primary system is also similar to the previous cases up to HPI injection, after which an effective decrease of temperature up to saturation values is detected.
Relating to the fuel rod temperature in the central ring (Figures from 3.48 to 3.50), a similar behavior with respect to Sensitivity case A is predicted by MELCOR. The explanation of unexpected temperature increase in the lower zone of the fuel elements can be still found in the mismatch between decay heat still produced inside the fuel rod and removed power causes an increase of void fraction (Fig. 3.51) and a consequent additional degradation of heat transfer. Failure of lower zone of fuel rods leads to the complete relocation of the whole fuel element.
The amount of debris predicted to relocate towards the lower supporting plate (Fig. 3.52) and reaching the lower plenum (Fig. 3.53) is comparable with the quantity predicted
during the Sensitivity case A, even though with a slightly different timing. The HPI is anyway able to maintain the coolability of the degraded core.
The main oxidation phase still takes place (Fig. 3.54) between 4600 s and 7300 s since the beginning of the transient. The delay in the HPI actuation causes the generation of 418 kg of hydrogen (Fig. 3.55) as in the Sensitivity case A, while the maximum H2 generation rate is still of about 0.7 kg/s at 6300 s (Fig. 3.56).
Figure 3.40: Sensitivity case B - Pressurizer pressure 0 2000000 4000000 6000000 8000000 10000000 12000000 14000000 16000000 18000000 0 2000 4000 6000 8000 10000 12000 14000 16000 time [sec] Pr e s s u re [Pa ]
Figure 3.41: Sensitivity case B - Main pumps void fraction
Figure 3.42: Sensitivity case B - Steam generator A removed power 0 0.2 0.4 0.6 0.8 1 1.2 -4000 -2000 0 2000 4000 6000 8000 10000 12000 14000 16000 time [sec] N o d im e n s io n FL-VOID.235 FL-VOID.285 -50 0 50 100 150 200 0 2000 4000 6000 8000 10000 12000 14000 16000 time [sec] Po w e r [MW ]
Figure 3.43: Sensitivity case B - Total primary water mass
Figure 3.44: Sensitivity case B - Break mass flowrate 0 50000 100000 150000 200000 250000 0 2000 4000 6000 8000 10000 12000 14000 16000 time [sec] Pr im a ry m a s s [k g ] 0 20 40 60 80 100 120 0 2000 4000 6000 8000 10000 12000 14000 16000 time [sec] Ma s s F lo w R a te [k g /s ]
Figure 3.45: Sensitivity case B - Core collapsed water level
Figure 3.46: Sensitivity case B - Cold leg A temperature
0 0.5 1 1.5 2 2.5 3 3.5 4 0 2000 4000 6000 8000 10000 12000 14000 16000 Time [sec] C o re l e v e l [m ] 500 550 600 650 700 750 800 850 900 950 0 2000 4000 6000 8000 10000 12000 14000 16000 time [sec] T e m p e ra tu re [K ]
Figure 3.47: Sensitivity case B - Hot leg A temperature
Figure 3.48: Sensitivity case B - Fuel rod temperature at the top of the core 0 500 1000 1500 2000 2500 0 2000 4000 6000 8000 10000 12000 14000 16000 time [sec] T e m p e ra tu re [K ] 0 500 1000 1500 2000 2500 3000 0 2000 4000 6000 8000 10000 12000 14000 16000 time [sec] T e m p e ra tu re [K ]
Figure 3.49: Sensitivity case B - Fuel rod temperature at the middle of the core
Figure 3.50: Sensitivity case B - Fuel rod temperature at the bottom of the core 0 500 1000 1500 2000 2500 3000 0 2000 4000 6000 8000 10000 12000 14000 16000 time [sec] T e m p e ra tu re [K ] 0 500 1000 1500 2000 2500 3000 0 2000 4000 6000 8000 10000 12000 14000 16000 time [sec] T e m p e ra tu re [K ]
Figure 3.51: Sensitivity case B – void fraction in the central-lower part of the core
Figure 3.52: Sensitivity case B - total mass of debris in the core 0 0.2 0.4 0.6 0.8 1 1.2 6000 6500 7000 7500 8000 8500 9000 9500 10000 10500 11000 time [sec] Vo id fr a c ti o n CVH-VOID-T.11 CVH-VOID-T.12 0 20000 40000 60000 80000 100000 120000 140000 0 2000 4000 6000 8000 10000 12000 14000 16000 Time [sec] D e b ri s m a s s [ k g ]
Figure 3.53: Sensitivity case B - total mass of core material reaching the lower plenum
Figure 3.54: Sensitivity case B - fraction of oxidised Zr
0 20000 40000 60000 80000 100000 120000 0 2000 4000 6000 8000 10000 12000 14000 16000 Time [s] C o re m a te ri a l to l o w e r p le n u m [ k g ] 0 5 10 15 20 25 30 35 40 45 0 2000 4000 6000 8000 10000 12000 14000 16000 time [sec] F ra c ti o n o f o x id is e d Z r [% ]
Figure 3.55: Sensitivity case B - Cumulated mass of Hydrogen
Figure 3.56: Sensitivity case B - Hydrogen production rate 0 50 100 150 200 250 300 350 400 450 0 2000 4000 6000 8000 10000 12000 14000 16000 time [sec] Ma s s [k g ] -0.1 0 0.1 0.2 0.3 0.4 0.5 0.6 0.7 0.8 0 2000 4000 6000 8000 10000 12000 14000 16000 Time (s) H 2 p ro d u c ti o n r a te [ k g ]
3.5 Final remarks
The results obtained using the MELCOR 1.8.6 code in the simulation of a reference severe accident scenario with prescribed boundary conditions have been presented and analyzed. This exercise follows a similar activity promoted by NEA 30 years ago to assess the capacity of current codes to predict severe accidents. In order to allow for a comparison with other codes results, a reference severe accident scenario, starting with a small break LOCA with prescribed boundary conditions was defined. The transient is supposed to take place in a plant similar to the TMI-2 reactor and a model of the primary system of this plant was set up for MELCOR. Moreover some parameters allowing for judging the quality of the predicted results were proposed, in order to assess the quality of the code results and the effect of the code user.
The same nodalization used to simulate the first two phases of the TMI-2 accident has been used for this benchmark, with proper boundary conditions. Moreover, minor changes were performed with respect to this benchmark, in order to reduce stratification in the primary side and improve heat transfer through steam generators. Particular attention was devoted to the modelling of the primary vessel, in order to allow natural circulation flows, which TMI-2 evidence showed as extremely important in the correct simulation of core degradation. A refinement of the primary system model has been set up in order to obtain a better agreement with the results showed in a previous comparison with the ASTEC code. The goal was to investigate the severe phase of the transient, starting from similar physical conditions and time histories. Also, for the degradation phase particular care was devoted to choose similar conditions and models for the two codes.
A sensitivity analysis has also been performed aimed to investigate the effect of a delayed actuation of HPI (something similar to actual TMI accident) on the core damage progress and vessel integrity.
Some weaknesses of the MELCOR code have been identified in this context. During the initial phase of core reflooding an unexpected increase of the temperature of the lower zone of the fuel rods is predicted and the failure limit is reached with a subsequent relocation of the fuel rod towards the core supporting plate. The COR package of MELCOR contains several simple models that consider the structural integrity and support of intact components, and convert them to particulate debris when either is lost. Most are logical models rather than structural models; no stress calculations are performed for any component other than supporting structure. Complex debris formation mechanisms, such as quench-induced shattering, have not been implemented into the COR package at this time.
The reason of the predicted degradation is due to an insufficient rewetting of the fuel rods, along with a contemporary degradation of natural circulation flows due to partial blockage of core flow paths. In spite of this larger core damage, the actuation (even with a larger delay) of the HPI assures the safe removal of decay heat from the debris, preventing any damage to the primary vessel.
![Figure 3.4: Reference case - Steam generator A pressure 0123456780200040006000800010000 12000 14000time [sec]Level [m]63000006400000650000066000006700000680000069000007000000710000002000400060008000100001200014000time [sec]Pressure [Pa]](https://thumb-eu.123doks.com/thumbv2/123dokorg/5610616.68134/25.892.123.770.648.1042/figure-reference-case-steam-generator-pressure-level-pressure.webp)
![Figure 3.6: Reference case - Main pumps void fraction 0200000040000006000000800000010000000120000001400000016000000180000000200040006000800010000 12000 14000time [sec]Pressure [Pa]00.20.40.60.811.2-4000-2000020004000600080001000012000 14000time [sec]No dim](https://thumb-eu.123doks.com/thumbv2/123dokorg/5610616.68134/26.892.126.770.649.1042/figure-reference-case-main-pumps-void-fraction-pressure.webp)
![Figure 3.10: Reference case - Loop A mass flowrate 0204060801001200200040006000800010000 12000 14000time [sec]Mass Flow Rate [kg/s]-200002000400060008000100000100020003000400050006000700080009000 10000time [sec]Mass Flow Rate [kg/s]](https://thumb-eu.123doks.com/thumbv2/123dokorg/5610616.68134/28.892.122.778.660.1007/figure-reference-flowrate-flow-rate-mass-flow-rate.webp)
![Figure 3.16: Reference case - Fuel rod temperature at the bottom of the core 050010001500200025003000020004000600080001000012000 14000time [sec]Temperature [K]0500100015002000250002000400060008000100001200014000time [sec]Temperature [K]](https://thumb-eu.123doks.com/thumbv2/123dokorg/5610616.68134/31.892.126.763.654.1041/figure-reference-case-fuel-temperature-core-temperature-temperature.webp)


![Figure 3.31: Sensitivity case A - Fuel rod temperature at the top of the core 0500100015002000250002000400060008000100001200014000 16000time [sec]Temperature [K]0500100015002000250030000200040006000800010000120001400016000time [sec]Temperature [K]](https://thumb-eu.123doks.com/thumbv2/123dokorg/5610616.68134/40.892.125.768.647.1041/figure-sensitivity-case-fuel-temperature-core-temperature-temperature.webp)


