Development of an optomechanical measurement
system for dynamic stability analysis
Simone Pasinetti
Dept. of Information Engineering(DII) University of Brescia
Brescia, Italy [email protected]
Matteo Lancini
Dept. of Mechanical Engineering(DIMI) University of Brescia
Brescia, Italy [email protected]
Viviane Pasqui
Institut des Systèmes Intelligentset de Robotique (ISIR) UPMC University
Paris, France [email protected]
Abstract—The paper presents the development of a measurement system for dynamic stability analysis. The system is composed of an actuation device, that is a robotic platform with four degrees of freedom, and two measurement systems: a force platform, to measure the position of the centre of pressure (COP), and a vision system, to measure the position of the centre of mass (COM).
The purpose of the system is to provide means to identify whether a subject behaves like an inverted pendulum (as the literature predicts for static posturography), when a dynamic perturbation is applied. This can be achieved by generating a movement of the robotic platform and, simultaneously, by measuring COP and COM trajectories and verify their coherence with the inverse pendulum model.
Keywords—measurement system, dynamic posturography, force platform, vision system, centre of mass, centre of pressure
I. INTRODUCTION
The human balance function is a complex mechanism that involves in particular the nervous system. Diseases of the nervous system affect the structures involved in equilibrium with a consequent reduction of the capacity of controlling gait and balance.
Doctors have clinical tests and instrumentation tools to characterize the instability [1]. The most used is the so called stabilometry or static posturography, which tests the balance from the position of the center of pressure (COP) of the subject while he is standing on a force platform [2]. An inverted pendulum mechanical model could be used to approximate the standing subject’s oscillations [3] which result in the displacement of the COP around the antero-posterior axis (Y axis) and around the medial-lateral axis (X axis). As described in [3], when the subject behaves like an inverse pendulum, there is a relation between the COP and the center of mass (COM), that follows the equation presented in (1):
• •
⋅
⋅
h))
COM
(W
/
(I
-COM
=
COP
(1)where I is the moment of inertia of the body (without the feet) around the ankle joint, W is the body weight and h is the COP height. Thus, the characterization of the balance of the subject is made through the study of COP position and COM position and acceleration.
The sensitivity of static posturography can be increased by increasing the oscillations of the COP: the subject can be placed in conditions of unstable equilibrium or stability limit. Thus, dynamic posturography is a technique that allows the analysis of the ability of a patient to maintain or regain balance in a series of tests in which a destabilization action is applied (either a rotation or translation of the platform on which the patient is standing). Dynamic postural analysis is intrinsically linked to the perturbation used.
Most of the indices used to describe postural balance start from the hypothesis that the subject behaves like an inverse pendulum, but in dynamic situations this has not yet been proven true. For this, assessing whether the inverse pendulum model is valid during dynamic posturography or not, is critical.
This paper presents a new system for the analysis of the validity of the inverse pendulum model and for dynamic posturography measurements. Using an actuation system to generate the perturbations, and collecting information from two different measurement systems to measure the COP position and the COM position and acceleration simultaneously, the relation between COP and COM could be easily analyzed and the inverse pendulum hypothesis can be validated.
II. THE MEASUREMENT SYSTEM
The system is composed of three different apparatus as an actuation system to generate the perturbations and, thus, the dynamic environment, and two measurement systems (a force platform and a vision system) to analyze the instantaneous COP and COM positions.
A. The moving platform
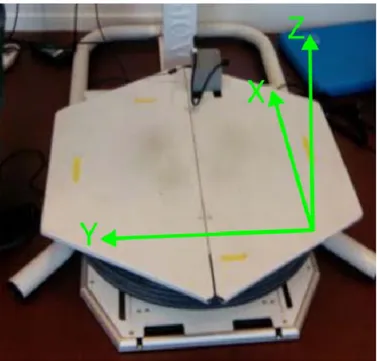
The actuation system is composed by a moving platform (figure 1) called Isimove, developed by the Laboratory of Intelligent Systems and Robotics (ISIR), Paris, France [4].
Fig. 1. The robotic device used to create the perturbations and the dynamic environment
The robot has four different degrees of freedom:
1. rotation along the sagittal plane (around the X axis) with a maximum amplitude of ±15° and a maximum speed of 15°/s;
2. rotation along the frontal plane (around the Y axis) with a maximum amplitude of ±15° and a maximum speed of 15°/s;
3. rotation along the traversal plane (around the Z axis) with a maximum amplitude of ±120° and a maximum speed of 75°/s;
4. translation along the sagittal plane with a maximum amplitude of ±120 mm and a maximum speed of 250 mm/s.
The robotic platform is 900 mm in length and 800 mm in width to give the user a sense of comfort and safety, and to easily and safely recover his balance with a step in case of falling risk. The platform maximum load is 120 kg.
The platform movements are generated with 4 electric stepper motors which are controlled using a closed loop architecture. To transfer the motion from the motors to the platform a set of different cables and pulleys (fixed and not) was used.
The platform can be controlled using ramp, triangular or sinusoidal laws of motion. Each degree of freedom can be controlled either independently or simultaneously. The position accuracy varies between 0.5% and 6.5% at a speed of 15°/s [4].
B. The force platform
The COP position was measured using a pressure sensor matrix platform (Matscan, Tekscan) placed directly between the robotic moving platform and the subject’s feet (figure 2).
Fig. 2. The force platform used to measure the instantaneous position of the centre of pressure (COP)
This force platform has a measurement range from 0 to 862 kPa and a total of 2288 sensors (52 for each column and 44 for each row). The distance between each sensor defines the measurement accuracy, which, for our system, is 83 x 10-3 mm.
The COP position is measured computing the weighted average of the pressures measured by each sensor. During the acquisition, a color map shows the areas with major and minor pressures and the instantaneous COP position (figure 3).
C. The vision system
The kinematics of the subject was measured with a maker-based vision system (figure 4) composed by two triangulating devices (Coda-CX1, Coda Motion).
Each device acquires the infrared light emitted from each marker using three different cameras, allowing the system to compute its position even with a single device. Nonetheless, in our application we use two devices to increase the measurement accuracy and to reduce the presence of marker occlusions.
Fig. 3. Example of force platform acquisition: the colors show the pressure of each foot on the standing surface. The COP position is computed with a weighted average on the pressures measured by each sensor
Fig. 4. Picture of one of the two devices Coda-CX1 used by the vision system for the COM measurement
We chose to use an active vision system (with an infrared light emission from each marker) instead of a passive vision system (with no light emission) to increase the measurement accuracy and to permit a real-time data processing.
A calibration procedure was also performed, including both devices and the force platform, to measure positions with respect to a single, shared, fixed reference system. The accuracy of the vision system in the measurement of the markers positions was 0.05 mm for the X and Y axes, and 0.3 mm for the Z axis.
The markers were placed over the analyzed subject, as described in following paragraphs.
D. Experimental set-up
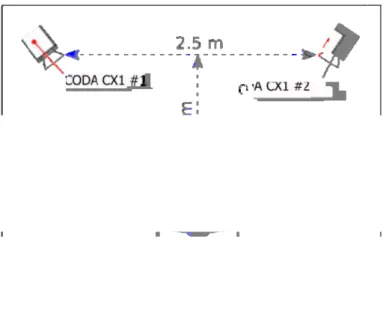
Figure 5 shows the experimental set-up used for our application.
Fig. 5. The experimental set-up used in our application. The figure shows the position of the vision system, the force platform and the robotic platform
During each test the subject goes on the force platform, which is placed on the robotic platform, with the two cameras placed behind him. The markers are placed on the posterior side of the subject to reduce the presence of marker occlusions during the tests.
Since the two measurement systems were independent, their data were synchronized using a hardware trigger: a push button simultaneously starts the data acquisition of both the vision system and the force platform. The data acquisition is stopped after a fixed time period which is chosen before each test and depends on the type of the test.
The data acquisition rate was 50 Hz for both the vision system and the force platform.
E. The measure of the centre of mass (COM)
A simplified model was used to estimate the COM position, composed of rigid segments representing feet (2), legs (2), thighs (2) and trunk. Figure 6 shows the position of the markers placed on the subject to identify those segments and measure the resulting COM.
The COM can be computed from the marker positions as a weighted average of the COMs of each of the 7 model segments [3], as in (2).
¦
=⋅
=
7 1 i i im
COM
COM
(2)where M is the total body mass, mi is the mass of the i-th segment, and COMi is the center of gravity of the i-th segment, computed from the marker position.
Fig. 6. Segmental model used for the measure of the COM position. Red circles represent the markers position used to compute the COMi,while
TABLE I. SEGMENTS COMI AND MASS FRACTION FOR THE MODEL USED
FOR THE MEASURE OF COM POSITION
Segment i Mass fraction COMi
Foot (2) 0.02 0.5 Toe+0.5 Heel Leg (2) 0.04 0.433 Knee+0.567 Heel Thigh (2) 0.1 0.433 Hip+0.567 Knee
Trunk 0.68 0.636/3 HipR + 0.636/3 HipC + 0.636/3 HipL + 0.374Head
Total 1
The location of the estimated COMi of each segment and the mass fraction of each segment are shown in Table 1.
III. RESULTS
A. Measurement protocol definition
Figure 7 shows an example of a COM and COP position measurement using the developed system during a sample test. The measurement protocol defined for the sample test is the following:
1. Stance phase, from 0 s to 13 s: the subject stands on the force platform with the robotic platform stopped. This is the case of static posturography. 2. Perturbation phase, from 13 s to 26 s: the subject
stands on the force platform and the robotic platform moves with a triangular law of motion (velocity equals to 20 °/s and maximum amplitude of ±15 °) around the Z axis. This is the case of dynamic posturography.
Both in static and dynamic conditions the COM and the COP positions were acquired simultaneously and correctly. During the dynamic phase, the COM and COP displacements increase due to the perturbation generated by the robotic platform.
B. Inverse pendulum validation: a case study
The validation of the inverse pendulum hypothesis has been performed by comparing the COP position measured by the optomechanical system and the COP position estimated from the measurement of the COM position, using (1).
Fig. 7. Example of COM (red line) and COP (blue line) position (in the frontal plane) acquired using the developed measurement system during a 26 s sample test
Fig. 8. Difference between the estimated COP position and the measured COP position during the test performed on a healthy subject.
For this purpose, the equilibrium of one single healthy subject (male, age 27, weight 74 kg, height 175 cm) was acquired and analyzed using the measurement protocol defined in the previous section. Measured and estimated COP positions were then compared and their difference was analyzed. Figure 8 shows the results.
The figure highlights different behaviors: during the stance phase, i.e. when the robotic platform is stopped, the difference between the estimated COP and the measured COP is compatible with zero. This means that the estimated COP and the measured COP assume compatible values. On the other hand, during the perturbation phase, i.e. when the robotic platform moves, the difference between estimated and measured COPs is not compatible with zero, i.e. values of the measured COP position are different with respect to those of the estimated COP position. This means that the inverse pendulum model is not suitable to describe the real behavior of the instantaneous COP position.
From these results, we could affirm that, when perturbations occur, the inverse pendulum model is not valid to accurately describe the stability of the subject. In this case, more sophisticated models must be used to obtain a good COP position prediction.
IV. CONCLUSIONS
This paper presents a new system for dynamic stability analysis. It consists in an actuation device, which is a robotic moving platform to create the dynamic environment, and two independently measurement systems, synchronized thanks to a hardware trigger: a force platform for the measurement of the COP position and a vision system for the measurement of the COM position.
With this system the instantaneous and simultaneous measurement of the subject's COP and COM could be performed and the hypothesis that the subject behaves like an inverse pendulum both in static and dynamic conditions could be studied and validated.
The authors would like to thank Prof. F. Docchio of University of Brescia for suggestions and carefully reading of the manuscript.
REFERENCES
[1] Mancini, M. & Horak, F. B. “The relevance of clinical assessment tools to differentiate balance benefits”, European Journal of Physical and Rehabilitation Medicine, 2010, 46, 239-248.
[2] Bizzo, G.; Guillet, N.; Patat, A. & Gagey, P. M. “Specifications for building a vertical force platform designed for clinical stabilometry”, Medicine and Biological Engineering and Computing, 1985, 23, 474-476. [3] Winter, D. A.; Patla, A. E.; Prince, F.; Ishac, M. & Gielo-Perczak, K.
“Stiffness control of balance in quiet standing”, Journal of Neurophysiology, 1998, 80, 1211-1221.
[4] Kharboutly, H.; Ma J.; Benali A.; Thoumie P.; Pasqui V. & Bouzit M. “Design of multiple axis robotic platform for postural stability analysis”, IEEE Transaction on Neural Systems and Rehabilitation Engineering, 2015, 23-1, 93-103.