Sommario
1. Introduction ... 3
2. The n_TOF facility and the experimental setup ... 5
3. Neutron Flux measurements and evaluation ... 6
4. Samples ... 7
5. Detectors resolution and calibrations ... 8
6. Determination of Weighting functions ... 9
7. Background characterization ... 11
8. Time-of-flight to energy calibration ... 14
9. Normalization and beam interception factor ... 15
10. Quality assessment and discussion on uncertainties ... 18
11. Resonance Shape Analysis of the experimental data ... 20
11.1 n+155Gd ... 21
11.2 n+157Gd ... 26
11.3 Statistical properties of neutron resonances ... 31
11.4 Summary and Results at Thermal ... 34
12. New resonances for 155Gd and 157Gd. ... 35
13. Conclusions ... 40
14. Acknowledgments ... 40
1. Introduction
“Burnable poisons” are very important in the neutronic balance and the safety features of Light Water Reactors (such as PWRs, BWRs, or VVERs) of 2nd and 3rd Generation, because they play a crucial role for their very high thermal neutron-capture cross sections, higher than the thermal neutron-fission cross section of 235U.
Gadolinium isotopes are important because they allow to increase the fissile material percentage in fuel rods without any impact on the reactor safety. In fact, as soon as the fuel in the FAs is burnt during the operation of a given reactor, both 235U and burnable poisons are depleted so that the compensating effect of the poisons is neutralized at a point in the cycle of the fuel at which the remaining amount of fissile material can be controlled easily and safely by other available means.
Gd odd isotopes are also used to better estimate the s.c. “residual reactivity penalty” which is foundamental for evaluating the time a given FA can be used at full power. Accurate predictions of the burning rate of odd-Gd isotopes are important in the forecast of the appearance of the FA reactivity peak and its intensity. In turn, these two parameters are of utmost importance in the assessment of the criticality safety margins for the storage of partially burnt fuel inside Spent Fuel Pools (SFPs) of reactors, especially during postulated loss-of-coolant or loss-of-cooling accidents at these storage facilities.
Moreover for CANDU reactors, Gd-odd isotopes are used to reduce or eliminate risks due to criticality in the form of nitrate mixed in the heavy water moderator.
The necessity of a complete review of the Gadolinium-155 and -157 cross sections was fully illustrated in previous works of the same working group [1-3].
Against this background, ENEA proposed a new measurements of Gadolinium neutron-capture cross sections in the framework of the CERN n_TOF Collaboration, in which ENEA participates as official member.
In 2015, a formal Proposal [4] was submitted by ENEA and INFN to the CERN ISOLDE and n_TOF Committee with the aim of performing neutron-capture cross section measurements of 155Gd and 157Gd isotopes between thermal energy and 1 MeV. The proposal was accepted, and it was allocated a dedicated beam time at the CERN n_TOF facility for the experiment to be perfomed in the Summer 2016.
Several research institutions expressed interest in this activity: University of Bologna – Department of Physics and Astronomy (Italy), Commissariat à l’Energie Atomic (CEA - France), European Commission – Joint Research Center – Geel (Belgium) and Paul Sherrer Institute (PSI - Switzerland), while statements of interest arrived also from Institute de Radioprotetion et Sûrété Nucléare (IRSN - France), Oak Ridge National Laboratori (ORNL- USA) and Brookhaven National Laboratory (in the person of Said Mughabghab).
After the approval of the CERN Scientific Commettee, 4 high-purity Gd samples in metallic form with a cross contamination of the two isotopes of less than 1.13% were acquired by Oak Ridge National Laboratories early in 2016. All samples had the same dimension, and were prepared as discs of 1 cm of radius.
The measurements were performed between June and July 2016 in the first experimental area (EAR1) of the CERN n_TOF facility, using the Time-of-Flight (TOF) technique and were carried out with an array of four fast hydrogen-free liquid scintillation detectors specifically designed for the detection of gamma rays produced in the de-excitation of the compound nucleus formed just after the neutron-capture event.
Preliminary studies, carried out before the submission of the proposal, showed that the cross section for both isotopes drops by several orders of magnitude going above 0.1 eV. As a consequence, a unique sample for each odd isotope could not be used to perform the measurement in the whole energy range of interest. In particular to avoid problems related to sample self-shielding, very thin samples needed to be used in order to measure the cross sections near thermal energies, while above 1 eV thicker samples had to be used in order to obtain a good signal-to-background ratio, and to collect the necessary statistics in a reasonable time [4].
In addition to the four Gadolinium samples, ancillary measurements had to be performed for different purposes: normalization to absolute cross section values and background estimation. Therefore during the experimental campaign, a Gold sample (197Au) was used for normalization purposes, while a Graphite and a Lead samples were used to study the different type of background in EAR1. Moreover, black resonance filters (Ag, Co, W, Cd) positioned along the flight path were used to determine the energy dependence of the background; they were chosen thick enough that the neutron beam was completely absorbed at the energies of the largest resonances.
This documents follows two others ones [2, 3]: the first one is devoted to the explanation of the scientific justification for a re-evaluation of the neutron capture cross sections of Gd even and odd isotopes; the second one describes the details of the experimental campaign.
In this document we present the post - processing and data analysis for the capture cross section measurements which followed the experimental campaign and the final results obtained which pefectly match the requirements and the constraints of the kick-off proposal submitted to the International n_TOF Collaboration in the 2015.
In this last work, results of the measurements on 157Gd and 155Gd, with the results of a temptative resonance analysis above the resolved resonance region, are detailed. The capture cross sections of 155Gd and 157Gd at neutron kinetic energy of 0.0253 eV have been estimated to be 62.2 ± 2.2 kb and 239.8 ± 9.3 kb respectively [5, 6] thus up to 6% different relative to the ones reported in the nuclear data libraries.
A resonance shape analysis has been performed in the resolved resonance region up to 180 eV and 300 eV, respectively, and average resonance parameters have been found in good agreement with evaluations. Above these energies the observed resonance-like structures in the cross section have been tentatively characterised in terms of resonance energy and area up to 1 keV.
2. The n_TOF facility and the experimental setup
The pulsed neutron beam at n_TOF is produced by spallation of 20 GeV/c protons from the CERN Proton Synchrotron accelerator on a water-cooled Pb target. The pulsed neutron source is used together with a moderation system, so that the n_TOF neutron beam covers about eleven orders of magnitude in energy from thermal to GeV, with an intensity of the order of 2x10¹⁵ neutrons/pulse.
The innovative features of the n_TOF neutron beam derive from the special characteristics of the primary proton beam coming from the CERN Proton-Synchrotron (PS):
• a high momentum of 20 GeV/c, corresponding to the maximum attainable energy within a magnetic cycle of 1.2 s of the PS;
• a high peak current of 7x10¹² protons per bunch, with a width of 7 ns (rms);
• a low duty cycle of 0.5 Hz, which corresponds to up to six bunches per supercycle (typically 16.8 s long).
Pulses are produced with a slightly varying frequency of about 1 Hz, thus preventing the overlap of slow neutrons from a bunch to another one. The energy resolution ∆En/En (∆E being the full width at half maximum), is of the order of 3.2×10⁻⁴ at 1 eV and 5.4×10⁻⁴ eV at 1 keV (more details in Refs. [7] and [8]); therefore it is smaller than the natural width of neutron resonances in Gd up to about En = 250 eV. On the other hand, the Doppler effect largely dominates the experimental broadening: FWHM is about 6, 150, 300 and 600 meV at En= 0.02, 12.5, 50 and 200 eV respectively.
A technical description of the n_TOF facility was provided in the previous dedicated Technical Reports [2-4].
The 155Gd(n,γ) and 157Gd(n,γ) capture measurements were performed at the 185 m measurement station of the neutron time-of-flight facility n_TOF at CERN, using an array of 4 C6D6 detectors. The enriched gadolinium samples used were in the form of self-supporting metal discs. Since the capture cross section for both isotopes drops by several orders of magnitude for neutron energies higher than 1 eV, two samples (thin and thick) for each isotope were used to properly perform the measurement in the whole energy range of interest [4].
The measurements were performed using an array of four deuterated benzene (C6D6) liquid scintillation detectors (volume of about 1 liter) specifically developed for neutron-capture measurements [9]. They were placed face to face at 90° with respect to the beam and about 10 cm away from the sample.
These detectors, instead of more typical organic liquid scintillators containing hydrogen, avoids the neutron capture by Hydrogen with consequent emission of a 2.2 MeV gamma-ray. Moreover thanks to the minimization of the amount and composition of the support structure (made of Carbon fiber), are particularly suited and widely used for high resolution (n,γ) measurements at time-of-flight facilities. These detectors are used with the total energy detection principle in combination with the so called Pulse Height Weighting Technique (PHWT), see for instance Ref. [3] and references therein.
As regard the data acquisition, the system used in Gd measurements consisted of 14 bit flash ADC channels of TELEDYNE SP-Devices. These devices are equipped with an on-board memory of 512 MB per channel and can record digitized signals for 100 ms corresponding to all neutron energies down to 18 meV for EAR1. During the experimental campaign, 4 channels for the C6D6 signals at a sampling rate of 1 GSample/s and 4 channels for the flux detectors with a sampling rate of 62.5 MSample/s were used.
3. Neutron Flux measurement
Neutron flux is defined as the number of neutrons per incident proton pulse integrated over the full spatial beam profile arriving at the experimental hall with a given energy. Its absolute value and energy distribution as well as the associated uncertainties are essential for the analysis of cross section data obtained via the time of-flight technique. In fact, the accuracy with which the neutron flux is determined may indeed become the limiting factor in the accuracy achievable in a cross section experiment and therefore must be improved as much as possible. Moreover, every contribution to the overall accuracy has to be carefully taken under control, in order to meet the tight constraints of the Proposal for Gd isotopes.
High precision and high accuracy measurement of the flux results from a combination of dedicated measurements performed with different detectors, based on different neutron cross-sections which can be considered as a reference in a well definined energy range. These reaction cross cression are referred to as neutron standard [10]. The procedure for the characterization of the neutron flux in a wide energy range is described in detail in Ref. [11].
During the Gadolinium campaign a large effort has been devoted to minimize all the possible sources of uncertainties, both systematic and statistical, in particular on the energy dependence of the neutron flux.The flux was measured by the so-called silicon monitor (SiMON) detector which is based on the 6Li(n,t)α standard and consist of a 600 µg/cm2 LiF foil in the beam, viewed by 4 silicon detectors (5 cm x 5 cm x 300 µm) positioned out of the beam [12].
Such a configuration makes the SiMON apparatus almost transparent to neutrons. The thickness of the 6Li deposit is the best compromise between the need for the highest counting rate and the best identification of triton and alfa particle coming from the neutron interaction within the lithium foil. For instance, the LiF foil absorbs less than 1.4% of thermal neutrons passing through it, moreover the reduction of the incoming neutron beam decreases with increasing neutron energy and becomes negligible (neutron transmission > 99.5%) for neutron energies higher than 0.2 eV.
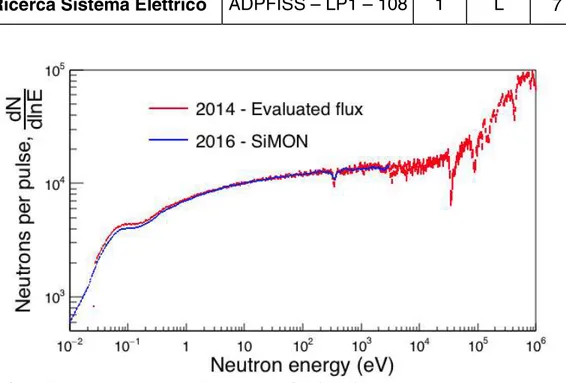
Fig. 1 shows the energy distribution of the neutron flux at the sample position, for the nominal proton bunch of 7×10¹² protons, for the 2014 evaluated flux and for the current experimental campaign.
Fig. 1Overall comparison between the evaluated flux (2014) and the measured one during 2016 Gd campaign by means of SIMON detectors. Figure from Ref. [5, 6].
The latter flux was extracted using SiMON detectors and is shown up to En = 3 keV, region where no sizable correction for non-isotropic emission of the reaction products is required.
Above 1 eV the two curves agree within uncertainties, since the shape of the neutron flux is determined by the collimation system (which was not changed).
However, in the energy region below 1 eV, a systematic effect as a function of the energy is clearly visible with the deviation reaching 9% near thermal. This behavior is consistent with a 7% increase of the concentration of boric acid in the moderator circuit with respect to 2014.
The 2016 neutron flux, with 100 bins per decade, has been determined within 1% uncertainty between thermal and 200 eV.
The uncorrelated uncertainties, attributable to counting statistics, start to play a major role at higher energies. Therefore, in order to avoid statistical fluctuations due to reduced statistics, the evaluated flux was used above 200 eV.
4. Samples
Cross section measurements require samples as isotopically pure as possible in order to avoid any biases attributable to contamination (i.e. presence of different isotopes within the samples). The samples used in the experimental campaign for the new evaluation of neutron capture cross section of isotopes were acquired from National Isotope Development Center (NIDC) of the Oak Ridge National Lab (ORNL).
All the samples are circular in shape with a radius of 1 cm in order to cover the same fraction of the neutron beam with the aim of minimizing the effect of the so-called Beam Interception Factor (BIF1) on the mesurements.
1 The so-called Beam Interception Factor (BIF) is the fraction of the neutron beam intercepted by the sample aligned along the flight path. The choice of using samples having the same geometry and
In order to avoid saturation of the capture yield due to self shielding and perform measurements near the thermal energy region very thin samples were used. Moreover, for the characterization of the structure above 1 eV thicker samples for both isotopes were used in order to guarantee for a good signal-to-noise ratio. All samples have a very low cross contamination (less than 1.3%), in order to minimize the contribute to capture coming from contaminants of the samples.
Samples were shipped in an airtight underpressurized cask, so at the beginning of the experiment they were extracted from it with the maximum care in order to avoid damages because they are extremely fragile and need to be handled with maximum care.
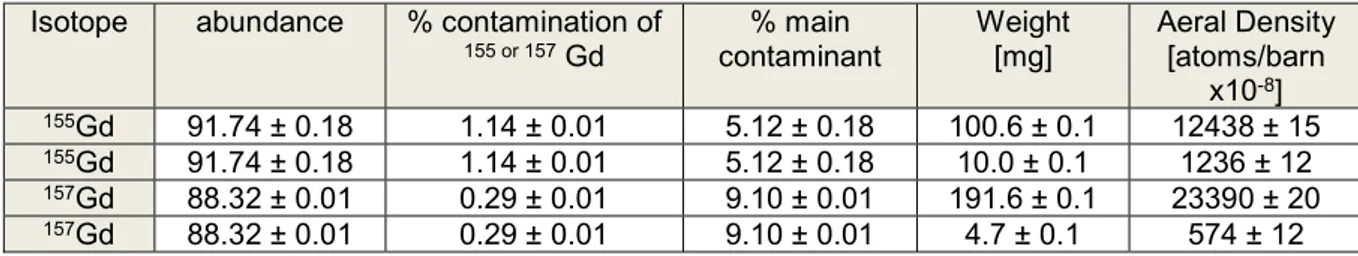
Isotope abundance % contamination of 155 or 157 Gd % main contaminant Weight [mg] Aeral Density [atoms/barn x10-8] 155Gd 91.74 ± 0.18 1.14 ± 0.01 5.12 ± 0.18 100.6 ± 0.1 12438 ± 15 155Gd 91.74 ± 0.18 1.14 ± 0.01 5.12 ± 0.18 10.0 ± 0.1 1236 ± 12 157Gd 88.32 ± 0.01 0.29 ± 0.01 9.10 ± 0.01 191.6 ± 0.1 23390 ± 20 157Gd 88.32 ± 0.01 0.29 ± 0.01 9.10 ± 0.01 4.7 ± 0.1 574 ± 12
Table 1. Characteristics of the Gd samples used during the experimental campaign. Data from Ref. [5, 6].
At the beginning of the experimental campaing they were weighted and sandwiched between two Mylar foils (~ 6µm) in order to avoid oxidation and centered in an annular frame that allows the correct positioning along the line during irradiation.
The Mylar foils were stretched with a specific tool and then glued to the frames. At the center of each frame the samples were positioned using a very small drop of glue. Samples were centered using a jig and a hollow metallic cylinder aligned with the annular frame. A cylinder made of Teflon was used to drive the samples in the hole, so ensuring the correct positioning at the center of the annular frame.
Moreover, in order to verify that the drops do not interfere with the measurements, evaluations of that impact were done performing measurements with an exact replica of the frame without the Gd samples, but using the same quantities of glue needed to arrange each sample in the center of each frame. These evaluations based on specific measurements performed in EAR1 demonstrate that the glue drops have no impact on the measurements done.
5. Detectors resolution and calibrations
With the aim of obtaining high accuracy cross section data, the experimental setup has been carefully characterized, with particular care taken over the stability and the
dimensions complies with the need of avoiding further normalizations which are of particular importance when the area of the sample being measured is smaller than the neutron beam profile.
performance of the detectors. The stability of the detector response, mostly related to the gain of the photomultipliers, has been routinely verified from measurements with standard γ-ray sources, namely the 137Cs (Eγ = 0.662 MeV), 88Y (Eγ = 0.898 MeV and Eγ = 1.836 MeV), and the composite Am-Be (Eγ = 4.44 MeV) and Cm-C (Eγ = 6.13 MeV) sources.
The energy spectra of γ-ray sources were recorded more than once per week and did not reveal a gain shift higher than 0.7%. Fig. 2 shows spectra obtained with the Yttrium source. A reliable calibration of the detectors is an important task in the data analysis, because of the modification of the detector response by means of the PHWT. The calculation of the weighting factors, indeed, depends on the discrimination level applied to the energy deposited spectra. For this reason, particular care was taken to determine the experimental resolution as a function of γ-ray energy and energy calibration of the detectors. The procedure followed to achieve this objective consisted of (i)
Fig. 2 Calibrated amplitude spectra for 137Cs, 88Y, Am-Be and Cm-C standard sources. The black lines correspond to the simulated spectra convoluted with the energy resolution, the red dots are the experimental data. The inset shows the 88Y spectra measured during the gadolinium experimental campaign. Figure from Ref. [5, 6].
6. Determination of Weighting functions
The total-energy detection system was adopted for the evaluation of the neutron capture cross-section in the resonance region. The measurements were performed with 4 H-free deuterated C6D6 in combination with the so-called Pulse Height Weighting
Technique (PHWT). Such a detectors are characterized by a very low detection efficiency and covers small-solid angle in order to fullfill the requirements of the technique.
The combination between C6D6 detectors and the adopted technique ensures proportionality of the γ-ray detection efficiency to the corresponding γ-ray energy total radiative energy emitted by the decay of the compound nucleus formed during the capture process.
The required proportionality is achieved artificially modifying the detection efficiency so to make it independent of both the cascade path and the energy of a particular gamma-ray being detected.
A mathematical procedure based on a weighting function WF(Ed), Ed being the energy deposited by a γ ray guarantee that its convolution with the pulse height distribution of the capture spectrum proportional to the total energy released.
The description of the detection system response was calculated by means of a high detailed GEANT4 Monte Carlo simulation of the experimental apparatus [13]. The response of the detection system has been studied as a function of the γ-ray energy. In the MC simulation, the γ rays were considered as emitted from the sample according to the Gaussian xy distribution of the neutron beam profile, uniformly in z direction with z axis being the direction of the neutron beam. Then the final detector response was obtained by convoluting the simulated response with a Gaussian function that represents the detector resolution. The final detector response can depend on the γ-ray transport in the detection assembly, and it strongly depends on the sample thickness and strongly affects measuremts at low neutron energy.
The γ-ray transport in the sample also depends on high values of the product nσtot, where n is the areal density in atoms/barn and σtot is the total cross section. This is, for instance, the case of saturated resonances.
Under this condition, a spatial distribution with exponential shape along z for the emitted γ ray in the sample was assumed instead of the homogeneous one. This exponential distribution was used for the extraction of the normalization factor through the saturated resonance technique on the 4.9 eV resonance in 197Au and for the gadolinium samples for energies below 1 eV.
The uniform one, instead, was used for the resonance shape analysis, as well as to weight the background counting rate.
The weighting function WF(Ed) was parameterized with a polynomial function by minimizing the difference between the weighted response and the corresponding γ-ray energy for a number of energies in the range of interest.
The discrimination level was fixed to 150 keV and 10.0 MeV, corresponding to the Compton edge of γ-ray energies of 285 keV and 10.3 MeV, respectively. The upper threshold exceeds the neutron separation energies of 156Gd (Sn = 8.54 MeV), 158Gd (Sn = 7.94 MeV) and 198Au (Sn = 6.51 MeV) to take into account the resolution broadening of the scintillator detectors. It is well-known that the loss of cascade γ-rays attributable to the electron conversion process should be considered for a careful estimation of the uncertainty related to the PHWT.
The Monte-Carlo DICEBOX algorithm [14] was used to simulate the gamma capture cascades and estimate this effect. This new method for simulation of nuclear γ cascades by the Monte Carlo technique is based on the extreme statistical model and other simplifying assumption. It makes possible to generate artificially individual events of the γ-cascade decay of neutron capturing states in heavy nuclei with the complete decay scheme taken from existing experimental data below certain critical energy, Ecrit.
The data comes from literature [15 - 17] for 156,158Gd, and the reference 198Au to adjust the Ecrit for each isotope so ensuring the completeness of the decay scheme.
Above Ecrit the statistical model, in terms of Level Density (LD) and a set of Photon Strength Functions (PSFs) for different transition types, was adopted to generate individual levels and their decay properties.
The LD and PSFs models and their parameters were taken from [18 - 20] for 156,158Gd and 198Au, respectively. DICEBOX computes the contribution of internal electron conversion using parameters from the BrIcc database [21] for all transitions above Ecrit and for those transitions below Ecrit where the experimental information about internal electron conversion is lacking.
From this study the uncertainty on the normalization of the capture data was assessed. The relative uncertaitnty was estimated to be be less than 1.5% and was propagated to the final uncertainty.
7. Background characterization
As in all neutron time-of-flight facilities, particular care has to be taken in understandng the diferent sources of background. For capture reactions, different contribution can affect the capture cross-section measurement. In general it is necessary to take into account:
Sample Out background. This contribution is estimated with the beam on but without samples in the beam, and it counts all the sources of background present in the experimental area not directly related to the sample itself. We studied also if the canning of the sample, made of Al and kapton, affected the measurement, and their contribution was found to be negligible. It is a sample-related neutron background and depends on the neutron sensitivity of the detectors. Neutrons scattered by the sample can in fact be later captured, or undergo inelastic reactions in the material of the detector and experimental area.
γ-rays produced in this way cannot be distinguished from capture events in the sample. C6D6 scintillators used during the experiemntal campaign are optimized to
minimize this source of background, which could be very significative because of the magnitude of elastic cross section with respect to the capture one.
In-beam γ rays. This background is due to γ rays travelling along the neutron beam and detected by scintillators after Compton scattering or pair production on the sample. These two processes have cross sections that depends on Z and Z2 respectively, and therefore to evaluate this contribution a measurement on a sample
with a negligible capture cross-section and a charge number as similar as possible to gadolinium was needed. To this purpose a natPb sample was used.
Beam Off background. It is the only time independent source of background and takes into account natural radioactivity and air activation. By definition, it can be evaluated measuring the counts detected by scintillators when the beam is off.
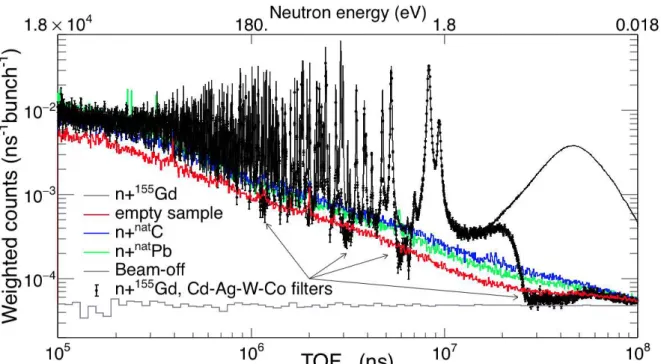
In Fig. 3, the measured time-of-flight (TOFm) spectra, used to estimate these background components, are showed together with the TOFm spectrum for the thick 155Gd sample for comparison.
The first background component has been evaluated with the empty-sample holder in the beam, thus accounting for any beam-related effect not linked to the presence of a sample.
The second source of background is attributable to γ rays originating from
FIG. 3 Weighted C6D6 time-of-flight spectrum of the thick 157Gd sample, together with background
measurements. The measurement with filters was scaled by 15% in order to match the resonance peaks at ∼ 2 eV. Figure and data from Ref. [5, 6].
sample-scattered neutrons thermalized and captured in the surrounding materials. It was evaluated with a measurement of the carbon sample placed in the beam. Its areal density was between 180 and 7400 times larger than the ones of gadolinium samples. From previous measurements and studies, it is known that this component is relevant below about 100 eV (TOFm >∼ 1.34x10⁶ ns) but overestimates the background at very low energy because of the activation of the sample [22].
The third background component, mainly 2.2 MeV and 0.48 MeV in-beam γ rays from neutron capture in the Hydrogen and Boron of the moderator, respectively, was estimated by a measurement with the natural lead sample (between 30 and 1200 times thicker than Gd samples). This kind of background contributes significantly in the
energy region above 300 eV (TOFm >∼ 7.7x10⁵ ns). Its time distribution results from the combination of the neutron slowing-down process in the moderator and the flight path length. The fourth background component, related to ambient radioactivity and activation of the materials inside the experimental area was estimated with a beamoff measurement. The background attributable to the activation of the sample is negligible because the activation products are 156Gd and 158Gd isotopes, which are stable. The figure reports also the 155Gd(n,γ) measurement with black-resonance filters in the beam to determine the energy dependence of the background. A black resonance, by definition, removes all the neutrons from the beam so that all the counts left can be only related to background. In particular Cd, Ag, W and Co filters were chosen as they are characterized by large s-wave resonances which ensure that the transmission of neutrons for well definined energy values (0.3, 5.2, 18.8 and 132 eV) is approximately zero.
As showed in Fig. 3, all neutrons with energy below 0.3 eV were removed from the beam by the cadmium filter.
As the presence of the filters has an effect on both the neutron beam and the background, the filter dips in the time-of-flight spectrum underestimate the background level. In first approximation, an estimation of the correction was obtained by scaling the spectrum measured with filters so as to reproduce the 2 strong resonances near 2 eV in the 155Gd spectrum.
Applying a correction of 15%, the spectrum with filters matches the empty sample measurement in the thermal-neutron energy region.
Fig. 4. Weighted C6D6 time-of-flight spectrum of the thin 155Gd sample, together with background
measurements. Figure from Ref. [5, 6].
Fig. 4 shows the C6D6 background measurements compared with the signals resulting from the measurement with the thin 155Gd sample. As expected, the signal to background ratio is much less favourable, for instance at 2 eV it is about 200 and 30 for thick and thin samples respectively.
The figure also clearly shows the expected matching between the lowest parts of deeps caused by black resonance filters and the empty-sample measurement.
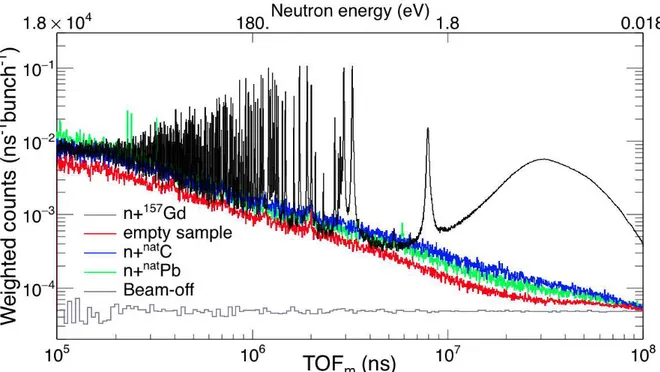
In summary, the empty sample-measurement satisfactory represents the background level in the energy range of interest. As showed in Fig. 5, similar evaluation was repeated for the thin and thick 157Gd(n,γ) measurements and resulted in the same conclusion.
Fig. 5 Weighted C6D6 time-of-flight spectrum of the thick 157Gd sample, together with background
measurements. Data from Ref. [5, 6].
It is worth mentioning that at thermal neutron energy (TOFm ≈ 85µs) the signal to background ratio for the thin gadolinium samples was 7.6 and 10 for 155Gd and 157Gd respectively.
8. Time-of-flight to energy calibration
The kinetic energy was calculated from the velocity of neutrons, but in order to obtain a high-quality values, it is fundamental to reproduce the propagation time of neutrons inside the target assembly.
In fact, the stochastic process of moderation inside the neutron-producing target and in particular in the moderation system, strongly affects the energy distribution of neutrons. As a result, the measured resonance profile are broadened and the measured cross section has to be corrected for this effect.
This experimental effect was taken into account in the resonance analysis (described in Section 11) by means of a suitable resolution function. While this can be studied experimentally by means of some wellknown, isolated resonances in the cross section of neutron induced reactions, a more systematic analysis can only rely on Monte Carlo simulation, provided that they are proven reliable.
It is worth recalling that the broadening in time introduced by the moderation process strongly depends on the dimensions and materials constituting the neutronproducing target.
A convenient way of expressing the effect of the moderation time is to convert into an equivalent moderation length (En), by multiplying it with the velocity of the neutron when exiting the spallation target assembly.
Fig. 6 (En) distribution obtained by MC simulation. The distribution only slightly varies with neutron energy around the value of 19 cm, so the kinetic energy was extracted with a recursive procedure which converged after few iterations. Figure and data from Refs.[5, 6].
The geometrical (i.e. energy independent) value of L0 = 183.92 ± 0.08 m resulted from a minimization procedure adopting the well-known low-energy resonances of 197Au retrieved from JEFF-3.3 evaluation [23] is consistent with the nominal value of 183.94 m obtained with the least square adjustment.
9. Normalization and beam interception factor
In capture experiments, the experimental observable is the fraction of neutron beam which interacts with the sample under analysis and generates signals in the C6D6
detectors.
This physical observable reffered to as capture yield Y(En), from which it is possible to
obtain the quantity of interest.
𝑌(𝐸 ) =
𝑁
𝑆 + 𝐸 +
𝐴 + 1
𝐴
𝐶 − 𝐵
𝜑 + 𝑓
(𝐸 )
where N is a normalization factor independent of the neutron energy 𝑆 is the neutron separation energy of the compound nucleus, A is the mass number of the target nucleus, 𝐵 is the weighted background, 𝜑 is the neutron fluence and 𝑓 is the correction factor taking into account the variation of the fraction of the neutron beam intercepted by the target as a function of the neutron energy.
The normalization factor N was determined with the so-called saturated resonance method based on the 4.9-eV resonance in n+197Au. The Au capture yield was analized with the R-matrix code SAMMY [24] and the N value was extracted with an uncertainty attribuitable to counting statistic of less of 0.1%.
The beam interception factor BIF can be considered constant within less than 1.5% in the energy region between En = 1 eV and 100 keV, and shows slight variation up to 1 MeV [7]
As discussed in Refs. [5] and [6], the beam profile has a gaussian distribution with standard deviation of about 6 mm, determined mainly by the collimation system. Below 1 eV, Monte Carlo simulations and previous n_TOF experiments have demonstrated that a correction factor, fBIF, is required for taking into account the modification of the spatial distribution of the beam profile.
Unfortunately, the correction is extremely sensitive to sample misalignements and small changes in the collimation system which cannot be fully controlled and therefore implemented in MC simulations from which only qualitative information could be drawn. In addition also gravitational force plays a sizable role for very low-energy neutrons, because the vertical displacement is 3.5 cm for neutrons of 25 meV, after traveling for 185 m. For these reasons the correction can be as high as 20%, representing a great issue to overcome in order to fullfill the requirements imposed in the current proposal. In this analysis, an empirical method was used for the correct estimation the beam interception factor at very low energies. It sounds similar to the saturated resonance technique (i.e. the product of the areal density and cross section is high enough for all incident neutrons to interact with the sample), and it is based mainly on self-shielding instead of multiple scattering.
More in details, the expected capture yield can be expressed as:
𝑌(𝐸 ) = 1 − 𝑒
( )𝜎 (𝐸 )
where n is the areal density of the sample (see Table 1), σtot is the total cross section, σγ is the capture cross section and Ym accounts for the contribution of capture events following at least one neutron scattering in the sample.
In the case of the thick 155Gd and 157Gd samples, nσtot(En) is so high that the calculated transmission of neutrons through the samples is less than 10−3, and the ratio of elastic to capture cross section is less than 10−2, for neutron energies below 0.07 and 0.1 eV, respectively.
In the considered energy region, the capture yield for thick gadolinium samples is consequently expected to be Y=1.
With consideration of all the above, any departure of the measured capture yield from unity was ascribed to a variation of the beam interception factor, as illustrated in Fig. 7, where the experimental 155Gd(n,γ) and 157Gd(n,γ) capture yields are compared to their expected values based on the resonance parameters in the ENDF/B-VIII.0 evaluation.
In the inset of the figure, the energy region where the empirical fBIF was extracted is highlighted.
FIG. 7. (Color online) Capture yield of the thick gadolinium samples measured in this work and comparison with the expected capture yield calculated on the basis of the cross sections in ENDF/B-VIII.0 library. The region between En = 0.02 and 0.05 eV, linked to the correction for the variation of the beam interception factor, is shown in the inset. FIgure from Ref. [5, 6].
The two sets of data are very similar, confirming the presence of a common effect. The empirical correction factor was then used to correct the capture yields of the thin gadolinium samples and the gold one.
10.
Quality assessment and discussion on uncertainties
In order to fullfill the cogent requirements of the proposal, the uncertainty on the cross section at low energy has to be as much low as possible.
In the region of interest the uncorrelated uncertainties are negligible, since the involved cross sections are very high and consequently the counting statistics is not the issue, but the correlated uncertainties dominate the total uncertainty. They come from different sources such as: Normalization, PHWT, background determination and subtraction, sample characterization and neutron flux shape.
In addition, in the energy region below En=1 eV the uncertainty due to the correction for the beam interception factor has also be considered.
The uncertainty related to the weighting function is important in this case, since the gadolinium capture data were normalized to the gold data.The γ-ray spectra are known to be different for Gadolinium and Gold compound nuclei, hence the value of the detector threshold might contribute to the uncertainty. From a systematic study of missing -rays in the case of 155Gd, 157Gd and 197Au attributable to the detector threshold a bias of 0.6% was estimated. In addition a similar study of the effect of electron in the 3 cases resulted in a systematic effect of 0.6%. As this corrections are small and rely on model calculations, the capture yield was not correct for them. From these results we assigned un uncertainty on the normalization of 1.5%.
To better investigate and bring the uncertainty of PHWT under control, we performed the data analysis by using:
linear and quadratic amplitude to deposited energy calibration;
different detector threshold of 150, 175 and 200 keV and corresponding weighting functions;
7 different weighting functions calculated with an exponential attenuation in the direction of the neutron beam according to different values of nσtot. Data analysis demonstrated that the ratio between the experimental yields never always remain below 1.5%. Moreover, systematic effects due to sample positioning with respect to the detection system and the neutron beam were minimized.
In fact, samples, which were shipped in an airtight under-pressurized cask (to avoid oxidation) were sandwiched between two Mylar foils and centered in an annular frame that allows the correct positioning along the line during irradiation. The Mylar foil were stretched with a specific tool and then glued to the frames.
At the center of each frame the samples were positioned using a very small drop of glue and centering was guaranteed using a micrometric positioning system based on a jig and a hollow metallic cylinder aligned with the Al annular frame.
In order to verify that the drops do not interfere with the measurements to be done, evaluations of that impact were done performing measurements with frames in absence of Gd samples but using the same quantities of glue needed to arrange each sample in the center of each frame. These evaluations based on specific
measurements performed in EAR1 demonstrated that the glue drops have no impact on the measurements [3].
At thermal neutron energy the uncertainty attributable to the background subtraction is 1.5% for 157Gd and 2% for 155Gd (the signal to background ratio is 7.6 and 10 respectively), whereas in the resonance region it depends on the resonance strength. For the estimation of the uncertainty of the shape of the neutron flux, we adopted an uncertainty of 1%, as discussed in Ref. [7].
The uncertainty on the correction of the beam interception factor was estimated by analyzing the capture yield of 197Au(n,γ), since its cross section is a standard at thermal energy [10]. In addition the cross section near thermal energy is characterized by the 1/v behavior and therefore the knowledge of the capture yield at thermal energy constraints the shape of the capture yield at higher energies as well.
FIG. 8. (Color online) 197Au(n,γ) capture yields (multiplied by E 1/2 ) with and without the correction for the variation of the beam interception factor and comparison with the expected capture yield calculated on the basis of the cross sections in JEFF-3.3 library. Figure from Ref. [5, 6].
In Fig. 8 two experimental 197Au(n,γ) capture yields are showed together with the expected capture yield based on the JEFF-3.3 evaluation.
The two data sets differ by applying the correction for the beam interception factor. It is evident that near thermal energy (highlighted in the inset) the expected capture yield is reproduced within 1-2% when the correction is applied. In particular, the average deviation between the present data and the expected capture yield in the region 0.02 ≤ En ≤ 0.1 eV is 0.985 with a root mean square of 0.06. From this evidence an uncertainty of 2% was estimated for the beam interception factor. Very thin samples
can suffer from inhomogeneity because of the preparation procedure. The provider claimed an uncertainty in the uniformity better than 10%.
To constrain this possibly large uncertainty, we have compared the results of the resonance shape analysis for strong resonances as observed in the capture yields of thin and thick samples. For both pairs of samples the results were consistent within 1%, hence the uncertainty in the uniformity can be accounted for as a part of the Sample mass uniformity.
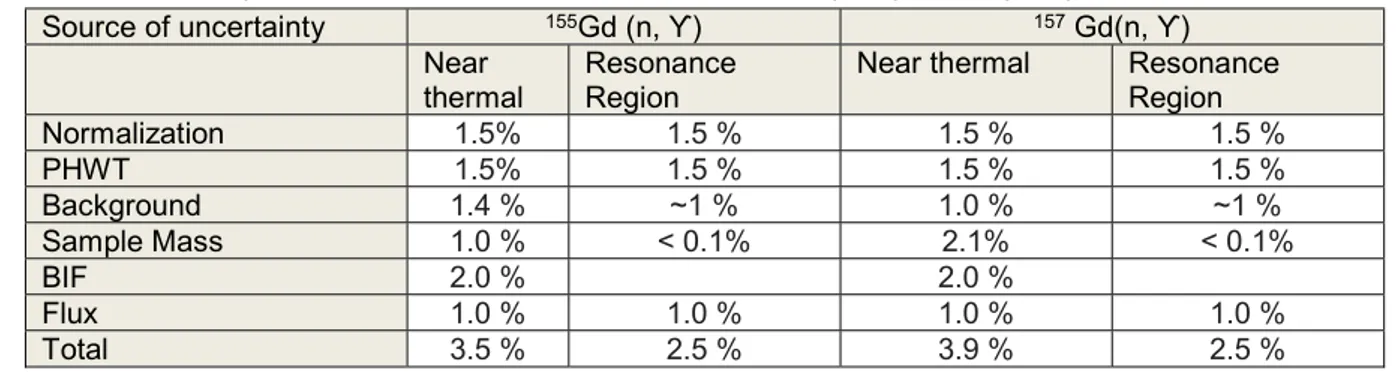
This comparison was also the confirmation that the uncertainties summarized in Table 2 can be considered as the full uncertainty of the present measurements.
TABLE 2: Summary of the correlated uncertainties in the 155Gd (n, ϒ), 157Gd (n, ϒ). Table from Refs. [5,
6].
11.
Resonance Shape Analysis of the experimental data
The capture yields were analyzed with the R-Matrix analysis code SAMMY, using the Reich-Moore approximation. Corrections for experimental conditions such as Doppler and experimental broadening, self-shielding and multiple neutron interactions in the sample (i.e. multiple scattering) were taken into account by the code. In particular, the response of the spectrometer derived from the Monte Carlo simulations (showed in Fig. 6) was implemented in SAMMY by using the user defined resolution function option. The thermal motion of gadolinium atoms inside the sample was taken into account by means of the free-gas model with a temperature of 296 K, which was the temperature registered during the experimental campaign.
The resonance parameters and the scattering radius from the ENDF/B-VIII.0 library were adopted as the initial values of a fitting procedure. The scattering radius as well as the spin and parity of the resonances were not changed, because the capture data are not sensitive enough to these quantities.
In the analysis, the resonance energy and both Γn and Γγ were varied because the improvement in the χ2 value of the fit was substantial with respect to the case where only one parameter (either Γn or Γγ) was allowed to vary and the other was fixed to the
Source of uncertainty 155Gd (n, ϒ) 157 Gd(n, ϒ) Near
thermal Resonance Region Near thermal Resonance Region
Normalization 1.5% 1.5 % 1.5 % 1.5 % PHWT 1.5% 1.5 % 1.5 % 1.5 % Background 1.4 % ~1 % 1.0 % ~1 % Sample Mass 1.0 % < 0.1% 2.1% < 0.1% BIF 2.0 % 2.0 % Flux 1.0 % 1.0 % 1.0 % 1.0 % Total 3.5 % 2.5 % 3.9 % 2.5 %
ENDF/B-VIII.0 value. Since the spin assignments in the evaluations are sometimes inconsistent and do not take into account recent results, in particular the ones in Ref. [19], g Γn, g being the statistical spin factor, is reported in this work since its value is independent of the spin of the resonance.
For energies below 0.5 eV, only the data obtained with the thin samples were used. A simultaneous resonance shape analysis of both data obtained with thin and thick sample was performed up to 5 eV, while above this energy, only the data obtained with the thick samples were used.
Nevertheless, as already mentioned above, few strong resonances in the energy region up to 60 eV were used to cross-check the capture data obtained with the thin samples.
The results of the resonance shape analysis were used to reconstruct the cross section and in particular to evaluate the thermal cross section σ0 = σγ(E0) for E0 =0.0253 eV. In addition, the cross section determined using the resonance parameters has been convoluted with a Maxwellian neutron energy distribution to obtain the so called Maxwellian-averaged cross section:
𝜎 (𝐸)
𝐸
𝐸
𝑒
⁄𝑑𝐸
∫
𝐸
𝐸
𝑒
⁄𝑑𝐸
The ratio of the latter quantity for thermal energy E0=0.0253 eV to the thermal cross section, also referred to as the Westcott factor, was also calculated. It allowed us to evaluate the non-1/v behavior of the capture cross section (i.e. the Westcott factor significantly different from unit). It is worth to mention that for the calculation of the Maxwellian-averaged cross section, the cross section as a function of the neutron energy was extracted from the resonance parameters deduced in the present analysis. Therefore no bound states have been used.
The resolved resonance region (RRR) in nuclear data libraries such as ENDF7B-VII.0, JEFF-3.3 and JENDL-4.0 are limited in the energy range below 330 eV for n+157Gd and below 180 eV for n+155Gd. The present data clearly show structures well above these energies (see below). These resonances have been analyzed assuming they are s-wave resonances with an average Γγ deduced from the resonances in the RRR. Their energy and capture kernel, defined as g Γγ Γn /(Γγ + Γn ) are reported in the following paragraphs.
11.1 n+155Gd
The capture cross section of 155Gd at thermal energy does not vary signicantly among libraries. It ranges between 60.735 to 60.890 kb. From the present data a slightly higher but consistent thermal cross section was deduced σ0 = 62.2 ± 2.2 kb. The resulting Westcott factor is 0.86 ± 0.04.
In the resolved resonance region, differences are present in evaluated nuclear data files.
Moreover, two recent time-of-flight measurements present inconsistencies. In particular, for a number of resonances, the measurement of Leinweber [25] and collaborators sizeably disagrees with the ENDF/B-VIII.0, while the measurement by Baramsai and collaborators [19] tends to confirm the resonances parameters in ENDF/B-VIII.0.
Examples of some of the largest differences between the present data and the evaluations are showed in Fig. 9.
FIG. 9. 155Gd(n,γ) capture yield from the present work compared to the expected capture yields, calculated on the basis of the cross sections in ENDF/B-VIII.0, JEFF-3.3 and JENDL-4.0 nuclear data libraries. Figure from Ref. [5, 6].
They also confirm the good energy resolution of the present data, able to better resolve some doublets, such as the structures at En = 33 or 93 or 96 eV. It is worth noticing that weak resonances could be attributable to multiple scattering in the nearby resonances rather than genuine resonance as quoted in ENDF/B-VIII (see for instance Fig. 21 in Ref. [26] about this possible effect).
The presence of small structures at 43.43, 54.81, 62.12, 68.98 and 76.19 eV reported in JEFF-3.3 and 17.81 and 68.81 eV reported by Baramsai and collaborators [19], cannot be excluded on the basis of present data. Finally, the resonance reported by Leinweber and collaborators [25] at En = 131.7 eV is also observed in the present measurement with the thick 155Gd sample.
The results of the resonance shape analysis are summarized in Table 3. The correlation coefficient between partial widths ρ (Γγ, Γn) resulting from the SAMMY fit is also reported.
Table 3: Resonances in 155Gd(n,γ). Uncertainties from the fit. Table from Ref. [5, 6]. Energy
[eV] Γγ g Γn ρ (Γγ, Γn) Capture Kernel [meV] 0.0268(0) 104.570 0.0644 0.0643 2.0128(2) 111.5(6) 0.1350(4) 0.46 0.1348(4 2.5730(1) 103.1(2) 1.037(1) -0.17 1.021(1) 3.618(2) 123(6) 0.0141(4) 0.64 0.0141(4 6.3062(2) 103.9(5) 1.331(3) 0.07 1.304(3) 7.7490(4) 102.4(8) 0.697(3) 0.33 0.689(3) 10.000(2) 99(4) 0.105(2) 0.60 0.105(2) 11.507(1) 104(4) 0.217(3) 0.61 0.216(3)
11.9729(7) 107(2) 0.650(4) 0.52 0.644(4) 14.4851(6) 102(5) 1.233(6) 0.28 1.195(6) 17.733(2) 92(5) 0.234(5) 0.53 0.233(5) 19.8790(6) 107(1) 2.76(1) 0.25 2.65(1) 20.9902(4) 120.9(1) 7.24(2) -0.12 6.61(2) 23.602(1) 137(7) 1.87(1) 0.50 1.84(1) 27.519(3) 96(6) 0.403(9) 0.54 0.399(8) 29.528(1) 112(3) 2.95(3) 0.57 2.83(3) 30.0702(7) 109(2) 6.89(3) 0.27 6.26(3) 31.674(3) 93(6) 0.66(1) 0.47 0.66(1) 33.047(3) 121(8) 0.89(2) 0.64 0.89(2) 33.464(5) 103(9) 0.54(2) 0.48 0.52(2) 34.758(1) 114(4) 2.46(2) 0.38 2.34(2) 35.408(2) 107(6) 1.21(2) 0.57 1.19(2) 37.067(2) 139(4) 2.90(2) 0.31 2.75(2) 38.937(2) 99(7) 0.63(1) 0.46 0.62(1) 43.868(1) 121(8) 6.52(5) -0.15 6.06(4) 46.006(3) 121(8) 1.32(3) 0.51 1.30(3) 46.806(2) 98(4) 3.44(3) 0.37 3.26(3) 47.64(1) 98(10) 0.20(1) 0.20 0.20(1) 51.290(2) 139(4) 7.58(6) 0.13 6.61(6) 52.041(1) 101(4) 7.74(6) 0.01 6.42(6) 52.918(7) 124(11) 0.843) 0.48 0.83(3) 53.639(2) 99(4) 5.09(5) 0.17 4.70(4) 56.130(4) 110(8) 1.36(3) 0.38 1.33(3) 59.321(2) 112(5) 4.20(5) 0.21 3.97(4) 62.751(2) 126(5) 4.82(5) 0.21 4.54(5) 64.06(3) 124(12) 0.14(1) 0.06 0.14(1) 65.17(2) 111(18) 0.35(2) 0.25 0.35(2) 69.459(3) 123(7) 3.77(6) 0.35 3.74(5) 76.835(8) 103(10) 0.95(3) 0.32 0.93(3) 77.60(2) 112(11) 0.37(2) 0.15 0.37(2) 78.761(7) 124(10) 2.64(5) 0.32 2.56(5) 78.9(2) 120(12) 0.10(1) 0.10 0.095(9) 80.70(1) 111(10) 0.88(3) 0.14 0.88(3) 83.980(4) 109(7) 3.67(7) -0.05 3.67(6) 84.916(9) 113(10) 1.27(4) 0.32 1.27(4) 90.53(1) 111(11) 0.75(3) 0.21 0.74(3) 92.44(1) 105(10) 1.48(7) 0.26 1.45(7) 92.89(1) 96(9) 1.80(8) 0.29 1.75(7) 93.94(3) 111(11) 0.31(2) 0.07 0.31(2) 95.710(8) 117(11) 2.37(7) 0.37 2.30(7) 96.403(9) 106(10) 2.41(8) 0.25 2.27(7) 98.302(4) 98(7) 7.4(1) -0.52 7.40(9) 100.21(2) 130(13) 0.74(4) 0.14 0.73(4) 101.35(1) 120(12) 1.38(5) 0.33 1.35(5) 101.99(2) 95(10) 0.83(4) 0.16 0.81(4) 104.413(7) 118(11) 3.27(8) 0.11 3.05(8) 105.942(8) 120(11) 2.34(7) 0.16 2.22(7) 107.118(6) 119(10) 3.96(8) 0.32 3.76(8) 109.55(1) 112(11) 1.57(6) 0.16 1.51(6) 112.389(5) 113(9) 5.5(1) 0.13 5.08(9) 113.822(3) 128(7) 11.1(1) -0.15 9.8(1) 116.541(5) 127(9) 7.7(1) -0.19 6.6(1) 118.69(2) 107(11) 1.12(6) 0.10 1.10(6)
123.377(4) 105(10) 16.4(2) -0.44 16.4(2) 124.448(8) 106(8) 4.2(1) 0.10 4.2(1) 126.102(5) 127(10) 9.1(2) -0.26 7.6(1) 128.55(6) 104(10) 0.30(3) 0.02 0.33(3) 129.73(4) 109(11) 0.80(7) 0.06 0.80(6) 130.877(6) 121(10) 13.2(2) 0.29 13.2(2) 133.04(2) 105(11) 1.47(8) 0.11 1.42(7) 133.88(2) 99(10) 1.62(8) 0.12 1.57(8) 134.75(5) 99(10) 0.52(4) 0.05 0.51(4) 137.809(8) 117(10) 5.0(2) 0.29 5.0(2) 140.39(2) 99(10) 1.34(7) 0.11 1.30(7) 141.33(5) 109(11) 0.48(4) 0.05 0.48(4) 145.63(1) 144(13) 3.5(1) 0.16 3.4(1) 147.02(1) 131(13) 2.9(1) 0.22 2.8(1) 148.193(9) 146(13) 5.5(2) 0.23 5.2(1) 149.484(8) 111(10) 12.5(4) -0.28 9.6(3) 150.176(7) 124(10) 14.8(3) 0.03 12.4(3) 152.24(1) 106(10) 3.2(1) 0.05 3.0(1) 153.71(6) 126(13) 0.46(4) 0.10 0.46(4) 156.291(9) 114(11) 4.7(1) 0.10 4.4(1) 160.063(9) 112(10) 5.5(1) 0.06 5.1(1) 161.616(5) 108(9) 12.1(2) -0.37 10.3(2) 168.311(7) 98(9) 11.9(4) -0.64 9.0(2) 170.34(1) 115(11) 5.4(2) 0.13 5.1(1) 171.30(1) 126(12) 5.6(2) 0.10 5.3(2) 173.566(5) 122(9) 20.7(4) -0.59 16.3(2) 175.44(4) 116(11) 1.07(8) 0.04 1.05(8) 178.01(1) 111(11) 4.0(2) 0.01 3.7(1) 180.32(1) 112(11) 6.0(2) -0.16 5.2(1)
A comparison of the kernels from the present analysis to the ones from evaluations, is reported as a function of resonance energy in Fig. 10 in terms of residuals (i.e. difference of our values to the ones in literature, divided by the uncertainty).
In average a good agreement was found with the ENDF/B-VIII.0 and JEFF-3.3 evaluations, as well as with the resonance parameters by Baramsai et al. [19]. Moreover, the statistical distribution of the ratios of our kernels to the others was gaussian with mean 0.98, 0.98 and 1.02 respectively. On the contrary, the comparison with JENDL-4.0 and the data from Leinweber and collaborators presents an average deviation of about 8%.
FIG. 10. (Color online) 155Gd(n,g) Residuals between the present resonance kernels and values in literature: ENDF/BVIII.0, JEFF-3.3 evaluations and recent TOF experiment reported in Ref. [19] and [25], as a function of neutron resonance energy. Figure from Ref. [5, 6].
The resonances and structures observed in the energy region above the upper limit of evaluations are reported in Tab. 4, together with their capture kernel (defined above).
11.2 n+157Gd
In the region near thermal energy, the three data libraries ENDF/B-VIII.0, JEFF-3.3 and JENDL-4.0 provide a similar values of the capture cross section, between 253.2 and 254.5 kb. In the experiment by Leinweber and collaborators [25], a 12% smaller cross section was deduced. In Figure 11 the present capture yield, obtained with the thin sample, is compared with the expected capture yields calculated from the resonance parameters in evaluations and Ref. [25]. The present data settle in between the two groups of expected values.
FIG.11. 157Gd(n,g) capture yield (multiplied by E1/2) from the thin sample compared with the expected capture yields calculated on the basis of the cross sections in ENDF/B-VIII.0, JEFF-3.3 and JENDL-4.0 libraries and resonance parameters in Ref. [25]. The present resonance shape analysis is reported ad dotted curve. Figure from Ref. [5, 6].
Our estimation of the thermal cross section, deduced from the resonance parameters in Table V, is σ0 = 239.8 ± 9.3 kb. As in the case of 155Gd, the Westcott factor sizeably deviates from 1, with a value of 0.89 ± 0.04, some 5% higher than evaluations.
At higher energies, evaluations show differences and inconsistencies. For instance, the spin of the first resonance at 0.032 eV is J = 2 in ENDF/B-VIII.0 and JENDL-4.0 while it is J = 1 in JEFF-3.3. Moreover, the average Ƭγ width is 91, 99 and 117 MeV, in these libraries respectively. There are also doubtful resonances at 135.19, 137.9, 202.69, 208.5, 255.2, 300.9 and 306.4 eV, present in the ENDF/B-VIII.0 evaluation (60 resonances in total) which are reported neither in JEFF-3.3 (which contains 56 resonances) nor in JENDL-4.0 (with 54 resonances). Figure 12 shows the energy regions where largest discrepancies are present. The present data confirm the resonances in the ENDF/B-VIII.0 evaluation, with the exception of the resonances at 139 eV and 206 eV, the resonance at 220.65 in ENDF/B-VIII.0 is rather a doublet.
FIG. 12. (Color online) 157Gd(n,g) capture yield from the present work and comparison with the expected capture yield, calculated on the basis of the cross sections in ENDF/BVIII.0, JEFF-3.3 and JENDL-4.0 libraries. Figure from Ref. [5, 6].
The results of the resonance shape analysis are summarized in Table VI. Also the correlation coefficient between partial widths ρ(Γγ Γn), resulting from the SAMMY fit, is reported.
Table 5: Resonance in 157Gd(n,g). Uncertainties are from the fit. Resonance parameters from Ref. [5, 6]. Energy [eV] Γγ g Γn ρ(Γγ, Γn) Capture kernel [meV] 0.0314 111.80(2) 0.2921(1) -0:11 0.2908(1) 2.8330(1) 109.7(3) 0.2319(4) 0.17 0.2311(4) 16.218(3) 116(7) 0.113(3) 0.68 0.113(3) 16.7946(2) 104.2(5) 8.74(3) -0.49 7.70(1) 20.5262(3) 100.3(6) 8.47(2) -0.49 7.47(2) 21.602(2) 91(5) 0.217(4) 0.59 0.216(4) 23.290(2) 100(4) 0.223(3) 0.54 0.221(3) 25.3653(8) 103(2) 1.187(7) 0.31 1.165(7) 40.091(3) 101(6) 0.368(6) 0.44 0.365(6) 44.1374(8) 106(2) 5.98(3) -0.11 5.48(2) 48.7077(6) 103(1) 17.2(1) -0.74 13.56(4) 58.2928(7) 109(2) 19.9(1) -0.77 15.44(5) 66.536(1) 108(3) 4.46(3) -0.17 4.02(3) 81.312(2) 129(4) 6.54(5) 0.01 5.76(5) 82.103(3) 102(6) 4.10(5) 0.40 3.86(5) 87.175(2) 93(4) 6.61(6) -0.28 6.61(5) 96.572(2) 96(4) 6.21(7) -0.51 6.21(4)
100.160(2) 130(4) 10.7(1) -0.53 10.7(6) 104.909(2) 140(5) 14.4(9) -0.73 14.4(7) 107.370(4) 109(8) 3.20(5) 0.30 3.06(5) 110.550(1) 99(4) 30.6(7) -0.94 20.5(1) 115.373(2) 97(4) 13.8(2) -0.65 11.24(9) 120.861(2) 100(1) 93(2) -0.84 37.5(2) 135.36(3) 110 0. 66(4) 0.66( 4) 138.088(2) 122(6) 29.1(5) -0.84 21.0(2) 138.974(6) 127(11) 5.6(1) 0.39 5.3(1) 143.736(2) 114(6) 35.0(9) -0.93 23.5(2) 148.422(4) 114(8) 6.15(9) -0.30 5.38(7) 156.592(3) 115(7) 11.7(2) -0.42 10.0(1) 164.910(3) 94(7) 11.0(3) -0.80 8.37(9) 168.13(2) 146(14) 1.16(6) 0.21 1.15(5) 169.45(1) 191(18) 1.90(7) 0.36 1.87(7) 171.408(3) 205(7) 21.9(3) -0.60 17.1(1) 178.727(4) 104(8) 10.7(2) -0.45 9.2(1) 183.985(4) 110(8) 8.8(2) -0.60 7.2(1) 190.789(5) 144(10) 8.2(1) -0.29 7.1(1) 194.614(3) 125(7) 26.3(5) -0.80 19.7(2) 203.06(1) 158(15) 2.82(8) 0.24 2.69(7) 205.63(4) 82(8) 0.66(5) 0.04 0.65(5) 207.725(3) 88(1) 108(3) -0.75 36.4(3) 217.22(1) 162(16) 2.66(8) 0.22 2.55(7) 220.39(4) 120(12) 0.67(5) 0.07 0.66(5) 221.38(3) 199(20) 1.26(7) 0.21 1.24(7) 228.406(9) 163(15) 5.3(1) 0.11 5.1(1) 239.572(4) 127(3) 82(3) -0.81 30.1(2) 243.8(1) 135(13) 0.23(2) 0.02 0.22(2) 246.75(1) 149(14) 6.3(2) 0.06 5.9(1) 250.42(2) 147(15) 1.73(8) 0.11 1.68(8) 254.6(1) 121(12) 0.34(4) 0.01 0.34(3) 255.10(8) 113(11) 0.53(5) 0.01 0.53(5) 260.44(1) 222(19) 7.3(2) 0.07 6.7(2) 265.99(2) 171(17) 3.9(1) 0.15 3.8(1) 268.43(2) 119(12) 4.6(2) 0.04 4.3(2) 282.015(6) 128(11) 20.0(7) -0.86 14.1(2) 287.73(1) 203(19) 8.2(2) 0.20 7.7(2) 291.072(9) 147(13) 11.5(3) -0.42 9.5(2) 294.060(6) 106(9) 24(1) -0.90 15.1(2) 301.353(8) 184(15) 13.8(3) -0.42 11.5(2) 306.92(4) 226(22) 2.0(1) 0.13 2.0(1)
A comparison of the kernels from the present analysis to the ones from evaluations and Ref. [25] is reported as a function of resonance energy in Fig. 13 in terms of residuals. On average a good agreement was found with ENDF/B-VIII.0 and JEFF-3.3 evaluations, since the statistical distribution of the ratios was gaussian with mean 0.98. On the contrary, the comparison with JENDL-4.0 and the data from Leinweber and collaborators does not tend to a gaussian distribution and the average deviation is
15%. The resonances and structures observed in the energy region above the upper limit of evaluations are reported in a following paragraph, together with their capture kernels.
FIG. 13. 157Gd(n,g) Residuals between resonance kernel of this work and ENDF/BVIII.0, JEFF-3.3 libraries and Ref. [9], as a function of neutron resonance energy. Figure from Ref. [5, 6].
11.3 Statistical properties of neutron resonances
Resolved resonance parameters detailed in Tabs. 3 and 4 can be used to set the basic statistical properties of resonances.
Since there is not significant difference in the number of observed resonances as well as in neutron and radiation widths with respect to other experiments reported in literature, the estimation of quantities describing the statistical properties of neutron resonances (i.e. s-wave neutron strength function, S0, resonance radiative width, Γγ, and s-wave average resonance spacing, D0) should not differ significantly from nuclear data libraries.
In order to get estimation of the s-wave neutron strength function S0 we can use the following formula:
𝑆 =
1
∆𝐸
𝑔 Γ
∆
where ΔE is the interval of neutron energies, and the sum goes over resonances of both spins.
Assuming the neutron strength function for p-wave resonances is close to the literature values 𝑆 ≈ 1 × 10 , no p-wave resonance should be observable in our data as these resonances are too weak. On the other hand, as already pointed out in Ref. [27] the
Porter-Thomas (PT) fluctuations of individual neutron widths almost surely prevent observation of some s-wave resonances in Gd isotopes. Nevertheless, the contribution of these unobservable resonances to the sum is very small, of the order of 2-3%. The uncertainty in S0 is given by the uncertainty in individual Γ values from SAMMY fitting and by the expected PT fluctuations which the Γ values are expected to follow. The PT fluctuation adds an uncertainty
2 𝑁
⁄
𝑆 ,
where NR is the number of resonances. The present data yield𝑆 = 1.99(28) × 10
and𝑆 = 2.20(40) ×
10
for 155Gd and 157Gd determined from energy regions below 180 and 300 eV, respectively. These values agree with values available in literature:1.99(28) × 10
[28] and
2.00(40) × 10
[28] for 155Gd and2.20(40) × 10
[28] for 157Gd. The dominant contribution to listed uncertainty comes from the Porter-Thomas fluctuations. Figure 14 shows the dependence of∑ 𝑔 Γ
on neutron energy. For resonances where only resonance kernel is given in Tabs. 3 and 4, we assumedΓ = 111
and 107 MeV for 155Gd and 157Gd respectively and spin was assigned randomly assuming that the ratio of number of J = 1 to 2 resonances is 3/5 as expected from standard spin dependence of level density.FIG. 14. Cumulative distribution of reduced neutron widths for both Gd nuclei. Solid black line corresponds to 𝑆 = 1.99 × 10 coming from 155Gd data for En < 180 eV. Dashed lines (average ± rms) indicate expected corridor for both isotopes due to Porter-Thomas fluctuations. Figure from Ref. [5, 6].
Expected uncertainties, corresponding to the average ± root mean square from Porter-Thomas distribution are also indicated in the figure; those for 157Gd are higher due to larger resonance spacing.
The radiation widths from resonance shape analysis are very precisely determined at low neutron energy, but their uncertainty significantly increases with neutron energy. The statistical model predicts that due to the many possible decay channels the Γ should not vary much for resonances in a given isotope. This quantity is also expected to depend only weakly on the resonance spin. Simulations of the ƴ decay of resonances using the DICEBOX code indicated that the fluctuation of Γ are expected to be for resonances with the same spin about 1-2% with a realistic model of nuclear level density and of photon strength functions [18], [19]. The simulations also predicted similar difference, about 2%, between the Γ expectation values between J = 1 and 2 resonances.
Assuming Normal distribution of actual Γ values we tried to estimate the mean value and the width of the distribution of this quantity using the maximum-likelihood (ML) method. Uncertainties of individual values from SAMMY fit were taken into account in determining the parameters of this distribution. Using resonances for 𝐸 < 50 𝑒𝑉, the ML method yielded Γ = 111 and 107 meV for 155Gd and 157Gd and the width of the distribution 𝜎 = 11 meV. The width of the distribution is significantly higher than the value expected from statistical model, this suggests further investigations.
The cumulative plot of the number of resonances as a function of neutron energy is shown in Fig. 15. The observed deviation from a straight line at higher energies clearly indicates an increasing number of missing levels. We should remind that we are not sure if the reported structures above 180 eV and 300 eV in 155Gd and 157Gd, respectively, correspond to individual resonances. In reality, as mentioned above the PT fluctuations of individual neutron widths almost surely prevent observation of all resonances in Gd isotopes from very low neutron energies. The resonance spacing thus can not be calculated as a simple ratio Δ𝐸 𝑁⁄ , where NR is the number of observed resonances, but must be corrected. Many different ways of correction have been applied in the past. In this work we tried to estimate the spacing using comparison of the observed number of resonances above assumed threshold for observation with predictions of statistical model calculations.
FIG. 15. Cumulative distribution of resonances for both Gd isotopes. Dashed lines indicate expected number of levels for the most probable values of spacing. Figure from Ref. [5, 6].
Several thousands of artificial resonance sequences were generated using the above-given values of S0 and Γ . The number of observed resonances is for several different thresholds and maximum neutron energies (below 400 eV) nicely consistent with D0 in the range about 1.4–1.8 eV and about 4.3–5.3 eV in 155Gd and 157Gd, respectively. These values are fully consistent with values available in the literature. Use of higher neutron energies for comparison starts to be problematic as reported structures may correspond to close resonance multiplets.
11.4 Summary and Results at Thermal
The 155Gd(n,γ) and 157Gd(n, γ) cross sections available in nuclear data libraries as ENDF/BVIII. 0 [29], JEFF-3.3 [30], and JENDL-4.0 [31]. In particular, ENDF/B-VIII.0 is taken over from the previous ENDF/B evaluation, which is based on the resonance parameters compiled by Ref. [28].
The resonance parameters for 157Gd are consistent with those from the experiment by Mǿller and collaborators [32] and not with those from Leinweber and collaborators [25]. JEFF-3.3 is taken from JEFF-2, which adopts: JENDL-2 for 155Gd; and JENDL-1 for 157Gd.
The latter is based on the resonance parameters from the BNL-325 report (the previous edition of Ref. [28]). In JENDL-4.0, the 155;157Gd evaluations were revised by considering resonance parameter from Ref. [25].
In the case of 157Gd, a background capture cross section was added below 0.1 eV in order to reproduce the thermal cross section of the previous evaluation and a number of benchmarks reported in the International Criticality Safety Benchmark Evaluation
Project [33] (more details in [31]). In summary, evaluations agree on the adoption of the 157Gd(n, γ) thermal cross section consistent with the experiment by Moller and collaborators, although that value is about 12% higher than what was measured by Leinweber and collaborators [25] in a recent capture and transmission experiment. A summary of the values of the thermal cross sections retrieved from the experimental nuclear reaction database EXFOR is reported in historical progression in Tab. 5. Other measurements such those of of Pattenden [34], Tattersall [35] and Choi [36] are not listed because they are not direct measurements and depends on model calculations. The values from evaluations and compilations are also reported for comparison with the n_TOF data. The calculated Westcott factors are reported as well.
Table 5: Thermal Cross sections and Westcott factors deduced from the n_TOF measurment for both 155Gd and 157Gd isotopes, compared to data in literature, compilation and evaluations.
155Gd+n 157Gd+n
σ0 ± RMS
[kb] Westcott factor σ0 ± RMS [kb] Westcott factor
Mᴓller [32] 58.9 ± 5 254± 2 Ohno [37] 61.9 ± 6 248 ± 4 Leinweber [25] 60.2 226 Mughabghab [28] 60.9 ± 0.5 254.0 ± 0.8 JENDL-4.0 [31] 60.735 0.8345 253.25 0.8494 JEFF-3.3 [30] 60.89 0.8439 254.5 0.8512 ENDF/B-VIII.0 [29] 60.89 0.8439 253.32 0.8528 n_TOF results [5, 6] 62.2 ± 2.2 0.86 ± 0.04 239.8 ± 9.3 0.89 ± 0.04
In summary, for 155Gd the recent cross section measurement performed at n_TOF provided a value in agreement with evaluations and is slightly lower than the value reported by Møller and Ohno, but consistent within 1.5 standard deviations. Whereas the Westcot factor is consistent with values reported in evaluations.
In the case of 157Gd the cross section value from n_TOF settle between the data of Leinweber and Moller and is consistent with data and evaluations within 1.5 standard deviations. As for 155Gd the Westcott factor is consistent with evaluations.
12.
New resonances for
155Gd and
157Gd.
Fig. 16 clearly shows that 155Gd(n,γ) and 157Gd(n,γ) have resonances also above the resolved resonance region reported in the evaluations.
FIG. 16. 155,157Gd(n, γ) capture yield from the present work and calculated according to ENDF/B-VIII.0, JEFF-3.3 and JENDL-4.0 libraries around the boundary of RRR. Figure from Ref. [5, 6].
The properties of these resonances, are reported in Table 7 and 8 up to En = 1 keV. The resonance analysis was performed with the SAMMY code, by adopting a constant reaction width 〈Γ 〉 = 111 for n+155Gd(n,) and 107 meV for n+157Gd(n,) reaction, with an angular orbital momentum l = 0.


![Table 3: Resonances in 155 Gd(n,γ). Uncertainties from the fit. Table from Ref. [5, 6]](https://thumb-eu.123doks.com/thumbv2/123dokorg/5604911.67895/23.892.231.661.961.1147/table-resonances-gd-γ-uncertainties-fit-table-ref.webp)


