Long-term and recent trends in hypertension awareness,
treatment, and control in 12 high-income countries:
an analysis of 123 nationally representative surveys
NCD Risk Factor Collaboration (NCD-RisC)*Summary
Background Antihypertensive medicines are effective in reducing adverse cardiovascular events. Our aim was
to compare hypertension awareness, treatment, and control, and how they have changed over time, in high-income countries.
Methods We used data from people aged 40–79 years who participated in 123 national health examination surveys
from 1976 to 2017 in 12 high-income countries: Australia, Canada, Finland, Germany, Ireland, Italy, Japan,
New Zealand, South Korea, Spain, the UK, and the USA. We calculated the proportion of participants with hypertension, which was defined as systolic blood pressure of 140 mm Hg or more, or diastolic blood pressure of 90 mm Hg or more, or being on pharmacological treatment for hypertension, who were aware of their condition, who were treated, and whose hypertension was controlled (ie, lower than 140/90 mm Hg).
Findings Data from 526 336 participants were used in these analyses. In their most recent surveys, Canada,
South Korea, Australia, and the UK had the lowest prevalence of hypertension, and Finland the highest. In the 1980s and early 1990s, treatment rates were at most 40% and control rates were less than 25% in most countries and age and sex groups. Over the time period assessed, hypertension awareness and treatment increased and control rate improved in all 12 countries, with South Korea and Germany experiencing the largest improvements. Most of the observed increase occurred in the 1990s and early-mid 2000s, having plateaued since in most countries. In their most recent surveys, Canada, Germany, South Korea, and the USA had the highest rates of awareness, treatment, and control, whereas Finland, Ireland, Japan, and Spain had the lowest. Even in the best performing countries, treatment
coverage was at most 80% and control rateswere less than 70%.
Interpretation Hypertension awareness, treatment, and control have improved substantially in high-income countries
since the 1980s and 1990s. However, control rates have plateaued in the past decade, at levels lower than those in
high-quality hypertension programmes. There is substantial variation across countries in the rates of hypertension
awareness, treatment, and control.
Funding Wellcome Trust and WHO.
Copyright © 2019 The Author(s). Published by Elsevier Ltd. This is an Open Access article under the CC BY 4.0 license.
Introduction
High blood pressure is one of the most important risk factors for stroke, heart disease, and kidney disease.1 Antihypertensive medicines can effectively reduce blood pressure and the risk of associated diseases.2,3 As clinical trials have shown the benefits of pharmacological treatment for patients with low to moderate blood pressure, clinical guidelines have evolved to recommend lower blood pressure thresholds for initiating treat ment. National and regional hypertension programmes (eg, the Canadian Hypertension Education Program and Kaiser Permanente Northern California hypertension programme4,5) have demonstrated that it is feasible to achieve a high level of hypertension control by improving healthcare provider and patient compliance with evidencebased guidelines, establishing a hyper tension registry, monitoring physician performance and pro viding feedback, and implementing regular blood
pressure measurements and singlepill combination therapy.4
There are, however, few data on how different high income countries, with different health systems and clinical guidelines, compare in terms of hypertension awareness, treatment, and control; how comparative performance in these countries has changed over time; and which countries need to improve hypertension management. We aimed to benchmark hypertension awareness, treatment, and control across 12 highincome countries over a period of nearly four decades using national data.
Methods
Data sources
In this analysis, we used data from 123 national health examination surveys that were done from 1976 to 2017 in 12 highincome countries: Australia, Canada, Finland,
Lancet 2019; 394: 639–51
Published Online July 18, 2019 http://dx.doi.org/10.1016/ S0140-6736(19)31145-6 See Editorial page 611 See Comment page 613 *Members listed at the end of the Article
Correspondence to: Prof Majid Ezzati, School of Public Health, Imperial College London, London W2 1PG, UK
Germany, Ireland, Italy, Japan, New Zealand, South Korea, Spain, the UK, and the USA. These surveys measured blood pressure in random samples of the general population. A list of surveys used and information about their study designs, including age range and number of participants, number of blood pressure measurements taken, cuff size, and type of device used to measure blood pressure, are provided in the appendix (pp 3–6).
We used data on men and women aged 40–79 years. We did not use data on participants younger than 40 years because hypertension is less common in these ages. We did not use data on participants older than 80 years because guidelines recommend different treatment pathways and goals in older ages.
Data analysis
All analyses were done by sex and 10year age groups. In surveys that covered only a part of the 10year age group, we used the data only when the age range was 5 years or more; this criterion led to exclusion of data on 220 participants (<0·1%). In each survey, we identified the question used to establish whether a participant had been diagnosed with hypertension, often worded as a variation of: “have you ever been told by a doctor or other
health professional that you had hypertension, also called high blood pressure?” We did not consider having had hypertension diagnosis only during pregnancy as a previous diagnosis. We established whether participants had been pharmacologically treated for hypertension using surveyspecific questions, which were typically worded in the following way: “Because of your hypertension, have you ever been told to take prescribed medicine? Are you now taking it?” “Are you currently taking any medicines, tablets or pills for high blood pressure?” We took a similar approach in surveys that had gathered information on medicines prescribed to the participants, by relying on survey information about hypertension being the purpose or diagnosis leading to taking a bloodpressurelowering medicine. Participants with missing data on blood pressure, diagnosis, or treatment were excluded from the analysis (2% of data). After exclusion, we had data on 526 336 participants.
In each survey, we calculated the prevalence, and its 95% CI, of hypertension, which was defined as systolic blood pressure of 140 mm Hg or more, or diastolic blood pressure of 90 mm Hg or more, or being on pharmacological treatment for hypertension. We also calculated the pro portion of participants with hypertension Research in context
Evidence before this study
We searched MEDLINE (via PubMed) for articles published from inception to Jan 15, 2019, using the search terms ((hypertension[Title] AND (((medication OR treatment) AND control) OR aware*) AND “blood pressure”) OR
(cardiovascular[Title] AND risk factor*[Title] AND “blood pressure” AND (((medication OR treatment) AND control) OR aware*))) AND (trend* OR global OR worldwide) NOT patient*[Title]. No language restrictions were applied. We found some studies on trends in hypertension prevalence, awareness, treatment, and control in individual countries. Only three of these studies, in the USA and South Korea, used post-2010 data and reported a plateau in hypertension treatment and control. We found a few studies or reviews that compared hypertension awareness, treatment, and control across countries at one point in time, mostly using data collected from the 1980s to the 2000s. These studies mostly compared high-income countries as a group with low-income and middle-income countries, and they did not assess change over time. One study reported change in hypertension prevalence, awareness, treatment, and control in 21 countries using subnational data from the MONICA Project between two points in time (late 1980s and early 1990s). Another study, a systematic review of published studies, reported hypertension prevalence, awareness, treatment, and control in two points in time (2000 and 2010). Both of these studies did not examine trends over time in detail and did not use data collected after 2010. To our knowledge, there are no comparative studies of long-term
and recent trends in hypertension awareness, treatment, and control in high-income countries.
Added value of this study
This study provides the most comprehensive analysis of trends in hypertension awareness, treatment, and control in high-income countries using national surveys. By covering a substantially longer time period than previous studies, we noted not only substantial improvements in hypertension awareness, treatment, and control since hypertension treatment was incorporated in clinical guidelines, but also variations in the uptake of treatment and success of control across countries. By use of up-to-date national surveys in each country, we could evaluate recent trends, which revealed a plateau of the improvements in hypertension treatment coverage and control in most countries.
Implications of all the available evidence
There has been substantial improvement in hypertension awareness, treatment, and control in high-income countries since the 1980s and 1990s, most of which was achieved in the late 1990s and early 2000s. Canada, Germany, South Korea, and the USA have the highest rates of awareness, treatment, and control, whereas Finland, Ireland, Japan, and Spain have the lowest. Even in the best performing countries, the rates fall short of those achieved in high-quality hypertension programmes—eg, the Kaiser Permanente Northern California hypertension programme. There is need for strategies that further improve the diagnosis, treatment, and control of hypertension in high-income countries.
who reported having been diagnosed (awareness), who were using medication to treat hypertension (treatment), and who had systolic blood pressure of less than 140 mm Hg and diastolic blood pressure of less than 90 mm Hg (control). Blood pressure of each participant was measured more than once in all surveys, except those in Japan before 2000. When more than one measurement was taken, we discarded the first and used the remainder for the aforementioned analyses, by averaging when more than two measurements were taken. 37 surveys with 175 437 participants had data on hypertension treatment but not on diagnosis. 27 of these surveys were from Japan,
which in its annual national survey asks questions about treatment every year but about diagnosis every 10 years. For these surveys, we calculated hypertension prevalence, treatment, and control, but not awareness. Where relevant, we accounted for complex survey design and used survey sample weights when calculating prevalence, awareness, treatment, and control.
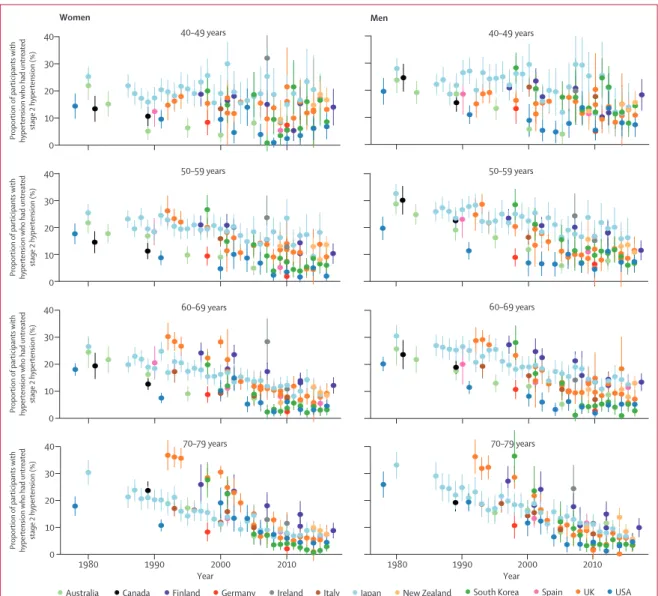
Immediate pharmacological treatment is recommended for people with stage 2 hypertension (ie, systolic blood pressure of 160 mm Hg or more, or diastolic blood pressure of 100 mm Hg or more) by all hypertension guidelines, and failure to provide such treatment is a
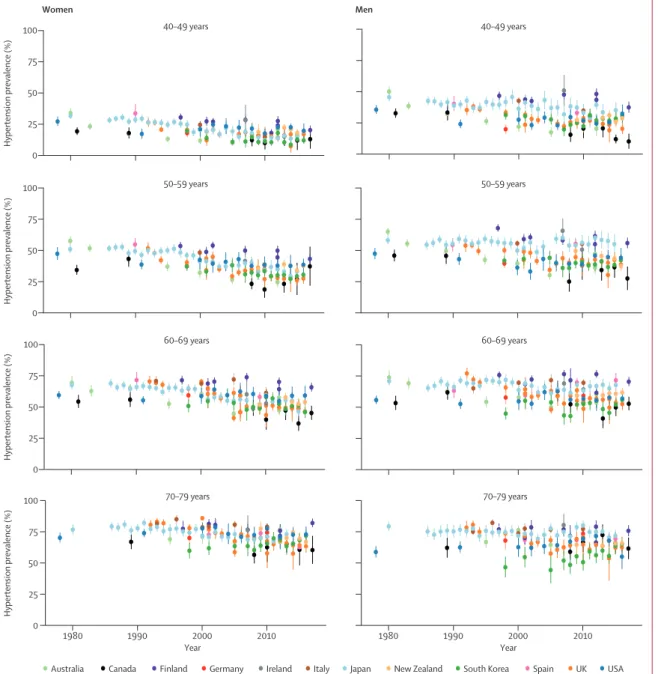
Figure 1: Trends in hypertension prevalence by country, sex, and age group
See appendix (pp 29–41) for country-by-country results. Error bars indicate 95% CIs.
0 Hypertension prevalence (%) 75 50 25 40–49 years 50–59 years 60–69 years 70–79 years 40–49 years 50–59 years 60–69 years 70–79 years 100 0 Hypertension prevalence (%) 75 50 25 100 0 Hypertension prevalence (%) 75 50 25 100 0 Hypertension prevalence (%) 75 50 25 100 1980 1990 2000 2010 Year 1980 1990 2000 2010 Year Women Men
shortcoming in the healthcare system. Therefore, we also calculated the proportion of people with hypertension who had stage 2 hypertension but were unaware of or untreated for their condition.
Role of the funding source
The funder of the study had no role in study design, data collection, analysis, interpretation, or writing of the report. BZ had full access to the data in the study.
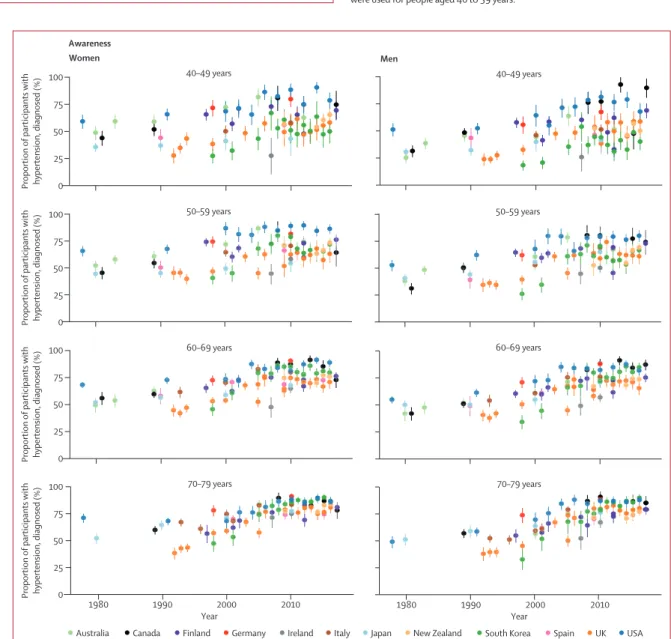
0 Proportion of participants with hypertension, diagnosed (%)
Proportion of participants with hypertension, diagnosed (%)
Proportion of participants with hypertension, diagnosed (%)
Proportion of participants with hypertension, diagnosed (%
) 75 50 25 40–49 years 50–59 years 60–69 years 70–79 years 40–49 years 50–59 years 60–69 years 70–79 years 100 0 75 50 25 100 0 75 50 25 100 0 75 50 25 100 1980 1990 2000 2010 Year 1980 1990 2000 2010 Year Women Awareness Men
Australia Canada Finland Germany Ireland Italy Japan New Zealand South Korea Spain UK USA
•
•
•
•
•
•
•
•
•
•
•
•
•
• •
•
•
• ••
•
•
••
• •
• • ••
•
••••
•
•
•
•
•
•
•
•
• •
•
•
••••••
•
•
••
••
•
•
•
• • •
• • •
•
•
•
•
•
•
•
•
•
•
•
• •
•
•
•
•
•
•
•
•
•
•
•
•
•
•
•
••• •
• • ••
••••••
•
•
•
•
•
•
•
• •
•
•
•••••••
•
•
••
••
•
•
• •
• • •
• • •
•
•
•
•
••
•
•
•
••
•
•
•
••
•
•
•
••
•
•
•
••
•
•
•
••
•
••
•
•••
•
•
•
•
•
•
•
••
•
•
•
•
•••
•
•
•
••
•
•
•
••
•
•
•
••
•
•
•
••
•
•
•
•
•
•
•
••
•
•
••
•
•
•
•
••
•
•
•
•
•••
•
••
•
•
•
•
•
••
•
••
•
•
•
•
•
••
•
•
•
••
•
•
•
••
•
•
•
••
•
•
••
•
•
•••
•
••
••
•
•
•
•
•
•
••
•
•
•
••
•
•
•
•
•
••
•
•
•
•
•
•
•
•
•
•••••
•
•
•
•
•
•
•
•
•
•
•
•
•
•
•
•
•••
•
•
•
•
•
•
•
•
•
••
•
•
•
•
•
•
•
•
•
•
••••
•
•
•
•
•
•
•
•
•
•
•
••
•
•
•
•
•
••
•
•
•
••
•
•
•
••
••
•
•
•
•
•
•
••
•
•
••
•
•
•
•
•
•
•
•
••••
•
•
•
•
•
••
•
•
•
••
•
•
•
•
•
•
•
•
•
•
•
•
•
•
•
•••
•
•
•
••
•
••
•
•
•
•
•••
•
•
•
••
•
•
•
••
•
•
•
•
•••••
•
•
•
•
•
•
•
•
•
•
••••
••••
•
•
•
•••••
•
•
•••
••
•
•
•
••
•
•
•
•
•••
•
•
•
••
•
•
•
••
•
•
•
••
•
•
•
••
•
•
•
••
•
•
•
••
•
•
•
••
•
•
•
••
•
•
•
••
•
•
•
••
•
•
•
••
•
•
•
••
•
•
•
••
•
•
•
•
•
•
•
••
•
•••
•
•
•
•
•
•
•
•
•
••••
•
•
•
••
•
•
•
•
•
•
••••••
•••
•
•
•
•
•
••
•
•
•
•
•
•
••
•
•
•
•
•
•••••
•
•
•
•
•
•
•
•
••
•
•
•••••••
•
•
•
•
•
••
•••
•
•
•
•
•
•
•
••
•
•
•
••
•
•
•
••
••
•
•••
•
•
•••
•
••
•
•
•
•••
•
••
•
••
•••••••••
•
•
•
•
•
•
•
•
•
•
••
•
••
•
•
••
••
••
••
••
••
••
••
••
••
••
•
•
•
••
•
•
••
••
•
•
•
••
•
•
•
•
•
•
•
•
•
•
•
•
•
•
•
•
•
•
•
••••
•
•
•
•
•
•
••
•
•
•
•
••
•
•
••
•
•
••
•
•
••
•
•
•
•
•
••
•
•
•
••••
•
•
•
••
•
•
•
••
•
•
•
••
•
•
•
••
•
•
•
••
•
••
•
•••
•
•
•
•
••
•
•
•
•
••
•
•••
•
•
•
•
•
•
••••
••
•
•
•
•
••
•
•
•
••
•
•
•
•
••
•
•
•
••
•
••
•
•
•
••
•
•
•
•
•
•
•
•
••••
••••••
•
••••••
•
•
•
•
•
•
••••
•
•
•
•
••
••
••••
•
•
•
•
•••
•
•
••
•••
•
•
••
•••
•
•
•
••
•
•
•
•
•
•
•
•
••••
•
•••
••••
••••
•
•
•
•
•
•
•
•
•
•
•
•
•
•
•
•
•
••
•
••
•
•
•
•
•
•
••
•
••
•
••
•
•
•
••
•
•
•
•
•
•
••
•
•
••
•
•
••
•
•
•
•
•
•
•••
•
•
•
•
•
••••
••••
•
•
•
••
•
•
••
•
•
•
•
••
••
•
•
•
•
•
•
•
•••
•
•
•
••
•
•
•
••
•
•
•
••
•
••••••••••••••••••••••••••••••••••••••••••••••••••••••••
•
•••••••••••••••••••••••••••••••••••••••••••••••••
•
•••
•
••••••
••
•••
•
•
••
•
•
•
•••••••••••••••
•
•••••••••••••••••
•
••
•
•
•
•
•
•
••
•
•
•
•••••••
•
••••
•
•
•
•
••
•
•••••
•
•
•
•
•
•
•
•
•
•
•
•••••
•
•
•
•
•
••
•
•
•
•
•
•
•
•
•••
•
•
•
••
•
•
•
•••
•
•
•
••
•
•
•
••••
•
•
•
••
•
•
••
•
•••
•
••
•
••
•
•
•
•
•
•
•••••
•
•
•
•
•
•
•
•
•
•
•
•••
•
•
•
•
•
••••
•••
•
•
•
•
•
••
•
•
•
•
•
••
•
•
•
•
•••
•
•
•
•
•
•
••••••
••
•
•
•
•
•
•
•
••
•
•
•
•
•
•
•
••
•
•
•
•
•
••
•••
•
•
•
•
•
•
•••••
•
•
•
•
•
•
•
••
••
•
•
•
•
•
•
•
•••••
•
•
•
•
••
•
•
•
•
•
•
•••
••••
•
•
•
•
•
•
•
•
•
•
•
•••
••
•
•
•
••••••••
•
•
••••
•
•
•
•
•
•
•
••
•
•
•
•
•
•••••
•
•
•
•
•
•
••••
•••••
•
•
•
•
•
•
•
•••
•
•
•
•
•
••
•
•
•
•
•
•
•
•
•
•
••
•
••••
•••••••
•
•
•
•
•
•
••
•
•
•
•
•
•
•
•••
•
•
•
•
•
•
•
•
••••
•
•
••
•
•
••
•
•
•
•
•
•
•
•
•
•
•
•
•
••
•
•
•
•
•
••
•••
•
•
•
•
•
•
•
•
•
••••••
•
•
•
•••
•
•
••
•
•
••
•
•
•
•
•
•
••••••••
•
•
•
•
•
•
•
•••
•
•
•
•
•
••
•
•••
•
•
•
•
••••
•
•
•••••
•
••••
••
•
••
•
•
•
•
•••
•
••
•
•••
•
•
••
•
•••
•
••
•
•
••••
•
••
•
•
•
•••
•
••••••••
•
•
•
••
•
•
•
••
•
•
•
•
•
•
•
•
•
••
•
•
•
•
••••••
•
•
••
••
••
••
•••
••
••
••
•
•••
•
•
•
••
•
•
•
•
•
•
•••
•
•
•
•
•
•
•
•
•
•
•
••••••
•
•
••
•
•
•
•
•
••
•
•
•
•
•
••
•••
•
•
•
•
•
•
•••••
•
•
•
•
•
•
•
•
••
•••
•
••••
•
•
•
•
••
•
•
•
•
••
•••
•
•
•
•
•
•
•••••
•
•
•
••
•
•••
•
•
•
•
•
•
•
•
••
•••••••
••••••
••
•
•
•
•
•
•
•
•
•
•
•
•
•
•
••••
•
••
•
•
•
•
•
••
•
•
•
••
•
•
•
••
•
•
•
••
•
••
•
•
•
•
•
•
•
••••••••
•
•
•
•
•
•
••
•
•
•••••
•
•
•
••••
••••
•
•
•
•
•
•
•
•
•
•
•••••
•
•
•
•
•••
••
•
•
•
•
•
••
•
•
••
•••
•
•
•
••
•
•
•
••
••
•
•
•
•
•
••••
•
•
•
•
•
•
•
•
•
•
••
•
•
•
•
•
•
•
•
•
•
•
•
•
••••
•
••
•
•
•
•
••
•
•
•
•
••••
•••
•
•
•
•
•
•
•
•
•
•••••
•
•
•
•
•
•
••
•
•
•
•
•••
•
•
•
••••
•
•
•
••
•
•
••
•
•
•
•
•
•
•
•
•
•
•
•
•
•
•••
•
•
•
•
•
•
•
•
•
•
•
•
•
•
•
•
•••••••
•
•
•
•
••
•
•
•
••
•
•
•
••
•
•
•
••
•
•
•
••
•
•
•
••
•
•
•
••
•
•
•
•••
••••••
•••••
•••
••••••
•
•••••••
•••
••••••••
•
••
•
•
•
•
•
•
•
•
•
•
•
••••
•
•
•
•
•
•
•
•
•
•
•
••
•
•••
•
••
•
•
•
••••
•
•
•
•
•
•
•
••
•
•
•
•
•
•
•
••
•
••••
•
•
•
•
••
•
••••
•
•
•
•
•
•
•
•
•
••
•
•••
•
•
•
•
•
•••
•
•
•
•••
•
•
•••
•
•
•
••
•
•
•
•
•
•
•
•
•
•
•
••••
•
•
•
•
•
•
•
•
•
•
••
•
•
•
••
•
•
•
••
•
•
•
••
••
•
•
•
•
•
••••
•
•
•
•
•
•
•
•
•
•
••
•
•
•
•
•
•
•
•
•
•
•
••
•
•••
••
•
•••
•
•
•
•
•
•
•
•
•
••••
•
•
•
•
•
•
•
•
•
•
•
•
•
•
•
•
•
•
•
•
•
•
•
•••
••
•
•
••
•
•
•
•
•
•
•
•
•
•
••••••
•
•
•
•
•
•
•••
•
•
•
•
•
•
•
•
•••
•
•
•
••••••
•
•
•
••
•
•
•
••
•
•
•
•
•
•••••
•
•
•
•
•
•
•
•
•
•
•
•
•
•
•••
••••
•
•
•
••
•
•
•••
•
•
••
•
•
•
•
••••••••
•
•
•
••
•
•
•
••
••
•
•
•
•
•
••••••
•
•
•
•
•
•
•
•
••
•
•
•
•
•
•
•
••••
•
•
•
•
••
•
•
•
•
•
•
•
•
•
•
••••
•
••••••
•
••••
•
•
•
•
••••
•
•
•
•
•
•
•
•
••
•
•
•
••••••••
•
•
•
•
•
•
••••
•
•
•
••••••••
•
•
•
•
•
•
•
••
•
•
•
•
•
••••
•
•
•
•
•
•
••
•
•
•
•
•
•
••
•
•
••
•
••
•
••••••
•
•••••
•
•
•
•
•
•
•
•
•
•
•
•
•
•
•
•
•••
•
•
•
•
••
•
•
•
•
•
•
•
•••
•
•
•
•
•
•
•
•
•
•
•
•
•
•
•
•
•
••••
•
••
•
••
•
•
•
•
•••
•
•
••
•
•
•
•••
•
••
•
•
•
•
•
•
•
•
•
•
•
•
•
•
•
•
•
•
•
•
••
•
•
•
•
••
•
•
•
••
••
•
•
•
•
•
•
•
•
••
•
•
•
•
••
•
•
••
••
•
•
•
•
•
•••••••
•
•
•
•
••
••
•
•••••••
•
•
•
••
•
•
•
•••
•
•
•
••
•
•
•
••
•
•
•
••
•
•
•
••
•
•
•
••
•
•
•
••
•
•
••
•
•
•
•
•
••
•
•
•
•
•
•
•
•
•
•
•
•
•
•
•
•
•
•
••
••
••
•
•
••
••
••
••
••
••
•••
••
•
•
•
••
•
•
•
•
••••
•
••
•
•
•
•
•
•
•
•
•
•
•
•
•
•
•
•
•
•
•
•
•
•
•
•••
•
•
•
••
•
•
••
•
•
••
•
•
••
•
•
•
•
•
•
•
•
•
•••
•
••
•
•
•
•
••
•
•
•
••
•
•
•
•
••
••••••
•
•
•
•
•
•
•
•
•
•••
•
•
•
••••
•
•
•
••••
••
••
••••
•
•
•
•
•
•
•
•
•
•
•
••
•
•
•
••
•
•
••
••
•
•
•
•
•
••
•
•
•
••
•
•
•
••
•
•
•
••
•
•
•
•
••••
•
•
•
•
•••
•
•
•
•••
•
•
••
•
•
•
••
•
•
••••
•
•
•
•
•
•
•
•
•
•
•
•
••
•
•
•
••
•
•
•
••
•
•
•
••
•
•
•
••
•
•
•
••
•
•
•
••
•
•
•
••
•
•
•
••
•
•
•
•••
•
•
•
••
•
•
•
••
•
•
••
•
•
•
•
•••
•
•
•
•
•
•
•
••
•
•
•
•
•
•
•
•
•••
•
•
•
•
•
•
••
•
•
•
••••••
•••
•
•
•
•
•
•
•
•
•
•
•••••
•
•
•
•
••••
•
•••••
•
•
•
•
•
••
•••••
•
•
•
•
•
•
•
•
•
•
•
•
•
•
••
•
•
•
••
•
•
••••
•
•
•
•
•
•
••
••••••••••••••••••••
•
••
••••
•
•
•
•
•
•
•
•
•
•
•
•
•
•
•
••
•
•
•
••
•
•
•
•
•
•••••
•
•
•
•
•
•
•
•
•
•
•••
••••
•
•
•
••
•
•
••
•
•••
•
•
••
•
•
•
•
•••••••
••••
••
•
••
•
•
•
•
•
•
•
•
•
••
•
•
•
•
•
•
•
•
••
•
•
•
•
••
•
•
•
•
•
•
•••••
•
•
•
•
•
•
••
••
•
•
•
•
•
•
•
•
•
••••
••
•••••
••
•
•
•
•
••••
•
•
•
•
•••
•
••
•
•
•
••
•••
•
••
•
••••
•
•
•
••••
••
••
•
•
•
•
•
•
••••
•
•
•
•
•
•
••
•
•
•
••
•
•
•
••
•••
••
•
•
•
••
•
•
••
•
•
•
•••
•
•
•
••
••
•
••
•
•
••
•
•
•
•
•
••
•
•
•
••
•
•
•
•
••
•
•
•
••
•
•
•
••
•
•
•
••
•
•
•
••
•
•
•
••
•
•
•
•
•
•••••
•
•
•
•
•
•
•••
••
•
•
•
•
•
•
•
••
•
•
•
•
•
••
•
•
•
•
•••
•
•
•
••
•
•
•
••
•
•
•
••
•
•
••
•
••••••••
•
•
•
•
•
•
•
•
•
••
••
•
••
•
•
•
•
•
•
•
•
•
•
••••
•
•
•
•
•
•
•
••••••
•
••
•
•
•
•
•
•
•
••
•
•••
•
•
•
•
•
•
•••••
•
•
•
•
•
••••
•
•
•
•
•
•
•
••
•
•
••••
•
•
•
••
•
•
•
••
•
••
•
••••
•
•
•
••
•
•
•
•••
•
•
•
••••
•
•
•
••
•
•
•
••
•
•••••
•
••
•
•
•
•
•
••
••••
••••••
•
•
•
••
••
•
•••
•
•
•
•
•
•
•••
•
•
•
•
•
•••
•
•
•
••
•
•
•
••
•
••
•
•••
•
•
••
•
•
•
•
••
•
••
•
•
•
•
•
•
•
••
•
•
•
•
•
•
•
••
••••
•
•
•
•
•
••••
••
•
•
(Figure 3 continues on next page)
Women Men
Prevalence Awareness Treatment Control Prevalence Awareness Treatment Control Australia (2012) 33% 75% 65% 38% 39% 67% 55% 28% Canada (2016–17) 36% 72% 66% 50% 34% 84% 81% 69% Finland (2017) 52% 77% 59% 29% 59% 74% 55% 26% Germany (2008–11) 43% 87% 80% 58% 46% 82% 70% 48% Ireland (2009–11)* 43% 56% 50% 26% 56% 46% 39% 17% Italy (2008–12) 45% 77% 68% 31% 56% 69% 56% 23% Japan (2015) 40% 66%† 55% 29% 56% 65%† 52% 24% New Zealand (2015–16) 41% 75% 62% 35% 45% 69% 55% 28% South Korea (2016) 34% 76% 74% 53% 44% 68% 65% 46% Spain (2015)‡ 36% 69% 56% 29% 53% 64% 51% 25% UK (2016) 36% 70% 59% 37% 40% 67% 55% 37% USA (2015–16) 44% 86% 80% 54% 45% 79% 70% 49%
Figure 2: Prevalence of hypertension and rates of awareness, treatment, and
control in women and men aged 40–79 years
Data are from the latest national survey in each country. Results shown are crude (ie, not age-standardised) to reflect the total burden of hypertension and its awareness, treatment, and control. Age-specific results, and their uncertainty, are available in figures 1 and 3–6, and the appendix (pp 7–9). For each outcome, the colour range for cells extends from lowest to highest value. Men and women share the same colour scheme. Awareness, treatment, and control are reported as the proportions. *The latest national survey in Ireland had data for people aged 50 to 79 years; data from an earlier survey in 2007 were used for people aged 40 to 49 years. †The question on awareness was not asked in 2015 in Japan; awareness data from 2010 were used. ‡The latest national survey in Spain had data for people aged 60 to 79 years; data from an earlier survey in 2009 were used for people aged 40 to 59 years.
The corresponding author had final responsibility for the decision to submit for publication.
Results
In the most recent national surveys, Canada, South Korea, Australia, and the UK had the lowest prevalence of hypertension, and Finland the highest (figures 1, 2). Prevalence was also higher than 50% in men in Ireland, Italy, Japan, and Spain. In ages 40–49 years, hypertension prevalence ranged from 12% (95% CI 9–15; South Korea) to 20% (17–24; Finland) in women, and from 10% (4–16; Canada) to 37% (33–42; Finland) in men. In ages 70–79 years, prevalence ranged from 61% (49–72; Canada) to 82% (79–86; Finland) in women, and from 55% (45–65; USA) to 77% (74–80; Italy) in men (figure 1; appendix pp 7–9).
Overall prevalence across all participants aged 40–79 years ranged from 33% in Australia to 52% in Finland in women, and from 34% in Canada to 59% in Finland in men (figure 2).
In most countries and among age and sex groups, hypertension prevalence did not change over time, although some age and sex groups showed a decline, especially after the mid2000s (figure 1; see appendix p 10 for p values for change since 2005). The only group in which hypertension prevalence increased was South Korean men and women aged 70–79 years.
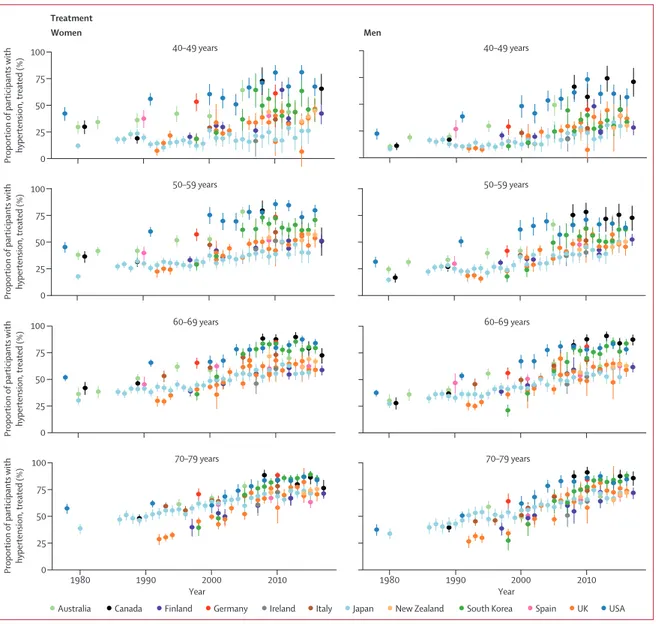
Awareness and treatment of hypertension increased in most countries (figure 3). Much of the improvement happened before the mid2000s, and awareness and treatment have plateaued since, at levels between 40% and 80% depending on age (figure 3; see appendix 0
Proportion of participants with hypertension, treated (%)
Proportion of participants with hypertension, treated (%)
Proportion of participants with hypertension, treated (%)
Proportion of participants with hypertension, treated (%
) 75 50 25 40–49 years 50–59 years 60–69 years 70–79 years 40–49 years 50–59 years 60–69 years 70–79 years 100 0 75 50 25 100 0 75 50 25 100 0 75 50 25 100 1980 1990 2000 2010 Year 1980 1990 2000 2010 Year Women Treatment Men
Australia Canada Finland Germany Ireland Italy Japan New Zealand South Korea Spain UK USA
• •
•
•
•
•
•
•
•
•
•
•
•
•
•
•
••
•
•
••
•
••
•
• •
•
••
•••••
•
•
•
•
•
•
••
•
•
•
•
••••••••••••••
• •
••••••••••••••••
•
•
••••••
•
•
••
••
•
•
•
• • •
• •
•
•
•
•
• •
•
•
•
•
•
•
•
•
•
•
•
•
•
•
•
•
•
••
•
•
••
•
•••
• •••
• •••••
•
•••••••
•
•
•
•
•••••••••••••••••••
••••••••
•••
• •
•
•
•
••••••
•
•
•
•
•
•
•
•
• • •
• •
•
• • •
• •
•
•
•
•
•
•
•
•
•
•
•
•
•
••
•
•
••
•
•••
• •
••• •
•••••••••
• •
••
••
•
•
•
••••••••••••••
•••••••••••
•
•
•••
• •
• •
•••••••••
•
•••
•
•
• • • • •
• •
• •
• •
•
•
•
•
•
•
•
• • • • •
•
•
•
•
••
•
•
••
•
••• •
•••
• •••
••••
•
•••
•••
• •
•
•
•
••••••••••••••
••••••••••
•••••
•
• •
• •
•
•••••••
•
•••
•
•
•
• • • • •
• • • •
• •
•
•
•
•
•
•
•
• • • •
•
•
•
•
•
•
••
•
•
••
•
•
•••
• ••••
•
•
•••••••••
•
•••••••••
•
•
•
•
•
•
••••••••••••••
•••••••
•••••••••
•
•
• •
•••••••••
•
•••
•
•
• •
• • • • •
• •
• •
•
•
•
•
•
•
•
• • • • •
•
•
•
•
•
••
••
•
••
•
•
•••
• •••
•
•
•••
••
••••
•
•
••••
•
••
• •
•
•
•
•
•
•••••••••••
••••••••
•••••••••••
•
•
• •
••••••
•
•••
•••
•
•
• •
• • • • • • •
•
•
•
•
•
• • • • •
•
•
•
•
•
•
••
•
••
•
•••
• •••
• •
••••••••
•
•
••••••
• • ••
•
•
•
•••••••••
•••••
••••••••
••••••••
• •
• ••
••••••••
•
•••
•
•
• •
• •
• • • • •
•
•
•
•
•
• •
• •
•
•
•
•
•
•
••
•• •
•
•
•••
• •
•
•
•
••••
••
•
•••••••
•
•
• •
••
•
•
•
••••••
••••••••••
•••••••••
•••••
•
•
• •
•••
•
••••••
•••
•
•
• •
• • • • • • •
Figure 3: Trends in hypertension awareness and treatment among people with hypertension, by country, sex, and age group
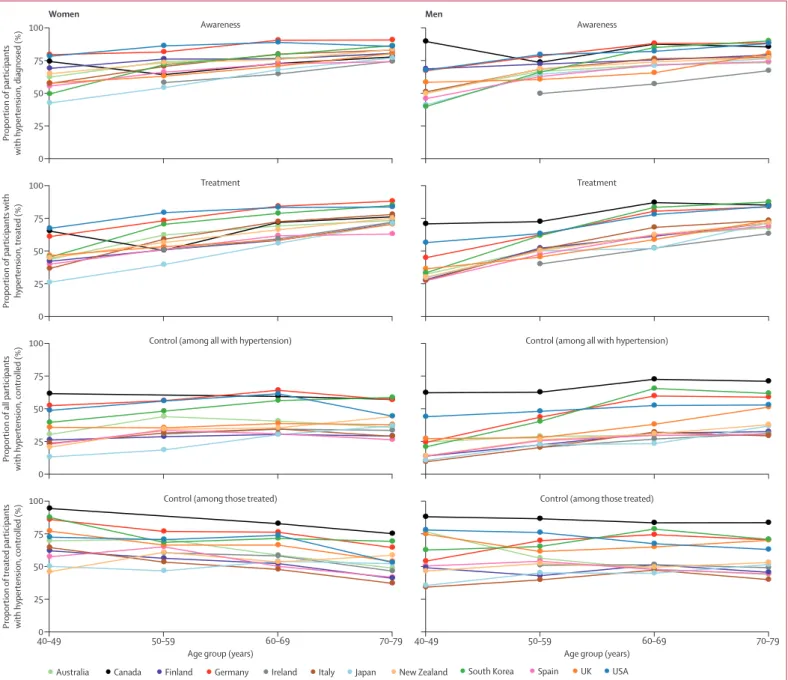
pp 11–12 for p values for change since 2005). Awareness and treatment rates were lower in younger age groups than in older ones (figure 4).
The USA started with higher rates of awareness (about 50% or more in different age groups) and treatment (about 25% or more in different age groups) than other countries in the 1980s and 1990s, and has largely maintained this advantage (figures 2, 3). In their most recent surveys, Canada, Germany, and South Korea also had high rates of hypertension awareness and treatment, in some age and sex groups having surpassed the USA. The USA, Canada, and Germany not only had high awareness and treatment rates, but also a smaller age
gradient in awareness and treatment (figure 4), meaning that diagnosis and treatment are benefiting all ages. Australia, which had similar rates of awareness and treatment to the USA in the 1990s, has fallen behind, with awareness and treatment for men now in the lower half of these 12 countries (figure 2). By contrast, South Korea and the UK started with relatively low rates of hypertension awareness and treatment, but have closed the gap with (the UK) or outperformed (South Korea) most other countries because of a sharp increase in the late 1990s and early 2000s. There might, however, have been a slight decrease in hypertension awareness and treatment in the UK and in Canadian
Figure 4: Age patterns of hypertension awareness, treatment, and control among women and men, according to the latest national surveys
0 Proportion of participants with hypertension, diagnosed (%) Awareness 25 50 75 100 Women Awareness Treatment Treatment
Control (among all with hypertension) Control (among all with hypertension)
Control (among those treated) Control (among those treated) 0 Proportion of participants with hypertension, treated (%) 25 50 75 100 0 Proportion of all participants
with hypertension, controlled (%)
25 50 75 100 40–490 50–59 60–69 70–79 Proportion of treated participants
with hypertension, controlled (%)
Age group (years) 25
50 75 100
40–49 50–59 60–69 70–79
Age group (years)
Men
•
•
•
•
•
•
•
•
•
•
•
•
•
•
•
•
•
•
•
•
•
•
•
•
•
•
•
•
•
•
•
•
•
•
•
•
•
•
•
•
•
•
•
•
•
•
•
•
•
•
•
•
•
•
•
•
•
•
•
•
•
•
•
•
•
•
•
•
•
•
•
•
•
•
•
•
•
•
•
•
•
•
•
•
•
•
•
•
•
•
•
•
•
•
•
•
•
•
•
•
•
•
•
•
•
•
•
•
•
•
•
•
•
•
•
•
•
•
•
•
•
•
•
•
•
•
•
•
•
•
•
•
•
•
•
•
•
•
•
•
•
•
•
•
•
•
•
•
•
•
•
•
•
•
•
•
•
•
•
•
•
•
•
•
•
•
•
•
•
•
•
•
•
•
•
•
•
•
•
•
•
•
•
•
•
•
•
•
•
•
•
•
•
•
•
•
•
•
•
•
•
•
•
•
•
•
•
•
•
•
•
•
•
•
•
•
•
•
•
•
•
•
•
•
•
•
•
•
•
•
•
•
•
•
•
•
•
•
•
•
•
•
•
•
•
•
•
•
•
•
•
•
•
•
•
•
•
•
•
•
•
•
•
•
•
•
•
•
•
•
•
•
•
•
•
•
•
•
•
•
•
•
•
•
•
•
•
•
•
•
•
•
•
•
•
•
•
•
•
•
•
•
•
•
•
•
•
•
•
•
•
•
•
•
•
•
•
•
•
•
•
•
•
•
•
•
•
•
•
•
•
•
•
•
•
•
•
•
•
•
•
•
•
•
•
•
•
•
•
•
•
•
•
•
•
•
•
•
•
•
•
•
•
•
•
•
•
•
•
•
•
•
•
•
women in the past 5 years (appendix pp 31, 40), which needs to be confirmed when additional years of data become available. Finally, although hypertension awareness and treatment increased in Japan at a steady pace since the 1980s, it remains lower than in most other countries.
As awareness and treatment rates increased, the proportion of people with hypertension who had stage 2 hypertension but were not diagnosed or treated declined markedly, especially in older ages (figure 5). In the latest surveys, this proportion was less than 5% in most age groups in Germany and the USA and in older age groups in South Korea. By contrast, in some age and sex groups in Finland, Italy, Japan, and New Zealand, 15–25% of participants with hypertension had untreated stage 2 hypertension.
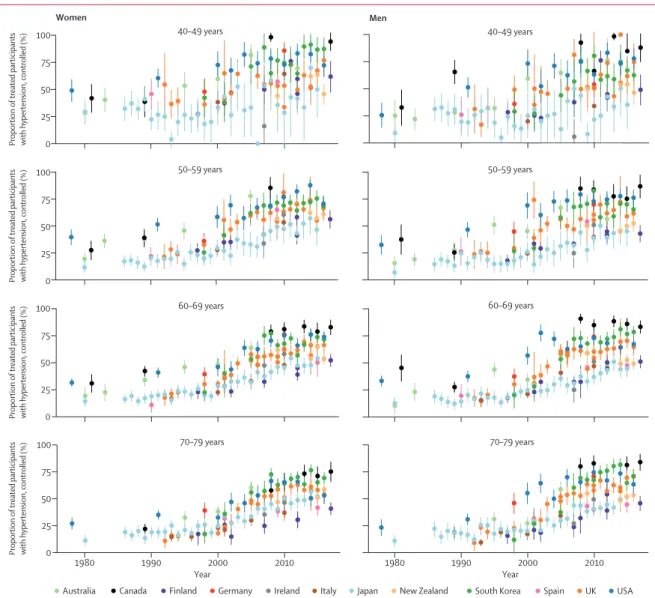
In the 1980s and early 1990s, the proportion of people with hypertension whose hypertension was controlled
(ie, had achieved systolic blood pressure of less than 140 mm Hg and diastolic blood pressure of less than 90 mm Hg) was less than 25% in most countries and age and sex groups (figure 6). Control rates improved over time, reaching 60–70% in some countries and age and sex groups. Like awareness and treatment rates, this increase mostly happened in the 1990s and earlymid 2000s, with slower improvement since then followed by a plateau after the mid2000s in most countries and age groups (see appendix p 13 for p values for change since 2005). Even in countries with the highest rates of control—namely, Canada, South Korea, the USA, and Germany—the plateau occurred below 70% when taken across the entire 40–79year age range (figure 2). Hypertension control was lower in Finland, Ireland, Italy, Japan, and Spain than in other countries, with control rates being less than 20% in some age and sex groups. Taken across the entire 40–79 years, control rates 0
Proportion of participants with
hypertension who had undiagnosed
stage 2 hypertension (%)
Proportion of participants with
hypertension who had undiagnosed
stage 2 hypertension (%)
Proportion of participants with
hypertension who had undiagnosed
stage 2 hypertension (%)
Proportion of participants with
hypertension who had undiagnosed
stage 2 hypertension (% ) 30 20 10 40–49 years 50–59 years 60–69 years 70–79 years 40–49 years 50–59 years 60–69 years 40 0 30 20 10 40 0 30 20 10 40 0 30 20 10 40 1980 1990 2000 2010 Year 1980 1990 2000 2010 Year Women Men
Australia Canada Finland Germany Ireland Italy Japan New Zealand South Korea Spain UK USA 70–79 years