RESEARCH PAPER
Comparative study of Acrysof ReSTOR multifocal intraocular
lenses
+4.00 D and +3.00 D: visual performance and
wavefront error
Clin Exp Optom 2013; 96: 295–302 DOI:10.1111/j.1444-0938.2012.00815.x
Lisa Toto* MD PhD Paolo Carpineto* MD Gennaro Falconio* MD Luca Agnifili* MD PhD Marta Di Nicola†PhD Alessandra Mastropasqua* MD Leonardo Mastropasqua* MD
* Department of Medicine and Science of Ageing, Eye Clinic, University “G. d’Annunzio”, Chieti, Italy †
Fondazione Università “G. d’Annunzio”, Center of Excellence on Aging and Department of Biomedical Science, University “G. d’Annunzio”, Laboratory of Biostatistics, Chieti, Italy
Background: The aim was to evaluate visual performance and wavefront error after implantation of three models of Acrysof ReSTOR multifocal intraocular lenses (MIOLs).
Methods: This prospective comparative six-month study comprised 60 eyes having phacoemulsification and implantation of three diffractive AcrySof ReSTOR MIOLs: SN60D3 +4.00 D spherical MIOL (group 1), SN6AD3 +4.00 D aspheric MIOL (group 2) and SN6AD1 +3.00 D aspheric MIOL (group 3).
Results: The distance visual acuity was at least 0.1 logMAR in 88.8 per cent of group 1, 88.8 per cent of group 2 and 87.5 per cent of group 3. The distance-corrected near vision was 0.02⫾ 0.04 logMAR in group 1, 0.02 ⫾ 0.05 logMAR in group 2 and 0.01 ⫾ 0.03 logMAR in group 3 (p = 0.822). The distance-corrected intermediate vision was 0.26⫾ 0.07, 0.22 ⫾ 0.09 and 0.04 ⫾ 0.05, respectively (p < 0.001). The root-mean-square (RMS) of ocular spherical aberration was significantly lower in groups 2 and 3 compared to group 1 (p = 0.048).
Conclusion: All diffractive MIOLs provided good vision for far and near. ReSTOR MIOL +3.00 also restored intermediate vision. Aspheric MIOLs +4.00 and +3.00 induced significantly lower spherical aberration compared to spherical MIOL +4.00.
Submitted: 5 March 2012 Revised: 23 July 2012
Accepted for publication: 30 July 2012
Key words: aberrations, cataract, contrast sensitivity, reading, visual acuity
Multifocal intraocular lenses (MIOLs) were designed to allow vision at dif-ferent distances, enabling patients to be less dependent on spectacles following surgery.
The first MIOL models, either diffrac-tive or refracdiffrac-tive, restored near vision effectively, with good near visual perform-ance in a high percentage of patients.1,2
Nevertheless, a degradation of the quality of vision, such as contrast sensitivity decrement and presence of dysphotopsia and halos related to the multifocal vision
has been reported as one of the main consequences of MIOL implantation.1–3
In addition, the spherical design of the commercially available MIOLs may induce disturbing visual symptoms associated with the increase of spherical aberration.4
In the last decade, technical innovations have been introduced in the design of MIOLs to improve visual performance in implanted patients.
Diffractive-refractive MIOLs, such as ReSTOR MIOLs with a central diffractive apodised optic lens consisting of a smooth
decrease in step heights from the central zone to the diffractive periphery and a peripheral refractive zone have been manufactured to improve light transmis-sion through the optic lens and reduce light dispersion. Moreover an aspheric profile has been developed for these lenses to reduce the increment of spheri-cal aberration and further improve the quality of vision.
Several studies have demonstrated an improvement of near vision after implan-tation of the ReSTOR IOLs both with
spherical and aspheric profiles and +4.00 dioptres near addition, with low or no sig-nificant decrease in the quality of vision compared with monofocal IOLs.2–8
Nevertheless with these MIOLs models the quality of intermediate vision was lower compared to that of distance and near vision.
More recently a new aspheric AcrySof ReSTOR IOL with +3.00 D near addition was designed to improve intermediate vision. This IOL demonstrated good far and near vision and better intermediate vision compared to the spherical and aspheric +4.00 D ReSTOR MIOLs.9–11
The aim of our study was to assess the efficacy of all three diffractive multifocal intraocular lens models by evaluating the distant, intermediate and near visual per-formance and to assess at the same time the quality of vision of patients and higher-order aberrations.
PATIENTS AND METHODS
Sixty eyes of sixty patients scheduled for cataract surgery from June 2010 to Sep-tember 2010 were enrolled in this six-month comparative clinical trial approved by the University Institutional Review Board of the University “G. d’Annunzio”, Chieti, Italy. The investigation was con-ducted in accordance with the 1975 Dec-laration of Helsinki. Each patient signed the informed consent form.
Inclusion criteria were axial length between 23.0 and 24.0 mm and corneal pre-operative astigmatism less than 1.00 D. Exclusion criteria were anterior seg-ment pathological alterations, such as chronic uveitis, zonular dialysis, pseudoex-foliation syndrome, glaucoma and diabe-tes, other ocular pathologies impairing visual function, such as maculopathies or optic nerve diseases, previous anterior or posterior segment surgery and intra-operative or post-intra-operative complications. All the patients were included if both eyes matched the inclusion and exclusion criteria because of the possibility of a future bilateral implantation.
Patients were implanted with one of three different multifocal AcrySof ReSTOR IOLs and were randomised into three groups: 20 patients received a SN60D3® IOL (+4.00 D addition, spheri-cal design), 20 patients a SN6AD3® (+4.00 D addition, aspheric design) and 20 patients were implanted with a SN6AD1® IOL (+3.00 D addition, aspheric design).
The SN60D3® AcrySof ReSTOR IOL (Alcon Laboratories Inc, Fort Worth, TX, USA) is a single-piece 6.0 mm asymmetric biconvex optic lens of hydrophobic flex-ible acrylic material with a central 3.6 mm apodised diffractive design and a periph-eral refractive area. Apodisation produces a gradual tapering of the diffractive steps from the centre to the outer edge of the lens to create a smooth transition of
light between distant, intermediate and near focal points. This is obtained by means of a precise reduction in step heights from 1.3 microns to 0.2 microns. The outer ring of the AcrySof ReSTOR IOL that surrounds the apodised diffrac-tive region is dedicated to focus light for distant vision. The IOL has +4.00 D addition for near.
The SN6AD3 AcrySof ReSTOR IOL model is similar to the spherical model SN60D3 IOL but has a symmetric bicon-vex design with an anterior aspheric optic lens. The IOL has +4.00 D addition for near.
The SN6AD1 AcrySof ReSTOR IOL has an aspheric optic profile and apodised multifocal structure in the central 3.6 mm optic zone, which consists of nine instead of 12 concentric steps. The IOL has +3.00 D addition for near (Table 1).
In all cases a standardised uneventful small-incision phacoemulsification with IOL implantation was performed by a single surgeon (LM). After a 2.75 mm near clear corneal tunnel was made, a curvilinear capsulorhexis was created. Phacofracture in the capsular bag was fol-lowed by automated irrigation/aspiration of the cortical remnants. The IOL was implanted in the capsular bag. The incision was not sutured. Post-operative therapy consisted of ofloxacin 0.3% and dexamethasone 0.2% eye drops four times daily for three weeks.
IOL parameters ReSTOR SN60D3 ReSTOR SN6AD3 ReSTOR SN6AD1
Profile Spherical Aspheric Aspheric
Addition (D) +4.00 +4.00 +3.00
Range (D) +10.00 to +30.00 +10.00 to +30.00 +10.00 to +30.00
Material Hydrophobic acrylate Hydrophobic acrylate Hydrophobic acrylate
Optic zone (mm) 6.0 6.0 6.0
Concentric steps 12 12 9
Overall diameter (mm) 13 13 13
Blue filter No Yes Yes
Light distribution Approximately 40–90% of light to
distance focus
Approximately 40–90% of light to distance focus
Approximately 40–90% of light to distance focus
Patients were examined after surgery over a six-month period.
The main outcome measures were spherical equivalent (SE) subjective refraction, uncorrected distance vision (UDV), distance visual acuity (VA), VA at low contrast (50, 25 and 12.5 per cent) under photopic and mesopic conditions, contrast sensitivity (1.05, 3, 6, 12 and 18 cycles per degree) under photopic and mesopic conditions, distance corrected intermediate vision (DCIV) at 80 cm, distance corrected near vision (DCNV) at 40 cm, corrected near vision acuity (NVA) at 40 cm and defocus curve. The root-mean-square (RMS) of ocular and corneal total higher-order (HOA RMS), coma (RMS Z31), trefoil (RMS Z33) and
spherical (RMS Z40) aberrations and
Zernike coefficient of fourth-order spheri-cal aberration (Z40) were evaluated in all
cases.
At each visit, the posterior capsule was examined after dilating the pupil to estab-lish the presence of posterior capsular opacification (PCO).
The scheduled follow-up times for the main parameters evaluated in the study were set at post-operative 30, 90 and 180 days.
High and low contrast VA and
contrast sensitivity evaluation
Uncorrected distance vision and distance VA were measured monocularly in logMAR scale using the Yang vision tester with Sloan letters optotype (SIFI Diagnos-tic SPA, Treviso, Italy) under photopic conditions (81 candelas/m2).Distance VA at low contrast was meas-ured monocularly in logMAR scale using the same optotype by reducing the con-trast of letters (50, 25 and 13 per cent of maximal contrast) under photopic (81 cd/m2) and mesopic (3 cd/m2)
conditions.
Contrast sensitivity at 1.05, 3, 6, 12 and 18 cycles per degree (cpd) under pho-topic (81 cd/m2) and mesopic (3 cd/m2)
conditions was evaluated monocularly with correction for distance in place by means of Vistech contrast sensitivity charts displayed by the Yang vision tester.12
Distance-corrected near vision and near VA were examined under photopic condi-tions (81 cd/m2) at 40 cm using a
hand-held ETDRS (Early Treatment Diabetic Retinopathy Study) near reading chart.
Distance-corrected intermediate vision was evaluated monocularly under pho-topic conditions (81 cd/m2) at 80 cm
using the same chart used for near assess-ment but with an adjustassess-ment for distance.
Defocus curve and depth
of focus
A defocus curve was obtained by spectacle defocus from +2.00 D to -5.00 D in 0.50 D steps. Non-randomised letter sequence and non-randomised progression of lenses were presented in each eye. All visual acuities were measured by means of the ETDRS scale using Yang vision tester opto-type. The cut-off point was chosen as 0.3 logMAR and the depth of focus was calcu-lated as half the values with VA better than 0.3 logMAR at different defocus values.
Ocular wavefront
aberration analysis
The higher-order aberrations were meas-ured using the Wasca Wavefront Analyzer aberrometer (Asclepion-Meditec, AG, Jena, Germany) based on the Hartmann– Shack wavefront sensor technique.
The WASCA aberrometer defines and calculates aberrations in terms of Zernike polynomials up to the fourth-order. The third- (Z31, Z3-1, Z33, Z3-3) and fourth- (Z40,
Z42, Z4-2, Z44, Z4-4) order aberrations were
expressed as Zernike coefficients and were measured in microns.
The total higher-order wavefront error (from third to fourth) was expressed in RMS (root-mean-square) representing the average of the square root of the wave-front errors, measured in microns. Meas-urements of aberration were obtained during scheduled follow-up examinations after pupil dilatation with phenylephrine chlorhydrate and tropicamide (Visumidri-atic fenilefrina®; Visufarma s.r.l, Rome, Italy) as previously described.12 For the
results across patients to be comparable, a 5.0 mm diameter pupil was used for analy-sis of all patients. The RMS of the total higher-order aberrations and of single
third-order coma (Z31, Z3-1), third-order
trefoil (Z33, Z3-3) and fourth-order
spheri-cal (Z40) aberrations were calculated for
each subject at each examination as the mean value of three reliable consecutive measurements.
In addition, the Zernike coefficient of fourth-order spherical (Z40) aberration
with a 5.0 mm pupil diameter was calcu-lated for each patient.
Wavefront aberration analysis of
total cornea
The total corneal higher-order aberra-tions were measured by means of the Oculus Pentacam (OCULUS Optikgerate GmbH, Wetzlar, Germany).
It uses Scheimpflug photography to acquire 100 cross-sectional images with 500 measurement points on the anterior and posterior corneal surfaces over a 180-degree rotation. Proprietary software reconstructs corneal topography (anterior and posterior surface) from height data and converts the corneal elevation profile into corneal wavefront data providing analyses of total, anterior and posterior corneal wavefront aberrations using the Zernike polynomials up to the tenth order.
Pentacam software version 1.17.89 was used. The examiner moved the joystick until perfect alignment was achieved and the system automatically captured 100 images of the cornea within two seconds. Scans with blinks or other artefacts were discarded and in accordance with Penta-cam software indications were repeated.
All scans were centred on the centre of the pupil.
The RMS of corneal higher-order aber-rations of third and fourth order (Z3-Z4)
and of single third-order coma (Z31, Z3-1),
third-order trefoil (Z33, Z3-3) and
fourth-order spherical (Z40) aberrations and
Zernike coefficient of spherical aberration for a 6.0 mm pupil diameter were calcu-lated for each control, for each patient examination as the mean value of three reliable consecutive measurements.
In addition, corneal asphericities (Q) at 6.0, 7.0 and 8.0 mm were calculated for each patient.
Capsular biocompatibility
assessment
Digital photographs using retro-illumination were obtained with a Tomey video slitlamp to evaluate posterior capsu-lar opacification.
All digital images were transferred to a personal computer and stored on a hard disk for later evaluation. All findings were analysed by the same observer. The inten-sity of central posterior capsular opaci-fication (behind the IOL optic) was subjectively scored from zero to 4: 0 = none, 1 = minimal, 2 = mild, 3 = moderate, 4 = severe, as previously described.13
Statistical analysis
This study was designed to show the differ-ences in post-operative vision and visual acuity between three different lenses. The main outcome was the difference between groups in the mean change from pre-operative to post-operative value of distance-corrected intermediate vision. Assuming a difference of at least two logMAR lines (10 letters) with a standard deviation of 0.15 between groups, 20 patients in each group were required for an 80 per cent power and 0.05 alpha level. In all patients, the post-operative follow-up of the parameters evaluated in the study was set at six months.
The main parameters evaluated included: the visual parameters (spheri-cal equivalent, sphere, cylinder, uncor-rected distance vision and distance VA at high contrast, VA at low contrast, distance-corrected near vision, near VA, uncorrected intermediate vision, distance-corrected intermediate vision, contrast sensitivity), the aberration para-meters (HOA RMS, coma RMS, trefoil RMS, spherical RMS and Zernike coeffi-cient of spherical aberration) and topo-graphic parameters (Q).
The demographic parameters evaluated were age and gender.
The visual parameters (expressed as logMAR), the aberrometric and topo-graphic parameters were summarised as mean and standard deviation (SD) in the tables and as mean and standard error (SE) in the figures. The qualitative vari-ables were summarised as frequency and
percentage. The results were reported separately for each of the three lenses (SA60D3, SN6AD3 and SN6AD1). The Shapiro–Wilk test was performed to verify normal distribution.
Kruskal–Wallis test was applied for assessing the comparison of the quantita-tive variables between three groups and Kruskal–Wallis post hoc analysis was used to determine whether there were pairwise differences.
Defocusing curves comparing three IOLs were obtained plotting the mean of VA with respect to 15 different values of defocus (from +2.00 D to -5.00 D).
All statistical tests were evaluated at an alpha level of 0.05. Statistical analysis was performed using SPSS®Advanced
Statisti-cal 11.0 software (SPSS Inc, Chicago, IL, USA).
RESULTS
Demographic characteristics
In the SN60D3 group, the mean age was 64.4⫾ 6.11 years (range 60 to 74 years), in the SN6AD3 group it was 67.6⫾ 5.32 years (range 60 to 74 years) and in the SN6AD1 group the age was 66.8⫾ 5.54 years (range 60 to 73 years).The mean ages were not statistically different among the three groups.
Visual and refractive outcomes
At six months the mean spherical equiva-lent, astigmatism, sphere, uncorrected distance vision and VA did not show statistically significant differences among the three groups (Table 2).The distance VA at low contrast progres-sively decreased from 50 to 12.5 per cent contrast in the three groups with lower values under mesopic conditions com-pared to photopic conditions (Figure 1). The distance VA at all percentages of con-trast in photopic and scotopic conditions was not significantly different among the three groups.
The distance-corrected near vision was 0.02⫾ 0.04 logMAR in the SN60D3 group, 0.02 ⫾ 0.05 logMAR in the SN6AD3 group and 0.01 ⫾ 0.03 logMAR in the SN6AD1 group (p = 0.822). The near VA was 0.0 logMAR in 100 per cent of cases in all three groups.
The uncorrected intermediate vision and distance-corrected intermediate vision were respectively 0.29 ⫾ 0.10 and 0.26⫾ 0.07 in the SN60D3 group, 0.26 ⫾ 0.05 and 0.22⫾ 0.09 in the SN6AD3 group and 0.21 ⫾ 0.05 and 0.04 ⫾ 0.05 in the
Variable SA60D3 (n= 20) SN6AD3 (n= 20) SN6AD1 (n= 20) p-valuea SE (D) -0.04⫾ 0.32 -0.27⫾ 0.33 0.03⫾ 0.50 0.251 Sphere (D) 0.15⫾ 0.21 -0.06⫾ 0.21 0.03⫾ 0.09 0.099 Cylinder (D) -0.28⫾ 0.59 -0.33⫾ 0.59 -0.38⫾ 0.68 0.873 UDV (logMAR) 0.13⫾ 0.11 0.13⫾ 0.27 0.19⫾ 0.15 0.317 VA (logMAR) 0.01⫾ 0.09 -0.04⫾ 0.10 0.03⫾ 0.13 0.161 UIV 80 cm (logMAR) 0.29⫾ 0.10 0.26⫾ 0.05 0.21⫾ 0.33* 0.027 DCIV 80 cm (logMAR) 0.26⫾ 0.07 0.22⫾ 0.09 0.04⫾ 0.05* < 0.001 DCNV 40 cm (logMAR) 0.02⫾ 0.04 0.02⫾ 0.05 0.01⫾ 0.03 0.822
aKruskal–Wallis test; * p= 0.05 Kruskal–Wallis post hoc test versus SA60D3.
SE: spherical equivalent, UDV: uncorrected distance vision, VA: distance visual acuity, UIV: uncorrected intermediate vision, DCIV: distance corrected intermediate vision, DCNV: distance corrected near vision.
Table 2. Visual parameters for the three groups of lenses at six months after surgery, expressed as mean⫾ SD
SN6AD1 group. Significant differences among groups were observed for uncor-rected (p = 0.027) and distance-coruncor-rected (p< 0.001) intermediate vision.
The defocus curve showed a good func-tional capacity for distant and near vision, with a slight visual decline in the middle distances with some differences in the three groups for intermediate and near distances (Figure 2). Near vision at 40 cm was comparable in the three groups and
at 33 cm was significantly better in the SN60D3 and SN6AD3 groups compared to the SN6AD1 group (p = 0.005). Inter-mediate vision was significantly better at 66.6 cm (p = 0.05) and at 50 cm (p = 0.006) in the SN6AD1 group compared to groups SN60D3 and SN6AD3.
The depth of focus was 3.00 D in the SN60D3 group and 2.50 D in the SN6AD3 and SN6AD1 groups. The amplitude of functional vision (0.3 logMAR or better)
was 2.50 D in the SN60D3 group (from optical infinity to 25 cm) with a functional vision worse than 0.3 logMAR from 100 cm to 50 cm and 2.00 D in the SN6AD3 group (from optical infinity to 25 cm) with a functional vision worse than 0.3 from 100 cm to 50 cm and at 28.5 cm and 2.00 D in the SN6AD1 group with a functional vision worse than 0.3 from 100 cm to 66 cm and from 33 to 25 cm.
Contrast sensitivity
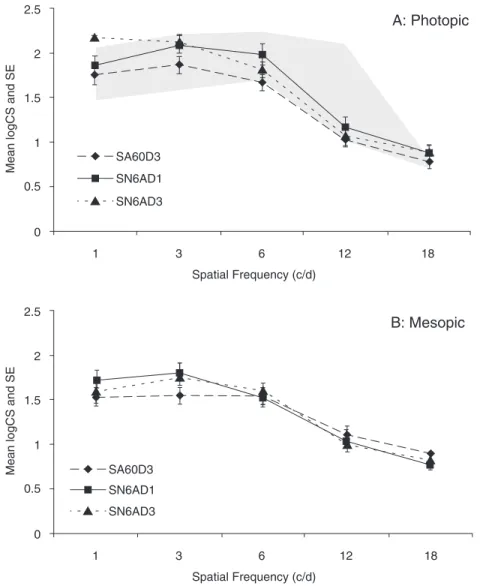
The mean values of contrast sensitivity at all spatial frequencies under photopic and mesopic conditions were not significantly different among the three groups. Under photopic conditions at 1.05 cpd, 18 per cent of patients of the SN60D3 group, none of the patients of the SN6AD3 group and 13 per cent of the SN6AD1 group were below the normal range, at 3.0 cpd, nine per cent of the SN60D3 group, and none of the SN6AD3 and SN6AD1 groups, at 6.0 cpd, 55 per cent of the SN60D3 group, 22 per cent of the SN6AD3 group and 25 per cent of the SN6AD1 group, at 12.0 cpd, 36 per cent of the SN60D3 group, 22 per cent of the SN6AD3 group and 13 per cent of the SN6AD1 group and at 18.0 cpd, 64, 33 and 38 per cent, respectively (Figure 3).
Ocular and corneal
wavefront error
Post-operatively RMSs of corneal and total ocular higher-order aberrations and of coma and trefoil aberrations were not sig-nificantly different in the three groups. The RMS of ocular spherical aberration was significantly lower in the SN6AD3 group (0.07 ⫾ 0.05 mm) and SN6AD1 group (0.05 ⫾ 0.03 mm) compared to the SN60D3 group (0.12⫾ 0.05 mm) (p = 0.048). The RMS of corneal spherical aberration was significantly lower in the SN60D3 group compared to the SN6AD3 and SN6AD1 groups (Table 3).
Capsular biocompatibility
No patient showed central posterior capsular opacification and no Nd-YAG (neodymium-yttrium aluminum garnet) capsulotomy was performed in any patient. 0.45 0.40 0.35 0.30 0.25 0.20 0.15 0.10 0.05 0.00 50 25 12.5 A
Percentage contrast of visual target
V A photopic (logMAR) p=0.481 p=0.242 p=0.730 SA6OD3 SN6AD1 SN6AD3 0.45 0.40 0.35 0.30 0.25 0.20 0.15 0.10 0.05 0.00 50 25 12.5 B
Percentage contrast of visual target
V A me s opic (logMAR) p=0.796 p=0.688 p=0.943 SA6OD3 SN6AD1 SN6AD3
Figure 1. Distance visual acuity (VA) at 50, 25 and 12.5 per cent of contrast in photopic (A) and mesopic (B) conditions for the three groups of lenses. Values are mean and standard error of logMAR VA. The p-values are the results obtained with Kruskal–Wallis test for comparison between groups.
DISCUSSION
Multifocal IOLs provide greater inde-pendence from spectacles than monofocal IOLs.2
Recent AcrySof ReSTOR hybrid diffractive-refractive models with spherical and aspheric design and +3.00 or +4.00 near additions have proven to enable vision for several distances in several studies.
The AcrySof ReSTOR +4.00 both with aspheric and spherical designs demon-strated good results for far and near with distant and near VA of 0.0 logMAR or better in the majority of studies.5,8
Because of the diffractive design of ReSTOR +4.00 lenses, as in the other dif-fractive IOLs, two principal focal points are created with a decline of visual capac-ity for intermediate distances.
The intermediate vision was reported to vary between 0.20 to 0.30 logMAR at 50 cm and between 0.30 and 0.40 logMAR at 60 and 70 cm with the spherical model. The aspheric model showed better results for intermediate vision.5,11
The aspheric AcrySof ReSTOR +3.00 demonstrated overlapping results com-pared to the ReSTOR +4.00 for far vision.
For near vision, the preferred working distance was greater for the ReSTOR +3.00 with better near VA at 40 cm com-pared to ReSTOR +4.00.11For closer
dis-tances, such as 30 cm near VA was better for ReSTOR +4.00 compared to ReSTOR +3.00.
According to published studies interme-diate VA varied from -0.12 to 0.07 logMAR at 50 cm, from 0.02 to 0.16 at 60 cm and from 0.11 to 0.19 at 70/80 cm.5,11
In our study, the three groups showed good far and near VA without statisti-cally significant differences between the lenses. The percentage of patients with distance VA of 0.1 logMAR or better was 88.8 per cent for groups 1 and 2 and 87.5 per cent for group 3 and 0.3 logMAR or better in all patients in all three groups.
The near vision with distance correction at 40 cm was 0.0 logMAR in all three groups and at the defocus curve at a closer Defocus in dioptres logMAR 0.9 0.8 0.7 0.6 0.5 0.4 0.3 0.2 0.1 0 -5 -4.5 -4 -3.5 -3 -2.5 -2 -1.5 -1 -0.5 0 0.5 1 1.5 2 SN6AD1 SA60D3 SN6AD3 p=0.05 p=0.004 p=0.005 p=0.006 p=0.05
Figure 2. Visual acuity (VA) at different levels of defocus for the three groups of lenses. Values are mean and standard error of logMAR VA. The p-values are the results obtained with Kruskal–Wallis test for comparison between groups at each value of defocus. Variable SA60D3 (n= 20) SN6AD3 (n= 20) SN6AD1 (n= 20) p-valuea Q (6.0 mm) -0.25⫾ 0.16 -0.08⫾ 0.09 -0.10⫾ 0.17 0.083 Q (7.0 mm) -0.29⫾ 0.13 -0.13⫾ 0.09 -0.18⫾ 0.16 0.062 Q (8.0 mm) -0.36⫾ 0.10 -0.19⫾ 0.09* -0.27⫾ 0.13 0.013 Corneal RMS HOA (Z3-/Z4-) (6.0 mm) 0.10⫾ 0.05 0.10⫾ 0.02 0.12⫾ 0.03 0.251 RMS Z31(6.0 mm) 0.05⫾ 0.05 0.03⫾ 0.02 0.04⫾ 0.02 0.404 RMS Z33(6.0 mm) 0.03⫾ 0.03 0.03⫾ 0.03 0.03⫾ 0.02 0.993 RMSZ40(6.0 mm) 0.05⫾ 0.02 0.08⫾ 0.02 0.09⫾ 0.04* 0.010 Ocular RMS HOA (Z3-/Z4-) (5.0 mm) 0.31⫾ 0.11 0.30⫾ 0.14 0.32⫾ 0.10 0.917 RMS Z31(5.0 mm) 0.16⫾ 0.05 0.12⫾ 0.07 0.10⫾ 0.02 0.064 RMS Z33(5.0 mm) 0.18⫾ 0.09 0.23⫾ 0.11 0.29⫾ 0.11 0.161 RMS Z40(5.0 mm) 0.12⫾ 0.05 0.07⫾ 0.05 0.05⫾ 0.03* 0.048
aKruskal–Wallis test; * p= 0.05; Kruskal–Wallis post hoc test versus SA60D3.
Table 3. Aberrometric and asphericity parameters for the three groups of lenses at six months after surgery, expressed as mean⫾ SD
distance of 33 cm, near vision was signifi-cantly better in the aspheric and spherical MIOLs +4.00 compared to MIOLs +3.00 (p = 0.005).
The distance-corrected intermediate vision at 80 cm was better in group 3 (0.04 ⫾ 0.05) compared to group 1 (0.26 ⫾ 0.07) or 2 (0.22⫾ 0.09) (p < 0.001) and at the defocus curve distance-corrected inter-mediate vision was significantly better at 66.6 cm (p = 0.05) and at 50 cm (p = 0.006) in group 3 compared to groups 1 and 2.
The quality of vision after MIOL implant has been another important issue in the last decades because after MIOLs implant visual disturbances such as reduced contrast sensitivity, degradation of night vision and halos were reported.1,2
Some technical innovations such as aspheric design of the optic, hybrid diffractive-refractive profile and apodisa-tion of diffractive steps were introduced to improve optical quality of the IOL and thus visual performance of patients implanted with MIOLs.
ReSTOR MIOLs particularly with aspheric profile showed good quality of vision in terms of contrast sensitivity and subjective symptoms comparable to mono-focal IOLs.5,11,13–17
No significant differences in quality of vision were observed between ReSTOR +3.00 and +4.00, both with aspheric profiles.11
In our study, the mean values of con-trast sensitivity at all spatial frequencies under photopic and mesopic conditions were not significantly different among the three groups and were within normal range. Nevertheless, under photopic con-dition at 6.0, 12.0 and 18.0 cpd a higher percentage of patients with spherical ReSTOR +4.00 were below the normal range compared to aspheric ReSTOR +4.00 and +3.00.
A low amount of spherical aberration with the spherical and aspheric ReSTOR +4.00 and, more recently, with the aspheric +3.00 with lower values of spheri-cal aberration for the aspheric com-pared to the spherical design have been reported.11,13,17–19
In our study, the three groups did not differ for RMS of corneal and total ocular higher-order aberrations, coma and trefoil aberrations. The RMS of ocular spherical aberration was significantly lower in the aspheric IOL groups compared to the spherical IOL group. A lower value of corneal spherical aberration in the spheri-cal MIOL group implied an even higher value of internal spherical aberration in the spherical group compared to the other two groups.
The good visual performance of the three IOLs without significant differences of vision quality as shown by the results of low-contrast VA and contrast sensitivity is probably related to an equal amount of total ocular higher-order aberrations even though the spherical aberration was sig-nificantly different between spherical and aspheric groups.
Some authors evidenced a higher amount of third-order aberrations, when aspheric IOLs were decentred compared to spherical IOLs, demonstrating a limita-tion of correcting spherical aberralimita-tion with aspheric IOLs, when correct
position-1 3 6 12 18 0 1 2 0.5 1.5 2.5 Spatial Frequency (c/d)
A: Photopic
Me a n logC S a nd S E SA60D3 SN6AD1 SN6AD3 1 3 6 12 18 0 1 2 0.5 1.5 2.5 Spatial Frequency (c/d)B: Mesopic
Me a n logC S a nd S E SA60D3 SN6AD1 SN6AD3Figure 3. Contrast sensitivity functions for the three groups of lenses expressed as logCS and standard error: photopic (85 cd/m2) (A) and mesopic (5 cd/m2) (B). The
ing of the IOL was not obtained because of decentration and/or tilt.20–23
In our study, the aspheric SN6AD3 and SN6AD1 IOL groups showed a slightly higher value of ocular third-order trefoil aberrations compared to the SN60D3 IOL group but it was not statistically significant. We did not evaluate lens decentration and tilt and thus we cannot establish a correlation between eventual IOL mis-alignment and third-order aberrations.
The main limitations of the study are related to the lack of control groups implanted with monofocal spherical and aspherical IOLs to better highlight differ-ences in visual and optical performance compared to MIOLs and the lack of the measurement of IOL tilt/decentration, so as to relate the higher-order aberration pattern particularly of third-order to IOL position and the lack of randomisation of the defocus curve measurements that would make more reliable evaluation of the amplitude of pseudo-accommodation. Moreover, there have been some con-cerns regarding the accuracy of measure-ments of higher-order aberrations with the Hartmann–Shack (H-S) sensors in eyes implanted with a MIOL. It has been pointed out that diffractive IOL zones may be under-sampled and/or inadequately reconstructed using conventional H-S technology.24,25
This limitation of Shack–Hartmann wavefront sensors for the measurement of higher-order aberrations is thought to be imposed by the density of the sampling distribution of the instruments’ lenslet array. In our study the aberrometer was a Wasca wavefront analyser aberrometer with 1,452 lenslets for 9.0 mm of analysis —the highest number of lenslets among the commercially available ocular wave-front sensors, as previously clarified.26
Moreover, our results confirm that these aspheric MIOLs analysed in the study, created to induce low spherical aberra-tions, are related to a lower amount of spherical aberration compared to the spherical model, thus demonstrating a reliable analysis of symmetrical spherical aberration.
In conclusion, ReSTOR MIOLs +4.00 and +3.00 provided good distant and near
vision with better vision at intermediate distances for +3.00 compared to +4.00. All three lenses showed good quality of vision and the ReSTOR +4.00 with aspheric profile and +3.00 revealed lower spherical aberration error compared to the spheri-cal +4.00.
ACKNOWLEDGMENTS
The authors would like to thank Luca Vec-chiarino MD and Peter Mattei MD PhD for their contribution to the critical revision of the article.
REFERENCES
1. Claoué C, Parmar D. Multifocal intraocular lenses. Dev Ophthalmol 2002; 34: 217–237.
2. Cochener B, Lafuma A, Khoshnood B, Courouve L, Berdeaux G. Comparison of outcomes with multifocal intraocular lenses: a meta-analysis. Clin Ophthalmol 2011; 7: 45–56.
3. Buznego C, Trattler WB. Presbyopia-correcting intraocular lenses. Curr Opin Ophthalmol 2009; 20: 13–18.
4. de Vries NE, Webers CA, Verbakel F, de Bra-bander J, Berendschot TT, Cheng YY, Doors M et al. Visual outcome and patient satisfaction after multifocal intraocular lens implantation: aspheric versus spherical design. J Cataract Refract Surg 2010; 36: 1897–1904.
5. de Vries NE, Webers CA, Montés-Micó R, Ferrer-Blasco T, Nuijts RM. Visual outcomes after cata-ract surgery with implantation of a +3.00 D or +4.00 D aspheric diffractive multifocal intraocular lens: Comparative study. J Cataract Refract Surg 2010; 36: 1316–1322.
6. Alfonso JF, Puchades C, Fernández-Vega L, Montés-Micó R, Valcárcel B, Ferrer-Blasco T. Visual acuity comparison of 2 models of bifocal aspheric intraocular lenses. J Cataract Refract Surg 2009; 35: 672–676.
7. Ngo C, Singh M, Sng C, Loon SC, Chan YH, Thean L. Visual acuity outcomes with SA60D3, SN60D3 and ZM900 multifocal IOL implantation after phacoemulsification. J Refract Surg 2010; 26: 177– 182.
8. Santhiago MR, Netto MV, Espindola RF, Mazurek MG, Gomes Bde A, Parede TR, Harooni H et al. Comparison of reading performance after bilat-eral implantation of multifocal intraocular lenses with +3.00 or +4.00 diopter addition. J Cataract Refract Surg 2010; 36: 1874–1879.
9. Lane SS, Javitt JC, Nethery DA, Waycaster C. Improvements in patient-reported outcomes and visual acuity after bilateral implantation of multi-focal intraocular lenses with +3.0 diopter addition: multicenter clinical trial. J Cataract Refract Surg 2010; 36: 1887–1896.
10. Hayashi K, Manabe S, Hayashi H. Visual acuity from far to near and contrast sensitivity in eyes with a diffractive multifocal intraocular lens with a low addition power. J Cataract Refract Surg 2009; 35: 2070–2076.
11. Alfonso JF, Fernández-Vega L, Puchades C, Montés-Micó R. Intermediate visual function with different multifocal intraocular lens models. J Cataract Refract Surg 2010; 36: 733–739.
12. Ginsburg AP. A new contrast sensitivity vision test chart. Am J Optom Physiol Opt 1984; 61: 403–407. 13. Toto L, Falconio G, Vecchiarino L, Scorcia V, Di
Nicola M, Ballone E, Mastropasqua L. Visual per-formance and biocompatibility after implantation of two multifocal diffractive IOLs: six-month com-parative study. J Cataract Refract Surg 2007; 33: 1419–1425.
14. Souza CE, Gerente VM, Chalita MR, Soriano ES, Freitas LL, Belfort R Jr. Visual acuity, contrast sen-sitivity, reading speed, and wavefront analysis: pseudophakic eye with multifocal IOL (ReSTOR) versus fellow phakic eye in non-presbyopic patients. J Refract Surg 2006; 22: 303–305. 15. Rocha KM, Chalita MR, Souza CE, Soriano ES,
Freitas LL, Muccioli C, Belfort R Jr. Postoperative wavefront analysis and contrast sensitivity of a multifocal apodized diffractive IOL (ReSTOR) and three monofocal IOLs. J Refract Surg 2005; 21: S808-S812.
16. Cerviño A, Hosking SL, Montés-Micó R, Alió JL. Retinal straylight in patients with monofocal and multifocal intraocular lenses. J Cataract Refract Surg 2008; 34: 441–446.
17. Cionni RJ, Osher RH, Snyder ME, Nordlund ML. Visual outcome comparison of unilateral versus bilateral implantation of apodized diffractive multifocal intraocular lenses after cataract extrac-tion: prospective 6-month study. J Cataract Refract Surg 2009; 35: 1033–1039.
18. Zelichowska B, Rekas M, Stankiewicz A, Cerviño A, Montés-Micó R. Apodized diffractive versus refrac-tive multifocal intraocular lenses: optical and visual evaluation. J Cataract Refract Surg 2008; 34: 2036–2042.
19. Ortiz D, Alió J L, MD, Bernabéu G, Pongo V. Optical performance of monofocal and multifocal intraocular lenses in the human eye. Cataract Refract Surg 2008; 34: 755–762
20. Dietze HH, Cox MJ. Limitations of correcting spherical aberration with aspheric intraocular lenses. J Refract Surg 2005; 21: S541-S546. 21. Bellucci R, Morselli S, Pucci V. Spherical
aberra-tion and coma with an aspherical and a spherical intraocular lens in normal age-matched eyes. J Cataract Refract Surg 2007; 33: 203–209 22. Taketani F, Matuura T, Yukawa E, Hara Y.
Influ-ence of intraocular lens tilt and decentration on wavefront aberrations. J Cataract Refract Surg 2004; 30: 2158–2162.
23. Yang HC, Chung SK, Baek NH. Decentration, tilt, and near vision of the array multifocal intraocular lens. J Cataract Refract Surg 2000; 26: 586–589. 24. Charman WN, Montés-Micó R, Radhakrishnan H.
Problems in the measurement of wavefront aber-ration for eyes implanted with diffractive bifocal and multifocal intraocular lenses. J Refract Surg 2008; 24: 280–286.
25. Gatinel D. Limited accuracy of Hartmann-Shack wavefront sensing in eyes with diffractive multifo-cal IOLs. J Cataract Refract Surg 2008; 34: 528. 26. Toto L, Falconio G, Vecchiarino L, Scorcia V, Di
Nicola M, Ballone E, Mastropasqua L. Limited accuracy of Hartmann-Shack wavefront sensing in eyes with diffractive multifocal IOLs. Author reply. J Cataract Refract Surg 2008; 34: 528–529.