University of Eastern Piedmont
"Amedeo Avogadro"
Department of Translational Medicine
PhD in Clinical and Experimental Medicine
PhD Coordinator: Prof. MARISA GARIGLIO
Cycle XXVI
MUSCULAR MODIFICATIONS IN CHRONIC SPINAL CORD
INJURED PATIENTS
PhD Student: Dr. MARCO INVERNIZZI
Tutor: Prof. CLAUDIO MOLINARI (SSD: BIO/09)
SSD: MED/34
ABSTRACT
In this thesis muscular modifications in chronic spinal cord injured patients have been investigated. Using a translational approach, a mini-invasive muscular biopsy technique in Spinal Cord Injured patients has been validated. Moreover, the possible role of circulating levels of myostatin as a possible candidate biomarker for muscular modifications in chronic SCI patients has been evaluated. Lastly, the molecular modifications of PGE2 pathway on muscular specimens of chronic SCI patients has
been studied.
All material is original and based on direct Author ’s experience.
RIASSUNTO
In questa tesi vengono indagate le modificazioni muscolo-scheletriche in pazienti affetti da mielolesione cronica. In un’ottica traslazionale, si è affrontata la problematica in oggetto partendo dalla validazione di una metodica di prelievo bioptico mini-invasivo muscolare su paziente, alla determinazione di un possibile biomarker serico di modficazione muscolare, la miostatina. Inoltre si è iniziato a investigare il ruolo del PGE2 come possibile mediatore delle modificazioni muscolo
scheletriche nei pazienti mielolesi cronici.
PUBLICATIONS
This thesis contains material which can be found in the following papers:
1: Carda S, Cisari C, Invernizzi M. Sarcopenia or muscle modifications in neurologic diseases: a lexical or pathophysiological difference? Eur J Phys Rehabil Med. 2013 Feb;49(1):119-30. Review. PubMed PMID: 23575206.
2: Invernizzi M, Cisari C. Sarcopenia and muscular modifications in disabling pathologies of the elderly from the physical and rehabilitation medicine: point of view. Eur J Phys Rehabil Med. 2013 Feb;49(1):107-9. PubMed PMID: 23575204.
3: Invernizzi M, Carda S, Cisari C; on behalf of Società Italiana per lo Studio della Sarcopenia e della Disabilità Muscolo-Scheletrica (SISDIM). Possible synergism of physical exercise and ghrelin-agonists in patients with cachexia associated with chronic heart failure. Aging Clin Exp Res. 2013 Dec 18. [Epub ahead of print].
Moreover, unpublished findings are reported as well. These novel data have been submitted to the Journal of Bone and Mineral Metabolism and European Review for Medical and Pharmacological Sciences.
“Prendi la comprensione dell’oriente e la scienza
dell’occidente, e poi cerca.”
Georges Ivanovič Gurdjieff
(1872-1949)
ACKNOWLEDDGMENTS
The Author would like to thank:
Prof. Claudio Molinari, Prof. Filippo Renò, Prof. Carlo Cisari, Dott. Stefano Carda, Dott.ssa Manuela Rizzi, Dott. Alessio Baricich, Dott.ssa Emmanuela Ferrari,
CONTENTS
INTRODUCTION ... page 8
1 SPINAL CORD INJURY page 8
1.1 DEFINITION page 8
1.2 EPIDEMIOLOGY page 8
2 SARCOPENIA and MUSCLE MODIFICATIONS in
NEUROLOGIC DISEASES page 11
2.1 DEFINITION page 11
2.2 MUSCLE LOSS and CHANGES AFTER SCI page 12
2.3 PATHOPHYSIOLOGY OF ATROPHY IN CNS DISEASES page 14
2.3.1 Role of Myostatin page 15
2.3.2 Role of TNF-α page 15
2.3.3 Role of Oxidative stress page 16
2.3.4 Role of Decreased protein synthesis page 17 2.3.5 Role of Increased Proteolysis-Autophagy page 18
3 BONE AND MUSCLE NETWORK page 22
3.1 BONE-MUSCLE CROSSTALK page 22
3.2 PGE2 and Cyclooxygenase page 23
3.3 SCLEROSTIN - UNLOADING MEDIATOR IN BONE page 28 3.4 MYOSTATIN - REGULATOR OF MUSCLE CELLS
PROLIFERATION AND DIFFERENTIATION page 28
STUDY DESIGN ... page 30 AIM OF THE STUDY ... page 34 MATERIALS AND METHODS ... page 35 RESULTS ... page 42 DISCUSSION ... page 55 FUTURE PERSPECTIVES ... page 66 CONCLUSIONS ... page 67 REFERENCES ... page 70
ABBREVIATIONS
SCI: Spinal Cord Injury
TSCI: Traumatic Spinal Cord Injury PG: Prostaglandins
PGE2: Prostaglandin E 2 COX: Cyclooxygenase
EP: Prostaglandind E recepor CSA: Cross sectional area
LRP: Low-density lipoprotein receptor-related protein 25(OH)D: 25 hydroxy vitamin D
IGF-I: Insulin Growth Factor I CRP: C reactive protein
BALP: Bone specific alkalyne phosphatase CTX: Collagen Beta crosslaps
iCa: Ionized Calcium P: Phosphorus
MRFs: Myogenic regulatory factors TGF: Transforming growth factor MCP: Muscular cells precursors GPCRs: G protein coupled receptors CNS: Central nervous system
LTB4: Leukotriene B4
eGFR: estimated glomerular filtration rate PTH: parathyroid hormone
INTRODUCTION
1
SPINAL CORD INJURY 1.1 DEFINITIONThe term spinal cord injury (SCI) refers to any injury to the spinal cord that is caused by trauma instead of disease [1]. Depending on where the spinal cord and nerve roots are damaged, the symptoms can vary widely, from pain to paralysis and incontinence [2-3]. Spinal cord injuries are described at various levels from "incomplete", which can vary from having no effect on the patient to a "complete" injury which means a total loss of function.
Spinal cord injuries are most often traumatic (TSCI), caused by lateral bending, dislocation, rotation, axial loading, and hyperflexion or hyperextension of the cord or cauda equina. Among the most common cause of SCIs are included: motor vehicle accidents, falls, work-related accidents, sports injuries, and penetrations such as stab or gunshot wounds [4]. SCIs can also be of a non-traumatic origin, as in the case of cancer, infection, intervertebral disc disease, vertebral injury and spinal cord vascular disease [5].
1.2 EPIDEMIOLOGY US Data
Epidemiological data about TSCI in the United States show a trend of increase of the age-adjusted incidence rate of this pathology. Thus, from an incidence of 29.1 per
million population in 1970 there has been a raise to 42.8 per million population in 1977, according to the National Hospital Discharge Survey [6, 7].
This positive trend has been confirmed also by more recent papers, showing an overall incidence of about 40 cases per million population per year and 12000 new cases per year with a total of 270000 TSCI survivors [8-10]. However these data suggest also an increase in mean age at injury ranging from 28.7 years in 1973-79 to 40.2 in 2005-2009.
A recent paper showed a further increase in the overall incidence of TSCI of about 56.4 per million adults over the study period, confirming also the previously increased age at the time of lesion with a mean value of 50.4 years [11]. Lastly, along with the raise of age the incidence reaches the dramatic value of 79.4 per million older adults in 2007 and 87.7 by the end of 2009, confirming the data previously obtained [11]. Moreover other data about complete/incomplete lesion, lesion etiology, rehabilitative setting and costs have been provided [11].
Italian Data
In Italy, the incidence of SCI is estimated, by surveys that are either retrospective or lack case mix, to be 18 to 20 per million [13-16].
Moreover, two large observational studies in the last few years addressed this issue. They were performed by the same group called GISEM (Gruppo Italiano Studio Epidemiologico Mielolesioni Study). They showed an increased incidence of SCI in men (a sex ratio of 4:1) and a rather low mean age compared to more recent studies previously carried on in the US (38.5 years). A total of 368 (53.8%) patients were involved in a road collision ( 36.8% of all from automobile collisions; 13.8% derived from motorcycle collisions. Falls accounted for 22.6% of the SCIs; sport injuries,
7.9%; weapon wounds, mainly from gunshots that occurred during hunting rather than during episodes of violence, 1.9%; and attempted suicide, 4.3%.
2
SARCOPENIA and MUSCLE MODIFICATIONS IN NEUROLOGIC DISEASES 2.1 DEFINITIONThe reduction of bone mass and consequent limitation in mobility observed in the elderly has been generally defined as Sarcopenia for the first time in 1989 [14]. This condition is common in the elderly, since the prevalence of muscle loss is around 20% under 70 years rising up to 40% over 80 years [15]. For this reason in the last two decades the interest of researchers in sarcopenia has grown widely [16]. However at the moment, despite its spread, making a correct diagnosis of sarcopenia is quite difficult, due to the fact that in the last 20 years a wide range of definitions and diagnostic criteria have been proposed. Recently [17], there is general agreement on considering sarcopenia, in the old people, as a condition in which at least 2 of the following criteria apply: 1) low muscle mass (muscle mass ≥2 standard deviations below the mean of young subjects aged 18-39 years as reported in the third NHANES study) [15]; 2) low muscle strength; 3) low physical performance (defined as a walking speed below 0.8 m/s in the 4-m walking test) [18].
It comes well evident that this definition, which has been proposed for elderly people, has some limitations in populations with neurologic disabilities, that can limit muscle strength and gait speed. Actually, a recent paper stated that in sarcopenia mobility reduction should not be a result of conditions as otherwise defined specific diseases of muscle, peripheral vascular disease with intermittent claudication, central and peripheral nervous system disorders, or cachexia [19].
So, defining sarcopenia in people with a limited mobility due to other diseases (as chronic neurologic diseases) can be puzzling. This is the main reason for which
was significantly increased. Moreover, the amount of intramuscular fat was inversely
related to VO2 peak [18]. In this study, the modification in lean and fat mass were
assessed with dual-energy x-ray absorptiometry (DEXA), for whole-body analysis, and with CT-scan for measurement at the limbs.
2.2 MUSCLE LOSS and CHANGES AFTER SCI
In subjects with SCI, the main feature that can be observed in underlesional muscle tissue is the atrophy of muscle fibers, and then a transformation of their fiber type. As in stroke, a spinal cord lesion leads to a reduction in slow-twitch fibers (type I) and an increase of fast-twitch fibers (type IIA and IIX). A pioneering work on this field was published in 1976 by Grimby and coll. [20] who showed that vastus lateralis, soleus and gastrocnemius muscles of SCI patients were nearly all composed of type II muscle fibers.
This phenomenon can start 4-6 weeks after the injury [21], but this time may vary significantly from patient to patient. Another study found a modification in muscle fiber composition of rectus femoris between 7 and 9 months after the lesion, while at 4 months no significant modification was observed [22]. Soleus and gastrocnemius muscles in SCI patients show a similar patern, with a shift towards more rapid fibers that becomes evident after 7-8 months after the injury [23]. Castro et al. [24] showed that the fiber type shift does not occur within the first 6 months after the lesion.
So, fiber type shift is slow and progressive, and probably reaches a steady-state between 20 and 70 months after the SCI [21]. Then, after this period, the infralesional muscles are almost exclusively composed by rapid fibers [21,25,26]. These observations are not always generalizable; actually it is possible that other factors (genetic, spasticity, or other) can modify this transformation. This hypothesis has been confirmed by findings obtained in long-standing SCI patients who did not show
these alterations in muscle fibers composition [27,28]. Along with these modifications, a decline in oxidative enzymatic activity of muscle has been observed, and this phenomenon probably reflects the shift towards a faster muscle fiber composition [29].
All these pathological modifications are preceded by a severe muscle atrophy, that develops early after the spinal lesion.
Muscle atrophy is not unique for SCI, and it has been considered for a long time as mainly dependent by the absence of weight-bearing. So, researchers used different experimental models as bed rest [30] or microgravity during spaceflights [31] to study muscle atrophy after SCI. However, a spinal cord lesion differs from these models since muscles are affected not only by unloading, but reduction or absence of neuromuscular activity as well. Therefore, in SCI patients, along with a pronounced muscle atrophy, a reduced oxidative capacity and various alterations in microvasculature can be observed [22,32].
Another factor that is involved in SCI is denervation-induced atrophy, that results from injury to motoneurons in the spinal cord or to the motor nerves in the ventral roots, through which they exit. Muscles that lose innervation through this mechanism undergo a rapid wasting. Usually, the percentage of muscles that suffer complete denervation is small, but it should be remembered that many peripheral nerves receive fibers from different roots, and so partial denervation can affect different muscles [33]. This phenomenon is more clinically evident for lesions at the cervical and the lumbosacral enlargement (C4 to T1 and L2 to S3, respectively).
In patients with incomplete SCI, Gorgey et al. [34] found a reduction up to 33% in tight cross-sectional area at 6 weeks only after SCI, with an increase of intramuscular fat up to 126%; moreover, intramuscular fat progressively increased until 6 months.
In fact, in chronic complete SCI patients (mean duration of injury 8 years), intramuscular and subfascial fat can be increased up to 4 times as compared to healthy subjects, and after 8-10 years of denervation adipocytes can constitute up to 30% of the area in muscle biopsies [35].
In SCI, muscle atrophy magnitude depends from the completeness or not of the lesion as well [36]. In incomplete SCI (ASIA C and D) patients, at a mean time of 13 months from lesion, a reduction of muscle cross-sectional area of 24% to 31% (tibialis anterior and quadriceps femoris, respectively) has been measured, with a small correlation with ambulatory status (considered as the use of wheelchair or not) [36]. This reduction is nearly one half the one that can be seen in complete SCI patients [24].
2.3 PATHOPHYSIOLOGY of ATROPHY in CNS DISEASES
The pathophysiological mechanisms leading to muscle atrophy in humans are complex and not completely understood. To have a better insight about this topic, the readers are suggested to refer to some review that have been published in the last years [37-40].
However, the main mechanisms of muscle atrophy after a CNS disease can be resumed as it follows:
a. Myostatin dysfunction b. TNF-α dysfunction c. Oxidative stress
d. Decreased protein synthesis e. Increased Proteolysis-Autophagy
2.3.1. Role of Myostatin
Myostatin is a protein belonging to the TGF-β family, which is a strong negative regulator of muscle growth. Some muscle-wasting diseases as HIV-induced cachexia [41] or heart failure-related cachexia [42], for example, are characterized by increased levels of myostatin. Although myostatin levels seems to be rapidly reduced during and after exercise in both healthy subjects [43,44] and in patients with CNS injury [45], its role in disuse atrophy is not so clear.
In fact, in a rodent model of disuse atrophy, knockout mice for the myostatin gene showed an extent of muscle atrophy that was equal or greater than the one observed in wild-type mice in response to unloading [46]. In patients with SCI lasting for more than 3 months and showing muscle atrophy, myostatin mRNA levels were significantly reduced, as compared to healthy controls, while the plasmatic levels of myostatin did not differ [47]. on the contrary in stroke patients, Ryan et al. found higher mRNA levels in the paretic vastus lateralis muscle compared to controlateral healthy side in stroke survivors with hemiplegia from more than 6 months [45]. Moreover, the role of myostatin is probably more complex considering the fact that it can act only via the interaction with the activin IIB (ActIIB) receptor. This receptor is up-regulated during unloading-induced atrophy in rats [48], so the sensitivity of muscle to myostatin can be increased in this condition. In light of these considerations myostatin seems to play a role in disuse muscle atrophy, which is probably less important than in cachexia and age-related sarcopenia.
2.3.2 Role of TNF-α and TNF-superfamily cytokines
TNF-α and other cytokines as IL-1 and IL-6 are involved and increased in cachexia, suggesting a possible role in disuse muscle atrophy. TNF-α, binding on TNF receptor,
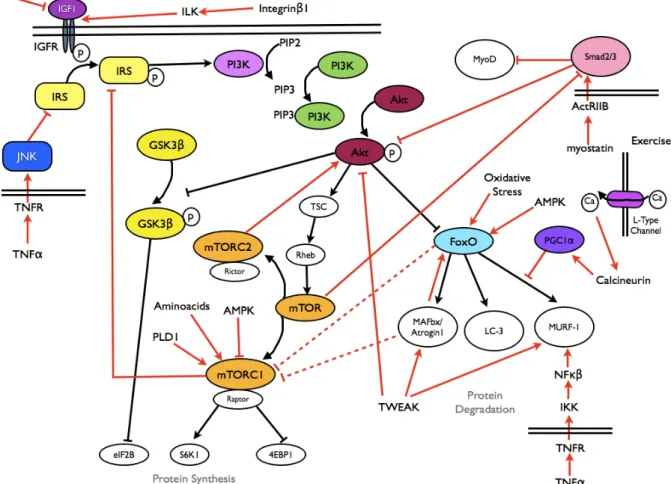
can activate an IKK-dependent pathway that in turns activates NFκB and MURF-1, thus leading to an increased proteolysis (see Fig. 1). The activation of this pathway has been demonstrated in a rodent model of disuse atrophy [49]. The NFκB transcription factor is another protein implicated in disuse muscle atrophy, even if the controlling pathway of its action has not been well elucidated in humans [50].
A member of the TNF-superfamily, TNF-related weak inducer of apoptosis (TWEAK), has shown to produce, in rodents, a more potent muscle atrophy than TNF-α [51]. TWEAK is a strong inducer of the ubiquitin-proteasome pathway and can increase the expression of atrogin-1 and MuRF1 in myotubes and inhibit the PI3K/Akt pathway [51].
It has been demonstrated in humans that TNF-α mRNA expression in paretic vastus lateralis of hemiplegic stroke survivors was increased, as compared to non-paretic controlateral side [52]. However, these findings have not been confirmed in a further, recent study [53]. So, the exact role of TNF-α in human disuse musce atrophy is still not clear.
2.3.3 Role of Oxidative stress
Another area of interest in disuse atrophy is the role of oxidative stress. During unloading, there is an activation of superoxide dismutase, with a decrease in the action of other enzymes acting on reactive oxigen species (ROS) [54]. Oxidative stress is a potent inducer of NFκB [55] and FoXO [56] signalling pathways in muscle cells, and both act on increasing protein degradation throught the ubiquitin-proteasome pathway [57]. The causal link between the mitochondrial network and denervation-induced muscle atrophy was established in 2010 by an italian research group [58], and more recently it has been demonstrated that the increase in
mitochondrial ROS production plays an important role in disuse muscle atrophy [59]. The oxydative stress is moreover, a possible target of new therapies for muscle atrophy. In fact, Min et colleagues showed in rodents that the administration of a mitochondrial-targeted antioxidant not only reduced mitochondrial reactive oxigen species, but also reduced myofiber atrophy resulting from unloading [60]. Even if oxydative stress is a relatively new and interesting area of research, this mechanism is still not proven in human disuse atrophy.
2.3.4 Role of Decreased protein synthesis: alteration of signals affecting protein synthesis (Akt/mTOR pathway)
Akt is a protein kinase that plays a central role in muscle hypertrophy and in protein synthesis. It is a part of the IGF-1 axis, that, after the phosphorilation of the Insulin Receptor Substrate, activates phospatidil-Inositol-3-Kinase and produces Phosphatidilinositol-(3,4,5)-triphosphate. This substance phosphorilates Akt and consequently activates it. Akt, in turn, activates, through phosphorilation, Tuberous Sclerosis Complex protein 1 and 2 which inhibites Ras homolog enriched in brain (Rheb), which activates mammalian target of rapamycin (mTOR). Activated mTOR forms two protein complexes, mTORC1 (binding to Raptor protein) and mTORC2 (binding to Rictor protein). mTORC1 acts as a direct activator of protein synthesis, activating the S6K1 protein, ,inhibiting the binding proteins for the eukariotic translation initiation factor 4E (4EBP1), and blocking, by phosphorilation, the GSK3β protein (which is a blocker of the eukariotic translation initiation factor 2B) [38,61]. For a brief summary of Akt/mTOR pathway see Fig. 1.
2.3.5 Role of Increased proteolysis
Probably the most relevant role in sustaining disuse atrophy is played by the increased proteolysis rather than the reduced protein synthesis. During disuse atrophy the myofibrillar component of muscle proteins (mostly actin, myosin, titin, vinculin, nebulin) is early lost. This phenomenon involves three major cellular systems:
a) the ATP-dependent ubiquitin-proteasome pathway b) the lysosomes
c) the calcium-dependent calpain system.
a. ATP-dependent ubiquitin-proteasome pathway
The ATP-dependent ubiquitin-proteasome pathway is a proteolytic system that utilizes three classes of enzymes at least, named E1, E2 and E3 [62].
This is probably the most important pathway involved in disuse atrophy of the muscle. Evidence for its role in disuse muscle atrophy have been shown for several years [63], and more recently, it has been clearly shown that in this form of muscle atrophy some proteins that act as ubiquitin-ligases (MuRF1 and MAFbx/Atrogin-1) are markedly upregulated [64-67]. At present time, MURF1 and MAFbx are among the most promising targets for designing novel drugs against disuse atrophy [68]. The ubiquitin-proteasome pathway is rapidly activated in disuse atrophy, since there is evidence, in healthy human volunteers, that the mRNA and the protein MURF1 and MAFbx levels increase after 4 days only of unloading [69]. The ubiquitin-proteasome pathway in disuse atrophy seems to be more activated in young adults compared to what observed in elderly adults [69].
b. Lysosome-dependent proteolysis
Lysosome is another component involved in proteolysis. In vitro experiments have clearly shown that in disuse atrophy and in unloading there is an increased level of mRNA coding for cathepsins, one of the most important enzymes in lysosomes [48]. However, their role in disuse atrophy is not so straightforward, since it has been shown that, if an atrophying muscle is treated with a cathepsin-inhibiting agent, the degradation rate of the myofibrillar component of muscle is not affected [70]. For this reason, the lysosomal system seems to play a very important role in degrading membrane proteins, ione channels and receptors.
c. Calcium-dependent calpain system
Even if actin and myosin, which are the most represented proteins in skeletal muscle, can not be degraded by calpains, this calcium-dependent system is capable to act on scaffolding proteins of muscle as titin, vinculin, C-protein and nebulin [71], and its role has been demonstrated in a murine model of disuse atrophy [72]. What makes this system important in skeletal muscle atrophy is that, even if the ubiquitin-proteasome pathway is probably the most important one, myofibrillar protein degradation is not able to start if the scaffolding and assembly proteins are not degraded.
In muscle atrophy dependent from neurological diseases as stroke an SCI, the exact role and timing of action of the aforementioned systems is still not clear.
While in acute phase after CNS lesion it is highly probable that multiple events take place leading to muscle atrophy [73], in chronic phase a new steady state is probably reached, with an inhibition of muscle autophagy mechanisms. In fact, in SCI and stroke survivors, two different research groups found that the ubiquitin-proteasome pathway activity was comparable to the one observed in age-matched controls
[58,74]. Only Ryan and colleagues found an increase in muscle myostatin in the paretic side of chronic stroke survivors [45], that positively responded to active exercise.
The only study performed during the first week after SCI, showed an increase in gene expression of Atrogin-1, MURF1, UBE3C (an E3 ligase) and PSMD11 (a component of 26S proteasome, which is a part of the proteinase complex responsible for cleavage of peptides in the ATP/ubiquitin-dependent process), along with an increase of the gene expression for metallothioneins 1A, 1F and 1H and of the secretory leucocyte protease inhibitor (SLPI). However, the western blot analysis revealed that only PSMD11 protein level was increased following SCI [75].
In a study carried on patients with amyotrophic lateral sclerosis, while the mRNA for Atrogin-1 and MuRF1 was increased along with a reduction in Akt activity, the levels of protein content of p70s6k and GSK-3β were not changed [76]. This suggests that
other transcription factors or other signaling pathways can be involved in the pathophysiology of muscle atrophy.
In conclusion at present time not only the exact mechanism of disuse atrophy after a CNS lesion is unclear, but also the time at which different systems are over/ underactivated is not completely known.
Fig. 1 - Main pathways involved in muscle metabolism (taken From Carda S, Invernizzi M 2013)
3
BONE and MUSCLE NETWORK 3.1 - BONE-MUSCLE CROSSTALKThe evidence of a biochemical crosstalk between different body tissues has been widely demonstrated, however, in last few years, a simple mechanical correlation between bone and muscle tissue has been postulated [77].
However, some pathological conditions like sarcopenia, extended bed rest and osteoporosis in absence of gravity have clearly suggested more complex pathophysiological mechanisms than just mechanical stimulation [78-80]. Recently, it has been observed that skeletal muscle behaves like an endocrine and paracrine organ, being able to produce many cytokines, called “myokines” (i.e. Il-6,8,15), after different stimuli like contraction [81-83]. These factors are emerging as key modulators of glucose and fat metabolism and of the general responses to physical activity [84-86].
Similarly, it has been widely demonstrated that bone tissue has some important endocrine functions apart from the classic ones like architectural acitivity and mineral metabolisms [87].
A key role in this endocrine activity is played by osteocytes, dendritic like cells derived from osteoblasts that lost their capacity to create new bone tissue. They are the main mechano-sensitive cell in the bone, able to up or down-regulate bone remodelling in response to mechanichal load [88]. These effects are mediated by secreted factors acting on other tissues [89]. However only in the few years it has been hypothesized that bone and muscle could be functionally related not only for
proximity aspects but also through a biochemical crosstalk sustained by these factors.
At present time only few studies, mainly performed in vitro, investigated the possible factors related in the biochemical crosstalk between muscle and bone tissue. Among these Prostaglandin E2 (PGE2) is one of the most promising, exerting potent
myogenic differentiation effects on C2C12 myoblasts as evidenced by morphological changes, robust modifications in gene expression profile, and very intriguing changes in intracellular calcium homeostasis [90].
Thus authors postulated a biunivocal crosstalk between these two tissues, in which the factors produced by osteocytes could be targeted to muscle, and muscle-derived soluble factors could be targeted to bone [90].
3.2 - PGE2 and Cyclooxygenase
PGE2 is the most physiologically abundant eicosanoid, which is produced
predominantly from arachidonic acid by cyclooxygenase (COX) and PGEs enzymes, and found at various levels in nearly all cell types. PGE2 acts on four different
receptors named prostaglandind E recepor (EP) 1 through 4 yielding an astounding array of biological effects. Reported effects include: potent vasodilation, smooth muscle relaxation, both anti- and pro-inflammatory activities, bone resorption stimulation, synergy with LTB4, replication of AIDS virus facilitation, sleep/wake cycle
regulation, thermoregulatory activity in the CNS, LHRH release stimulation from rat median eminence, protective effect on gastric mucosa, and renal hemodynamics regulation and sodium excretion. This amount of functions makes PGE2 an invaluable
tool for research in a multitude of areas. PGE2 (Prostaglandin E2) is an inhibitor of ERK [91].
Additionally, EP receptors have been subdivided into four groups, termed EP1, EP2,
EP3 and EP4. In the early 1990s, cDNA cloning identified a family of eight G-protein
coupled receptors (GPCRs) that correspond to these pharmacologically-defined receptors [92].
As a broad generalization, EP1 and EP3 receptors mediate excitatory effects, while
EP2 and EP4 receptors mediate inhibitory effects. EP1 receptors are believed to be
coupled via regulatory G proteins to (PLC-independent) influx of extracellular Ca2+;
phosphatidylinostol hydrolysis ensures as a consequence of this influx [93]. EP3
receptors are subject to splice variance at the C-terminus [94,95] and, to date, ten isoforms have been identified across species, six of these being expressed in man [96]. These isoforms differ in their G-protein coupling thereby contributing to the wide spectrum of EP3 receptor actions: contraction of smooth muscle, enhancement of
platelet aggregation, inhibition of autonomic neurotransmitter release, inhibition of gastric acid secretion, and inhibition of fat cell lipolysis [97,98]. There is no published evidence that splice variance influences ligand affinity. EP2 and EP4 receptors
preferentially couple through Gs protein to stimulate adenylate cyclase [95]. The
functional selectivity of natural and synthetic EP4 receptor agonists has been
assessed in terms of cAMP production, Gαi1 activation and β-arrestin 2 recruitment
[99]. Both EP receptor subtypes may be present on smooth muscle cells with the latter usually showing considerably higher sensitivity to PGE2.
PGE2 is one of the major products of arachidonic acid through COX-1/2 pathways. In
the past decades, it has been related to inflammation, pain and cancer development. On the other hand, PGE2 is important in regulation of physiological functions, such as
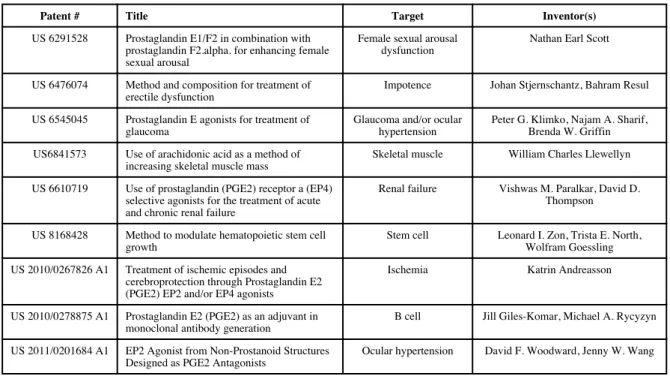
sodium and chloride transport in the kidney and smooth muscle tone, suggesting for itself or its derivatives a useful role in treatment of a number of diseases. Some patents associated with the application of PGE2 in diagnosis and therapeutics have
been summarized in Table 1 [100-108].
To date, one patent only has been filed concerning with the effect of PGs on skeletal muscle [100]. Given the extensive usage of PGE2 in disorders in other tissues, there
is a great potential for patenting the employment of PGE2 for the functional regulation
of skeletal muscle and treatment of muscle diseases, such as muscle dystrophy. Skeletal muscles are the source of “myokines” with known effects on fat and body metabolism [109]. On the other hand, bone cells, and particularly osteocytes are known to produce ATP, nitric oxide, prostaglandins (major one being PGE2),
sclerostin, fibroblast growth factor 23, MCP-3, and many other factors [110-114]. Therefore, osteocytes can be viewed as a source and potential reservoir of factors in bone with the intrinsic potential of influencing other tissues. Given the intimate relationship between bone and muscle during development and life span [115], it is reasonable to assume that bone secreted factors might influence muscle behavior and function, but this hypothesis has not yet been investigated in a detailed and systematic manner.
Muscle mass restoration depends on myofiber growth, which is facilitated by changes in protein metabolism and the reversal of atrophy-induced catabolic pathways [116]. In some cases, growth of atrophied myofibers also requires the incorporation of additional myonuclei to replace those lost during atrophy [117] and this is associated with inflammation [118]. A greater understanding of the regulation of these processes is critical for the development of therapies to enhance growth of atrophied muscle.
NIH-PA Author Manuscript
NIH-PA Author Manuscript
NIH-PA Author Manuscript
Mo et al. Page 14
Table 1
Selected Patents related with usage of PGE2 in diagnosis and therapeutics
Patent # Title Target Inventor(s)
US 6291528 Prostaglandin E1/F2 in combination with prostaglandin F2.alpha. for enhancing female sexual arousal
Female sexual arousal dysfunction
Nathan Earl Scott
US 6476074 Method and composition for treatment of erectile dysfunction
Impotence Johan Stjernschantz, Bahram Resul US 6545045 Prostaglandin E agonists for treatment of
glaucoma
Glaucoma and/or ocular hypertension
Peter G. Klimko, Najam A. Sharif, Brenda W. Griffin US6841573 Use of arachidonic acid as a method of
increasing skeletal muscle mass
Skeletal muscle William Charles Llewellyn US 6610719 Use of prostaglandin (PGE2) receptor a (EP4)
selective agonists for the treatment of acute and chronic renal failure
Renal failure Vishwas M. Paralkar, David D. Thompson US 8168428 Method to modulate hematopoietic stem cell
growth
Stem cell Leonard I. Zon, Trista E. North, Wolfram Goessling US 2010/0267826 A1 Treatment of ischemic episodes and
cerebroprotection through Prostaglandin E2 (PGE2) EP2 and/or EP4 agonists
Ischemia Katrin Andreasson
US 2010/0278875 A1 Prostaglandin E2 (PGE2) as an adjuvant in monoclonal antibody generation
B cell Jill Giles-Komar, Michael A. Rycyzyn US 2011/0201684 A1 EP2 Agonist from Non-Prostanoid Structures
Designed as PGE2 Antagonists
Ocular hypertension David F. Woodward, Jenny W. Wang
Recent Pat Biotechnol. Author manuscript; available in PMC 2013 August 03.
Table 1 - Selected Patents related with usage of PGE2 in diagnosis and therapeutics
- taken from Mo et al. [90]
Enzyme cyclooxygenase COX-2 is one of two isoforms of COX that catalyzes the rate-limiting step in the synthesis of prostaglandins, and are potent regulators of inflammation [119]. It has been demonstated that the COX-2 pathway regulates myofiber growth in mice following injury that causes extensive degeneration [120]. Growth of regenerated myofibers was attenuated by the COX-2-selective inhibitor SC-236 as well as in COX-2 -/- mice [120]. This effect was associated with the presence of fewer myoblasts within regenerating muscles, implicating adverse effects on myoblasts as a potential mechanism behind attenuated myofiber growth.
Regenerating muscles from SC-236-treated mice and COX-2 -/- mice also exhibited
Whether COX-2 regulates myofiber growth under diverse physiological circumstances or specifically during muscle regeneration is not clear. Muscle regeneration involves the replacement of necrotic myofibers via de novo myofiber formation and involves a robust inflammatory response [121]. Because myonuclei within existing myofibers are postmitotic, myofiber formation and subsequent growth depends on the activation, proliferation, differentiation, and fusion of muscle precursor cells (MPC). MPC, called also satellite cells, lie mainly between the basal lamina and sarcolemma and are quiescent cells that become activated to reenter the cell cycle and proliferate by various growth factors and cytokines produced during muscle growth [122]. In contrast to regeneration, restoration of muscle mass after atrophy involves the growth of existing myofibers. In mice, reloading of muscles that have been atrophied by unweighting typically causes minimal myofiber degeneration despite the occurrence of some myofiber membrane damage and inflammation [123]. Growth of atrophied myofibers not only involves anabolic processes to facilitate myofiber growth but also the reversal of catabolic processes that were induced during the atrophy period [124]. In addition to myonuclear loss, atrophy is also associated with the loss of MPC, and the remaining MPC exhibit impaired proliferation and differentiation [125]. Thus the physiological state of atrophied muscle before reloading is distinct from that of degenerating muscle and may necessitate alternative mechanisms to facilitate regrowth.
It has been demonstrated that treatment with the COX-2 inhibitor SC-236 attenuates myofiber growth in both the soleus and plantaris muscles after atrophy. Moreover, there is evidence for the involvement of COX-2 in myonuclear addition and inflammation during growth in the soleus but not the plantaris, suggesting that multiple mechanisms underlie COX-2 function in muscle growth. Finally, in vitro
evidence suggests that regulation of myonuclear addition by the COX-2 pathway may be attributable to direct regulation of muscle cells.
3.3 SCLEROSTIN - UNLOADING MEDIATOR IN BONE
Sclerostin is a Wnt signaling antagonists. The Wnt signaling pathway has recently been identified as central to the development of disuse osteoporosis [126–130]. Wnt binds to a co-receptor complex involving Frizzled receptor and low-density lipoprotein receptor-related protein (LRP)-5 or LRP- 6, both present on osteoblasts. This binding stabilizes cytoplasmic à-catenin and causes it to translocate to the nucleus. Translocation of alpha-catenin, in turn, activates the transcription of genes that promote osteoblast proliferation, differen- tiation, and function, ultimately resulting in new bone formation. Sclerostin inhibits the Wnt pathway by prevent- ing the formation of the Wnt-Frizzled-LRP5 complex by competitive binding to LRP5 [131, 132]. Mechanical unloading causes upregulation of sclerostin [133] and therefore inhibited bone formation via suppressed osteoblast activity and survival. Animal models clearly demonstrate elevated sclerostin levels in response to mechanical unloading that is reversed with reloading [129] Based on these reports, sclerostin levels are expected to be initially elevated with the withdrawal of mechanical loading after SCI.
3.4 MYOSTATIN - REGULATOR OF MUSCLE CELLS PROLIFERATION AND DIFFERENTIATION
Satellite cells are undifferentiated cells that in physiological conditions lie in a quiescent state in the muscular tissue. Their differentiation is regulated by a family of transcriptional factors called myogenic regulatory factors (MRFs) such as MyoD,
Myf5, myogenin and MRF4. They initiate and coordinate the differentiation of satellite cells to mature muscle cells. Myostatin is a member of TGF superfamily which is mainly expressed in satellite cells. This molecule inhibits MRFs and overall muscle differentiation and growth both in vivo and in vitro [134]. Since muscular hypertrophy is mainly sustained by the activation of local satellite cell after a muscular contraction of certain intensity and duration, [135], the inhibition of the myostatin pathway could be a key target to facilitate muscle growth after physical exercise.
In line with this hypothesis, an animal study of chronic heart failure suggested that cardiac tissue under stress conditions is able to synthetize myostatin, which acts at both peripheral level inducing muscle wasting, and at central level inducing apoptosis and fibrosis of cardiomyocytes. It has been hypothesized that this pathophysiological pathway could actually reduce the circulatory load, thus reducing the energy expenditure of the heart in stress conditions [135]. Interestingly, a physical exercise protocol restored myostatin to physiological levels in both myocardium and skeletal muscles over a period of 4 weeks: this reduction could be due to the direct and indirect effects of exercise on the expression of proinflammatory cytokines [136].
STUDY DESIGN
Phase 1. Development of a new method to collect bioptic samples from skeletal muscle and histological characterization of SCI subjects skeletal muscle
Skeletal muscle biopsy is a minor surgical procedure that has been conducted over several decades for the diagnosis of different neuromuscular pathological conditions. This technique has recently gained popularity also in the research field of age-related muscular modifications and sarcopenia [137] evolving from surgical “open approach” to less invasive techniques, in order to be easier to perform and to be more tolerable for the patient [138].
Skeletal muscle contains several fiber types deeply differing in their chemical
composition and consequently in their twitch properties. It is generally accepted that muscle fiber types can be divided into two main types: slow twitch (type I) and fast twitch (type IIa,b,c) muscle fibers. Slow twitch fibers fire more slowly than fast twitch fibers and can sustain contraction for long periods of time before they fatigue; on the other hand fast twitch fibers generate faster strenght and speed but they fatigue more quickly. These distinctions seem to influence how muscles respond to training and physical activity, and each fiber type is unique in its ability to contract in a certain way [139-141]. On average, human muscles contain an equal percentage of slow and fast twitch fibers, however it has been reported a switch in this ratio in some pathological conditions like chronic neurological diseases and in particular spinal cord injury (SCI) [20,142]. Thus, fiber type discrimination is essential to distinguish between normal and pathological skeletal muscle tissue.
Prostaglandins (PG) are a family of active compounds produced by the ubiquitous cyclooxygenase (COX) enzymes (COX I and II) and elicit an array of tissue-specific
functions [143-145]. There are different types of PG, with prostaglandin E2 (PGE2)
playing a pivotal role in both bone and muscle tissue biology [90,146]. In bone tissue
PGE2 is responsible of bone resorption, while in skeletal muscle, PGE2 produced by
both isoforms of COX [146,147], regulate protein synthesis and degradation after exercise [148-150], along with being involved in muscle tissue injury recovery
[151,152]. PGE2 receptors are classified into four subtypes, Ep1, Ep2, Ep3, and Ep4,
all of which interact with different G-proteins and their subsequent signaling pathways [153,154].
At present time few studies focused on the application of mini-invasive biopsy techniques on skeletal muscle tissue in both normal and pathological conditions. Moreover the possible role of COX and PG in determining muscular modifications after SCI has not been investigated yet.
Phase 2. A possible link between muscle and bone in spinal cord injuried patients: evaluation of serum myostatin and sclerostin levels
Osteoporosis after Spinal Cord Injury (SCI) affects mainly underlesional bones like distal femur and proximal tibia with consequent increased fracture rate at these sites [155-157]. However, despite the severity and the high complication and disability rate, at present time evidences about osteoporosis management after SCI are scarce [158-163].
Both animal and humans models show that unloading is the main determinant of this condition, probably through the Wnt signaling pathway, that has been recently identified as one of the key regulators of mechanical load responses in bone [158, 164-166]. Sclerostin, produced by osteocytes, is a powerful selective inhibitor of Wnt signaling, inducing a reduction of osteoblast activity and proliferation that ultimately result in the loss of bone mass [167]. Recently, Morse et al. found a strong correlation between Bone Mineral Density (BMD) and serum sclerostin in SCI patients, suggesting that sclerostin could be a circulating biomarker that can be used as a complement or as a substitute of Dual X-Ray Absorptiometry (DXA) to assess osteoporosis and to monitor its treatment in chronic SCI patients [167,168].
Pathological muscular modifications in SCI patients are as severe as those at bone level, with an heavy impact on disability and comorbidities [167]. However, compared to bone and osteoporosis, research conducted at muscle tissue level in SCI patients is far from diagnosis, prevention and treatment and the pathophysiological mechanisms underlying these modifications remain still unclear [142]. Recently, the evidence of a biochemical crosstalk between muscle and bone tissue has been postulated, overtaking the previous hypothesis of a simple mechanical correlation between these two tissues [77, 170]. At present time only few studies, and mainly
conducted in vitro, investigated the possible factors involved in the biochemical crosstalk between muscle and bone tissue. These studies, conducted in vitro on myoblast lineage cells (C2C12), gave interesting results about the possible existence of a biunivocal crosstalk between bone and muscle, in which the factors produced by osteocytes could target muscle, and muscle-derived soluble factors could target bone [90]. Whereas on the one hand osteocytes and sclerostin are responsible of the crosstalk between bone and muscle, on the other hand, satellite cells at muscular level could play a role in the opposite way. Myostatin is a powerful inhibitor of overall muscle differentiation and growth both in vivo and in vitro [134]. Since the inhibition of myostatin pathway is a key target to facilitate muscle growth, myostatin could be used as a possible biomarker to monitor the evolution of muscular modifications in SCI patients and, be a potential therapeutical target. However, at present time, serum myostatin levels in SCI patients have not been determined yet.
AIM OF THE STUDY
As previously evidenced, considering the few reports present in literature about mini-invasive biopsies at skeletal muscle level in both normal and pathological conditions, the aim of our study was to describe a mini invasive ultrasound-guided skeletal muscular biopsy technique in complete SCI patients and healthy controls with a tri-axial end-cut needle (Biopince© - Angiotech). Moreover this study focused on
morphological (fiber type discrimination), molecular (COX and EPs gene expression) and practical procedure related aspects (feasibility, complication rate and accuracy).
In the second phase of the study the aim was to assess in a population of chronic SCI patients the serum myostatin concentration, being a possible candidate biomarker of muscular modifications in these patients. Secondarily, assuming the previously described crosstalk between bone and muscle tissue and the key role of osteocytes, a possible correlation between serum myostatin levels, serum sclerostin levels and BMD in these patients has been investigated.
MATERIALS and METHODS
Subjects
28 chronic SCI patients were consecutively enrolled from the Physical and Rehabilitation Unit of the AOU “Maggiore della Carità” in Novara (Italy).
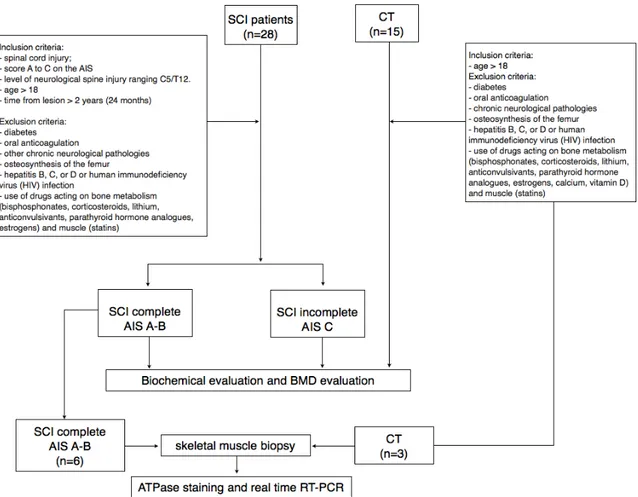
Demographical data are resumed in Table 2. Inclusion criteria were the following: 1) spinal cord injury; 2) a grade from A to C on the American Spinal Injury Association (AIS) Impairment Scale [171,172]; 3) level of neurological spine injury ranging from C5 to T12; 4) age > 18; 5) time from lesion > 2 years (24 months). The exclusion criteria were: diabetes; oral anticoagulation; other chronic neurological pathologies, use of drugs acting on bone metabolism (bisphosphonates, corticosteroids, lithium, anticonvulsivants, parathyroid hormone analogues, estrogens) and muscle (statins). Moreover 15 healthy controls were enrolled and the inclusion criteria were the following: 1) absence of SCI and/or any other neurological pathology; 2) absence of muscolo-skeletal pathologies; 3) absence of any kind of gait impariment; 3) age > 18; 4) abstention from intense physical activity at least in the 24h before serum sample collection. The exclusion criteria were the same as the SCI group.
Among the SCI group, 6 patients were consecutively enrolled to perform a mini-invasive skeletal muscle biopsy. Inclusion criteria were the following: spinal cord injury graded A or B on the AIS scale. Exclusion criteria were: diabetes; oral anticoagulation; osteosynthesis of the femur; and history of hepatitis B, C, or D or human immunodeficiency virus (HIV) infection. Muscle specimens of 3 healthy controls were obtained during knee surgery for cruciate ligament reconstruction in operatory room under sedation. The inclusion criteria for controls were the following:
age > 18. The exclusion criteria were the same as SCI group. Demographic data of these sub-groups are resumed in Table 4.
Written informed consent was obtained from each patient before the biopsy after a full explanation of the procedure which was conducted according to the Declaration of Helsinki guidelines.
Study procedure
All patients at baseline underwent a physical examination by a trained physician and motor impairment was determined using AIS impairment scale [171,172]. According to the AIS score, patients were divided in two groups: complete motor underlesional paraplegic (AIS A,B) and incomplete motor underlesional paraplegic (AIS C).
For SCI patients, the level of disability was measured with the Italian version of the SCIMIII scale [173]. After enrollment all patients underwent blood sample and BMD measurement in the same morning.
Among the SCI complete group, 6 patients performed a skeletal muscle biopsy on separate days from blood sample collection and BMD measurement. A diagram of the study procedure is represented in Figure 2.
Muscle Biopsies
Skeletal muscle samples were obtained using a percutaneous tri-axial end cut needle (Biopince© - Angiotech) of 18-gauge. Biopsies were collected from vastus lateralis muscle at two-third of the distance from trochanter as previously described by Leger et al. [47,174]. Correct needle positioning in the target muscle was confirmed by ultrasound (US) Hitachi - EUB-5500 Digital Ultrasound Scanner©), performed by a
physician with specific experience in muscular sonography with a linear transducer (AL53L - scanning frequence 10 MHz). All biopsies were performed under local anesthesia (lidocaine 1% in 5ml). A single incision was made in the skin, and two different muscle samples were consecutively taken for each patient.
The stroke length of the biopsy was adjusted according to the muscle size considering the presence of blood vessels and other vulnerable structures proximity; 33 mm stroke length was chosen whenever possible. All specimen were immediately frozen in liquid nitrogen until use.
Data about procedure related complications, easiness of needle US imaging and any other technical issue have been recorded by the operator.
ATPase staining
Frozen sections of 10 µm thick were cut at -20°C and stored at -20°C until staining procedure. Fiber types were determined by the differential staining resulting from incubation at pH 9.6. This staining allows to distinguish type I fiber from type II. Samples were incubated with 0.5 mg/mL ATP dissolved in 0.1M glycine/ 0.1M NaCl buffer with 0.75M CaCl2, for 11 minutes at 37 °C. Samples were then rinsed well in distilled water and incubated for 5 minutes at room temperature with 2% CoCl2. Samples were extensively washed in both distilled and tap water. Specimens were then incubated for 30s in 2% ammonium sulphide solution, rinsed well in tap water and observed with an optical microscope (Leica DMIL, Leica Microsystems Wetzlar GmbH, Wetzlar, Germany).
Real-time reverse transcription-polymerase chain reaction (real time RT-PCR)
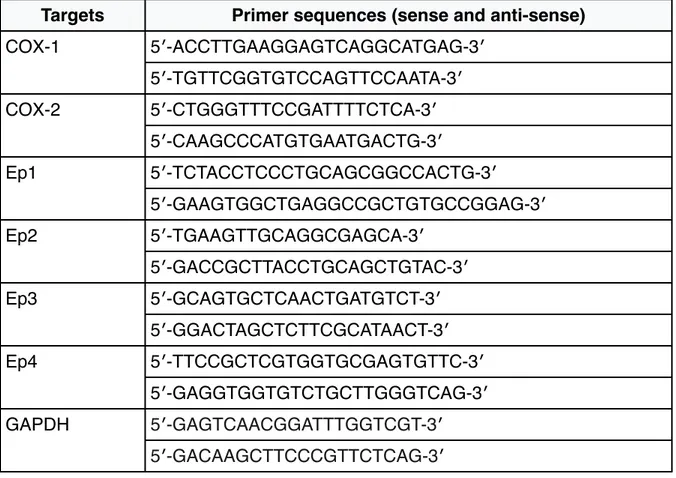
Total RNA was isolated from the tissue specimen using the Ribozol RNA extraction reagent (Amresco). The mRNA was converted into complementary DNA (cDNA) using the high capacity cDNA reverse transcription kit (Applied Biosystems). The cDNA mixtures were subjected to real-time PCR using SYBR® Green I dye. The reactions were performed using primer sequences (sense and anti-sense), as shown in Table 5. All real-time PCR reactions were performed in triplicate using a Biorad CFX96 instrument; the gene expression levels were normalized using GAPDH as housekeeping gene and gene expression was calculated as 2^-ΔCt, where ΔCt= Ct gene - Ct housekeeping [175].
Biochemical markers and BMD
Blood samples were performed at the same hour in the morning in fasting conditions. The samples were centrifuged for 15 min at 3000 rpm at 4 °C and stored at -80 °C until final analysis.
Serum calcium, phosphate, and creatinine were measured with the Technicon Autoanalyzer SMA-12/60 (Technicon Instruments Corp., Torrytown, NY, USA). Plasma ionized calcium was measured by StatProfile M Nova (Milan, Italy); serum immuno- reactive 1–84 PTH was measured using a Nichols kit (Nichols Institute, San Juan Capistrano, CA, USA). 25 hydroxy Vitamin D (25(OH)D) was assessed with the IDS ϒ-B 25-hydroxy Vitamin D kit (Immuno- diagnostic Systems Ltd, Boldon, UK; intra-assay coefficient of variation (CV) 6.9%, interassay CV 9%, normal range 75– 300 nmol/l). The other biochemical evaluations were performed by the Biochemical Analysis Lab of our Hospital.
Myostatin was measured with Elisa kit (MyBioSource, MBS703668), normal range 0.625-20 ng/ml; minimum detectable dose less than 0.312 ng/ml. Serum sclerostin was measured with SOST Elisa Kit Biomedica Gruppe (Vienna, Austria), with a standard range of 0-240 pmol/L, a detection limit of 2.6 pmol/l and a unit conversion of 1 pg/ml = 0.044 pmol/L.
BMD of patients and healthy controls was measured with calcaneus ultrasonography (Achilles Express© 2001 GE Medical System, Lunar Corporation – Madison, Wisconsin, USA), and data about t-score and stiffness were obtained.
Statistical Analysis
Statistical analyses were performed using the GraphPad 4 package, version 4.0 (GraphPad Software, Inc., San Diego, CA, USA). Due to the low numerosity of the sample we assumed a non-gaussian distribution of the variables taken in consideration. After enrollment patients were divided in two sub-group depending on the AIS score: complete and incomplete. Differences between single variables in different groups were evaluated with the Mann–Whitney U test. Between-group comparisons for 25(OH)D insufficiency prevalence were done using the Fisher’s
exact test. A type I error level of 0.05 was chosen. Relationships between serum
myostatin values and the other variables taken in exam were analyzed with linear regression using Pearson’s correlation coefficients. Regression lines were compared using confidence intervals. A p value lower than 0.05 was considered statistically significant.
RESULTS
Biochemical and BMD evaluation
Demographic characteristics of SCI and control group are resumed in Table 2. SCI group showed statistically significant differences regarding smoke, age and history of previous fractures at any site compared to healthy controls while all the other demographical variables showed no statistical difference.
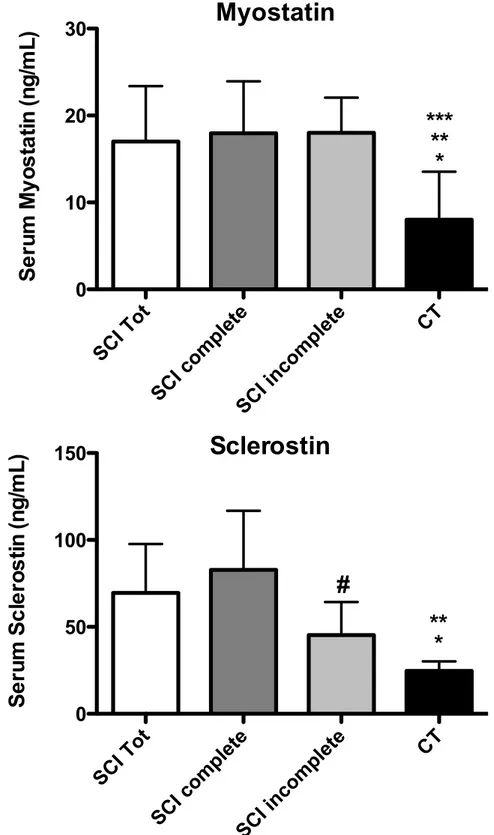
Serum myostatin levels were statistically higher in SCI group compared to healthy controls (Fig. 3). Similar results were found comparing the complete SCI sub-group and the incomplete SCI sub-group to healthy controls (Fig. 3).
Serum sclerostin was significantly higher in SCI patients compared to healthy controls (Fig. 3).
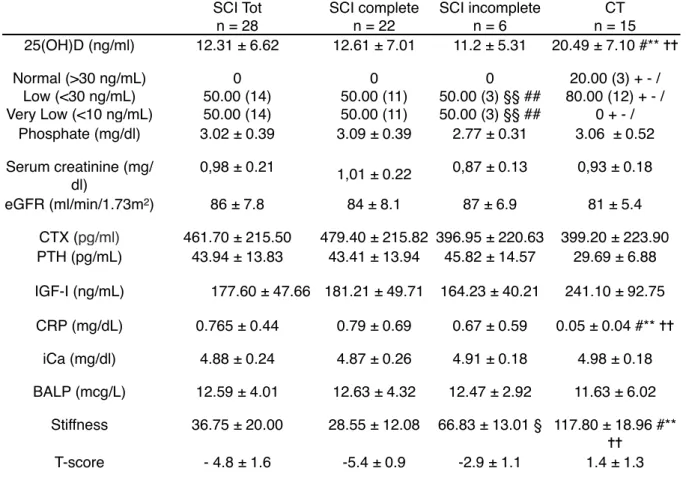
Regarding other biochemical variables, PTH and PCR serum values showed statistically significant differences between the two groups (Table 3). However the mean values in both groups were in the normality range. 25(OH)D serum levels were significantly higher in healthy controls compared to SCI group. However the mean value in the control group was far from normality level and only 20% of healthy controls showed values of 25(OH)D higher than 30 ng/ml. On the contrary 50% of SCI patients showed 25(OH)D values < 10ng/ml.
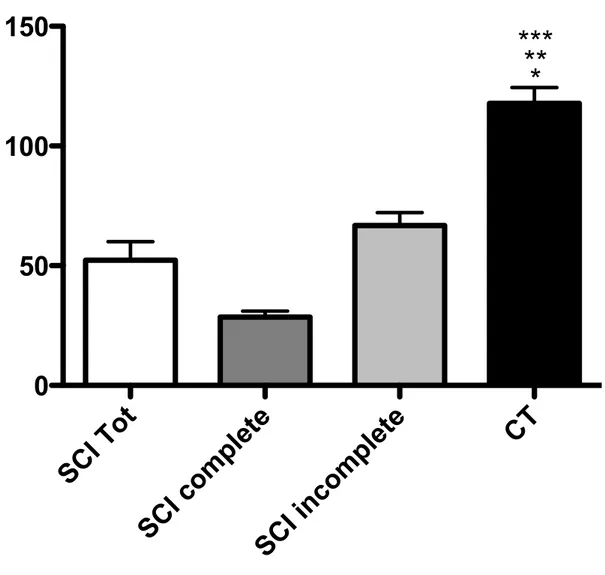
Regarding BMD, stifness and mean T-score values in SCI patients were significantly lower than healthy controls in both total SCI group and each subgroup (complete/ incomplete). Interestingly there was also a statistically significant difference between the complete and incomplete subgroup regarding these two variables (Fig. 4).
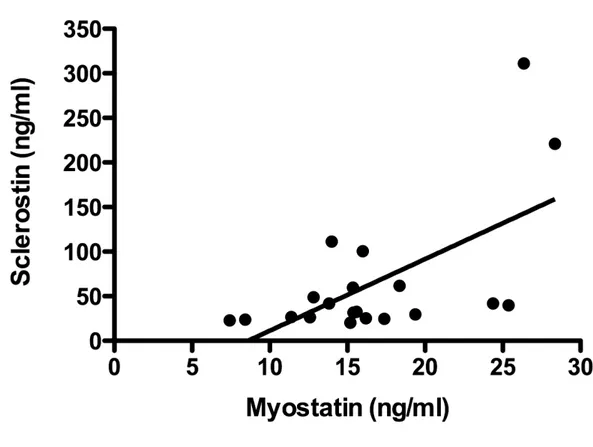
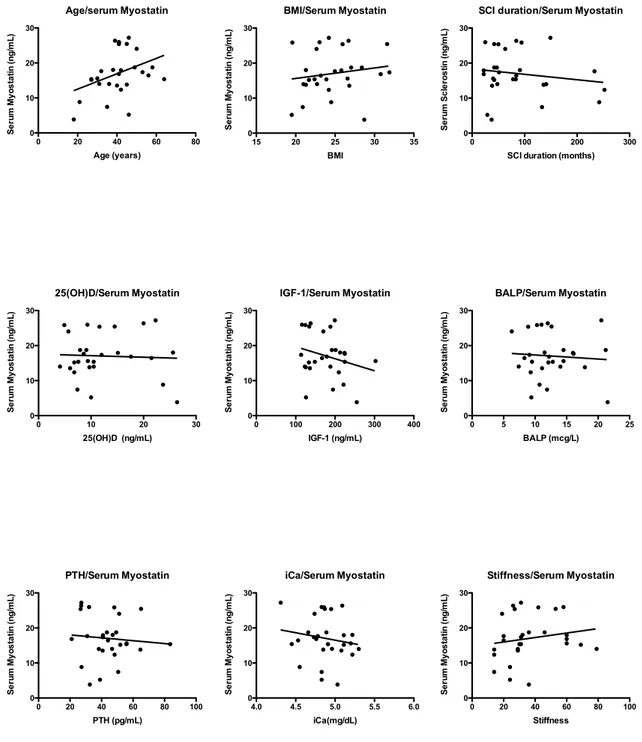
Serum myostatin concentrations in the complete SCI subgroups correlated only with serum sclerostin levels (r2 = 0.42; p=0.0012) (Fig. 5) and with none of the other variables taken in consideration (Fig. 6).
Table 2 - Subjects characteristics at enrollment. SCI n = 28 CT n = 15 Age (years) 40.5 ± 7.07 28.37 ± 4.07 Sex % (F/M) 17.86/82.14 (5/23) 66.67/33.33 (10/5) Body Mass Index (BMI) 24.68 ± 3.44 22.76 ± 2.09
Smoke (Y/N) 35.71/64.29 (10/18) 0/100 (0/15) Injury Severity - ASIA score A 18
B 4 C 6 --Complete/incomplete 78.57/21.43 (22/6) --Wheelchair use 78.57 (22) --Etiology traumatic 75.00 (21) --non-traumatic 25.00 (7)
--Duration of SCI (months) 90.82 ± 53.11 --Lesion Level Paraplegia 85.71
(24) D1-D12 75.00 (18) D12-L5 25.00 (6) Tetraplegia 14.29 (4) --I-SCIMIII score 72.78 ± 10.32
--Fractures (any site) 11 0
SCI: spinal cord injury group; CT: healthy control group; I-SCIMIII: 3rd italian version of the spinal cord independence measure; AIS: American Spinal Injury Association Impairment Scale. Data are presented as mean ± standard deviation (SD) or percentage. * p < 0.05
Table 3 - Biochemical and BMD variables between groups SCI Tot n = 28 SCI complete n = 22 SCI incomplete n = 6 CT n = 15 25(OH)D (ng/ml) 12.31 ± 6.62 12.61 ± 7.01 11.2 ± 5.31 20.49 ± 7.10 #** ✝✝ Normal (>30 ng/mL) Low (<30 ng/mL) Very Low (<10 ng/mL) 0 50.00 (14) 50.00 (14) 0 50.00 (11) 50.00 (11) 0 50.00 (3) §§ ## 50.00 (3) §§ ## 20.00 (3) + - / 80.00 (12) + - / 0 + - / Phosphate (mg/dl) 3.02 ± 0.39 3.09 ± 0.39 2.77 ± 0.31 3.06 ± 0.52 Serum creatinine (mg/ dl) 0,98 ± 0.21 1,01 ± 0.22 0,87 ± 0.13 0,93 ± 0.18 eGFR (ml/min/1.73m2) 86 ± 7.8 84 ± 8.1 87 ± 6.9 81 ± 5.4 CTX (pg/ml) 461.70 ± 215.50 479.40 ± 215.82 396.95 ± 220.63 399.20 ± 223.90 PTH (pg/mL) 43.94 ± 13.83 43.41 ± 13.94 45.82 ± 14.57 29.69 ± 6.88 IGF-I (ng/mL) 177.60 ± 47.66 181.21 ± 49.71 164.23 ± 40.21 241.10 ± 92.75 CRP (mg/dL) 0.765 ± 0.44 0.79 ± 0.69 0.67 ± 0.59 0.05 ± 0.04 #** ✝✝ iCa (mg/dl) 4.88 ± 0.24 4.87 ± 0.26 4.91 ± 0.18 4.98 ± 0.18 BALP (mcg/L) 12.59 ± 4.01 12.63 ± 4.32 12.47 ± 2.92 11.63 ± 6.02 Stiffness 36.75 ± 20.00 28.55 ± 12.08 66.83 ± 13.01 § 117.80 ± 18.96 #** ✝✝ T-score - 4.8 ± 1.6 -5.4 ± 0.9 -2.9 ± 1.1 1.4 ± 1.3
SCI: Spinal Cord Injury; CT: controls; 25(OH)D: 25 hydroxy vitamin D; eGFR: estimated glomerular filtration rate; PTH: parathyroid hormone; CTX: Serum beta crosslaps; IGF-I: Insulin Growth Factor I; CRP: C reactive protein; iCa: ionized Calcium; BALP: Bone Alkaline Phosphatase. Data are presented as mean ± standard deviation (SD).
*p < 0.05 Mann Whitney U test SCI Tot vs. SCI complete ✝ p < 0.05 Mann Whitney U test SCI Tot vs. SCI incomplete # p < 0.05 Mann Whitney U test SCI Tot vs. CT
§ p < 0.05 Mann Whitney U test SCI complete vs. SCI incomplete ** p < 0.05 Mann Whitney U test SCI complete vs. CT
✝✝ p < 0.05 Mann Whitney U test SCI incomplete vs. CT §§ p < 0.05 Fisher’s exact test SCI Tot vs. SCI incomplete ## p < 0.05 Fisher’s exact test SCI complete vs. SCI incomplete + p < 0.05 Fisher’s exact test SCI Tot vs. CT
- p < 0.05 Fisher’s exact test SCI complete vs. CT / p < 0.05 Fisher’s exact test SCI incomplete vs. CT
Figure 3 - Differences between serum sclerostin and Myostatin in all groups. data are presented as mean ± standard deviation (SD).* p < 0.05 SCI Tot vs. CT; ** p < 0.05 SCI complete vs. CT; *** p < 0.05 SCI incomplete vs. CT; # p < 0.05 SCI complete vs. SCI incomplete.
Myostatin
SCI Tot SCI complete SCI incomplete CT 0 10 20 30S
e
ru
m
M
y
o
s
ta
tin
(n
g
/m
L
)
Sclerostin
SCI Tot SCI complete SCI incomplete CT 0 50 100 150S
e
ru
m
S
c
le
ro
s
tin
(n
g
/m
L
)
*
**
***
*
**
#
Figure 4 - Stiffness values in SCI sub-groups and CT. * p < 0.05 SCI Tot vs. CT; ** p < 0.05 SCI complete vs. CT; *** p < 0.05 SCI incomplete vs. CT.
Stiffness
SCI Tot
SCI complete
SCI incomplete
CT
0
50
100
150
*
***
**
Figure 5 - Correlation between serum Myostatin and serum Sclerostin levels. r2 = 0.42; p=0.0012
Figure 6 - Correlations between serum myostatin and other study variables. Age/serum Myostatin 0 20 40 60 80 0 10 20 30 Age (years) S e ru m M y o s ta tin (n g /m L ) 25(OH)D/Serum Myostatin 0 10 20 30 0 10 20 30 25(OH)D (ng/mL) S e ru m M y o s ta tin (n g /m L ) PTH/Serum Myostatin 0 20 40 60 80 100 0 10 20 30 PTH (pg/mL) S e ru m M y o s ta tin (n g /m L ) BMI/Serum Myostatin 15 20 25 30 35 0 10 20 30 BMI S e ru m M y o s ta tin (n g /m L ) IGF-1/Serum Myostatin 0 100 200 300 400 0 10 20 30 IGF-1 (ng/mL) S e ru m M y o s ta tin (n g /m L ) iCa/Serum Myostatin 4.0 4.5 5.0 5.5 6.0 0 10 20 30 iCa(mg/dL) S e ru m M y o s ta tin (n g /m L ) Stiffness/Serum Myostatin 0 20 40 60 80 100 0 10 20 30 Stiffness S e ru m M y o s ta tin (n g /m L ) BALP/Serum Myostatin 0 5 10 15 20 25 0 10 20 30 BALP (mcg/L) S e ru m M y o s ta tin (n g /m L )
SCI duration/Serum Myostatin
0 100 200 300
0 10 20 30
SCI duration (months)
S e ru m S c le ro s tin (n g /m L )
Muscle Biopsies
A total of 18 specimens were collected (12 from SCI and 6 from healthy controls). Sub-group demographical characteristics are resumed in Table 4.
All the procedures were performed easily without failures and in all cases the specimen was easily removed. Visibility of the needle was good at ultrasound and required in 5 cases only a correction of the angle of the needle to visualize it; however in no case had a biopsy to be abandoned because of insufficient visibility of the needle. There were no cases of inadequate/insufficient material collection, however SCI specimen were macroscopically thinner and brittler compared to those of healthy subjects.
Complications were observed in 40% of the procedures. They were all self-limiting small hemorrages requiring no treatment.
ATPase stained specimen are represented in Fig. 7. Real Time RT-PCR results are shown in Fig. 8.
Preliminary molecular results about COX-1,2 and EP1,2,3,4 expression showed a significantly lower expression of COX-1 in SCI patients compared to healthy controls. A difference was present also regarding EP2 expression, even if not significant (Fig. 8).
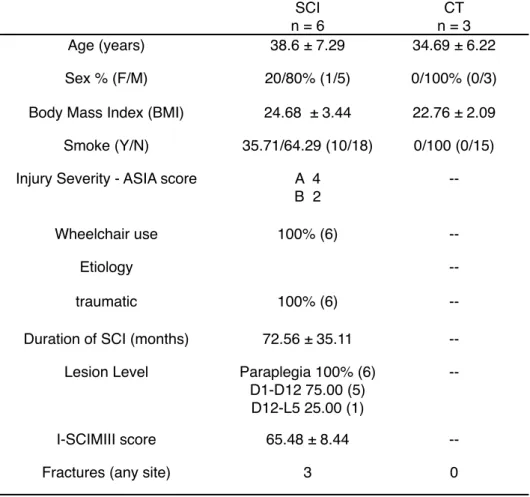
Table 4 - Demographical data of SCI patients (SCI) and healthy controls (CT) underwent muscle biopsy.
SCI n = 6 CT n = 3 Age (years) 38.6 ± 7.29 34.69 ± 6.22 Sex % (F/M) 20/80% (1/5) 0/100% (0/3) Body Mass Index (BMI) 24.68 ± 3.44 22.76 ± 2.09 Smoke (Y/N) 35.71/64.29 (10/18) 0/100 (0/15) Injury Severity - ASIA score A 4
B 2
--Wheelchair use 100% (6)
--Etiology
--traumatic 100% (6)
--Duration of SCI (months) 72.56 ± 35.11 --Lesion Level Paraplegia 100% (6)
D1-D12 75.00 (5) D12-L5 25.00 (1)
--I-SCIMIII score 65.48 ± 8.44
Table 5 - Primers for real time RT-PCR analysis by using the SYBR® Green dye.
Targets Primer sequences (sense and anti-sense)
COX-1 5′-ACCTTGAAGGAGTCAGGCATGAG-3′ COX-1 5′-TGTTCGGTGTCCAGTTCCAATA-3′ COX-2 5′-CTGGGTTTCCGATTTTCTCA-3′ COX-2 5′-CAAGCCCATGTGAATGACTG-3′ Ep1 5′-TCTACCTCCCTGCAGCGGCCACTG-3′ Ep1 5′-GAAGTGGCTGAGGCCGCTGTGCCGGAG-3′ Ep2 5′-TGAAGTTGCAGGCGAGCA-3′ Ep2 5′-GACCGCTTACCTGCAGCTGTAC-3′ Ep3 5′-GCAGTGCTCAACTGATGTCT-3′ Ep3 5′-GGACTAGCTCTTCGCATAACT-3′ Ep4 5′-TTCCGCTCGTGGTGCGAGTGTTC-3′ Ep4 5′-GAGGTGGTGTCTGCTTGGGTCAG-3′ GAPDH 5′-GAGTCAACGGATTTGGTCGT-3′ GAPDH 5′-GACAAGCTTCCCGTTCTCAG-3′
Figure 7 - Atpase staining of an healthy control (A) and a SCI patient (B). Type I fiber stain light and Type II fiber stain dark. Magnification 10x.
Figure 8 - RT-PCR of COX-1 in SCI and CT. * p < 0.05 SCI vs. CT