PoS(ICRC2015)592
of high energy electrons based on beam test results
Gabriele Bigongiari∗
University of Siena
E-mail:[email protected]
CALET is a space mission currently in the final phase of preparation for a launch to the Inter-national Space Station (ISS), where it will be installed on the Exposure Facility of the Japanese Experiment Module (JEM-EF). One of the main science goals of the experiment is the measure-ment of the inclusive electron (+positron) spectrum. By integrating a sufficient exposure on the ISS, CALET will be able to explore the energy region above 1 TeV, where the presence of nearby sources of acceleration is expected to shape the high end of the electron spectrum and leave faint, but detectable, footprints in the anisotropy. In order to meet this experimental goal, CALET has been designed to achieve a large proton rejection capability (>105) thanks to a full containment of electromagnetic showers in a 27 X0thick calorimeter (TASC) preceded by a 3 X0fine-grained
pre-shower calorimeter (IMC) with imaging capabilities. In this paper the expected performance of the instrument with electrons will be discussed on the basis of the results of measurements performed during beam calibration tests at CERN-SPS at beam energies up to 290 GeV.
The 34th International Cosmic Ray Conference, 30 July- 6 August, 2015
The Hague, The Netherlands
of the e.m. showers in the calorimeter at these energies and a detailed imaging of the first 3 radia-tion length.
The precise measurement of the line shape of any spectral feature is expected to play a crucial role in the discrimination among different models of dark matter candidates, or it might suggest an alternative astrophysical interpretation.
CALET will also monitor gamma ray transients with a dedicated Gamma-ray Burst Monitor (CGBM) and study solar modulation.
Equipped with a charge identifier module, placed at the top of the apparatus, and capable to identify the atomic number Z of the incoming cosmic ray, CALET will perform long exposure observations of cosmic nuclei from proton to iron and will detect trans-iron elements with a dynamic range up to Z=40. It will extend, by one order of magnitude in energy, the present measurements of the ratio of secondary to primary elements (e.g.: boron/carbon and sub-iron/iron), thereby providing information about the energy dependence of cosmic-ray propagation in the galaxy.
In this paper, we report on a dedicated beam test measurement that took place at CERN in 2012 to assess the performance of the calorimeter system with electrons at beam energies up to 290 GeV using an engineering model with similar readout and sensors to CALET Flight Model.
2. CALET instrument
CALET is an all-calorimetric instrument, with a total thickness of 30 radiation length (X0)
and 1.3 proton interaction length (λI), preceded by a particle identification system. The energy
measurement relies on two kinds of calorimeters: a fine grained pre-shower, known as imaging calorimeter (IMC), followed by a total absorption calorimeter (TASC). The effective geometrical factor of CALET for high energy electrons is '1200 cm2sr. The total weight of the system will be approximately 650 kg.
The schematic structure of the whole instrument with the main sub-detectors can be seen in Fig.1.
The Gamma-ray Burst Monitor is described elsewhere [1].
In order to identify individual chemical elements in the cosmic-ray flux, a Charge Detector (CHD) is positioned at the top of the CALET instrument to provide a measurement of the electric charge
PoS(ICRC2015)592
Figure 1: a schematic side view of the CALET instrument.
segmented, plastic scintillator array. Each scintillator is 32mm wide, 450mm long and 10mm thick. The CHD and related front-end electronics are designed to provide incident particle identification over a large dynamic range for charges from Z=1 to Z=40 with sufficient charge resolution [2,3] to resolve individual elements (' 0.15e for light elements and ' 0.3e in the Fe region and above).
The IMC images the early shower profile with a fine granularity by using 1 mm2scintillating
fibers individually readout by multi-anode photomultipliers (MAPMT). It consists of 7 layers of tungsten plates, each separated by 2 layers of scintillating fibers (SciFi) with square cross section, arranged in belts along the x and y direction and is capped by an additional x,y SciFi layer pair. The transverse dimensions of the IMC are approximately 45 cm by 45 cm. The total thickness
of the IMC is equivalent to 3 X0. The first 5 tungsten-SciFi layers sample the shower every 0.2
X0 while the following 2 layers provide 1.0 X0 sampling. The IMC is designed to: (i) separate
the incident particles; (ii) determine the starting point of the shower; (iii) reconstruct the incident particle trajectory, and (iv) provide a coarse measurement of the particle’s charge. The readout of the SciFi layers consists of multianode photomultiplier tubes with 64 anodes.
The TASC measures the total energy of the incident particle and discriminates electrons and gamma-rays from hadrons. The calorimeter is composed of 12 layers of Lead Tungstate (PWO) "logs", each with dimensions 20mm(H) × 19mm(W) × 326mm(L). Alternate layers are oriented perpendicular to each other to provide x,y coordinates of the shower core. The total area of the
TASC is about 1,024 cm2 and the total thickness is about 27 X0 at normal incidence. A
proton-rejection power better than 105 is necessary for observing electrons up to 10 TeV. This goal is
achieved with the combined information from IMC and TASC. On the other hand, the largest signal
(in MIP units) in one log is approximately 105for electrons of 10 TeV and 106 MIPs for protons
of 1000 TeV. Therefore, the readout system for the TASC should have a dynamic range from 0.5 to
106MIPs [4]. To measure the energy deposit in this range with six orders of magnitude, a Silicon
CALET engineering model to check the calibration method and the performance of the instrument with electrons. The energy calibration of the TASC was performed using Minimum Ionizing Par-ticles (MIPs). The TASC was exposed to a beam of 150 GeV muons at normal incidence on the calorimeter surface [5].
Figure 2: Distribution of PWO signals from a 150 GeV muon beam; the black curve is the result of the fit to a Landau distribution convoluted with a Gaussian.
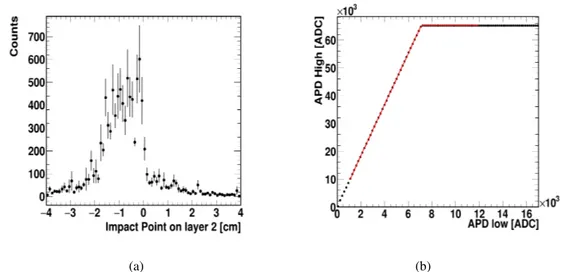
The mean pedestal value of every TASC channel was calculated and subtracted and pulse height spectra were plotted. In order remove unwanted background contributions from nearby crystals, we selected only events in which the MIP trajectory crosses the PWO log of interest. We used the IMC tracking power to select particles crossing each PWO crystal (an example for layer #2 is given in fig.3(a)). A typical distribution of the deposited energy by a 150 GeV muon is
shown in figure2and fitted to a Landau
distribu-tion convoluted with a Gaussian and shown (black line) in the same picture. From the fit procedure we derived the most probable value (MPV) of the energy deposit in each channel.
Normalizing each PWO log to the signal value corresponding to the MPV, all the detector channels were equalized and calibrated. In order to verify the TASC response with electrons it was necessary to assign for each channel the appropriate readout scale by choosing between the HIGH and LOW APD signals on an event by event basis.
The correlation between HIGH and LOW APD range signals, for one TASC log, is shown in
figure 3(b); it can be noticed that the HIGH range saturates for signals above ∼ 64 × 103 ADC.
HIGH and LOW scales were then inter-calibrated, i.e. for each APD sensor a High gain vs Low gain plot was built and fit to a breakline function. This was used to rescale the low-range signal whenever the corresponding high-range signal started deviating from linearity.
PoS(ICRC2015)592
(a) (b)
Figure 3: (a) a PWO log signal as a function of particle impact point in a direction transverse to the beam; (b) correlation plot between APD High gain and Low gain.
Beam Energy [GeV]
0 100 200 300
Energy Deposit [mip]
0 5 10 3 10 × p0 −69.87 ± 3.461 p1 42.17 ± 0.04128 p0 −69.87 ± 3.461 p1 42.17 ± 0.04128 (a)
Beam Energy [GeV]
0 100 200 300 0.1 − 0.08 − 0.06 − 0.04 − 0.02 − 0 0.02 0.04 0.06 0.08 0.1 (b)
Figure 4: (a) linearity curve of the TASC with electrons; (b) residuals versus nominal beam energy.
4. TASC response to electrons
The TASC calorimeter was tested with electron beams at different energies (10, 20, 30, 50, 80, 100, 150, 200, 250 and 290 GeV) impinging in the middle of its upper surface. The total deposited energy was calculated, event by event, by summing the signals of all logs above a threshold equal to 20% of 1 MIP signal to cut off the electronic noise contribution. In figure4(a) the mean energy deposit in the TASC is shown as a function of the nominal beam energy. The experimental data
were fitted to a linear function. In figure4(b) the residuals between data and the linear curve from
Beam Energy [GeV] 0 100 200 300 Energy Resolution 0 0.05 0.1 0.15 / ndf 2 χ 4.991 / 6 Prob 0.5449 p0 0.01539 ± 0.0009263 p1 0.1358 ± 0.02047 p2 0.8176 ± 0.08013 / ndf 2 χ 4.991 / 6 Prob 0.5449 p0 0.01539 ± 0.0009263 p1 0.1358 ± 0.02047 p2 0.8176 ± 0.08013
Figure 5: energy resolution for electrons from 10 to 290 GeV.
where the P0-term (constant) represents the contributions due to finite size of calorimeter and
to non-uniformities of the detector, the P1-term represents the photo-statistics contribution (∼√1E)
and the P2-term represents the electronic noise contribution (∼ E1). From the fit we obtained
P2=(81±8)%, P1=(13±2)% and P0=(1.5±0.1)%. The high value of the P2-term id probably due
to the low signal to noise ratio (∼ 1) for MIP energy deposits from the APD sensors mounted on the prototype used for the test.
5. Summary
The calorimeter apparatus of CALET was successfully tested at CERN with electrons con-firming the expected performances from MonteCarlo simulations. The TASC prototype showed a
PoS(ICRC2015)592
good resolution in energy with an asymptotic value of ∼ 1.5%. The analysis results demonstratesthat the calibration method, based on MIP signals (in this case with muons), is well undestood and it can be adopt on orbit for CALET flight model. The CALET mission is scheduled to be launched on August 16thfrom the Tanegashima Space Center (Japan).
References
[1] K.Yamaoka et al.: Proc. of the 32nd Int.Cosmic Ray Conference (2011) [2] Y. Shimizu et al.: Proc. of the 32nd Int.Cosmic Ray Conference (2011) [3] P.S.Marrocchesi et al.: Nucl. Instrum. Meth. A 659 477 (2011)
[4] I.Dai jito et al.: Proceedings of the 32thICRC (2011)